A New 100-GHz Band Two-Beam Sideband-Separating SIS ...lib_pub/report/data/no683.pdf · A New...
15
A New 100-GHz Band Two-Beam Sideband-Separating SIS Receiver for Z-Machine on the NRO 45-m Radio Telescope T. Nakajima 1 Nobeyama Radio Observatory, National Astronomical Observatory of Japan, 462-2 Nobeyama, Minamimaki, Minamisaku, Nagano 384-1305, Japan [email protected] K. Kimura and A. Nishimura Department of Physical Science, Graduate School of Science, Osaka Prefecture University, 1-1 Gakuen-cho, Naka-ku, Sakai, Osaka 599-8531, Japan H. Iwashita and C. Miyazawa Nobeyama Radio Observatory, National Astronomical Observatory of Japan, 462-2 Nobeyama, Minamimaki, Minamisaku, Nagano 384-1305, Japan T. Sakai Institute of Astronomy, The University of Tokyo 2-21-1 Osawa, Mitaka, Tokyo 181-0015, Japan D. Iono Nobeyama Radio Observatory, National Astronomical Observatory of Japan, 462-2 Nobeyama, Minamimaki, Minamisaku, Nagano 384-1305, Japan K. Kohno Institute of Astronomy, The University of Tokyo 2-21-1 Osawa, Mitaka, Tokyo 181-0015, Japan R. Kawabe and N. Kuno Nobeyama Radio Observatory, National Astronomical Observatory of Japan, 462-2 Nobeyama, Minamimaki, Minamisaku, Nagano 384-1305, Japan H. Ogawa Department of Physical Science, Graduate School of Science, Osaka Prefecture University, 1-1 Gakuen-cho, Naka-ku, Sakai, Osaka 599-8531, Japan S. Asayama Chile Observatory, National Astronomical Observatory of Japan, 2-21-1 Osawa, Mitaka, Tokyo 181-8588, Japan 1
Transcript of A New 100-GHz Band Two-Beam Sideband-Separating SIS ...lib_pub/report/data/no683.pdf · A New...

A New 100-GHz Band Two-Beam Sideband-Separating SISReceiver for Z-Machine on the NRO 45-m Radio Telescope
T. Nakajima1
Nobeyama Radio Observatory, National Astronomical Observatory of Japan,462-2 Nobeyama, Minamimaki, Minamisaku, Nagano 384-1305, Japan
K. Kimura and A. NishimuraDepartment of Physical Science, Graduate School of Science, Osaka Prefecture University,
1-1 Gakuen-cho, Naka-ku, Sakai, Osaka 599-8531, Japan
H. Iwashita and C. MiyazawaNobeyama Radio Observatory, National Astronomical Observatory of Japan,
462-2 Nobeyama, Minamimaki, Minamisaku, Nagano 384-1305, Japan
T. SakaiInstitute of Astronomy, The University of Tokyo2-21-1 Osawa, Mitaka, Tokyo 181-0015, Japan
D. IonoNobeyama Radio Observatory, National Astronomical Observatory of Japan,
462-2 Nobeyama, Minamimaki, Minamisaku, Nagano 384-1305, Japan
K. KohnoInstitute of Astronomy, The University of Tokyo2-21-1 Osawa, Mitaka, Tokyo 181-0015, Japan
R. Kawabe and N. KunoNobeyama Radio Observatory, National Astronomical Observatory of Japan,
462-2 Nobeyama, Minamimaki, Minamisaku, Nagano 384-1305, Japan
H. OgawaDepartment of Physical Science, Graduate School of Science, Osaka Prefecture University,
1-1 Gakuen-cho, Naka-ku, Sakai, Osaka 599-8531, Japan
S. AsayamaChile Observatory, National Astronomical Observatory of Japan,
2-21-1 Osawa, Mitaka, Tokyo 181-8588, Japan
1

and
T. Tamura and T. NoguchiAdvanced Technology Center, National Astronomical Observatory of Japan,
2-21-1 Osawa, Mitaka, Tokyo 181-8588, Japan
ABSTRACT
We have developed a two-beam waveguide-type dual-polarization sideband-separating SISreceiver system in the 100-GHz band for z-machine on the 45-m radio telescope at the NobeyamaRadio Observatory. The receiver is intended for astronomical use in searching for highly redshiftedspectral lines from galaxies of unknown redshift. This receiver has two beams, which have 45′′ ofbeam separation and allow for observation with the switch in the on-on position. The receiverof each beam is composed of an ortho-mode transducer and two sideband-separating SIS mixers,which are both based on a waveguide technique, and the receiver has four intermediate frequencybands of 4.0–8.0 GHz. Over the radio frequency range of 80–116 GHz, the single-sideband receivernoise temperature is lower than about 50 K, and the image rejection ratios are greater than 10dB in most of the same frequency range. The new receiver system has been installed in thetelescope, and we successfully observed a 12CO (J=3–2) emission line toward a cloverleaf quasarat z = 2.56, which validates the performance of the receiver system. The SSB noise temperatureof the system, including the atmosphere, is typically 150–300 K at a radio frequency of 97 GHz.We have begun blind search of high-J CO toward high-z submillimeter galaxies.
Subject headings: Astronomical Instrumentation
1. Introduction
Over the last 15 years or so, the advent oflarge-format focal plane arrays of millimeter andsubmillimeter bolometer detectors has opened thewindow for the viewing of distant star-forminggalaxies. For instance, bolometer arrays includ-ing the submillimeter common-user bolometer ar-ray (SCUBA; Holland et al. 1999) on the JamesClerk Maxwell Telescope (JCMT), a bolometriccamera (Bolocam; Glenn et al. 1998) on the Cal-tech Submillimeter Observatory (CSO), the Max-Planck millimeter bolometer (MANBO; Kreysaet al. 1998) on the IRAM 30-m telescope, thelarge APEX bolometer camera (LABOCA; Siringoet al. 2009) on the Atacama pathfinder experi-ment (APEX), AzTEC (Wilson et al. 2008) onthe JCMT and the Atacama submillimeter tele-scope experiment (ASTE), and the 960-elementbolometric receiver (Shirokoff et al. 2009) on the
1Present address : Solar-Terrestrial Environment Laboratory, Nagoya University, Furo-cho, Chikusa-ku, Nagoya, Aichi 464-8601, Japan, [email protected]
South Pole Telescope (SPT) have been used toconduct deep millimeter and submillimeter-wavesurveys toward blank and biased fields (e.g., Bo-rys et al. 2003; Coppin et al. 2006; Pope et al.2006, Greve et al. 2004, 2008; Laurent et al. 2005;Bertoldi et al. 2007; Scott et al. 2008; Perera etal.2008; Austermann et al. 2010; Tamura et al.2009; Weiβ et al. 2009b; Scott et al. 2010; Vieiraet al. 2010; Aretxaga et al. 2011; Hatsukade et al.2011), yielding > thousand detections of millime-ter/submillimeter selected galaxies (SMGs; e.g.,Blain et al. 2002). Some of the uncovered SMGs,such as radio-identified SMGs (e.g., Ivison et al.2007) were followed up by means of optical spec-troscopy, revealing that these SMGs are locatedat z = 2–3 (e.g., Chapman et al. 2003; 2005).However, about 70 % of the bright SMGs tendto be dark in the optical wavelength because it isburied in dust (Iono et al. 2006, Younger et al.2007; 2009, Hatsukade et al. 2010, Tamura et al.2010), and it is difficult to perform spectroscopicobservation in the optical and near-infrared wave-
2
length. Therefore, our plan was to determine theredshift distribution of SMGs using a millimeterwavelength that is not susceptible to dust extinc-tion using a z-machine. In general, z-machine isused to observations of high-z objects because it iscomposed of a wide bandwidth detector and spec-trometer. These systems are the key instrumentsused in the accurate determination of the redshiftsof these SMGs. Given the fact that any of the linesin the CO ladder can appear at a particular fre-quency, the measurement of a single line is notsufficient to determine the redshift of an object,so at least two lines must be observed in order tomake an unambiguous estimate.
To date, several concepts for a “z-machine”have been developed and/or employed for differ-ent wavelength regimes. For example, the fre-quency range of the Zpectrometer (Harris et al.2007) on the Green Bank Telescope (GBT) is 28.5–34.5 GHz, and this has been used to successfullyobserve CO (J = 1–0) toward four SMGs (Harriset al. 2010). The Redshift Search Receiver (RSR;Erickson et al. 2007) is a 74–110 GHz detectorand spectrometer for the Large Millimeter Tele-scope (LMT), but in the early stage of its use ithas been installed on the Haystack 37-m telescope,as well as on the Five College Radio AstronomyObservatory (FCRAO) 14-m telescope. Chung etal. (2009) have already observed CO (J = 1–0) to-ward 29 ultraluminous infrared galaxies (ULIRGs)using the RSR on the FCRAO 14-m telescope. Z-Spec (Glenn et al. 2007) is a 185–293 GHz bandreceiver on the CSO, which Bradford et al. (2009)have used to present the first broadband λ = 1 mmspectrum toward the z = 2.56 Cloverleaf quasar.The redshift (z) and early universe spectrometer(ZEUS; Stacey et al. 2007) is an echelle gratingspectrometer in the submillimeter band. More-over, the eight mixer receivers (EMIR; Carter etal. 2012) on the IRAM 30-m telescope and Weiβet al. (2009a) have been used to detect CO (J= 3–2) in the 3-mm band and CO (J = 5–4) inthe 2-mm band from an optically/ultraviolet faintSMG. They were able to successfully determinethe redshift of the SMG for the first time.
We have developed a new z-machine for theNobeyama Radio Observatory (NRO) 1 45-m
1The Nobeyama Radio Observatory is a branchof the National Astronomical Observatory of
radio telescope in 100-GHz band. The detec-tors of this receiver are waveguide-type sideband-separating (2SB) mixers that can observe the up-per sideband (USB) and lower sideband (LSB)simultaneously. The receiver has a wide radiofrequency (RF) range and is suitable for the z-machine. Moreover, we use the heterodyne re-ceiver, which has advantage of high frequency res-olution compared with another z-machine. Thebackend systems are newly developed wide-banddigital spectrometers, which have a highly flexi-ble FX-type spectrometer that allows a maximumbandwidth of 32 GHz (2 GHz × 16 arrays) on4,096 spectral channels (Kamazaki et al. 2011).The specifications of the backend system will bepresented in a separate paper, and we will de-scribe the frontend part of the z-machine of the45-m telescope in this paper. The 2SB mixeris adopted for a part of the frequency band ofthe Atacama large millimeter submillimeter ar-ray (ALMA), which suggests that the 2SB re-ceiver systems are more efficient than other SSBreceivers (e.g., Nakajima et al. 2007; 2008). Overan RF range of 80–116 GHz, the SSB receivernoise temperatures of the mixers are lower thanabout 50 K. The image rejection ratios (IRRs)are greater than approximately 10 dB in most ofthe same range. Moreover, our z-machine has twobeams, and the beam separation is approximately45′′; therefore, the two beams can be turned onin an alternate manner for observation using theposition switch. This can significantly reduce theamount of dead time and facilitate the efficientobservation of point sources.
Using the newly developed z-machine for the45-m telescope, we observed a 12CO (J=3–2) emis-sion line toward the cloverleaf as confirmation ofthe performance of the receiver system. This isthe first astronomical observation that has beenmade using a two-beam 2SB SIS receiver systemin the 100-GHz band. The SSB noise tempera-ture of the system, including the atmosphere, istypically 150–300 K.
In the present paper, we describe the two-beam2SB receiver system in the 100-GHz band for the45-m telescope, and we demonstrate its perfor-mance. The results of test observation of a high-z
Japan, National Institutes of Natural Sciences.(http://www.nro.nao.ac.jp/index-e.html)
3

object using the z-machine are also presented.
2. Optics
2.1. Optical Design and on-on Observa-tion
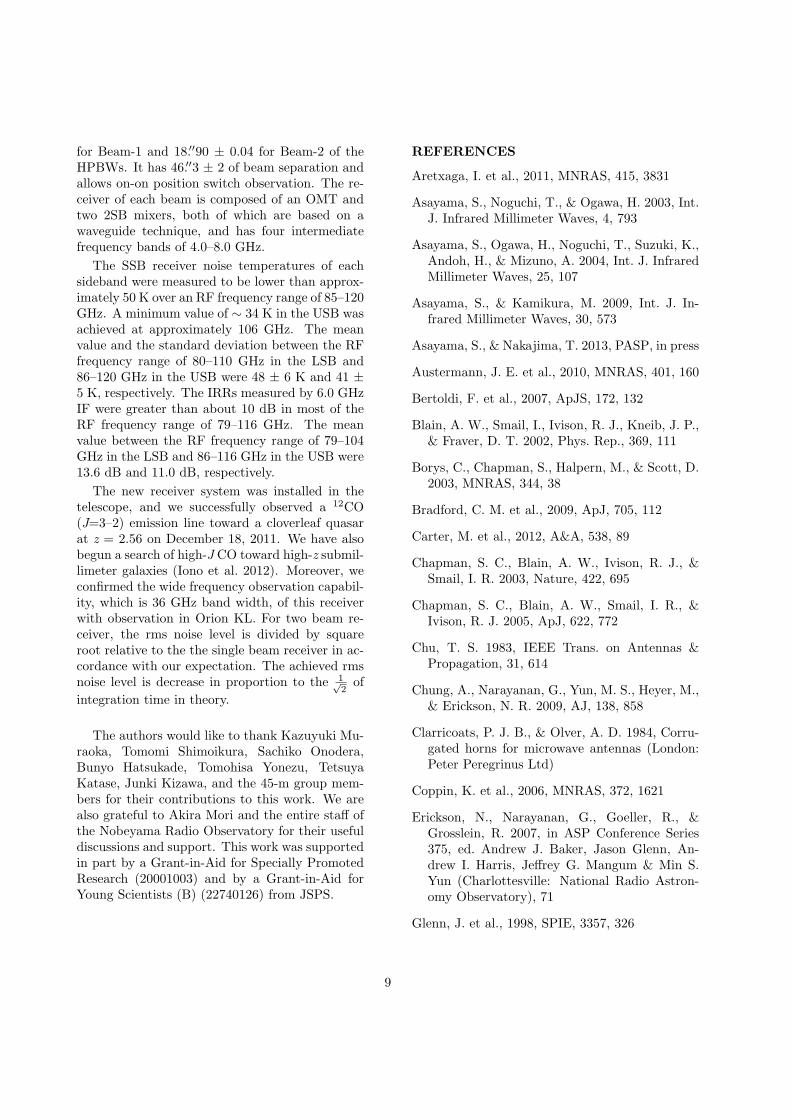
The details of the antenna design of the 45-mtelescope are described in Nakajima et al. (2008).Basically, the new receiver ’s optics are similarin composition to those of previous receivers onthe 45-m telescope, and we have designed the re-ceiver optics so that they would be adapted tothe antenna optics. We used the methods of bothGaussian optics (Goldsmith 1998) and physicaloptics to design the receiver optics, implement-ing such features as an ellipsoidal mirror and acorrugated feed horn. Figure 1 shows the de-sign of the receiver optics. This receiver has twobeams, which are hereafter referred to as Beam-1 and Beam-2. The radio-frequency (RF) signalis split to the right and to the left by a planemirror shaped like triangular prism at the cen-ter, and is then focused by the ellipsoidal mirrorupon each horn. Because there are two beams, it ispossible to continuously observe the target sourceduring the position switching: when the Beam-1points the source, the Beam-2 observes the off po-sition. Then, the Beam-1 observes the off position,whereas the Beam-2 targets the source again. Inthis way, we always observe the target object witheither the Beam-1 or 2. Therefore, the receiverhas no dead time, which facilitates more efficientobservation than can be achieved with a single-beam receiver (figure 2). We call this observationmethod on-on observation.
First, the optics were designed using Gaussianoptics, which are generally used for optical designin the millimeter wave-band. Assuming the edgetaper level of the sub-reflector to be −12 dB, wedesigned the new optics based on Gaussian beampropagation (Chu 1983). The reflection angle atthe plane mirror is 70, and the ellipsoidal mirrorwas designed with an edge taper level of −30 dB toensure that the beam separation would be narrow.We fabricated the ellipsoidal mirrors using an NCmilling cutter. The mirrors are fixed just aboveeach horn by holders, each of which has a position-adjustment mechanism.
Next, we used physical optics techniques toevaluate the optical system using Gaussian op-
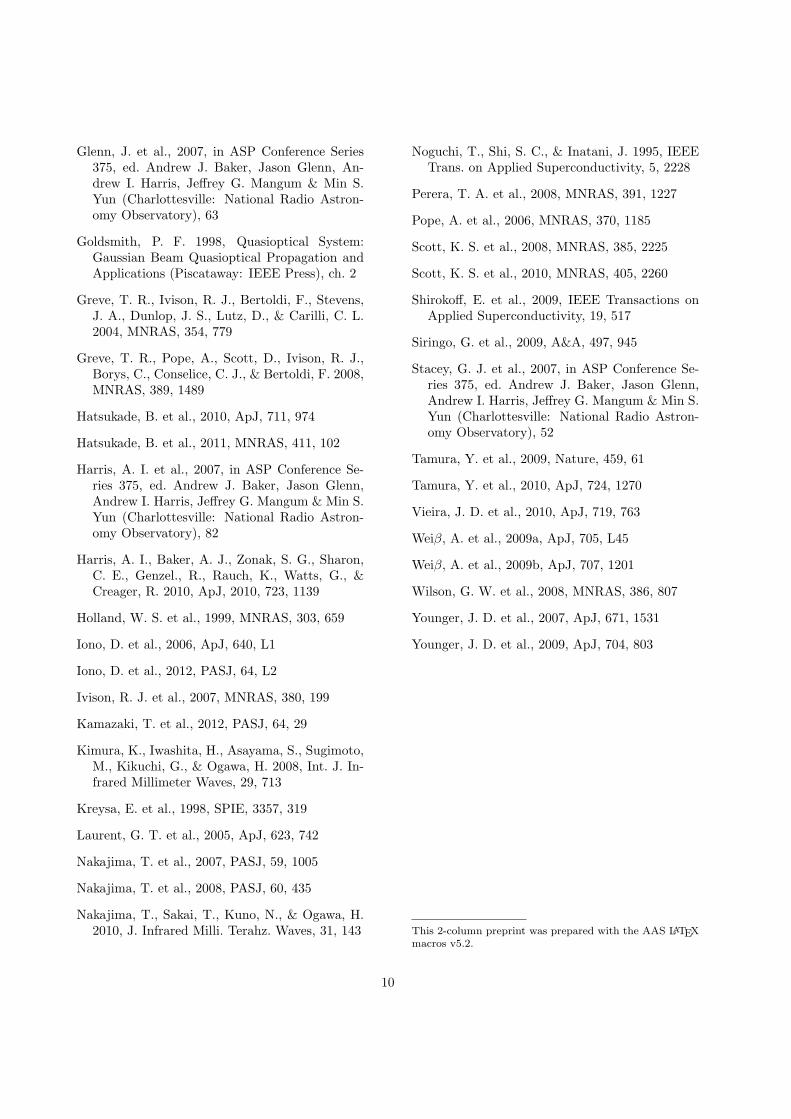
tics. In this calculation, we used the GRASP9analysis software package of the reflector antenna.Figure 3 shows the antenna beam pattern. Theantenna directivity is 92.57 dBi, which is equiv-alent to an aperture efficiency η of 0.81 for the45-m telescope at 100 GHz. The maximum cross-polarization level and the first side lobe level areabout −25 dB and −19 dB, respectively, relativeto the main lobe level. The beam sizes of Beam-1and -2 are 17.′′5 and 19.′′1, respectively, and theseparation between them in the sky is approxi-mately 45′′. However, the actual performance suchas η may be somewhat worse by several percent be-cause the calculation was made without blockingby the sub-reflector stays, surface error, or ohmicloss of the optical elements.
2.2. Corrugated Horn
Corrugated horns are commonly used withreflector antenna systems. Because corrugatedhorns can reduce the edge diffraction, improvedpattern symmetry and reduced cross-polarizationcan be obtained (Clarricoats et al. 1984). Such im-proved performance was needed for a horn that isto be used over a wide range of the RF frequency.We repeatedly calculated the appropriate corruga-tion pattern from the basic design. The physicaldimensions of the corrugated horn are shown intable 1. The definitions of the parameters of thetable are described in figure 4 of Nakajima et al.(2008). Thus, we obtained a return loss lowerthan −23 dB, a maximum cross-polarization levellower than −20 dB, and good similarity betweenthe calculated beam profiles of the E-plane andH-plane (figure 4). We fabricated the horn usingthe direct-dig method, rather than the electro-forming method. The direct-dig method employsa specially-shaped bit to directly dig the groovesusing an NC lathe from the aperture of a horn(Kimura et al. 2008). The displacement of thehorn position upon cooling at 4 K was measuredby a laser displacement gauge. The results showedwe measured that the horn moved 1.3 mm in thehorizontal direction of the cold head of a refrig-erator, and also that the height of the horn camedown to 1.3 mm. Therefore, the position of thehorn corrects this displacement, and was set upaccordingly in the receiver dewar.
4

3. Receiver
3.1. Receiver Configuration
A block diagram of the receiver system is shownin figure 5, and a photograph of the receiver in thedewar is shown in figure 6. The vacuum windowof the dewar is made of a Kapton (polyimide) filmwith a thickness of 50 µm and has a ϕ 45-mmaperture. The infrared (IR) shield is made of Zitex(G106) film with a thickness of 150 µm and has aϕ 40-mm aperture that is set in the 40 K shield.The size of these apertures is thrice of the beamradius, which corresponds to an edge taper levelof −30 dB.
This receiver is composed of an ortho-modetransducer (OMT) and two 2SB mixers, both ofwhich are based on a waveguide technique, withan intermediate frequency (IF) quadrature hybridin each beam. The two orthogonal polarizationsare split using an OMT. The OMT consists of asquare to smoothed double-ridge transition guidefollowed by a junction of two side arms with acentral guide based on the double-ridged waveg-uide OMT (Asayama & Kamikura 2009). Thedetail of the new OMT configuration will be pre-sented in a separate paper (Asayama & Nakajima2012). The RF signal is down-converted to 4.0–8.0 GHz using a 2SB mixer, as described in detailin Asayama et al. (2004). The corrugated horn,the OMT, the two 2SB mixers, and the IF quadra-ture hybrid constitute a tower structure on the 4K cooled stage. The size of the 4 K stage, whichis made of oxygen free high conductivity copperand gold coating, is 250×600 mm. The outputsof the 2SB mixer are the USB and the LSB, bothof which are centered at 6 GHz. The signals arethen amplified by a cryogenic low-noise high elec-tron mobility transistor (HEMT) amplifier. Be-cause these amplifiers are optimized for low noise,bandwidth, and gain, the use of 4–8 GHz cooledisolators prevents the reflection of signals betweenthe IF quadrature hybrid and the HEMT ampli-fier. In total, eight isolators and eight HEMT am-plifiers are fixed on the 4 K stage.
The SIS junctions adopted herein were devel-oped at the Advanced Technology Center of Na-tional Astronomical Observatory of Japan. Theirdesign is based on a proposed bow-tie waveg-uide probe with a parallel-connected twin junction(PCTJ; Noguchi et al. 1995). The main differ-
ence between the present mixer and conventionalmixers is the use of a full-height to 1/5 reduced-height waveguide for waveguide-to-stripline transi-tion of the SIS mixer. The linearly tapered waveg-uide impedance transformer was designed usinga lumped-gap-source port provided by HFSSTM
(Asayama et al. 2003). The PCTJ was composedof Nb/AlOx/Nb junctions, with each junction hav-ing an area of 5 µm2; the normal state resistanceof this device was approximately 20 Ω.
The operation frequency range, which is 80–116GHz, is limited by the frequency range of the localoscillator (LO) chain. The LO signals for each 2SBmixer of dual-polarization are independently gen-erated by multiplying the output of the signal gen-erators (SGs), which cover the range from 14.6–18GHz, by 2×3 multipliers. Therefore, the four IFsignals from the two 2SB mixers can cover differentregions of the RF frequency range in each beam.The LO waveguides, which are used outside of thedewar, are made of silver and silver coating; theywere fabricated by Oshima Prototype EngineeringCo. The insertion loss of the silver waveguide issmaller than that of a copper waveguide. For ex-ample, when a silver waveguide with a length of100 mm is compared with a copper waveguide ofthe same length, then there is a smaller loss ofabout 0.2 dB with the silver waveguide.
The receiver employs a two-stage Gifford-MacMahon cryocooler, which has a cooling ca-pacity of 1.5 W on the 4 K cold stage and has apower consumption of 7.5 kW (Sumitomo RDK-415D). The receiver dewar is evacuated to 10−4
Torr before cooling. It takes 9.2 h to cool themixer from room temperature to the operatingtemperature (∼4 K).
3.2. Receiver Noise Temperature
Before installing the receiver system in the tele-scope, we evaluated its performance. The noisetemperature of the 2SB receiver was measured inthe laboratory using a standard Y-factor method,and using a room temperature load (300 K) anda liquid nitrogen load (77 K). A chopper wheelswitched the input signal between the hot and coldloads. We calculated the receiver noise tempera-ture (Trec) using the standard equation:
Trec =300− 77× Y
Y − 1, (1)
5
where
Y =Phot
Pcold. (2)
The temperatures of the hot and cold loads were300 K and 77 K, respectively. The power meterreadings when the hot and cold loads were pre-sented to the input of the receiver were Phot andPcold. Figure 7 shows the typical double sideband(DSB) mode noise temperature of the eight DSBmixers and the typical 2SB mode noise temper-ature of the four 2SB mixers. The measured re-ceiver noise temperatures of the mixers of boththe DSB and 2SB mode by a power meter, andthe output IF of the receiver, were filtered usinga fixed-bandpass 4 GHz filter (fc = 6 GHz). Themixer was mounted on a 4 K stage in a dewar.The first-stage IF amplifier is a 4 K cooled HEMTin the 4.0–8.0 GHz band. The equivalent noisetemperature and the gain of the HEMT amplifierassociated with an isolator were approximately 8K and +30 dB, respectively. The following-stageamplifiers work at room temperature.
The DSB receiver noise temperatures includedthe noise contributions from the vacuum window,feed horn, and IF amplifier chain, and were ap-proximately 25 K over the LO frequency rangeof 80–115 GHz, which corresponds to 4–5 hf / k.The measured DSB noise temperature, except forthe noise temperature of the cooled isolator andthe HEMT amplifier (8 K), is consistent with thesimulated results. The SSB receiver noise tem-peratures of each sideband were measured to belower than approximately 50 K over an RF fre-quency range of 85–120 GHz. The corrected noisetemperature of the SSB mode was calculated asfollows:
TSSB = Trec(1 +1
IRR), (3)
where IRR is the image rejection ratio. Here, wehave adopted values of 13.6 dB for the LSB and11.0 dB for the USB, respectively, which were usedto measure the average value of this receiver (seethe next subsection). A minimum value of ∼ 34K in the USB was achieved at approximately 106GHz. The mean value and the standard deviationbetween the RF frequency range of 80–110 GHz inthe LSB and 86–120 GHz in the USB were 48 ± 6K and 41 ± 5 K, respectively.
3.3. Image Rejection Ratio
Claude et al. (2000, ALMA MEMO 316) 2 cal-culated the effect of the total amplitude and phaseimbalances on the IRRs of a 2SB mixer. The mainfactor in the degradation of amplitude and phaseimbalance is the performance of the quadraturehybrid of the RF and IF. In our design, we haveminimized the amplitude and phase imbalances ofthe RF quadrature hybrid between the two pathsthrough the receiver (Asayama et al. 2004). Theamplitude and phase imbalance of the RF quadra-ture hybrid were measured to be about ± 2.5 dBand ± 5 degrees, respectively, using a Millimeter-wave Vector Network Analyzer. The IF quadra-ture hybrid was fabricated by the Japan Commu-nication Equipment Co., Ltd. and the amplitudeand phase imbalance were less than ± 0.5 dB and± 3 degrees, respectively. Therefore, we could ex-pect to achieve an IRR of greater than 10 dB.
The IRRs were measured by the relative am-plitudes of the IF responses in the USB and LSBduring the injection of a Continuous Wave (CW)signal (Kerr et al. 2001, ALMA MEMO 357) 3
from a SG. The IRR measured by 6.0 GHz IF wasgreater than 10 dB in most parts of the RF fre-quency range of 79–116 GHz, as shown in figure 8.The mean values between the RF frequency rangeof 79–104 GHz in the LSB and 86–116 GHz in theUSB are 13.6 dB and 11.0 dB, respectively. ThisIRR was a typical value for one of the four 2SBmixers, but other 2SB mixers had about the sameperformance.
3.4. Installation
The receiver system was installed in the 45-mtelescope in May 2009. Figure 9 shows the receiverdewar in the receiver cabin. The RF signal is fedfrom the upper side, and the LO oscillators and IFchains are placed around the dewar. The receiverwas set on the x,y stage and was put on the centerof the beam axis using a plumb. The pressure levelof the dewar and the temperature of the 4 K stagewere 8 × 10⁻⁹ Torr and 4.2 K, respectively, on thetelescope.
Following the installation, the position of the
2ALMAMEMONo.316 ⟨http://www.alma.nrao.edu/memos/html-memos/abstracts/abs316.html⟩
3ALMAMEMONo.357⟨http://www.alma.nrao.edu/memos/html-memos/abstracts/abs357.html⟩
6
receiver was adjusted by comparing the observa-tion of the SiO maser source R-Leo with that ofthe other receiver in the 40 GHz band, which is thereceiver for pointing using the SiO maser source.The beam squint between these receivers is smallerthan 0.6′′ at 86 GHz, a value that is less than 1/20of the half power beam width (HPBW).
4. Results
4.1. System Noise Temperature
We installed the receiver system in the telescopeand measured the performance of the receiver sys-tem. Note that the noise temperatures in this sub-section are not corrected for IRR. Even after cor-rection for IRR, the noise temperature increasesby only ≲ 10 %. The SSB noise temperatures ofthe system, including the atmosphere, were ap-proximately 150–300 K at fRF = 97 GHz in theUSB during the test observations for all 2SB mix-ers. The system noise temperature, including theatmosphere, became approximately half of that ofthe previous single-beam receiver system, S100.
The noise temperature of the optics betweenthe 1st plane mirror at the Cassegrain focus andthe 5th plane mirror on the way to the receiver wasmeasured by a standard Y-factor method to beapproximately 20 K, and the noise temperature ofthe optics, including the main and sub reflectors,was measured to be about 50 K. In total, eightmirrors are used without a main or sub reflectorin the optics of the 45-m telescope, and many ofthem are made from carbon-fiber-reinforced plas-tics (CFRP) coated with dotite, which is a conduc-tive adhesive agent. The losses of these mirrors arehigher than that of a metallic mirror. Therefore, ifthe material of the mirror is changed, the systemnoise temperature may be reduced.
4.2. Image Rejection Ratio
We have already developed and operated themeasurement system of the IRR for the 2SB re-ceiver on the telescope (Nakajima et al. 2010).This system is comprised of a horn that is movedby a motor slider, a harmonic mixer, and an SG;the accuracy of measurement of the IRR was ±10 %. We upgraded the measurement system toimprove the accuracy of measurement. The mul-tiplication of signals from the SG does not usethe harmonic mixer, but rather, a 2×3 multiplier,
in order to prevent spurious radiation in the newmeasurement system. The horn is set in a posi-tion distant from the receiver in order to preventthe occurrence of a standing wave. As a result,the accuracy of the measurement of the IRR wasmeasured to be ± 5 %.
Figure 10 shows the relationship between theIRR value measured by the IRR measurement sys-tem and that estimated from the molecular lineobservation toward the W51 molecular cloud. Wemeasured the integrated intensities and IRR val-ues as a function of bias voltages of the 2SB mix-ers, because IRR value can depend on the biasvoltage. Each measurement was conducted contin-uously five times. The standard deviation is shownas an error bar of the IRR. The integrated inten-sity of the signal was measured by the observationsof 13CO (J = 1–0) in the USB and that of theimage was measured in the LSB. The error mar-gin calculated from the rms noise level is shownas the vertical error bar. The bold line showsthe expected value of IRR according to the fol-lowing IRR calculation formulae, and the dashedlines show the error ranges of ± 10 % and ± 5%. The integrated intensity of the signal band(Wsignal) and image band (Wimage) are
Wsignal =Wreal
1 + 1IRRUSB
(4)
and
Wimage =Wreal
1 + IRRLSB, (5)
, respectively. It is assumed that the optical depthof the signal band and image band are equal.Where Wreal is the strongest integrated intensity.We adopted 152.7 K km−1 from the observation.The error between the IRR measured by the mea-surement system and that measured by the obser-vation ranges is from −4.5 to +7.7 % for the signalband (figure 10 (a)) and from −2.2 to +10.7 %,with no points of poor quality for the image band(figure 10 (b)). At a minimum, the measured val-ues of the IRRs are within an accuracy of ± 5 %in the signal band within the margin of error. Theerror of the IRR is mainly due to the accuracy ofthe signal intensity reading by the spectrum an-alyzer. The large deviation from the calculationvalue in the image band is thought to be due to alow signal-to-noise ratio.
7

4.3. Beam Size and Main-Beam Efficiency
We estimated the beam size and the main-beamefficiency of the 45-m telescope based on observa-tions of the quasar 3C273 and of Saturn in contin-uum. Note that the following data was obtainedat the beginning of the commissioning of the newreceiver system, and thus the results are prelimi-nary. We scanned 3C273 in the azimuth and eleva-tion directions, while recording the total power ofthe IF output. The beam pattern of the antennawas obtained from the resulting map of Saturnby rotating it 180 on the peak position. Fig-ure 11 shows the resulting map of Saturn at 86GHz. The HPBW of the telescope is estimatedto be 18.′′93 ± 0.04 for Beam-1 and 18.′′90 ± 0.04for Beam-2, assuming that the beam pattern hasa Gaussian shape. The beam patterns of bothbeams are nearly circular and show no distortion,though the effect of the sub-reflector stays can beseen. The main-beam efficiency, ηmb, was calcu-lated to be 39.5 ± 2.5 % and 41.0 ± 1.3 % forBeam-1 and Beam-2, respectively, assuming thatthe brightness distribution of Saturn is a uniformdisk with an apparent diameter of 17.′′03 and abrightness temperature of 153 ± 5 K. The separa-tion between Beam-1 and Beam-2 was measuredto be 46.′′3 ± 2, as obtained by alternate pointingobservation of Beam-1 and Beam-2, using the SiOmaser sources, R-Leo and Ori-KL. This result isalmost consistent with the designed value of thereceiver optics (see section 2).
5. Test Observations
5.1. First light
Following the installation, the first astronom-ical signal from the inside of our galaxy andfrom the external galaxy were obtained on the12CO (J=1–0) spectra at 115.271 GHz from theIRC+10216 late-type star on May 23, 2009 and the12CO (J=1–0) spectra from the Markarian 231 ac-tive galaxy on March 11, 2010, respectively. More-over, we successfully observed the 12CO (J=3–2)emission line at 97.191 GHz toward a cloverleafquasar at z = 2.56 on December 18, 2011 (figure12). The total integration time was about 1 hourand typical SSB system noise temperature was 250K. Thus, our purpose of this observation is the op-eration check of the total telescope system. How-ever, this was the first astronomical observation
obtained using the two-beam 2SB receiver systemin the 100 GHz band.
5.2. Frequency Coverage
We observed the molecular lines toward theOrion KL region by using new sixteen digital spec-trometers with bandwidths of 2 GHz and spectralresolution of 488.24 kHz. The total frequency cov-erage is 32 GHz and we can detect the data of 16GHz frequency range in one observation with thisreceiver, because the observation frequency rangeof Beam-1 and Beam-2 are common. Figure 13shows the results, which were obtained by a singlepointing in Orion KL. This image demonstratesthe wide band capability of this receiver. We suc-cessfully detected the wide frequency range spec-trum, which cover from 80 to 116 GHz. Since fourIF signals of different frequency setting for eachbeam can be observed independently and simulta-neously. We can detect this 36 GHz coverage datawith just three local oscillator settings, thanks tothe dual (USB + LSB) IF sidebands, each covering4–8 GHz.
5.3. Noise Level of on-on Observation
The achieved rms noise level as a function of theobserving time was measured with test observa-tions. The rms noise of two beam receiver (on-onobservation) is expected to 1√
2compare with single
beam receiver (on-off observation), because the in-tegration time is doubled in the case of two beamreceiver during the same observing time. Figure14 shows the results of this observation. For sin-gle beam receiver, the rms noise is decreases asthe square root of the integration time in theory.We confirmed the rms noise level of two beam re-ceiver became 1√
2relative to single beam receiver
in accordance with our expectation.
6. Conclusions
We developed a two-beam waveguide-type dual-polarization sideband-separating SIS receiver sys-tem with the 100 GHz band for z-machine on the45-m radio telescope at the Nobeyama Radio Ob-servatory, Japan. The receiver is intended for as-tronomical use in searching for highly redshiftedspectral lines from galaxies of unknown redshift.
This receiver has two beams, with 18.′′93 ± 0.04
8
for Beam-1 and 18.′′90 ± 0.04 for Beam-2 of theHPBWs. It has 46.′′3 ± 2 of beam separation andallows on-on position switch observation. The re-ceiver of each beam is composed of an OMT andtwo 2SB mixers, both of which are based on awaveguide technique, and has four intermediatefrequency bands of 4.0–8.0 GHz.
The SSB receiver noise temperatures of eachsideband were measured to be lower than approx-imately 50 K over an RF frequency range of 85–120GHz. A minimum value of ∼ 34 K in the USB wasachieved at approximately 106 GHz. The meanvalue and the standard deviation between the RFfrequency range of 80–110 GHz in the LSB and86–120 GHz in the USB were 48 ± 6 K and 41 ±5 K, respectively. The IRRs measured by 6.0 GHzIF were greater than about 10 dB in most of theRF frequency range of 79–116 GHz. The meanvalue between the RF frequency range of 79–104GHz in the LSB and 86–116 GHz in the USB were13.6 dB and 11.0 dB, respectively.
The new receiver system was installed in thetelescope, and we successfully observed a 12CO(J=3–2) emission line toward a cloverleaf quasarat z = 2.56 on December 18, 2011. We have alsobegun a search of high-J CO toward high-z submil-limeter galaxies (Iono et al. 2012). Moreover, weconfirmed the wide frequency observation capabil-ity, which is 36 GHz band width, of this receiverwith observation in Orion KL. For two beam re-ceiver, the rms noise level is divided by squareroot relative to the the single beam receiver in ac-cordance with our expectation. The achieved rmsnoise level is decrease in proportion to the 1√
2of
integration time in theory.
The authors would like to thank Kazuyuki Mu-raoka, Tomomi Shimoikura, Sachiko Onodera,Bunyo Hatsukade, Tomohisa Yonezu, TetsuyaKatase, Junki Kizawa, and the 45-m group mem-bers for their contributions to this work. We arealso grateful to Akira Mori and the entire staff ofthe Nobeyama Radio Observatory for their usefuldiscussions and support. This work was supportedin part by a Grant-in-Aid for Specially PromotedResearch (20001003) and by a Grant-in-Aid forYoung Scientists (B) (22740126) from JSPS.
REFERENCES
Aretxaga, I. et al., 2011, MNRAS, 415, 3831
Asayama, S., Noguchi, T., & Ogawa, H. 2003, Int.J. Infrared Millimeter Waves, 4, 793
Asayama, S., Ogawa, H., Noguchi, T., Suzuki, K.,Andoh, H., & Mizuno, A. 2004, Int. J. InfraredMillimeter Waves, 25, 107
Asayama, S., & Kamikura, M. 2009, Int. J. In-frared Millimeter Waves, 30, 573
Asayama, S., & Nakajima, T. 2013, PASP, in press
Austermann, J. E. et al., 2010, MNRAS, 401, 160
Bertoldi, F. et al., 2007, ApJS, 172, 132
Blain, A. W., Smail, I., Ivison, R. J., Kneib, J. P.,& Fraver, D. T. 2002, Phys. Rep., 369, 111
Borys, C., Chapman, S., Halpern, M., & Scott, D.2003, MNRAS, 344, 38
Bradford, C. M. et al., 2009, ApJ, 705, 112
Carter, M. et al., 2012, A&A, 538, 89
Chapman, S. C., Blain, A. W., Ivison, R. J., &Smail, I. R. 2003, Nature, 422, 695
Chapman, S. C., Blain, A. W., Smail, I. R., &Ivison, R. J. 2005, ApJ, 622, 772
Chu, T. S. 1983, IEEE Trans. on Antennas &Propagation, 31, 614
Chung, A., Narayanan, G., Yun, M. S., Heyer, M.,& Erickson, N. R. 2009, AJ, 138, 858
Clarricoats, P. J. B., & Olver, A. D. 1984, Corru-gated horns for microwave antennas (London:Peter Peregrinus Ltd)
Coppin, K. et al., 2006, MNRAS, 372, 1621
Erickson, N., Narayanan, G., Goeller, R., &Grosslein, R. 2007, in ASP Conference Series375, ed. Andrew J. Baker, Jason Glenn, An-drew I. Harris, Jeffrey G. Mangum & Min S.Yun (Charlottesville: National Radio Astron-omy Observatory), 71
Glenn, J. et al., 1998, SPIE, 3357, 326
9
Glenn, J. et al., 2007, in ASP Conference Series375, ed. Andrew J. Baker, Jason Glenn, An-drew I. Harris, Jeffrey G. Mangum & Min S.Yun (Charlottesville: National Radio Astron-omy Observatory), 63
Goldsmith, P. F. 1998, Quasioptical System:Gaussian Beam Quasioptical Propagation andApplications (Piscataway: IEEE Press), ch. 2
Greve, T. R., Ivison, R. J., Bertoldi, F., Stevens,J. A., Dunlop, J. S., Lutz, D., & Carilli, C. L.2004, MNRAS, 354, 779
Greve, T. R., Pope, A., Scott, D., Ivison, R. J.,Borys, C., Conselice, C. J., & Bertoldi, F. 2008,MNRAS, 389, 1489
Hatsukade, B. et al., 2010, ApJ, 711, 974
Hatsukade, B. et al., 2011, MNRAS, 411, 102
Harris, A. I. et al., 2007, in ASP Conference Se-ries 375, ed. Andrew J. Baker, Jason Glenn,Andrew I. Harris, Jeffrey G. Mangum & Min S.Yun (Charlottesville: National Radio Astron-omy Observatory), 82
Harris, A. I., Baker, A. J., Zonak, S. G., Sharon,C. E., Genzel., R., Rauch, K., Watts, G., &Creager, R. 2010, ApJ, 2010, 723, 1139
Holland, W. S. et al., 1999, MNRAS, 303, 659
Iono, D. et al., 2006, ApJ, 640, L1
Iono, D. et al., 2012, PASJ, 64, L2
Ivison, R. J. et al., 2007, MNRAS, 380, 199
Kamazaki, T. et al., 2012, PASJ, 64, 29
Kimura, K., Iwashita, H., Asayama, S., Sugimoto,M., Kikuchi, G., & Ogawa, H. 2008, Int. J. In-frared Millimeter Waves, 29, 713
Kreysa, E. et al., 1998, SPIE, 3357, 319
Laurent, G. T. et al., 2005, ApJ, 623, 742
Nakajima, T. et al., 2007, PASJ, 59, 1005
Nakajima, T. et al., 2008, PASJ, 60, 435
Nakajima, T., Sakai, T., Kuno, N., & Ogawa, H.2010, J. Infrared Milli. Terahz. Waves, 31, 143
Noguchi, T., Shi, S. C., & Inatani, J. 1995, IEEETrans. on Applied Superconductivity, 5, 2228
Perera, T. A. et al., 2008, MNRAS, 391, 1227
Pope, A. et al., 2006, MNRAS, 370, 1185
Scott, K. S. et al., 2008, MNRAS, 385, 2225
Scott, K. S. et al., 2010, MNRAS, 405, 2260
Shirokoff, E. et al., 2009, IEEE Transactions onApplied Superconductivity, 19, 517
Siringo, G. et al., 2009, A&A, 497, 945
Stacey, G. J. et al., 2007, in ASP Conference Se-ries 375, ed. Andrew J. Baker, Jason Glenn,Andrew I. Harris, Jeffrey G. Mangum & Min S.Yun (Charlottesville: National Radio Astron-omy Observatory), 52
Tamura, Y. et al., 2009, Nature, 459, 61
Tamura, Y. et al., 2010, ApJ, 724, 1270
Vieira, J. D. et al., 2010, ApJ, 719, 763
Weiβ, A. et al., 2009a, ApJ, 705, L45
Weiβ, A. et al., 2009b, ApJ, 707, 1201
Wilson, G. W. et al., 2008, MNRAS, 386, 807
Younger, J. D. et al., 2007, ApJ, 671, 1531
Younger, J. D. et al., 2009, ApJ, 704, 803
This 2-column preprint was prepared with the AAS LATEXmacros v5.2.
10
ellipsoidal
RF signal
plane mirrorcorrugated
70 degFocus
58.16 mm
horn
corrugated
horn
513.59 mm
Beam-1Beam-2
mirror
ellipsoidal
mirror
Fig. 1.— Receiver optics of the new receiver. TheRF signal is fed from the upper side. The sepa-ration of focus in each beam is 58.16 mm and thedistance between corrugated horns is 513.59 mm.
on
off
on
off-1
on
off-2
(a)
(b)
Beam-2
Beam-1Beam-1
Beam-2
Target object
Fig. 2.— The schematic images of the principleof position switch mode in comparison with twotype receivers. The observation of on-off observa-tion with single beam receiver (a) and on-on ob-servation with two beam receiver (b).
Po
wer
[d
Bi]
50
60
70
80
90
100
-60 -40 -20 0 20 40 60
Beam-1Beam-2
Angle [arcsec]
Fig. 3.— Antenna beam patterns of Beam-1 andBeam-2 at 100 GHz, as calculated by GRASP9physical optics software.
Am
pli
tud
e [d
Bi]
-30
-20
-10
0
10
20
30
0 10 20 30 40 50
E-planeHE11H-planeCross-pol. at 45deg
Angle [deg]
Fig. 4.— Simulated beam profile of the corrugatedhorn at 100 GHz. The result shows the similar-ity between the beam patterns of the E-plane andthe H-plane. These beam patterns correspond wellwith the theoretical beam pattern obtained by theradiation of the HE11 mode.
11

2SB
mixer
ellipsoidal
mirror
Dewar
40K shield
4K stage
RF signal
IF signals
OMT
2SB
mixer
IF
quadrature
hybrid
IF
quadrature
hybrid
OMT
2SB
mixer
IF
quadrature
hybrid
2SB
mixer
IF
quadrature
hybrid
ellipsoidal
mirror
plane
mirror
corrugated
horn
isolator
HEMT amp.
Beam-1Beam-2
twist
waveguide
circular-square
transition
Kapton film
Zitex film
x2
Signal
Genelator
x3
x2
Signal
Genelator
x3
2-port
divider
2-port
divider
Fig. 5.— Schematic block diagram of the receiver.The RF signal is fed from the upper side to eachhorn. The four IF signals are obtained indepen-dently and simultaneously.
OMT
HEMT amps
isolators
corrugated horn
2SB mixers
RF signal
(Beam-2)
IF signals
OMT
2SB mixers
corrugated horn
LO signals LO signals
RF signal
(Beam-1)
Fig. 6.— Photograph of the 4 K cooled stage inthe receiver dewar. The receiver components ofBeam-1 and Beam-2 are symmetrically fixed onthe 4 K stage. The corrugated horn, the OMT,two 2SB mixers, and two IF quadrature hybridstogether constitute a tower structure.
Rec
eiver
Nois
e T
emper
ature
[K
]
0
20
40
60
80
100
70 80 90 100 110 120 130
Frequency [GHz]
2SB mode (LSB)2SB mode (USB)DSB modesimulation
Fig. 7.— The receiver noise temperatures of theDSB and 2SB (SSB) modes, and simulation of thenoise temperature of the DSB mode. The squaresymbol represents the DSB mode and the solidline represents the simulation. The open and filledcircle symbols represent the 2SB mode in LSB andUSB, respectively. The horizontal axis is definedas an LO frequency for the DSB mode and an RFfrequency for the 2SB mode, respectively.
12

Imag
e R
ejec
tio
n R
atio
[d
B]
0
5
10
15
20
70 80 90 100 110 120
LSBUSB
RF Frequency [GHz]
Fig. 8.— Image rejection ratio in the LSB (opencircles) and USB (filled circles). These values aremeasured by the 6.0 GHz IF and are shown as afunction of the LO frequency.
RF signal
plane mirror
eripsoidal mirror eripsoidal mirror
LO multiplier chain
Beam-1Beam-2
He cryocooler
Vacuum pump
Temperature monitor
LO ATTs
He compressor
IF amplifires LO power devider
x,y stage
LO ATT drivers
Fig. 9.— Photograph of the receiver system in thereceiver cabin of the telescope.
(a)
(b)
Inte
gra
ted I
nte
nsi
ty [
K k
m/s
]In
tegra
ted I
nte
nsi
ty [
K k
m/s
]
0
60
120
180
0
30
60
0 5 10 15 20 25 30
IRR [dB]
Wsignal
Wimage
+10 %
-10 %
+5 %
-5 %
Fig. 10.— The relationship between the IRRvalue as measured by the IRR measurement sys-tem and the integrated intensity as estimated fromthe molecular line observation in USB (a), andLSB (b), respectively. The bold line shows theanticipated value of the IRR according to the IRRcalculation formula, and the dashed lines representthe error ranges of ± 10 % and ± 5 %.
0 30 60-30-60
Offset [arcsec]
0
30
-30
Off
set
[arc
sec]
Beam-1
Beam-2
Fig. 11.— Map of results for Saturn at 86 GHz.The lowest contour is 1 % of the maximum value,and the intervals are 2 %, 5 %, and from 10 % to90 %, at intervals of 10 %. The elongated featurein three directions is the effect of the sub-reflectorstays.
13

TA
* [
mK
]
-4.0
-2.0
0.0
2.0
4.0
6.0
8.0
96.5 97.0 97.5 98.0
Frequency [GHz]
Fig. 12.— Results of 12CO (J=3–2) emission linetoward a cloverleaf quasar at high-z. The high-JCO line, whose rest frequency is 345.796 GHz, isredshifted to the 100-GHz band.
TA* [
K]
-1.0
0.0
1.0
2.0
3.0
4.0
5.0
80.0 85.0 90.0 95.0 100 105 110 115
Frequency [GHz]
Fig. 13.— Line spectrum of the Orion KL takenduring commissioning of two beam receiver in May2012. Almost 36 GHz of RF frequency space canbe surveyed with just three local oscillator set-tings. The local frequencies of set-1 are 108 GHzfor one polarization and 104 GHz for the otherpolarization (red), set-2 are 100 GHz and 96 GHz(blue), and set-3 are 92 GHz and 88 GHz (green).
Trm
s [K
]
0.01
0.1
10 100 1000
Single Beam RX
Two Beam RX
y = 0.76 * x^(-0.52)
y = 0.54 * x^(-0.51)
Observation Time [sec]
Fig. 14.— The relationship between the rms noiselevel and observing time. The rms noise is de-creases as the square root of the integration timein theory for single beam receiver (open circles)and for two beam receiver (filled circles). For twobeam receiver, the rms noise level is divided bysquare root (dashed line) relative to the the singlebeam receiver (dotted line) in accordance with ourexpectation.
14

Table 1: Physical dimensions of the corrugatedhorn.
parameters valueMaterial AluminumTotal length 80.00 mmLength of the corrugation section 58.14 mmOuter diameter of the aperture 25.00 mmInner diameter of the aperture 21.50 mmSemi-flare angle 9.0
Diameter of the circular waveguide 3.08 mmWidth of the grooves 0.57 mmDepth of the grooves at the mode-launching section 1.34–0.87 mmDepth of the grooves at the thread section 0.87 mm
15


![The ALMA Band 6 (211-275 GHz) Sideband- Separating SIS ... · from below the page via an H-plane bend [8]. The signal is split by the branch-line hybrid and passes to the mixer chips](https://static.fdocuments.us/doc/165x107/5c2b94fc09d3f29d458c8375/the-alma-band-6-211-275-ghz-sideband-separating-sis-from-below-the-page.jpg)