A Needs Assessment Survey for Parents of hildren … Needs Assessment Survey for Parents of hildren...
22
1 Michigan Birth Defects Registry Follow-up Program OFC Family Survey A Needs Assessment Survey for Parents of Children with Oral Cleft in Michigan A report prepared by Michigan Department of Health and Human Services Bureau of Disease Control, Prevention and Epidemiology Lifecourse Epidemiology and Genomics Division Results from the Orofacial Cleft Family Survey, 2013
Transcript of A Needs Assessment Survey for Parents of hildren … Needs Assessment Survey for Parents of hildren...

1
Michigan Birth Defects Registry Follow-up Program OFC Family Survey
A Needs Assessment Survey for Parents of Children with Oral Cleft in Michigan
A report prepared by Michigan Department of Health and Human Services Bureau of Disease Control, Prevention and Epidemiology Lifecourse Epidemiology and Genomics Division
Results from the Orofacial Cleft Family Survey, 2013

2
Michigan Birth Defects Registry Follow-up Program OFC Family Survey
Table of Contents
Background Information 4
Purpose 5
Methods 5
Results 5
Demographic Distribution 5
Diagnosis and Follow-up Care 9
Emotional/Social Support 16
Discussion 19
Public Health Impact 20
Tables
1. Demographic distribution of survey respondents 6
2. Demographic characteristics of all invited participants vs. survey groups 7
3. Demographics comparison of MBDR OFC cases, 2009-2011 vs. survey participants, 2013 8
4. Family history and other children born with an oral cleft 9
5. Helpful resources for parents of children with cleft, whether these resources were provided
by a health professional (HP) and perceived importance 14
6. Percentage of respondents who received special feeding resources provided by a health
professional (HP) 14
7. Issues related to having a child with cleft, whether these issues were addressed by a health
professional and perceived importance 17
8. Received social support needed and ability to cope with struggles 18

3
Michigan Birth Defects Registry Follow-up Program OFC Family Survey
Figures
1. Cleft Palate 4
2. Cleft Lip 4
3. County of respondents 6
4. Percentage of respondents who found out about their child’s oral cleft before birth by type
of cleft 10
5. Percentage of respondents who met with a cleft specialist by age of child (at initial meeting)
and type of cleft 10
6. Number of surgeries by age of child and type of cleft for children born 2009-2011 11
7. Percentage of children needing more surgery to revise oral cleft 12
8. Types of care received by percentage of children 13
9. Source of payment for medical expenses for those who received follow-up care 15
10. Percentage of respondents who did not receive the needed support by how well they were
coping and whether they received information about coping 18

4
Michigan Birth Defects Registry Follow-up Program OFC Family Survey
Background Information
Cleft lip and cleft palate are birth defects that occur when a baby’s lip or mouth do not form properly
before birth. Together, these birth defects commonly are called “orofacial clefts” or “oral clefts” (OFCs).
Affecting 1-2 per 1,000 newborns, together they are among the more common birth defects, and the
most common affecting the face. These birth defects happen early during pregnancy, by 5 to 6 weeks
after conception for cleft lip and by about 10 weeks after conception for cleft palate. A baby can have a
cleft lip, a cleft palate, or both.1 A cleft may affect one side of the lip and/or palate (unilateral) or both
sides (bilateral) and may disrupt the formation of the nose and/or extend into the gum or upper
jawbone. Children with orofacial clefts often have problems with feeding and talking. They might also
have ear infections, hearing loss, and problems with their teeth.1 They usually require one or more
surgeries early in life, as well as special feeding techniques, orthodontic care and/or speech therapy.
Severity varies with the degree of clefting and with the presence of other birth defects; in extreme
cases, death may result.1
The Centers for Disease Control and Prevention (CDC) recently estimated that each year 2,651 babies in
the United States are born with a cleft palate, and 4,437 babies are born with a cleft lip (with or without
a cleft palate).1 In Michigan, from 1992 to 2010, the incidence of OFC was about 1 in 637 live births
(15.7 cases per 10,000 live births) with an average number of 75 cases of cleft palate and 130 cases of
cleft lip (with or without cleft palate) each year.
Previous research has identified that the causes of orofacial clefts are complex, involving both
environmental and genetic factors.2 According to the 2014 Surgeon General’s Report, smoking in early
pregnancy can cause orofacial clefts.3 Studies have shown a protective effect with folic acid
supplementation starting around the time of conception. However, this has not been proven
conclusively.4
Figure 1: Cleft Palate1 Figure 2: Cleft Lip1

5
Michigan Birth Defects Registry Follow-up Program OFC Family Survey
Purpose
The purpose of this study was to assess the experiences of families, parents and caregivers of children
with OFCs in Michigan and their needs and utilization of services, in order to learn whether parents of
children born with special health needs receive information and care that is available to them.
Results of the study were used to identify gaps in the information, services and support that exist,
and how they may be addressed by the Michigan Department of Health and Human Services
(MDHHS).
Methods
Parents of children with OFCs, including isolated cleft palate and cleft lip (with or without cleft palate)
born from 2009 through 2011, were identified from the Michigan Birth Defects Registry (MBDR).
From this group, parents of children with OFCs, who were not deceased, adopted, nor born out of
state, were invited to participate in this study. A total of 420 families were invited to take the survey,
using up to 3 mailings, of which 111 were returned as undeliverable. Invitations provided a link for
participants to complete the survey via ‘Survey Monkey’ online. A paper survey and a pre-addressed
return envelope were also provided, following the first mailing, for those who preferred to complete
the survey on paper. The first 75 people to complete the survey were offered a $10 gift card and all
participants who completed the survey were entered into a drawing for a $50 gift card. Results
received by the cut-off date were analyzed using Statistical Analysis Software (SAS) version 9.2 to
assess the needs of families of children with clefts for care and services as well as barriers to
accessing these services. Descriptive statistics of survey questions were calculated as well as
statistical significance where applicable.
Results
Demographic Distribution
The response rate was 34% (104 participants completed the survey on time; 85 online and 19 on
paper). Of respondents, the majority (92.9%) were 25 years or older and over half were 25-34 years of
age (54.5%; Table 1). The majority were white (90.8%) and had more than a high school education
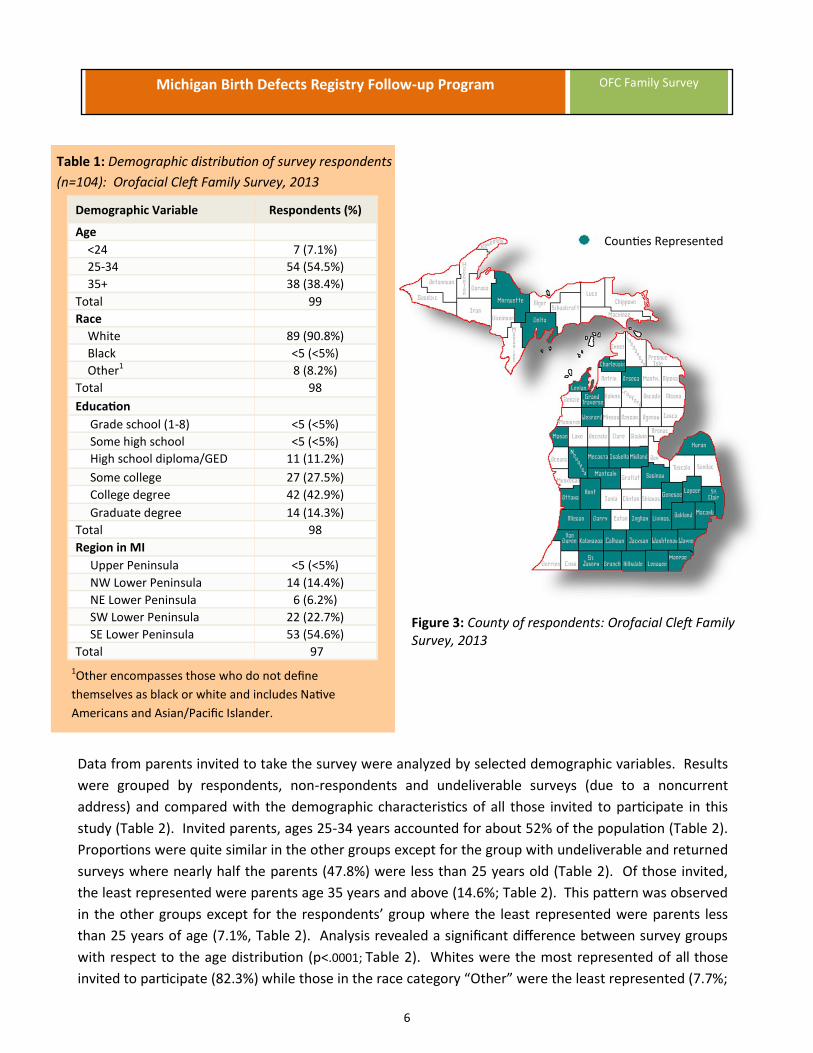
(84.7%), with over 50% holding a college degree (Table 1). Thirty-seven of the 83 Michigan counties
were represented on the survey (Figure 3), with about 55% from the SE lower peninsula region (Table
1).
6
Michigan Birth Defects Registry Follow-up Program OFC Family Survey
Counties Represented
Table 1: Demographic distribution of survey respondents
(n=104): Orofacial Cleft Family Survey, 2013
1Other encompasses those who do not define
themselves as black or white and includes Native
Americans and Asian/Pacific Islander.
Figure 3: County of respondents: Orofacial Cleft Family Survey, 2013
Data from parents invited to take the survey were analyzed by selected demographic variables. Results
were grouped by respondents, non-respondents and undeliverable surveys (due to a noncurrent
address) and compared with the demographic characteristics of all those invited to participate in this
study (Table 2). Invited parents, ages 25-34 years accounted for about 52% of the population (Table 2).
Proportions were quite similar in the other groups except for the group with undeliverable and returned
surveys where nearly half the parents (47.8%) were less than 25 years old (Table 2). Of those invited,
the least represented were parents age 35 years and above (14.6%; Table 2). This pattern was observed
in the other groups except for the respondents’ group where the least represented were parents less
than 25 years of age (7.1%, Table 2). Analysis revealed a significant difference between survey groups
with respect to the age distribution (p<.0001; Table 2). Whites were the most represented of all those
invited to participate (82.3%) while those in the race category “Other” were the least represented (7.7%;
Demographic Variable Respondents (%)
Age
<24 7 (7.1%)
25-34 54 (54.5%)
35+ 38 (38.4%)
Total 99
Race
White 89 (90.8%)
Black <5 (<5%)
Other1 8 (8.2%)
Total 98
Education
Grade school (1-8) <5 (<5%)
Some high school <5 (<5%)
High school diploma/GED 11 (11.2%)
Some college 27 (27.5%)
College degree 42 (42.9%)
Graduate degree 14 (14.3%)
Total 98
Region in MI
Upper Peninsula <5 (<5%)
NW Lower Peninsula 14 (14.4%)
NE Lower Peninsula 6 (6.2%)
SW Lower Peninsula 22 (22.7%)
SE Lower Peninsula 53 (54.6%)
Total 97

7
Michigan Birth Defects Registry Follow-up Program OFC Family Survey
Table 2). This pattern is seen in the other groups except for the respondents’ group where the least
represented were blacks, making up less than 5% of the survey respondents (Table 2). Results
indicated a significant difference between survey groups by the race distribution (p=0.046; Table 2).
By ethnicity, non-Hispanics (92.5%) were much more represented than Hispanics (7.7%) and the
pattern was seen across all groups (Table 2). Of those invited, over 50% had male children born with
an oral cleft (53.2%) while nearly half had female children with an oral cleft (46.8%; Table 2). A similar
pattern is observed across all groups (Table 2). No significant differences exist between survey groups
with respect to the distribution by ethnicity (p=0.2152) and sex of the child (0.7988; Table 2).
Table 2: Demographic characteristics of all invited participants vs. survey groups: Orofacial Cleft Family
Survey, 2013
1Missing data not included. 2Other encompasses those who do not define themselves as black or white and includes Native Americans and
Asian/Pacific Islander.
**Statistically significant difference in distribution between survey groups (respondents, non-respondents and
undeliverable and returned) at the 0.05 alpha level.
Variable
All invited
Survey groups
Respondents Non-respondents Undeliverable and Returned
p-value
Age Number (%) Number (%)
<25 141 (33.8%) 7 (7.1%) 68 (33.7%) 53 (47.8%) <.0001**
25-34 215 (51.6%) 54 (54.5%) 108 (53.5%) 47 (42.3%)
35+ 61 (14.6%) 38 (38.4%) 26 (12.9%) 11 (9.9%)
Total 4171 991 202 111
Race
White 343 (82.3%) 89 (90.8%) 164 (81.2%) 88 (79.3%) 0.046**
Black 42 (10.1%) <5 (<5.0%) 21 (10.4%) 17 (15.2%)
Other2 32 (7.7%) 8 (8.2%) 17 (8.4%) 6 (5.4%)
Total 4171 981 202 111
Ethnicity
Hispanic 31 (7.7%) <5 (<5.0%) 16 (8.0%) 12 (10.8%) 0.2152
Non-Hispanic 384 (92.5%) 97 (97.0%) 185 (92.0%) 99 (89.2%)
Total 4151 1001 201 111
Sex of Child
Male 222 (53.2%) 51 (50.5%) 110 (54.5%) 58 (52.3%) 0.7988
Female 195 (46.8%) 50 (49.5%) 92 (45.5%) 53 (47.8%)
Total 4171 101 202 111
8
Michigan Birth Defects Registry Follow-up Program OFC Family Survey
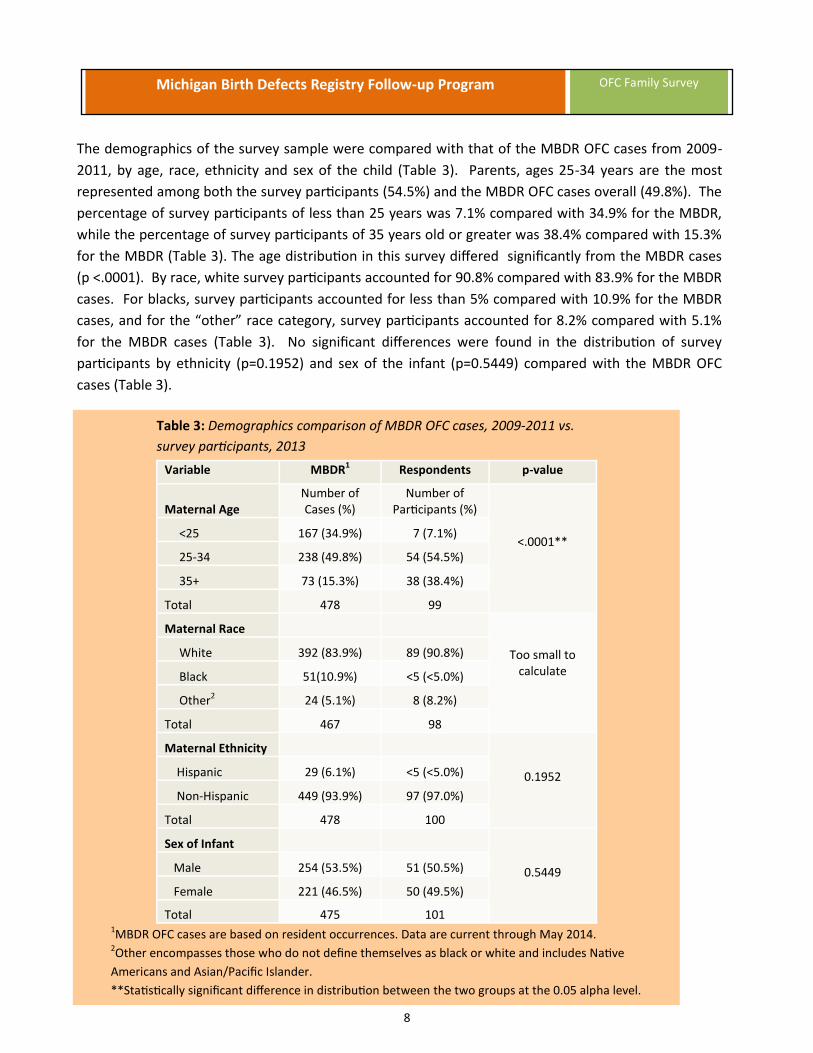
The demographics of the survey sample were compared with that of the MBDR OFC cases from 2009-
2011, by age, race, ethnicity and sex of the child (Table 3). Parents, ages 25-34 years are the most
represented among both the survey participants (54.5%) and the MBDR OFC cases overall (49.8%). The
percentage of survey participants of less than 25 years was 7.1% compared with 34.9% for the MBDR,
while the percentage of survey participants of 35 years old or greater was 38.4% compared with 15.3%
for the MBDR (Table 3). The age distribution in this survey differed significantly from the MBDR cases
(p <.0001). By race, white survey participants accounted for 90.8% compared with 83.9% for the MBDR
cases. For blacks, survey participants accounted for less than 5% compared with 10.9% for the MBDR
cases, and for the “other” race category, survey participants accounted for 8.2% compared with 5.1%
for the MBDR cases (Table 3). No significant differences were found in the distribution of survey
participants by ethnicity (p=0.1952) and sex of the infant (p=0.5449) compared with the MBDR OFC
cases (Table 3).
Table 3: Demographics comparison of MBDR OFC cases, 2009-2011 vs.
survey participants, 2013
Variable MBDR1 Respondents p-value
Maternal Age
Number of Cases (%)
Number of Participants (%)
<.0001** <25 167 (34.9%) 7 (7.1%)
25-34 238 (49.8%) 54 (54.5%)
35+ 73 (15.3%) 38 (38.4%)
Total 478 99
Too small to calculate
Maternal Race
White 392 (83.9%) 89 (90.8%)
Black 51(10.9%) <5 (<5.0%)
Other2 24 (5.1%) 8 (8.2%)
Total 467 98
Maternal Ethnicity
0.1952 Hispanic 29 (6.1%) <5 (<5.0%)
Non-Hispanic 449 (93.9%) 97 (97.0%)
Total 478 100
Sex of Infant
0.5449 Male 254 (53.5%) 51 (50.5%)
Female 221 (46.5%) 50 (49.5%)
Total 475 101 1MBDR OFC cases are based on resident occurrences. Data are current through May 2014. 2Other encompasses those who do not define themselves as black or white and includes Native
Americans and Asian/Pacific Islander.
**Statistically significant difference in distribution between the two groups at the 0.05 alpha level.

9
Michigan Birth Defects Registry Follow-up Program OFC Family Survey
Diagnosis and Follow-up Care
Participants were asked if they had a child born with an oral cleft. Three respondents indicated on the
survey that their child had no cleft. Additionally, three individuals who did not participate in this study
contacted the MBDR program to report that they had no child with an oral cleft.
From the survey, about 21% of respondents had a family history of cleft. Of these, 11.5% indicated that
the history of cleft was on the child’s mother’s side, 7.7% indicated it was on the child’s father’s side
and 1.9% indicated it was on both sides of the family. Five percent of respondents indicated
having other children born with a cleft. The association between family history and having other
children born with clefts was studied. Analysis suggested a statistically significant relationship
between the two variables (p=0.0187; Table 4).
Table 4: Family history and other children born with an oral cleft (n=101):Orofacial Cleft Family
Survey, 2013
Other children born with cleft
Family History
Mother’s side
Father’s side
Both sides No Not sure Total
Yes 2 (2.0%) 2 (2.0%) 0 (0.0%) 1 (1.0%) 0 (0.0%) 5 (5.0%)
No 10 (9.9%) 6 (5.94%) 2 (2.0%) 75 (74.3%) 3 (3.0%) 96 (95.1%)
Total 12 (11.9%) 8 (7.9%) 2 (2.0%) 76 (75.3%) 3 (3.0%) 101
At the time of this survey, the ages of the children with OFC ranged from 1-11 years with the average
being 3 years. Survey results showed that cleft lip with cleft palate was the most common type of
cleft among the respondents’ children (50.5%). About 23% of the respondents’ children had cleft lip
only and about 27% had cleft palate only.
From this survey, prenatal diagnosis versus postnatal diagnosis of OFC was almost an even
distribution. About 55% of respondents reported that they found out about their child’s oral cleft
before birth. Of these, cleft lip and palate was the most predominant type of cleft (76.4%; Figure 4).
Nearly half the respondents (45.5%) indicated that they discovered that their child had an oral cleft
after birth. Of these, the majority (58.7%) had cleft palate only (Figure 4).

10
Michigan Birth Defects Registry Follow-up Program OFC Family Survey
Overall, about 43% of respondents first met with a cleft specialist when their child was less than 1
month of age, about 37% when their child was 1 to 3 months of age and about 4% when their child
was over 3 months of age. Figure 5 shows the age group distribution of children when the parent or
care giver first met with a cleft specialist, stratified by the type of cleft. For children seen less than 1
month of age, over half (51.2%) had cleft lip and palate (Figure 5). For children seen at 1 to 3 months
of age, most (37.8%) had cleft lip and palate (Figure 5). For children seen older than 3 months, most
(75%) had cleft palate only (Figure 5). There was no statistical difference between the age
distribution of the children when the parent first met with a cleft specialist and the type of cleft
(p=0.2496).
Figure 4: Percentage of respondents who found out about their child’s oral cleft
before birth by type of cleft (n=101): Orofacial Cleft Family Survey, 2013
Figure 5: Percentage of respondents who met with a cleft specialist by age of child
(at initial meeting) and type of cleft (n=84): Orofacial Cleft Family Survey, 2013

11
Michigan Birth Defects Registry Follow-up Program OFC Family Survey
The number of surgeries for children born from 2009 through 2011 (n=98) was analyzed by the age of
the child and type of cleft. For older children born in 2009, who were about 4 years old (n=11), most
(72.7%, n=8) had one or two surgeries. Of those with one surgery half (50.0%; n=4) had cleft palate
only and of those with two surgeries, the majority (75.0%; n=4) had cleft lip and palate (Figure 6). For
children born in 2010, who were about 3 years old (n=30), nearly half (46.7%; n=14) had three or more
surgeries. Of these, the majority (71.4%) had cleft lip and palate (Figure 6). For younger children born
in 2011 who were 1-2 years old (n=53), most (35.8%; n=19) had only one surgery. Of these, over half
(52.6%) had cleft lip only (Figure 6). Results indicated that children who were 3 years or older had at
least one surgery. Children with cleft lip and palate had more surgeries compared to children with cleft
lip alone or cleft palate alone. The surgery experience of other children born with cleft who were 5 to
11 years old (n=3) was also assessed. Results indicated that the majority (66.7%) had three or more
surgeries and had cleft palate only (data not shown).
Figure 6: Number of surgeries by age of child and type of cleft for children born 2009-2011 (n=98): Orofacial
Cleft Family Survey, 2013
When asked if more surgery was needed to revise their child’s oral cleft, over half the respondents
(55.5%) reported more surgery was needed, 19.8% indicated the surgical repair of their child’s cleft
was complete and nearly a quarter (24.8%) indicated not sure. Analysis of the data revealed that most
children with cleft lip and palate (78.6%) required more surgery than children with cleft lip only
(19.6%) or cleft palate only (1.8%; Figure 7). Most children with cleft palate only had their cleft repair
completed (75.0%; Figure 7). No child with a cleft lip and palate was reported to have a complete
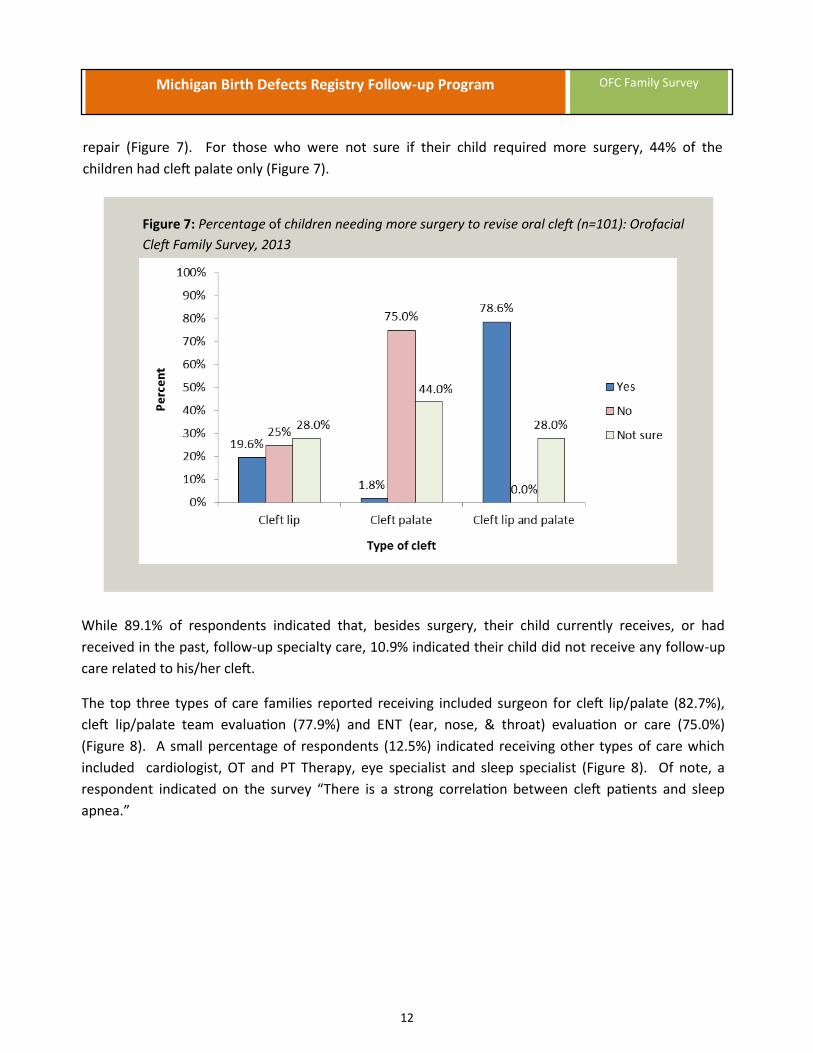
12
Michigan Birth Defects Registry Follow-up Program OFC Family Survey
repair (Figure 7). For those who were not sure if their child required more surgery, 44% of the
children had cleft palate only (Figure 7).
Figure 7: Percentage of children needing more surgery to revise oral cleft (n=101): Orofacial
Cleft Family Survey, 2013
While 89.1% of respondents indicated that, besides surgery, their child currently receives, or had
received in the past, follow-up specialty care, 10.9% indicated their child did not receive any follow-up
care related to his/her cleft.
The top three types of care families reported receiving included surgeon for cleft lip/palate (82.7%),
cleft lip/palate team evaluation (77.9%) and ENT (ear, nose, & throat) evaluation or care (75.0%)
(Figure 8). A small percentage of respondents (12.5%) indicated receiving other types of care which
included cardiologist, OT and PT Therapy, eye specialist and sleep specialist (Figure 8). Of note, a
respondent indicated on the survey “There is a strong correlation between cleft patients and sleep
apnea.”

13
Michigan Birth Defects Registry Follow-up Program OFC Family Survey
Figure 8: Types of care received by percentage of children (n=89): Orofacial Cleft Family Survey, 2013
Although 84.2% of respondents reported they were given information about specialists needed for
their child’s care, 15.9% did not receive this type of information. Of these, 6.9% selected “other” and
reported receiving information about specialists through their own research efforts. Referral to
specialists by health professional was assessed by the type of care or evaluation respondents actually
received. Results revealed that referral to services was lowest among those who saw “other”
specialists (76.9%) and highest among those who had a developmental evaluation (88.5%; data not
shown). For those who indicated they received no information about specialists, genetics evaluation
ranked highest for care received (9.1%); none of these respondents saw a feeding/ GI specialist or a
social worker/counselor (data not shown).
Respondents reported they did not get much help with the care coordination for their child with an
oral cleft. Nearly half (47.8%) indicated receiving no help and about 12% indicated getting some help,
but not enough. Only 38.9% of respondents reported getting assistance with managing, planning, and
scheduling specialist appointments for their child (data not shown).
From the survey, clinics that had the most frequently seen children for out-patient cleft care included
University of Michigan Craniofacial Anomalies Program (28.9%), DeVos Children’s Hospital (Grand
Rapids) Oral Cleft Program (21.2%) and Children’s Hospital of Michigan (Detroit Medical Center)
Craniofacial Clinic (19.2%). Overall, most out-patient cleft care is/was received at individual
specialists with separate appointments on a regular basis (36.7%), at a craniofacial clinic seeing many
different specialists (cleft team) in one day (30.0%) or at individual specialists on an as-needed basis
(24.4%; data not shown).

14
Michigan Birth Defects Registry Follow-up Program OFC Family Survey
Thirty percent of respondents indicated that they were not provided with information (for example,
information about the medical, emotional or social needs of children with clefts or information about
the causes of clefts) when their child was born (Table 5). A third (33.3%) also reported that no health
care provider gave them a contact number to call with questions or concerns after leaving the birthing
center (Table 5). However, over 95% of respondents felt it important for new parents to be provided
with such information. Only 44.4% of respondents reported that a professional talked with them about
future expenses and planning how to pay for the medical care of their child with an oral cleft.
The majority (84.4%), however, felt that such information for new parents was important (Table 5).
Table 5: Helpful resources for parents of children with cleft, whether these resources were provided by a
health professional (HP) and perceived importance (n=90): Orofacial Cleft Family Survey, 2013
Resources/Information
Did HP provide? Important for HP to provide
Yes No Not sure Total
Information about children with special needs/causes of clefts
64.4%
30.0%
5.6%
99.0%
Contact number to call with questions/concerns
54.4%
33.3%
12.2%
96.7%
Information about expenses and paying for medical care
44.4%
54.4%
1.1%
84.4%
Approximately 15% of respondents reported that before leaving the birthing hospital, they were not
given or offered a special feeder for their child with an oral cleft (Table 6). In addition, over a quarter
(28.9%) indicated they were not given information on how to get a special feeder (or additional ones)
for their child with an oral cleft before leaving the birthing hospital (Table 6).
Table 6: Percentage of respondents who received special feeding resources provided by a health
professional (HP; n=90): Orofacial Cleft Family Survey, 2013
Special feeding resources
Did HP provide?
Yes No Not sure Not applicable
Special feeder for child with oral cleft
76.7%
14.4%
0.0%
8.9%
Information on how to get a special feeder
60.0%
28.9%
4.4%
6.7%
When asked how the medical expenses for their child with an oral cleft were paid, the majority of
respondents selected Children’s Special Health Care Services (54.8%) or health insurance from their
job (51.9%). The answer option least selected was “other” (1.9%), specified as Shriners Hospital.
15
Michigan Birth Defects Registry Follow-up Program OFC Family Survey
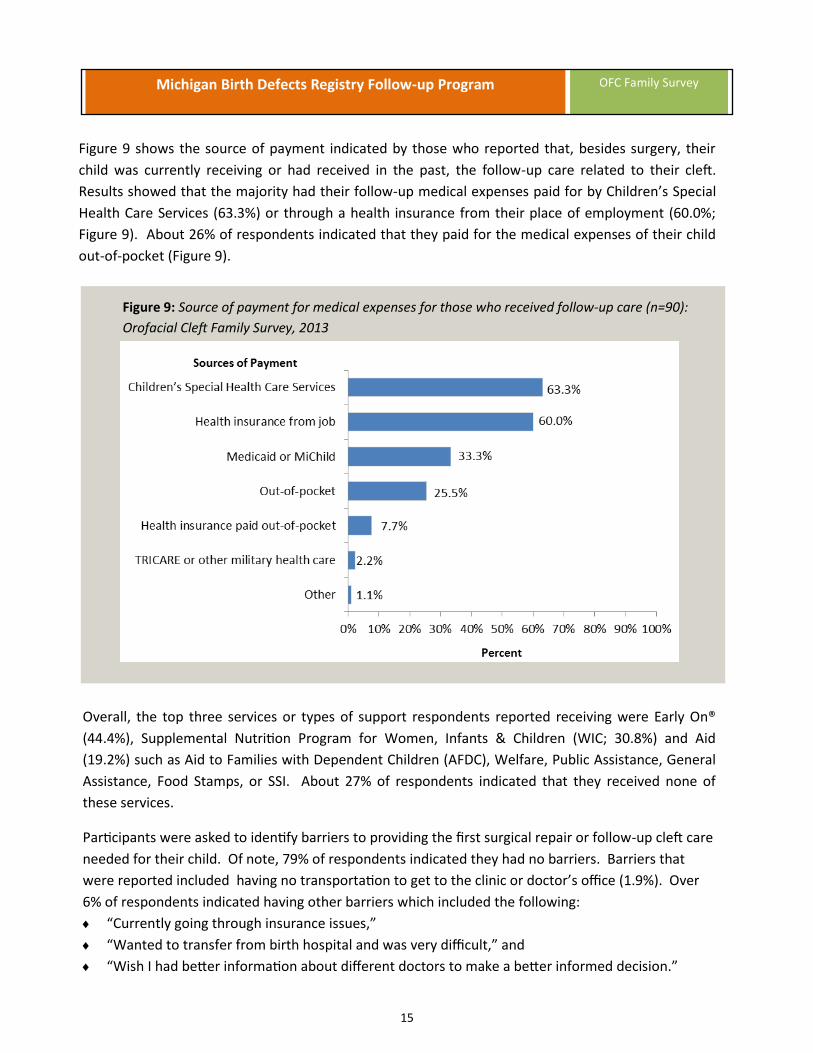
Figure 9 shows the source of payment indicated by those who reported that, besides surgery, their
child was currently receiving or had received in the past, the follow-up care related to their cleft.
Results showed that the majority had their follow-up medical expenses paid for by Children’s Special
Health Care Services (63.3%) or through a health insurance from their place of employment (60.0%;
Figure 9). About 26% of respondents indicated that they paid for the medical expenses of their child
out-of-pocket (Figure 9).
Figure 9: Source of payment for medical expenses for those who received follow-up care (n=90):
Orofacial Cleft Family Survey, 2013
Overall, the top three services or types of support respondents reported receiving were Early On®
(44.4%), Supplemental Nutrition Program for Women, Infants & Children (WIC; 30.8%) and Aid
(19.2%) such as Aid to Families with Dependent Children (AFDC), Welfare, Public Assistance, General
Assistance, Food Stamps, or SSI. About 27% of respondents indicated that they received none of
these services.
Participants were asked to identify barriers to providing the first surgical repair or follow-up cleft care
needed for their child. Of note, 79% of respondents indicated they had no barriers. Barriers that
were reported included having no transportation to get to the clinic or doctor’s office (1.9%). Over
6% of respondents indicated having other barriers which included the following:
“Currently going through insurance issues,”
“Wanted to transfer from birth hospital and was very difficult,” and
“Wish I had better information about different doctors to make a better informed decision.”

16
Michigan Birth Defects Registry Follow-up Program OFC Family Survey
Over 3% of participants reported having other challenges in providing the follow-up cleft care needed
for their child including:
“Despite calling the clinic two times, we were never contacted for follow up care.”
Overall, respondents felt that their child born with an oral cleft was getting the care he or she needed
(92.3%). A small percentage of respondents (2.3%) felt that their child was not getting the care needed
and explanations reported for this included the following:
“Worried about dental/orthodontic work down the road,”
“We live in Port Huron, where there are other children born with clefts... very disappointed in the
lack of local health care specialist that can help,” and
“We now are but we have had a frustrating 2 years.”
Emotional/Social Support
The following section provides a summary of findings related to emotional or social support for
families. The most important source of emotional or social support identified by respondents was
family (78.0%). Other sources of support identified included parent or family support groups (5.0%),
friends’ (5.0%), craniofacial organization (2.0%) and a health care provider or counselor (1.0%). Two
percent of respondents indicated that they had no support.
Overall, 76.5% of respondents reported that they had received the emotional or social support they
needed while 14.3% indicated they had not. Explanations provided by those who had not received
the emotional/social support needed included:
“Family doesn’t always understand because no one has had a cleft kid. Can feel like you're on an
island at times,”
“Family has been supportive but would have liked other support about the emotional aspects of
surgery,”
“I do wish there were more outlets to speak to families effects by clefts. Although family support
is great, I would love to speak to parents that have been through the same thing as me,” and
“We have the support of our family but leaving the hospital we felt very alone and weren't sure
where to begin. Luckily a nurse that was taking care of us at the hospital knew of a family who
had a child with a cleft and gave her our name. She contacted us, which was a big help. We felt
the hospital really dropped the ball with any information or guidance on the cleft.”
According to our survey, 71.2% of respondents indicated they were coping very well with having a
child with special health care needs, and 28.3% indicated they were coping fairly well. Families were
asked a variety of questions about coping with the additional stresses related to having a child with an
oral cleft and the perceived importance of health professionals addressing these issues.

17
Michigan Birth Defects Registry Follow-up Program OFC Family Survey
As shown in Table 7, less than 50% of respondents felt that a health professional addressed three
important issues— ways to cope with their struggles as they care for a child, how having a child with
special health care needs like an oral cleft may affect their family, and information about ways to
contact other families or parent support groups. However, over 70% of respondents felt it was
important for a health professional to address these issues (Table 7).
Table 7: Issues related to having a child with cleft, whether these issues were addressed by a health
professional (HP) and perceived importance (n=99): Orofacial Cleft Family Survey, 2013
Issues
Did HP address?
Important for HP to address
Yes No Not sure Total
Ways to cope with struggles caring for a child with cleft
41.8%
43.8%
14.3%
88.9%
How having a child with special needs may affect family
40.4%
44.4%
15.2%
79.8%
Ways to contact other families/support groups
35.7%
56.1%
8.2%
70.7%
Responses for those who reported that they did not receive the needed emotional or social support
were assessed by how well they were coping with the struggles of caring for a child with an oral cleft
and whether they were given information on coping by a health professional. Only 35.7% of those
indicating they had not received the needed support reported coping very well. Moreover, these
respondents indicated that no health professional talked with them about ways to cope with
struggles they may have as they care for their child with a cleft (Figure 10). Most respondents
indicated they were coping fairly well (64.3%). Half the respondents reported coping fairly well but
did not receive any information about coping strategies and about 14% reported coping fairly well but
were not sure or did not recall receiving information about ways to cope with their struggles (Figure
10).

18
Michigan Birth Defects Registry Follow-up Program OFC Family Survey
Figure 10: Percentage of respondents who did not receive the needed support by how well they were coping
and whether they received information about coping (n=14): Orofacial Cleft Family Survey, 2013
The relationship between having the needed emotional or social support and the ability to cope with
struggles caring for a child with an oral cleft was assessed (Table 8). Results indicated a statistically
significant relationship (p<.0001). Furthermore, results indicated that a greater percentage of
respondents who saw a social worker/counselor (68.6%) had their emotional or social support needs
met.
Table 8: Received social support needed and ability to cope with struggles
(n=97): Orofacial Cleft Family Survey, 2013
Received needed emotional/social support
Ability to cope with struggles
Very well Fair Total
Yes 62 (63.9%) 12 (12.4%) 74 (76.3%)
No 5 (5.2%) 9 (9.3%) 14 (14.4%)
Not sure 3 (3.1%) 6 (6.2%) 9 (9.3%)
Total 70 (72.3%) 27 (27.8%) 97
Although 90.7% of respondents indicated their family did not need help finding any information,
services, or support, about 9% indicated needing help. These, among others included:
“Financial assistance for future surgery.”
“How often should she be seen post-surgery? What kinds of support services are available?”
“We are hoping to get a referral to a different cleft clinic for services and support.”
“Local family support.”

19
Michigan Birth Defects Registry Follow-up Program OFC Family Survey
Respondents were asked if they would like to be contacted by someone from the Birth Defects
Follow-up program. About 25% were unsure at the time, 5.2% indicated they would contact the
program and 8.5% asked to be contacted.
Finally, nearly a quarter of the respondents (22.2%) provided additional information they thought was
important for the Birth Defects program to know. A partial list includes:
“Finding out before child is born helps prepare you, I think versus the surprise of when they are
born.”
“Healthcare providers need to be equipped with information to pass along to families after the
birth of a child with a cleft lip or palate.”
“I think the phone system that was available for parents to connect with other parents was greatly
appreciated since we did not have to pay to talk to other parents. I am not sure if that phone
system is still available for those new moms that could really benefit from it.”
“My daughter was not diagnosed with a cleft palate until she was 6 months old.”
“There is a group called MiCleft that helped with support when I really needed it.”
Discussion
Clefting is more likely to occur in a newborn who has a family history of primary relatives (parents,
siblings) with clefts.5 Researchers have observed that the history of oral clefts in the family is
strongly associated with new occurrences of oral clefts.6 Results from our survey reflected this. This
underscores the importance of referral to genetics. Less than half the respondents were seen by a
genetics specialist. From the survey, it appears more may have been referred, but probably did not
make the appointment. We did not assess whether or not individuals in this cohort had additional
birth defects or genetic syndromes associated with oral clefts. However, some families chose to
share that information with us.
It has been found that about 50% of children with clefts have clefts that involve both the lip and
palate. Another 25% have clefts that involve only the lip and the remaining 25% have clefts that only
affect the palate.7 Survey respondent proportions were quite similar.
Babies with cleft lip and palate will have multiple surgeries during their infancy, childhood and
adolescence. Depending upon the severity of the case, these surgeries can include the initial repair
of the lip and nose (in the first 6 months of life), the palate repair (by 12-18 months of age) and repair
of the cleft in the gum line (between 7 and 9 years of age).5 Thus, families will typically experience
the stress of additional medical appointments, procedures, therapies and bills throughout the
childhood years. At the minimum, one surgery is needed to repair the lip and a separate surgery is
needed to repair the palate. However, several surgeries are needed to make the lip appear as normal
as possible. And sometimes additional surgeries involving the palate are needed to improve speech.7
20
Michigan Birth Defects Registry Follow-up Program OFC Family Survey
Results indicated that children with cleft lip and palate tended to have more surgeries than children
with cleft lip alone or cleft palate alone.
Previous research shows that having more support from friends and family is associated with less
negative family impact, lower psychological distress and better adjustment.8 Survey results suggested
an association between having the needed emotional/social support and the ability to cope with
struggles. Seeing a social worker or counselor also appeared to have a positive impact on having a
respondent’s emotional or social support needs met.
Public Health Impact
Although most families provided positive feedback regarding the needed follow-up care for their
child, information on specialists, services, support, or feeling that their child was getting care, several
gaps were identified.
Results clearly indicated the need for health care professionals to provide new parents with
information and resources related to care coordination such as managing, planning and scheduling
appointments with specialists, financial assistance, coping with potential struggles, a number to call
with questions or contact with other families who had a child with an OFC or support groups. New
parents of children with OFC can benefit from receiving information and assistance beyond
specialized medical care.
The MBDR has the opportunity to increase awareness among health care providers of family needs
and available services.

21
Michigan Birth Defects Registry Follow-up Program OFC Family Survey
References
1. Centers for Disease Control and Prevention. Facts about Cleft Lip and Cleft Palate. Retrieved April 8,
2014 from the World Wide Web at http://www.cdc.gov/ncbddd/birthdefects/cleftlip.html.
2. Schutte B.C, Murray J.C. The Many Faces and Factors of Orofacial Clefts. Human Molecular
Genetics: 1999; Vol. 8, No. 10 Review 1853-1859.
3. U.S. Department of Health and Human Services. The Health Consequences of Smoking: 50 Years of
Progress. A Report of the Surgeon General. Atlanta, GA: U.S. Department of Health and Human
Services, Centers for Disease Control and Prevention, National Center for Chronic Disease Prevention
and Health Promotion, Office on Smoking and Health, 2014. Printed with corrections, January 2014.
4. Butali A1, Little J, Chevrier C, Cordier S, Steegers-Theunissen R, Jugessur A, Oladugba B, Mossey PA.
Folic acid supplementation use and the MTHFR C677T polymorphism in orofacial clefts etiology: An
individual participant data pooled-analysis. Birth Defects Res A Clin Mol Teratol. 2013 Aug;97(8):509-
14. doi: 10.1002/bdra.23133. Epub 2013 May 13.5.
5. Pediatric Plastic Surgery. University of Missouri Children’s Hospital. Cleft lip & Palate. Retrieved
April 8, 2014 from the World Wide Web at http://smilesforkids.missouri.edu/common-conditions/
cleft-lip-palate/.
6. LeiteI I.C.G, Sérgio K. Oral clefts, consanguinity, parental tobacco and alcohol use: a case-control
study in Rio de Janeiro, Brazil. Brazilian Oral Research: Jan./Mar. 2009 São Paulo; Vol.23, No.1.
7. University of Iowa Children’s Hospital. Cleft Palate: Frequently asked questions. Retrieved April 8,
2014 from the World Wide Web at http://www.uichildrens.org/cleft-palate-faqs/.
8. Sarah R. Baker, Jan Owens, Melanie Stern, Derrick Willmot, (2009). Coping Strategies and Social
Support in the Family Impact of Cleft Lip and Palate and Parents' Adjustment and Psychological
Distress. The Cleft Palate-Craniofacial Journal: May 2009; Vol. 46, No. 3, 229-236.

22
Michigan Birth Defects Registry Follow-up Program OFC Family Survey
Suggested Citation:
Quarshie E, Dinh P, Ehrhardt J, Wahl R, McKane P, Mobley M, Copeland G. A Needs Assessment Survey
for Parents of Children with Oral Cleft in Michigan. Lansing, MI: Michigan Department of Health and
Human Services, Lifecourse Epidemiology and Genomics Division. September 2015.