A multifaceted peer reviewed ournal in the ffeld of ... · A multifaceted peer reviewed ournal in...
12
J Young Pharm, 2016; 8(4): 356-367 A multifaceted peer reviewed journal in the field of Pharmacy www.jyoungpharm.org | www.phcog.net Journal of Young Pharmacists, Vol 8, Issue 4, Oct-Dec, 2016 356 Original Article INTRODUCTION Management of hypertension and heart failure with the help of beta- blockers as antihypertensive plays critical role in reduction of cardiac deaths. 1 Novel and highly cardio selective Nebivolol is a better beta- blocker in comparison to other beta-blockers and hence more effective and preferred drug. 2 Along with beta blocker effects, Nebivolol is vaso- dilator, anti-atherosclerotic agent and anti friabilator agent. 3 Hence, it is very useful antihypertensive drug diabetic and systolic hypertensive patients and with known associated vascular diseases. But the oral administration of drug Nebivolol causes gastrointestinal disturbances as well as extensive first pass metabolism and thus faces challenges of poor bioavailability. 4 Hence to reduce first-pass metabolism and improve bio availability lipid-based formulation in the form of micro emulsion is prepared and found promising. 5,6 MATERIALS AND METHODS Pre-formulation Studies Pre-formulation studies are preliminary studies to understand physico- chemical behavior of a new drug and possible hurdles in dosage form development. It generates supportive data for necessary modifications to design, develop and evaluate formulation. Solubility Study of Drug in Oil To select the best oil for preparation of micro emulsion formulation, saturated solubility studies were carried out in different oils, i.e. soya bean oil, castor oil, olive oil, labrafill 1944 and oleic acid etc. Excess amount of drug i.e. Nebivolol added to the 200 mg of each oil in glass vial. en allowed them to solubilize in sonicator for 30 min. 5-7 further mixture containing vials were kept in orbital shaker for 72 hr. to from homogenous mixture. is was done by preparing saturated solutions of the drug in these oils and analyzing their drug content spectrophoto- metrically. Surfactant and Co-Surfactant Screening e final selection aſter solubility analysis was done on the basis of HLB value of co-surfactant. Among all surfactant screened, the highest solu- bilisation capacity was exhibited by Tween 80 (27.8289 mg/mL) followed by Cremophor RH 40 (26.1842 mg/ml) and Labrasol (23.8815 mg/mL). Tween 80 was therefore selected for further investigation, while final selection would rely on emulsification properties with co surfactant mixtures. For solubility studies surfactants and co surfactants were chosen from the GRAS (generally regarded as safe) category. Nonionic surfactants are reported to be less toxic than ionic surfactants. 7,8 Solubility of Nebivolol in various surfactants and co surfactants is given in Figure 2 Optimization of formulation Pseudo ternary phase diagrams were constructed using various combi- nations of ingredients i.e. oil: surfactant: co surfactant. Surfactant and co-surfactant were mixed (S: Co-s) in a ratio S mix (2:1, 1:2, 1:1). In order to get concentration range of component for the existing range of micro emulsion region, oil and S mix were mixed in a 1:9 to 9:1 ratio. Considering turbidity or cloudiness as an end point, pseudo ternary phase diagrams were constructed by water titration method. Pseudo ternary phase diagram is plotted by using Chemix soſtware. 8,9 Aſter 24 h, when mixture formed equilibrium at room temperature then evaluated Solubility Enhancement of Nebivolol by Micro Emulsion Technique Santosh Kale Nemichand 1 and Sharada Deore Laxman 2 1 Department of Pharmaceutical Sciences, ShriJagdish Prasad JhabarmalTibrewala University, Vidyanagari, Jhunjhunu, Rajasthan, INDIA. 2 Department Pharmacognosy, Govt. College of Pharmacy, Amravati, INDIA. ABSTRACT Nebivolol is a third-generation beta-a drenoceptor antagonist. It differs from other beta-a drenoceptor an tagonists as it combines highly selective beta (1)-adrenoceptor antagonist properties with nitric oxide-mediated vasodi- lator actions and beneficial effects on endothelial function. But this very useful drug use is limited due to challenge of poor water solubility (0.0403 mg/ml). Present study deals with enhancement of solubility of Nebivolol by micro emulsion technique. Various oils, surfactants, and co-surfactants were used to check solubility of Nebivolol. Pseudoternary phase diagrams were constructed using various combinations of ingredients i.e. oil: surfactant: co-surfactant. Micro emulsion batches were prepared by phase titration method. Developed micro emulsion was evaluated for various physico- chemical, stability parameters, in-vitro and ex-vivo parameters. Results showed stable micro emulsion form of Nebivolol improved solubility. Keywords: Nebivolol, Pseudo ternary phase diagrams, Micro emulsion, Co-surfactant, S mix . Correspondence : Santosh Kale Nemichand, Department of Pharmaceutical Sciences, Shri Jagdish Prasad Jhabarmal Tibrewala University, Vidyanagari, Jhunjhunu, Rajasthan, INDIA. Phone no: 9766577646 E-mail: [email protected] DOI: 10.5530/jyp.2016.4.11 PICTORIAL ABSTRACT
-
Upload
trinhkhanh -
Category
Documents
-
view
214 -
download
0
Transcript of A multifaceted peer reviewed ournal in the ffeld of ... · A multifaceted peer reviewed ournal in...
J Young Pharm, 2016; 8(4): 356-367A multifaceted peer reviewed journal in the field of Pharmacywww.jyoungpharm.org | www.phcog.net
Journal of Young Pharmacists, Vol 8, Issue 4, Oct-Dec, 2016 356
Original Article
INTRODUCTIONManagement of hypertension and heart failure with the help of beta-blockers as antihypertensive plays critical role in reduction of cardiac deaths.1 Novel and highly cardio selective Nebivolol is a better beta-blocker in comparison to other beta-blockers and hence more effective and preferred drug.2 Along with beta blocker effects, Nebivolol is vaso-dilator, anti-atherosclerotic agent and anti friabilator agent.3 Hence, it is very useful antihypertensive drug diabetic and systolic hypertensive patients and with known associated vascular diseases. But the oral administration of drug Nebivolol causes gastrointestinal disturbances as well as extensive first pass metabolism and thus faces challenges of poor bioavailability.4 Hence to reduce first-pass metabolism and improve bio availability lipid-based formulation in the form of micro emulsion is prepared and found promising.5,6
MATERIALS AND METHODSPre-formulation StudiesPre-formulation studies are preliminary studies to understand physico-chemical behavior of a new drug and possible hurdles in dosage form development. It generates supportive data for necessary modifications to design, develop and evaluate formulation.
Solubility Study of Drug in OilTo select the best oil for preparation of micro emulsion formulation, saturated solubility studies were carried out in different oils, i.e. soya bean oil, castor oil, olive oil, labrafill 1944 and oleic acid etc. Excess amount of drug i.e. Nebivolol added to the 200 mg of each oil in glass vial.
Then allowed them to solubilize in sonicator for 30 min.5-7 further mixture containing vials were kept in orbital shaker for 72 hr. to from homogenous mixture. This was done by preparing saturated solutions of the drug in these oils and analyzing their drug content spectrophoto-metrically.
Surfactant and Co-Surfactant ScreeningThe final selection after solubility analysis was done on the basis of HLB value of co-surfactant. Among all surfactant screened, the highest solu-bilisation capacity was exhibited by Tween 80 (27.8289 mg/mL) followed by Cremophor RH 40 (26.1842 mg/ml) and Labrasol (23.8815 mg/mL). Tween 80 was therefore selected for further investigation, while final selection would rely on emulsification properties with co surfactant mixtures. For solubility studies surfactants and co surfactants were chosen from the GRAS (generally regarded as safe) category. Nonionic surfactants are reported to be less toxic than ionic surfactants.7,8 Solubility of Nebivolol in various surfactants and co surfactants is given in Figure 2
Optimization of formulationPseudo ternary phase diagrams were constructed using various combi-nations of ingredients i.e. oil: surfactant: co surfactant. Surfactant and co-surfactant were mixed (S: Co-s) in a ratio S mix (2:1, 1:2, 1:1). In order to get concentration range of component for the existing range of micro emulsion region, oil and S mix were mixed in a 1:9 to 9:1 ratio. Considering turbidity or cloudiness as an end point, pseudo ternary phase diagrams were constructed by water titration method. Pseudo ternary phase diagram is plotted by using Chemix software.8,9 After 24 h, when mixture formed equilibrium at room temperature then evaluated
Solubility Enhancement of Nebivolol by Micro Emulsion TechniqueSantosh Kale Nemichand1 and Sharada Deore Laxman2
1Department of Pharmaceutical Sciences, ShriJagdish Prasad JhabarmalTibrewala University, Vidyanagari, Jhunjhunu, Rajasthan, INDIA.2Department Pharmacognosy, Govt. College of Pharmacy, Amravati, INDIA.
ABSTRACTNebivolol is a third-generation beta-a drenoceptor antagonist. It differs from other beta-a drenoceptor an tagonists as it combines highly selective beta (1)-adrenoceptor antagonist properties with nitric oxide-mediated vasodi-lator actions and beneficial effects on endothelial function. But this very useful drug use is limited due to challenge of poor water solubility (0.0403 mg/ml). Present study deals with enhancement of solubility of Nebivolol by micro emulsion technique. Various oils, surfactants, and co-surfactants were used to check solubility of Nebivolol. Pseudoternary phase diagrams were constructed using various combinations of ingredients i.e. oil: surfactant: co-surfactant. Micro emulsion batches were prepared by phase titration method. Developed micro emulsion was evaluated for various physico-chemical, stability parameters, in-vitro and ex-vivo parameters. Results showed stable micro emulsion form of Nebivolol improved solubility.
Keywords: Nebivolol, Pseudo ternary phase diagrams, Micro emulsion, Co-surfactant, Smix.
Correspondence :
Santosh Kale Nemichand,
Department of Pharmaceutical Sciences, Shri Jagdish Prasad Jhabarmal
Tibrewala University, Vidyanagari, Jhunjhunu, Rajasthan, INDIA.
Phone no: 9766577646
E-mail: [email protected]
DOI: 10.5530/jyp.2016.4.11
PICTORIAL ABSTRACT

Kale and Deore.: Solubility Enhancement of Nebivolol
Journal of Young Pharmacists, Vol 8, Issue 4, Oct-Dec, 2016 357
for appearance, clarity, viscosity. Stable micro emulsion further also observed under polarizing light to confirm their isotropic nature.
Development of formulationConcentration range of oil and S mix was determined by trial and error method. Firstly the water uptake in the formulation until cloudiness or turbidity observed. Then the percentage transparency was measured. Based on the considerations that high concentration of surfactant could cause toxicity and skin irritation, the percentage of oil and S mix was optimized. Water content is also important to impart highest skin flux and permeability. Hence attention was also given to appropriate water content.10 The quantity oil phase, surfactant and co-surfactant in appro-priate portion was selected based on the result of solubility study and observations of different area of pseudo ternary diagram for each of the group.Finally, water: oil: surfactant: co-surfactant in ratio of 15-20: 35-37: 14-20: 10 was selected to form a stable micro emulsion batches as shown in Table 2.Then trial batches of micro emulsion were prepared by phase titration method. Initially required quantity of Nebivolol was dissolved in appropriate quantity of oil. The mixture was homogenized and to it, accurately weighed quantity of surfactant: co surfactant blends was added in small portion with constant stirring. The blends were mixed thoroughly using magnetic stirrer and to it drop wise double distilled water added with continuous stirring.11
Pharmaceutical evaluation of micro-emulsionAppearancePrepared micro emulsion batches were observed visually for clarity or any sign of precipitation. The appearance of the micro emulsion formu-lations was determined by visual examination of the formulation under light alternatively against white and black backgrounds and turbidity were checked. The test was carried out as described in the United States Pharmacopoeia.12
Optical clarity (Percentage transmittance)In this method, percentage transmittance of each formulation was measured at 650 nm using UV-spectrophotometer against distilled water as blank. Percentage transmittance indicates the homogenous nature and clarity of formulation. Higher percentage transmittance indicates the clarity of micro emulsion as micro emulsion should be optically clear and transparent than the conventional emulsion.12 Results of percentage transmittance are given in Table 8.
Dilutability and dye solubility testIt is also known as the stain test in which a dye is sprinkled onto the surface of the emulsion also indicates the nature of continuous phase. With an o/w emulsion there is rapid incorporation of a water soluble dye into the system where as with w/o emulsion the dye forms microscopi-cally visible clumps. The reverse happens on addition of an oil soluble dye. These tests essentially identify the continuous phase.2,3 drops of water-soluble dye (methylene blue) was added to the micro emulsion formulation and after 5 minute visual observation was done. The Micro emulsion formed were diluted in 1:10, and 1:100, ratios with double distilled water to check if the system shows any signs of separation.13
pH measurementThe excipients used in the formulation decide the pH of the final prepa-ration. Literatures suggest that change in pH may change zeta potential of formulation, which in turn can affect the stability of preparation. Therefore, pH is also responsible for stability of micro emulsion. The pH value of ME was determined using digital pH meter (Equip-Tronics, EQ-610), standardized using pH 4 and 7 buffers before use.13
Viscosity and Surface tensionThe rheological properties of the micro emulsion are evaluated by Brookfield viscometer with spindle SC 3. Viscosity determination confirms whether the system is w/o or o/w. If system has low viscosity then it is o/w type of the system and if a high viscosity then it is w/o type of the system. The surface tension of micro emulsion was measured at 25ºC with a Torsion balance.12,13
Refractive indexThe refractive index of the system was measured by a simple Abbe’s refractometer by placing 1 drop of ME on the slide.12-14
Droplet size distribution and zeta potential DeterminationDroplet size distribution, polydispersity index and zeta potential of the resultant micro emulsion was determined immediately using, Nano Malvern droplet analyzer (UK) and zeta potential analyzer. Poly disperse partials have major hurdles in the drug diffusion they reduce the rate of diffusion of the formulation and also due to polydispersibility, large partials having a low laplas pressure undergoes Ostwald ripening and aggregation of the particle take place in the formulation. Wavelength scattering angle 90ºat 25ºC, average hydrodynamic diameter of the micro emulsion was derived from cumulative analysis by the auto measure software.13,14 Results are summarized in Table 8.
Conductivity measurementThe electrical conductivity of ME was measured with a conductivity meter (Equip-Tronics, EQ-664, Mumbai, India) equipped with an inbuilt magnetic stirrer. This was done by using conductivity cell (with a cell constant of 1.0) consisting of two platinum plates separated by desired distance and having liquid between the platinum plate acting as a conductor. Results are summarized in Table 8. Water is good conductor of electricity than that of the oil when the micro emulsion contain the water in a continuous phase then the value of conductivity is high and it will decreases when oil in continuous phase.14
Entrapment efficiency and drug loadingThe entrapment efficiency of Nebivolol loaded micro emulsion was determined by a centrifugation method. Briefly, 10 µL 0.1 mol/L HCl was added into drug-loaded micro emulsion, followed by centrifugation for 10 min at 20,000 rpm. The supernatant was separated and the pellets were washed thrice with distilled water. The free drug concentration was determined by UV–visible spectro photometric analysis at 238 nm. The entrapment efficiency and drug loading of Nebivolol micro emulsion were calculated as per equations given below.12-14All the measurements were performed in triplicate.Entrapment efficiency (%) = [(Wa–Ws)/Wa]×100Drug loading (%) = [(Wa–Ws)/(Wa–Ws+Wl)]×100whereWa is the amount of drug added to formulation, Ws is the amount of free drug, and Wl is the weight of oil phase. Results are summarized in Table 8.
Drug content estimationMicro emulsion equivalent to 10 mg of Nebivolol was dissolve in suitable quantity of ethanol (100 ml). The samples were mixed thoroughly to dissolve the drug in ethanol and analyzed using Shimadzu 1800A UV visible spectrophotometer at 280 nm.13 Drug content was evaluated by following equation and results are depicted in Table 8.
Absorbance of sampleConcentration of standard
Concentration of sampleAbsorbance of standard

Kale and Deore.: Solubility Enhancement of Nebivolol
358 Journal of Young Pharmacists, Vol 8, Issue 4, Oct-Dec, 2016
Polarizing microscopyBirefringence is the optical property of a material having a refractive index that depends on the polarization and propagation direction of light. These optically anisotropic materials are said to be birefringent (or birefractive). The birefringence is often quantified as the maximum difference between refractive indices exhibited by the material. In order to verify the isotropic nature of ME, samples were examined using cross-polarized light microscopy (Polarizing Microscope Carl Zeiss, model: Axiolabpol, m/s Carl-Zeiss, Germany). A drop of ME was placed between a cover slip and a glass slide and then observed under cross-polarized light.14,15 The samples were examined by ocular inspection in a cross polarizer for sample homogeneity and birefringence.
Morphological analysis of Micro emulsion by SEMThe outer macroscopic structure of the micro emulsion was investigated by Scanning Electron Microscopy with a S4800 TYPE ІІ scanning electron microscope (Hitachi high technologies , Japan), operating at 15kV. The sample was fixed on a SEM-stub using double-sided adhesive tape and then coated with a thin layer of gold. The outer macroscopic structure of the nME as investigated by Scanning Electron Microscopy with a scan-ning electron microscope (FEI, the Netherlands), operating at 15kV. The sample was fixed on a SEM- stub using double-sided adhesive tape and then coated with a thin layer of gold.13-15
In-vitro drug diffusion studyFranz diffusion cell having 10 mm diameter and 16 ml capacity was used to study in-vitro diffusion of micro emulsion. Dialysis membrane (Himedia) of molecular weight of 12000—14000 kDa was used as diffusion mem-brane. Before experiment, pieces of dialysis membrane were soaked in phosphate buffer (PB) pH 6 for 24 hrs. Then phosphate buffer pH 6 was added to diffusion cell to fill it and then dialysis membrane was mounted on cell and attached at the brim of donor compartment with the help of glue to avoid any leakage. Rubbers were used to connect both donor and accepter chamber. After 20 minutes of pre-incubation time, 10 mg of micro emulsion was placed in the donor chamber. Then for next 4 hours, samples were periodically withdrawn from the receptor compartment with simultaneous replacement of same amount of fresh phosphate buffer solution. The withdrawn solutions were further assayed at 280 nm by a spectrophotometer.15,16
Biological EvaluationEx-vivo diffusion study of formulationsBased on all above results of evaluation, N2 batch was selected for the ex-vivo nasal diffusion study by France diffusion cell. Freshly excised sheep nasal mucosa without septum part was obtained from the slaugh-terhouse. This membrane was kept in PBS at pH 6.4 for 15 min to equili-brate. The superior nasal concha of thickness about 0.2 ± 0.5 mm was identified and separated from the nasal membrane. The excised superior nasal membrane was then mounted on a Franz diffusion cell. The tissue was stabilized using phosphate buffer pH 6.0 in both the compartments and allowed to stir for 15 min on a magnetic stirrer with Teflon coated magnetic bar and allow stirring such that the nasal membrane flushes the diffusion fluid. After 15 min, solution from both the compartments was removed and fresh phosphate buffer pH. 6.0 were filled in the receptor compartment. The mounting of the nasal membrane was done using glue at the brim of the donor compartment to avoid leakage of the test sample and supported with rubber crossing over the cell. A volume equivalent to the 10 mg of Nebivolol of each NS, NME, and was placed in the donor compartment of Franz diffusion cell. Samples from the receptor compartment were withdrawn at predetermined time intervals and analyzed using the UV-spectrophotometer method at 280 nm. Each sample removed was replaced by an equal volume of diffusion media
(1 mL). Each study was carried out for a period of 4.0 h, during which the drug in the receiver chamber (µg/mL) across the sheep nasal membrane was calculated at each sampling point. The formulations were studied in triplicate for diffusion studies and the mean cumulative values for % of drug diffused were plotted against time and calculate the diffusion coef-ficients.17,18
Kinetics of Drug ReleaseIn vitro dissolution has been recognized as an important element in drug development. To analysis the mechanism for the release and release rate kinetics of the formulated dosage form, the data obtained from conducted studies was fitted into Zero order, First order, Higuchi matrix, Korsmeyer- Peppas and Hixson Crowell model. (Table 1) In this by comparing the r-values obtained, the best-fit model was selected.19
Nasal ciliary toxicity studiesFor the evaluation of the effect of the components of micro emulsion on the nasal mucosa freshly excised sheep nasal mucosa, except for the septum, was collected from the slaughter house in saline phosphate buffer pH 6.4.Cut three sheep nasal mucosa pieces (S1, S2, and S3) with uniform thickness having a diameter 0.2 ± 0.5 mm were selected and mounted on Franz diffusion cells. And attached with the glue to the rim of the donor compartment.S1 was treated with 0.5 mL of PBS pH 6.4 (negative control), S2 with 0.5 mL of isopropyl alcohol (positive control strong nasal toxic agent), and S3 was treated with NME for 1 h. After 1 h, the mucosae were rinsed with PBS at pH 6.4 and stain with the eosin subjected to histological studies to evaluate the toxicities of ME photo-graphed by optical microscope. Surfactant and cosurfactant use in micro emulsion formulation should not produce any toxic effect on the nasal mucosa. They are (GRAS) generally regarded as a safe and does not produce any nasociliary damage.
Stability StudiesPhysical stability: The optimized formulations, N-2 were subjected to stability testing for periods of 3 months at room temperature simulate patient usage conditions. and Refrigerator condition (4oC) after 3 months of storage, the formulations were examined periodically after 1, 2, and 3 months for physical stability by means of creaming, phase separation, or flocculation, accelerated centrifugation cycle (3000 × g for 15 min).Chemical Stability: The optimized formulations, N-2 were subjected to chemical stability by means of drug content, pH, Viscosity.Thermodynamic stability: These studies included the exposure of prepared Micro emulsion to thermal (both low and high) as well as mechanical stress and observing the effect on homogeneity of Micro emulsion. The test were carried out in two part, Accelerated Stability Tests:Freeze-Thaw Cycles (FTC): To access any change in stability of Micro emulsion they are subjected to stored at 25oC for 24 h and followed by 24 h at -5oC, the cycle is repeated three times and change is noted.Centrifugations test: It included centrifugation of formulations for 30 min at 3500 rpm. Formulations which still remained clear and did not
Table 1: Relationship between the release exponent and mechanism of drug transport
Release Exponent (n) Drug Transport Mechanism
0.45 ≤ n Fickian
0.43 < n = 0.85 Anomalous
0.85 Case-II Transport
Higher than 0.89 Super Case-II Transport
0.45 < n < 0.89 non-Fickian transport
n > 0.89 super case II transport
Kale and Deore.: Solubility Enhancement of Nebivolol
Journal of Young Pharmacists, Vol 8, Issue 4, Oct-Dec, 2016 359
co-surfactant propylene glycol were prepared. (Figure 4-a, b, c) High amount of surfactant and co-surfactants raises issues of safety of micro emulsion and hence wide single-phase comprising formulations were found better. Selected micro emulsion based bathes further optimized using globule size, transparency and zeta potential characteristics.The ratios of oil to the mixture of S/CoS (Smix) were selected 1:9 to 9:1 for construction of each phase diagram. Drop wise dilution of mixtures of oil and S/CoS at certain weight ratios were done with distilled water, under moderate magnetic stirring. The zone of micro emulsion was obtained. Six formulations were then taken from shaded area showed in a phase diagram at random and all the formulations were evaluated to get optimize batch. Tween 80 has high HLB value than PG. When concentration increases incorporation of water can be increased but solubility of drug decreases while by increasing concentration of PG drug solubility increase but incorporation of water decreases. Hence highest micro emulsion area was obtained with ratio of 1:1 and thus selected for further studies. According to the micro emulsion area in the phase diagram, the Nebivolol loaded ME formulations were prepared as per the composition.
Development of FormulationPercentage transparency was found to be 2.5–10% w/w for oil and 70–80% w/w for Smix. It is found that 80 percent of S/Co-s is maximum safe concentration. From pseudo ternary study, surfactant and co-surfactant having 1:1 ratio selected for micro emulsion batches formulation varying the concentration of oil phase. Drug with constant weight (15 mg/ml) was taken and micro emulsion formulation batches were developed and evaluated for various tests. The Nebivolol solution (NS) meant for com-parative evaluation of ME-based systems was prepared by dissolving Nebivolol (150 mg) in a mixture of 8 mL polyethylene glycol, 1 mL water and 1mL ethanol (95%, vol/vol) resulting in a solution of 15 (mg/mL). The prepared formulations were stored in tightly closed glass vials and stored at room temperature (48 hrs). The formulations were observed for any sign for phase separation during this period. From the pseudo ternary diagrams, it was observed that surfactant-co
Pharmaceutical Evaluation of Formulation
AppearanceMicro emulsions were checked for transparency to turbidity. Micro emulsions remained clear on dilution but appeared as transparent yellow colored solution due to presence of oils and surfactants. All the formula-tion found clear and devoid of any sign of precipitation.12
Optical clarity (Percentage transmittance)In this method, percentage transmittance of each formulation was mea-sured at 650 nm using UV-spectrophotometer against distilled water as blank. Percentage transmittance indicates the homogenous nature and
show any phase separation were included in freez thaws cycles. Thermo-dynamic stability study was carried out in order to determine physical stability of the formulations. Repeated heating and cooling cycle lead to screening of formulations which would remain stable on long storage. The formulations were inspected for homogeneity and phase separation upon removal from freezing condition. Results of stability study of formu lations listed in Table 7.
RESULTS AND DISCUSSION
Pre-formulation StudiesPre-formulation studies are preliminary studies to understand physico-chemical behavior of a new drug and possible hurdles in dosage form development. It generates supportive data for necessary modifications to design, develop and evaluate formulation.In order to ascertain the wave-length of maximum absorption (λmax) of the drug, solution of the drug (10 µg/ml) in ethanol was scanned using spectrophotometer within the wavelength region of 400-200 nm against ethanol as blank. The absorption curve showed characteristic absorption maxima at λ max 280 nm for Nebivolol . (Figure 1) Calibration curve for estimation of drug prepared in ethanol as well as phosphate buffer (pH- 6) at 280 nm.
Solubility Study of Drug in OilAmong all screened oils, the highest solubilisation capacity was exhibited by oleic acid (30.72 ± 4.7430) followed by labrafil 1944 (16.7039 ± 1.1145 mg/mL) and castor oil (12.7105 ± 1.28 mg/ml). Therefore, oleic acid was selected for further investigation. Results of solubility are summarized in Figure 2.
Surfactant and Co-Surfactant ScreeningFrom the results of screening studies, it was observed that, Co Surfactant like Transcutol-P, PEG 400 found to have very good solubilising capacity compared to Propylene Glycol. (Figure 3) But as the solubility criteria is not key parameter for selection Propylene Glycol have HLB value ranges from 4–6.and also having a permeability enhancer, selected co-surfactant also show good emulsification with selected oil and Tween 80. Nebivolol was more compatible for emulsification ability with Tween 80 and Propylene glycol, hence Propylene glycol used as co surfactants.
Drug-Polymer InteractionThe spectrum of Nebivolol showed the following functional groups at their frequencies mentioned.The FT-IR spectrum of Nebivolol pure drug was found to be similar to the standard spectrum of Nebivolol. Further drug-excipients com-patibility study was investigated by FTIR spectroscopy. Pure Nebivolol shows major peak at IR spectra revealed no considerable change when compared that of NME formulation proves that there is no interaction between drug and excipients. Drug excipients interaction study is very significant in relation to know compatibility of selected excipients with active drugs. Incompatibility is actually inactivation of active drug due to decomposition or alteration to a less effective physical or chemical form. When mixture of two or more active drugs and excipients are mixed to-gether then chances of interaction with respect to change in appearance, elegance and most important chemistry of each other. To know chemical changes or interactions, generally chromatographic, spectroscopic and thermal analyses are preferred methods.
Optimization of Micro emulsionPseudo-ternary phase diagrams were constructed using water titration method to find out the exact concentration range of components to get stable micro emulsion. 2:1, 1:2 and 1:1 ratio of surfactant tween 80 and
Characteristicspeaks(cm-1)
Group Responsible
3650 -OH stretching for alcoholic and phenolic
3400 -NH stretching for amide
2870 Aliphatic–CH stretching
2380 -NH stretching
1879 Aromatic C=O stretching
1575 -NH bending
1220 C=O stretching
1020 CO ester streching

Kale and Deore.: Solubility Enhancement of Nebivolol
360 Journal of Young Pharmacists, Vol 8, Issue 4, Oct-Dec, 2016
clarity of formulation. All formulation showing transmittance in the range 98–100% (Table 8) and were found to be optically clear and trans-parent. High transparency is due to the droplet are much smaller than the optical wavelength of visible spectrum.13,14
Dilutability and dye solubility test2–3 drops of water-soluble dye (methylene blue) was added to the micro emulsion formulation and after 5 minute visual observation was done. Water-soluble dye such as methylene blue or amaranth is when added to emulsion and if drop is observed under microscope, background looks blue/red and globule appears colorless shows water in oil emulsion.12,15 Generally external phase either the oil or the aqueous phase in the micro emulsion preparation is used to dilute micro emulsion. Hence, in case of o/w system the micro emulsion can be diluted with the aqueous phase while with w/o micro emulsion the system is diluted with the oil used. The Micro emulsion formed were diluted in 1:10, and 1:100, ratios with double distilled water to check if the system shows any signs of separa-tion. No trial batches showed any signs of separation. Stain test showed water in oil micro emulsion.
pH measurementThe pH of the formulation not only affects the stability of the emulsions but also alters the solubility and bioavailability of the drug through micro emulsion at the site of permeation.13 The pH value of ME was determined using digital pH meter (Equip-Tronics, EQ-610), standardized using pH 4 and 7 buffers before use. The pH of all the ME ranged between 5.5 and 6.5, (Table 8) approximating the normal pH ranges of nasal fluids, which is one of the formulation considerations that may help reducing the irritation produced upon instillation. pH of NME-2 was found 6.1± 0.05
Viscosity and Surface tensionRheological properties impact at all stages of material use across multiple industries—from formulation development and stability to processing and product performance. The type of rheometer required for measuring these properties is often dependent on the relevant shear rates and time-scales as well as sample size and viscosity. The rheological properties of the micro emulsion are evaluated by Brookfield viscometer. The surface tension of micro emulsion was measured at 25ºC with a Torsion balance. It was observed that the viscosity of the ME formulations generally was very low. (Table 8) This was expected, because one of the characteristics of ME formulations is of a lower viscosity. Micro emulsion NME-2 shows low viscosity value of 110 ± 2.51cp respectively, Low viscosity of the formulation indicates that formulation is o/w type and having Newtonian flow ensure easy handling, packing, and hassle-free nasal administration of formulations. The surface tension data implies water-in-oil micro emulsions because surface tension amounts of MEs are nearby to oil phase surface tension.14,15
Refractive indexThe refractive index of the system was measured by a simple Abe’s refract meter. The refractive index of the systems was found to be in range 1.40 ± 0.53 to 1.41 ± 0.7637. It reflect the micro emulsion appear nearly transparent in the visible spectrum and exhibit very little scattering having a low refractive index.12,13
Droplet size distribution and zeta potential DeterminationMeasuring particle size distributions and understanding how they affect products and processes can be critical to the success of many manufac-turing businesses. Zeta potential (ZP) is a measure of the magnitude of the electrostatic or charge repulsion/attraction between particles, and is one of the fundamental parameters known to affect stability. It has been suggested that ZP may serve as a partial indicator for the physical stability of the emulsion being formed.13,14 High absolute ZP values (± 30 mV)
Figure 1: UV Spectrum of Nebivolol in ethanol at 280 nm.
Figure 3: Solubility of Nebivolol in various surfactants and co surfactants.
Figure 2: Solubility of Nebivolol in various oils.

Kale and Deore.: Solubility Enhancement of Nebivolol
Journal of Young Pharmacists, Vol 8, Issue 4, Oct-Dec, 2016 361
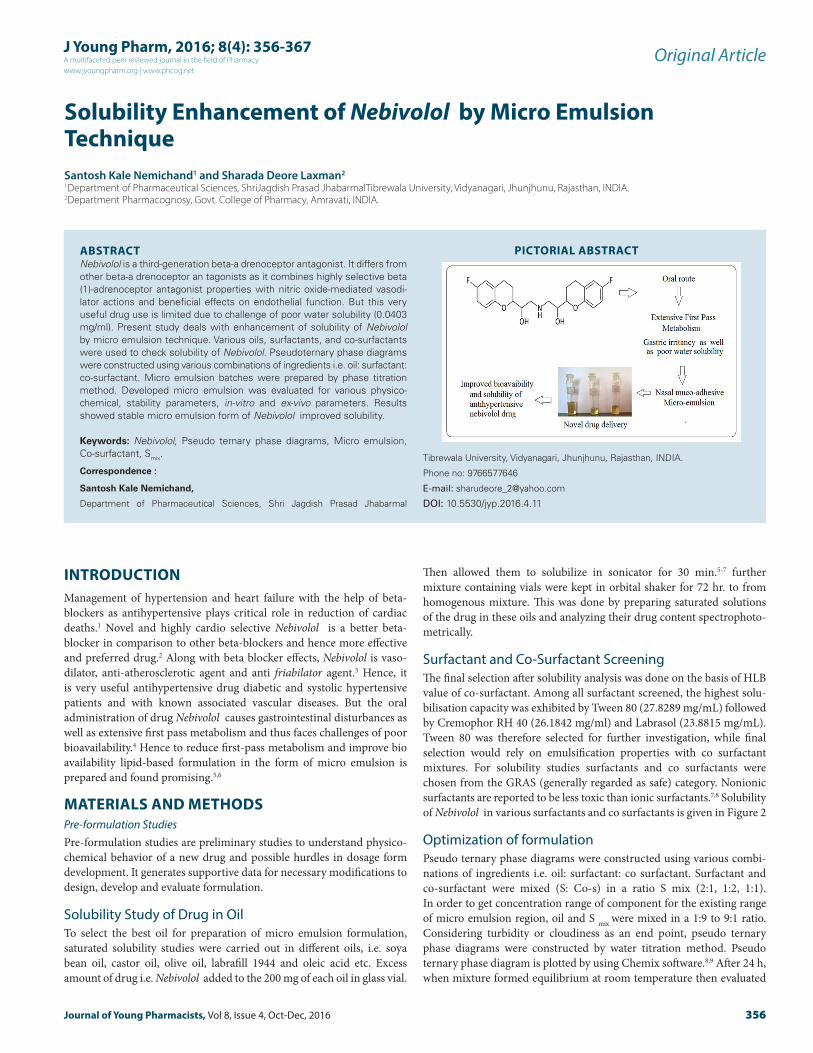
appeared completely dark when observed under a cross polarizer. The observations (Figure 11) indicated that the NME formulations were optically isotropic colloidal dispersions.
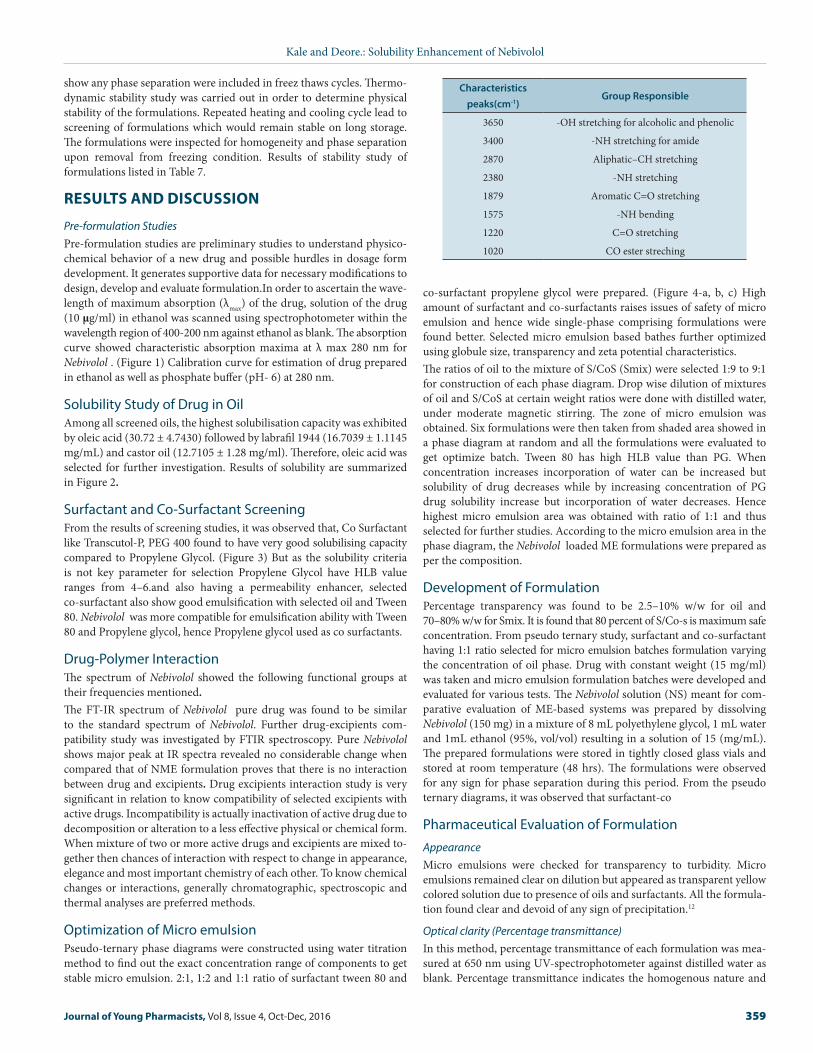
Morphological analysis of Micro emulsion by SEMElectron Microscopy is the most important technique for the study of microstructures of micro emulsions because it directly produces images at high resolution and it can capture any co-existent structure and micro-structural transitions. The surface morphology of the particle in the micro emulsion is an important characteristic the particles in the micro emulsion should be spherical in shape.and the particle without tail, due to the tailing of particle micro emulsion shows hazy appearance. The Surface morphology of NME was studied using SEM.14–16 The image of N-2 as shown in Figure 12 show well separated particles with no agglomeration as compared to other batches. In addition to particle size, particle shape can also have a significant impact upon the performance and process handling of many particulate materials. Examples where particle shape measurements can be used to improve product performance include; Bioavailability of drug particles in tablets and suspensions. Spherical shape particle, without tailing indicates the uniformity of the particle size. In addition, SEM images revealed the absence of crystalline structure of Nebivolol in Micro emulsion formulation.
In-vitro drug diffusion studyDialysis membrane (Himedia), 200 μm in thickness, pH 5.8 to 8 and porosity 2.4 nm was used as an artificial membrane and Franz diffusion cell having 10 mm diameter and 16 ml capacity for preliminary in-vitro studies because of simplicity, homogeneity and uniformity. Results shows maximum diffusion in case of N-2 micro emulsion (94.1%) because the globule size is very small and having greater surface area of particles as compare to other batch. Therefore, batch (NME-2) selected for the Ex-vivo permeation study and comparison with the Nebivolol drug solution. Micro emulsions having least globule size are expected to have larger surface area and therefore, may get absorbed or may transverse rapidly across the gastric mucosa. Moreover, literature citation revealed that micro emulsion which are negatively charged and having zeta potential -30 mV or less exhibits moderate to excellent physical stability. Therefore, both the selection criteria were used as a filter for further studies.15–16
Biological Evaluation
Ex-vivo diffusion study of formulationsN2 batch was selected for the ex-vivo nasal diffusion study by France diffusion cell. From this study, it can be concluded that the extent of diffusion of Nebivolol from the micro emulsion is greater i.e. 86.67 % than the plain solution i.e. 68.01 %, which may be due to the penetration enhancing effect of surfactant and co-surfactant present within the micro emulsion formulation, aiding passage of the drug molecule through the intestinal membrane. The rather small globule size of the micro emul-sion formulation can also help this matter. Overall, the micro emulsion
should preferably be achieved in most of the emulsions prepared in order to ensure the creation of a high-energy barrier against coalescence of the dispersed droplets. Particle size, PDI and zeta potential are the important characteristics of the micro emulsion. Micro emulsion generally has a low particle size (< 200 nm) as compare to the emulsions. PDI of the particle should be less than 0.5 which indicate the prepared partials are mono disperse. Poly disperse partials have major hurdles in the drug diffusion they reduce the rate of diffusion of the formulation and also due to polydispersibility, large partials having a low laplas pressure under-goes Ostwald ripening and aggregation of the particle take place in the formulation.15–16 Optimized batch shows PDI 0.258 which is below 0.5 with good interpretation. (Table 8, Figure 5-10)Particle size analysis of six preparations showed that the size range lied between 149.8 to 193.9. PDI of N-1 to N-4 was found below 0.5 but N-4 and N-5 showed PDI more than 0.5.Zeta potential values found that formulation N-1 to N-6 were within the ideal range of -10 to -30 mV.
Conductivity measurementThe electrical conductivity of ME was measured with a conductivity meter (Equip-Tronics, EQ—664, Mumbai, India) equipped with an inbuilt magnetic stirrer.16 This was done by using conductivity cell. NME-2 shows (Table 8) the conductivity measurements value 178 (ms/cm) indi-cate the water in a continuous phase and ME to be of oil-in-water type.
Entrapment efficiency and drug loadingEntrapment efficiency of drug depends on the method of preparation, HLB values, chemical structure of the surfactant which is related to the length of the alkyl chain is also governs the entrapment efficiency, surfactants of longer saturated alkyl chains shows higher entrapment efficiency.14,15 Hence, use of Tween 80 expects same entrapment efficiency in this research work. The entrapment efficiency of Nebivolol loaded micro emulsion was determined by a centrifugation method. Results are summarized in Table 8. The results of assay revealed suitability of the system for high entrapment of drug in the internal phase.
Drug content estimationMicro emulsion equivalent to 10 mg of Nebivolol was dissolve in suitable quantity of ethanol (100 ml). The samples were mixed thoroughly to dissolve the drug in ethanol and analyzed using Shimadzu 1800A UV visible spectrophotometer at 280 nm.13–14 Drug content was found to in range of 97.35%-99.81 % during estimation. (Table 8) Optimized batch N2 showed 99.24% of drug content.
Polarizing microscopyPolarized light is a contrast-enhancing technique that improves the quality of the image obtained with birefringent materials when compared to other techniques such as dark field and bright field illumination, differ-ential interference contrast, phase contrast, Hoffman modulation contrast, and fluorescence.15 In order to verify the isotropic nature of ME, samples were examined using cross-polarized light microscopy. The NME
Table 2: Composition of Trial batches for Nebivolol micro emulsion
Formulationcode
Drug(mg/ml)
Oil(oleicacid)
Surfactant(tween 80)
Co- surfactant (propylene glycol)
Water
N1 15 10 37 37 16
N2 15 10 36 36 18
N3 15 10 35 35 20
N4 15 12 35 35 18
N5 15 12 36 36 16
N6 15 12 37 37 14

Kale and Deore.: Solubility Enhancement of Nebivolol
362 Journal of Young Pharmacists, Vol 8, Issue 4, Oct-Dec, 2016
Figure 4 (a): Pseudoternary phase diagrame of oil(Oleic acid),surfactant(Tween 80),cosurfactant (PG) And Water System.a) Oleic acid + Tween 80:PG = (2:1) + Waterb) Oleic acid + Tween 80:PG = (1:2) + Waterc) Oleic acid + Tween 80:PG = (1:1) + Water
Figure 5 (a): Partical Size and Pdi of Batch N 1. Figure 6(a): Partical Size and Pdi of Batch N 2.
Figure 6 (b): Zeta Potential and Conductivity of optimized Batch N-2.Figure 5 (b): Zeta Potential and Conductivity of optimized Batch N-1.
formulation showed a higher extent of absorption than the plain drug solution. The sustained profile of drug release observed may be due to the fact that drug is present within the oil phase and hence has a higher partition coefficient.17
In ex-vivo diffusion studies of Nebiolol formulations, the recorded successful diffusion through sheep nasal mucosa and the results obtained are pre-sented in Figure 13 and the calculated diffusion coefficients are tabulated in Table 3 and 4 along with the regression coefficients (r2) for first-order, Higuchi, and zero order modeling of the diffusion profiles for each formulation. The decreasing order of diffusion coefficient for the tested formulations was NS < NME (N2). The NME exhibited a higher diffu-
sion due to the presence of oleic acid, tween 80, and PG as a permeation enhancer probably due to its intrinsic character.
Kinetics of Drug ReleaseTo study the release kinetics, data obtained from in vitro drug release studies were plotted as cube root of drug percentage remaining in matrix versus time. The N2 batch showed Higuchi model as best fit model. By using Korsmeyar and Peppas equation, the value n, were obtained 0.4503. (Table 3, 4 and 5) This value is characteristics of Anomalous kinetics (Non Fickian transport). The curve fitting results of the release

Kale and Deore.: Solubility Enhancement of Nebivolol
Journal of Young Pharmacists, Vol 8, Issue 4, Oct-Dec, 2016 363
Figure 7 (a): Partical Size and Pdi of Batch N 3. Figure 9 (a): Partical Size and Pdi of Batch N 5.
Figure 7 (b): Zeta Potential and Conductivity of optimized Batch N-3. Figure 9 (b): Zeta Potential and Conductivity of optimized Batch N-5.
Figure 8 (a): Partical Size and Pdi of Batch N 4. Figure 10 (a): Partical Size and Pdi of Batch N 6.
Figure 8 (b): Zeta Potential and Conductivity of optimized Batch N-4. Figure 10 (b): Zeta Potential and Conductivity of optimized Batch N-6.
Kale and Deore.: Solubility Enhancement of Nebivolol
364 Journal of Young Pharmacists, Vol 8, Issue 4, Oct-Dec, 2016
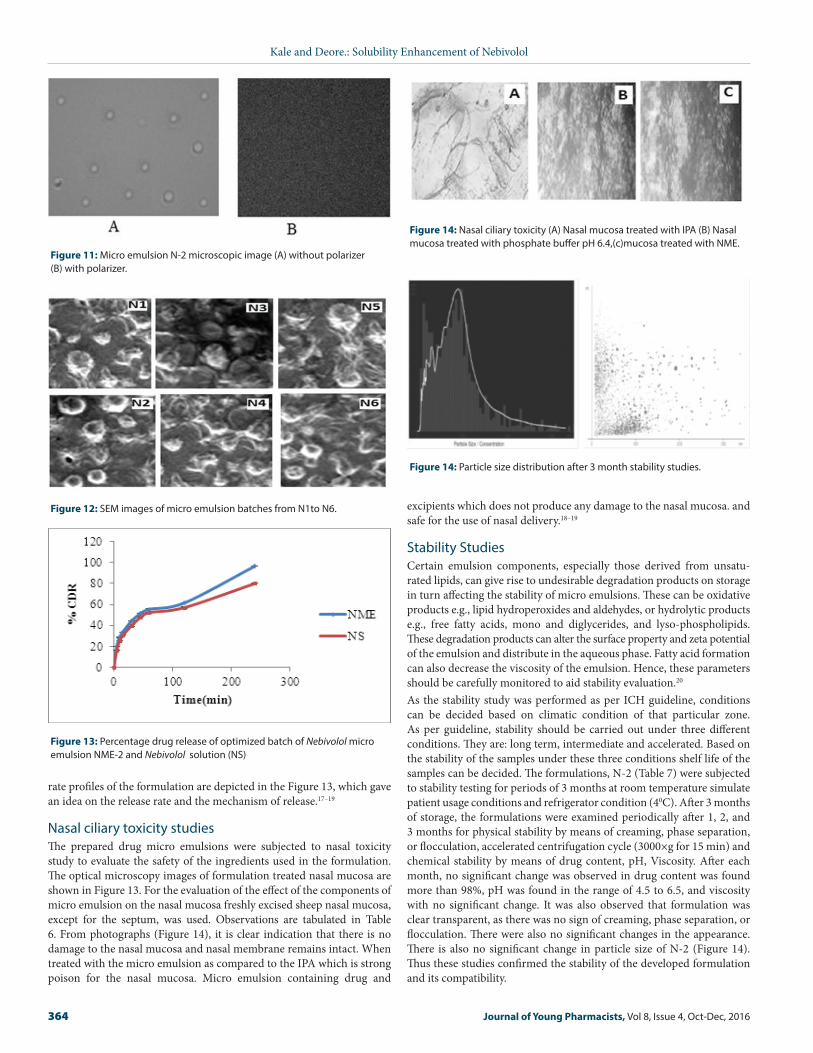
rate profiles of the formulation are depicted in the Figure 13, which gave an idea on the release rate and the mechanism of release.17–19
Nasal ciliary toxicity studiesThe prepared drug micro emulsions were subjected to nasal toxicity study to evaluate the safety of the ingredients used in the formulation. The optical microscopy images of formulation treated nasal mucosa are shown in Figure 13. For the evaluation of the effect of the components of micro emulsion on the nasal mucosa freshly excised sheep nasal mucosa, except for the septum, was used. Observations are tabulated in Table 6. From photographs (Figure 14), it is clear indication that there is no damage to the nasal mucosa and nasal membrane remains intact. When treated with the micro emulsion as compared to the IPA which is strong poison for the nasal mucosa. Micro emulsion containing drug and
excipients which does not produce any damage to the nasal mucosa. and safe for the use of nasal delivery.18–19
Stability StudiesCertain emulsion components, especially those derived from unsatu-rated lipids, can give rise to undesirable degradation products on storage in turn affecting the stability of micro emulsions. These can be oxidative products e.g., lipid hydroperoxides and aldehydes, or hydrolytic products e.g., free fatty acids, mono and diglycerides, and lyso-phospholipids. These degradation products can alter the surface property and zeta potential of the emulsion and distribute in the aqueous phase. Fatty acid formation can also decrease the viscosity of the emulsion. Hence, these parameters should be carefully monitored to aid stability evaluation.20
As the stability study was performed as per ICH guideline, conditions can be decided based on climatic condition of that particular zone. As per guideline, stability should be carried out under three different conditions. They are: long term, intermediate and accelerated. Based on the stability of the samples under these three conditions shelf life of the samples can be decided. The formulations, N-2 (Table 7) were subjected to stability testing for periods of 3 months at room temperature simulate patient usage conditions and refrigerator condition (40C). After 3 months of storage, the formulations were examined periodically after 1, 2, and 3 months for physical stability by means of creaming, phase separation, or flocculation, accelerated centrifugation cycle (3000×g for 15 min) and chemical stability by means of drug content, pH, Viscosity. After each month, no significant change was observed in drug content was found more than 98%, pH was found in the range of 4.5 to 6.5, and viscosity with no significant change. It was also observed that formulation was clear transparent, as there was no sign of creaming, phase separation, or flocculation. There were also no significant changes in the appearance. There is also no significant change in particle size of N-2 (Figure 14). Thus these studies confirmed the stability of the developed formulation and its compatibility.
Figure 11: Micro emulsion N-2 microscopic image (A) without polarizer (B) with polarizer.
Figure 12: SEM images of micro emulsion batches from N1to N6.
Figure 14: Particle size distribution after 3 month stability studies.
Figure 14: Nasal ciliary toxicity (A) Nasal mucosa treated with IPA (B) Nasal mucosa treated with phosphate buffer pH 6.4,(c)mucosa treated with NME.
Figure 13: Percentage drug release of optimized batch of Nebivolol micro emulsion NME-2 and Nebivolol solution (NS)

Kale and Deore.: Solubility Enhancement of Nebivolol
Journal of Young Pharmacists, Vol 8, Issue 4, Oct-Dec, 2016 365
Table 3: Values of n (exponent for release kinetics)
FormulationCode
Korsmeyer-Peppas
Transport MechanismR Release Exponent (n)
N2 0.9968 0.4503 Anomalous kinetics (Non-Fickian diffusion)
NS 0.9909 0.5293 Anomalous kinetics (Non-Fickian diffusion
Table 4: Mathematical Models fitting for N-1 to N-6 Batch
Formulation code
Mathematical Models (Kinetics)
Best fit modelZero order First order Higuchi model Korsmeyerpeppas Hixson Crowell
R R R R n R
N1 0.8862 0.5554 0.9980 0.9827 0.5768 0.7205 Higuchi model
N2 0.8971 0.5426 0.9968 0.9989 0.4513 0.7194 Peppas model
N3 0.8728 0.5529 0.9950 0.9821 0.5635 0.7124 Higuchi model
N4 0.8638 0.5275 0.9958 0.9976 0.4609 0.6887 Pepas model
N5 0.8906 0.5549 0.9886 0.9692 0.6010 0.7215 Higuchi model
N6 0.8981 0.5527 0.9972 0.9950 0.4889 0.7261 Higuchi model
Table 5: Mathematical models fitting for NME (N2) and NS
Formulationcode
Mathematical Models (Kinetics)
Best fit modelDiffusioncoefficient
Zeroorder
Firstorder
Higuchimodel
KorsmeyerpeppasHixsonCrowell
(cm2/sec) R R R R n R
N26.824.79×10–5
±0.1380×10–50.9087 0.5499 0.9989 0.9968 0.4503 0.7322 Higuchi model
NS7.1656×10–5
±.03656×10–50.8851 0.5278 0.9909 0.9852 0.5293 0.7145 Higuchi model
Table 6: Results of Nasal ciliotoxicity study
Sr.no. Nasal mucosa treated with Observation
A Iso propyl alcohol Damage to the nasal mucosa
B 6.4 phosphate buffer No damage
C NME (N-2) No damage
Table 7: Results of physical and chemical stability studies parameters for N-2
ParameterPeriod
Initial 1 month 2 month 3 month
Physical appearance No change No change No change No change
Drug content 99.24 + 1.46 99.20 ± 1.023 98.22 ± 0.83 98.21 ± 0.69
pH 6.2± 0.12 6.2±0.12 6.2 ±0.22 6.2±0.73
Viscosity 110± 0.32 110±0.48 112± 1.08 113±0.72

Kale and Deore.: Solubility Enhancement of Nebivolol
366 Journal of Young Pharmacists, Vol 8, Issue 4, Oct-Dec, 2016
CONCLUSIONThus finally it can be concluded that the developed micro emulsion sys-tem is a promising tool for nasal delivery of most popular antihyperten-sive (beta blocker with vasodialation action) Nebivolol. Thus, despite of effectiveness of micro emulsion-based delivery system for improvement of solubility and bioavailability of Nebivolol, benefits to the risk ratio of the developed formulation via clinical investigation will only decide its suitability in the actual clinical practice.
ACKNOWLEDGEMENT None.
CONFLICT OF INTERESTThe authors declare that this paper content has no conflict of interests.
REFERENCES1. Tripathi KD. Essential of Medical Pharmacology. 3rd edition. Jaypee Bothers
Medical Publishers (Pvt) Ltd, New Dehli. 1998.2. Gielen W, Cleophas TJ, Agrawal R. Nebivolol : a review of its clinical and pharma-
cological characteristics. Int J Clin Pharmacol Ther. 2006;44(8):344-57.3. Fongemie J, Felix-Getzik E. A Review of Nebivolol Pharmacology and Clinical
Evidence. Drugs. 2015;75(12):1349-71.4. Fisker FY, Grimm D, Wehland M. Third-generation beta-adrenoceptor antago-
nists in the treatment of hypertension and heart failure. Basic Clin Pharmacol Toxicol. 2015;117(1):5-14.
5. Robert O. Williams III, Alan B. Watts, Dave A. Miller. Formulating Poorly Water Soluble Drugs. Springer Science & Business Media. 2011.
6. Varshney HM, Chatterjee A. Solubility enhancement of poorly hydrophilic drugs by using Different newer techniques: a review. International Journal of Thera-peutic Applications. 2012;6(8):13.
7. Rowe RC, Sheskey PJ, Weller PJ, editors. Handbook of pharmaceutical excipi-ents. London: Pharmaceutical press; 2006.
8. Syed HK, Peh KK. Identification of phases of various oil, surfactant/ co-surfactants and water system by ternary phase diagram. Acta Pol Pharm. 2014;71(2):301-9.
9. Moghimipour E, Salimi A, Karami M, Isazadeh S. Preparation and characteri-zation of dexamethasone micro emulsion based on pseudoternary phase dia-gram. Jundishapur J Nat Pharm Prod. 2013;8(3):105-12.
10. Patel RB,Mrunali R, Patel B, Kashyap K. Bhatt B. Formulation consideration and characterization of micro emulsion drug delivery system for intransnasal administration of carbamazepine,Bulletin of Faculty of Pharmacy Cairo University. 2013;51(2):243-53.
11. Kamboj S, & Rana V. Formulation optimization of aprepitant microemulsion-loaded silicated corn fiber gum particles for enhanced bioavailability. Drug development and Industrial Pharmacy. 2016;42(8):1267-82.
12. Podlogar F, Gasperlin M, Tomsic M, Jamnik A, Rogac MB. Structural charac-terisation of water-Tween 40/Imwitor 308-isopropyl myristatemicro emulsions using different experimental methods. Int J Pharm. 2004;276(1-2):115-28.
13. Alany RG, Tucker IG, Davies NM, Rades T. Characterizing colloidal structures of pseudo ternary phase diagrams formed by oil/water/amphiphile systems. Drug Dev Ind Pharm. 2001;27(1):31-8.
14. Zhu Y, Zhang J, Zheng Q, Wang M, Deng W, Li Q et al. In vitro and in vivo evalu-ation of capsaicin-loaded micro emulsion for enhanced oral bioavailability. J Sci Food Agric. 2015;95(13):2678-85.
15. Hintzen F, Perera G, Hauptstein S, Müller C, Laffleur F, Bernkop-Schnürch A. In vivo evaluation of an oral self-micro emulsifying drug delivery system (SMEDDS) for leuprorelin. Int J Pharm. 2014;10-472(1-2):20-6.
16. Eskandar Moghimipour, Anayatollah Salimi, Soroosh Eftekhari. Design and Characterization of Micro emulsion Systems for Naproxen. Adv Pharm Bull. 2013;3(1):63-71.
17. Tandel H, Raval K, Nayani A, Upadhay M. Preparation and evaluation of cilnidipine micro emulsion. J Phar m Bio allied Sci.2012;4(Suppl 1):S114-5.
18. Hosny KM, Hassan AH. Intranasal in situ gel loaded with saquinavir mesylate nano sized micro emulsion: preparation, characterization, and in vivo evaluation. Int J Pharm. 2014;475(1-2):191-7.
19. Shah BM, Misra M, Shishoo CJ, Padh H. Nose to brain micro emulsion-based drug delivery system of rivastig mine: formulation and ex-vivo characterization. Drug Deliv. 2015;22(7):918-30.Ta
ble
8: S
umm
ary
of R
esul
ts o
f Phy
sico
chem
ical
Eva
luat
ion
of M
icro
em
ulsi
on B
atch
es
Code
%Tr
ansm
ittan
cepH
Visc
osit
y(c
p)
Part
icle
Size
(r.nm
)PD
IZe
tapo
tent
ial
Cond
uctiv
ity
Dru
gco
nten
t%
Dru
g lo
adin
g (%
)In
-vitr
o di
ffus
ion
stud
yat
240
Min
Ex v
ivo
diff
usio
n st
udy
at 2
40 M
in
N1
99.6
0 ±
0.25
6.1
± 0.
026
129
± 1.
7219
3.9
0.45
5-1
6.2
0.19
499
.81
± 0.
175
71.1
2 ±
0.05
--
N2
99.4
5 ±
0.1
6.2
± 0.
1211
0 ±
2.51
149.
80.
258
-16.
00.
178
99.2
4 ±
0.70
80.2
3 ±
0.08
92.6
786
.67±
2.31
N3
99.2
5 ±
0.30
5.9
± 0.
1611
5 ±
0.23
179.
70.
278
-16.
40.
201
98.2
2 ±
1.92
76.3
0 ±
0.21
--
N4
99.4
5 ±
0.3
5.5
± 0.
4111
2 ±
1.02
188.
40.
478
-15.
50.
188
97.3
5 ±
0.68
75.5
1 ±
0.92
--
N5
99.7
5 ±
0.10
6.1
± 0.
21
115
± 1.
7419
2.9
0.85
8-1
8.5
0.18
899
.32
± 0.
5870
.44
± 0.
61-
-
N6
98.8
8 ±
0.12
6.5
± 0.
1411
5 ±
0.67
193.
70.
575
19.0
0.16
099
.37
± 1.
1969
.64
± 0.
34-
-

Kale and Deore.: Solubility Enhancement of Nebivolol
Journal of Young Pharmacists, Vol 8, Issue 4, Oct-Dec, 2016 367
ABBREVIATIONS USEDBCS: Biopharmaceutics Classification System, ME: Microemulsion, N: Nebivolol, PG: Propylene glycol, NME: Nebivolol Microemulsion, NS: Nebivolol solu-tion, Smix: Ratios of oil to Surfactant and co-surfactant mixture, DDS: Drug Delivery System, HLB: Hydrophilic lipophilic balance, GRAS: Generally regarded as a safe, PDI: Polydispersibility Index, ZP: Zeta potential, SEM: Scanning electron microscopy, FT-IR: Fourier transform-infrared, UV-Vis: Ultra violet visible spectroscopy.
ABOUT AUTHORSDr. S. L Deore: Is working as Assistant Professor in Govt. College of Pharmacy, Amravati. She has published 03 books and more than 50 research papers. She has filed 02 Indian patents. She has fetched CAYT award and RPS grant by AICTE. Her areas of research are intellectual property rights and traditional medicine, isolation and structural elucidation of phytochemicals, neutraceutical development, and traditional medicine screening, chromatographic and phytochemical analysis of extracts. Recently she has transferred technology of taste masking for one of popular mushroom nutraceutical.