A Multi-Tiered Decision-Making Framework for Emotional and ...
65
A Multi-Tiered Decision-Making Framework for Emotional and Behavioral Health Nathaniel von der Embse, Ph.D., NCSP University of South Florida Jennifer Francisco, M.Ed., BCBA Laura Rutherford, Ph.D., NCSP Devereux Center for Effective Schools
Transcript of A Multi-Tiered Decision-Making Framework for Emotional and ...
A Multi-Tiered Decision-Making Framework for Emotional and Behavioral Health Nathaniel von der Embse, Ph.D., NCSPUniversity of South Florida
Jennifer Francisco, M.Ed., BCBALaura Rutherford, Ph.D., NCSPDevereux Center for Effective Schools
Objectives
• Identify three challenges encountered by an urban school integrating universal screening with an existing SWPBIS framework
• Describe important components of teacher training for behavioral and mental health screening, and effective classroom management strategies
• Identify specific activities necessary to sustain and scale a Tier I and Tier II mental and behavioral health assessment to intervention program
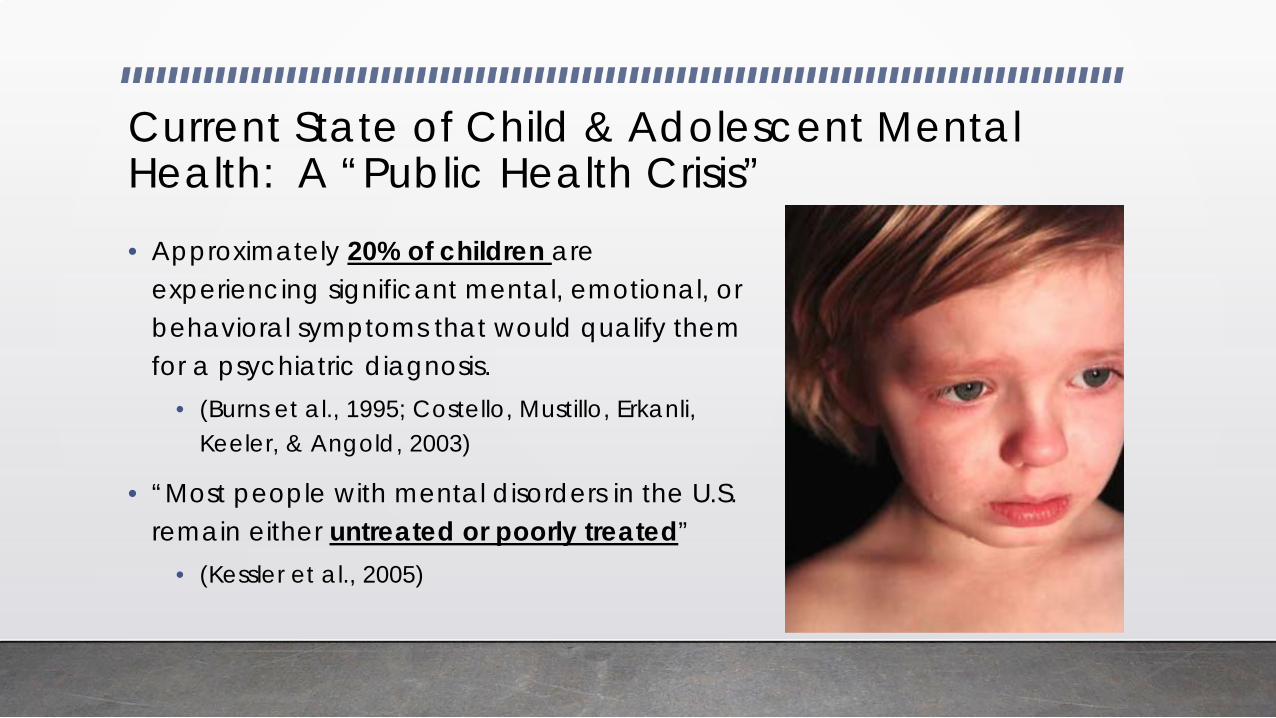
Current State of Child & Adolescent Mental Health: A “Public Health Crisis”• Approximately 20% of children are
experiencing significant mental, emotional, or behavioral symptoms that would qualify them for a psychiatric diagnosis.
• (Burns et al., 1995; Costello, Mustillo, Erkanli, Keeler, & Angold, 2003)
• “Most people with mental disorders in the U.S. remain either untreated or poorly treated”
• (Kessler et al., 2005)

Social-Emotional & Behavioral (SEB) Functioning
• Academic success ≠ School success • (Taylor & Kilgus, 2014)
• SEB Competence • (Denham, 2006; Kwon et al., 2012)• Display of appropriate behaviors and skills (e.g.,
interpersonal skills, study skills, self-regulation, self-awareness)
• Limited display of inappropriate behaviors and skills (e.g., internalizing, externalizing)
• SEB Competence = protective factor• Among ethnic minority students living in low-income,
urban communities • (Elias & Haynes, 2008)
Academic Skills
Social-Emotional
Skills
Behavioral Skills
School Success

In academics, universal screening instruments are widely recognized as adequate measures to identify students at-risk for developing further problems (Ardoin et al., 2004; Elliott, Huai, & Roach, 2007)
However, PBIS frameworks continue to rely on psychometrically poor and problematic methods for identifying students at risk behaviorally and emotionally.

Addressing SEB Difficulties
• Most common approach is Positive Behavioral Interventions and Support (PBIS)
• Consistency found in recommendations for Tier 3 assessment
• Targeted screening Rating scales• Problem identification FBA• Progress monitoring Direct observation
• Recommendations for assessment are less clear at Tiers 1 & 2
• Problem!
• Teach & reinforce school-wide expectations
Tier 1 (80%)
• Efficient, systematic, & continuously available targeted interventions
Tier 2 (15%)
• Intensive & individualized behavior support plans
Tier 3 (5%)

Universal Screening
Teacher Referral and School Identification
• Refer-Test-Place models• teachers differ in their ability to work with students
• perceptions of “teachability”• teachers not trained to know how problematic behavior must be prior to referral
• Children’s behavioral/emotional problems may be under-referred and/or referral (and service!) is delayed
• (Lloyd, Kauffman, Landrum, & Roe, 1991; Severson et al., 2007; Tilly, 2008; Walker et al., 2000)

Screening for “At-risk” Students

Screening for “At-risk” Students

Universal Screening: Outcomes
1) Short term goal: provide early intervention
2) Long term goals: Decrease academic failure, improve student well-being, improve educators ability to effectively respond to concerns
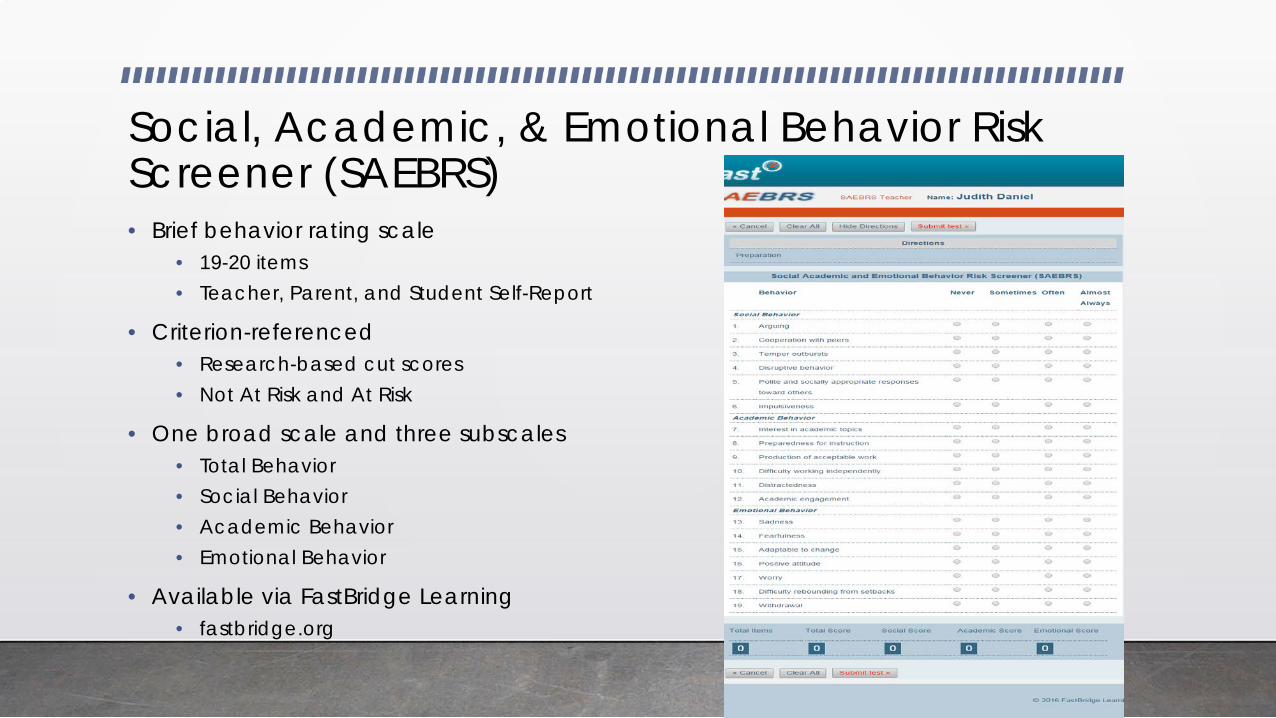
Social, Academic, & Emotional Behavior Risk Screener (SAEBRS)• Brief behavior rating scale
• 19-20 items• Teacher, Parent, and Student Self-Report
• Criterion-referenced• Research-based cut scores• Not At Risk and At Risk
• One broad scale and three subscales• Total Behavior • Social Behavior • Academic Behavior• Emotional Behavior
• Available via FastBridge Learning • fastbridge.org

Social, Academic, & Emotional Behavior Risk Screener (SAEBRS)• Pros
• Brief and efficient• Assesses multiple domains, based on SEB
theory• Extent of diagnostic accuracy research• Multi-informant, Spanish versions• Only screener that met psychometric criteria
established by NCII
• Cons• Need for more research at high school levels• Also need for more research regarding
parent version • Cost: $1-2 per student
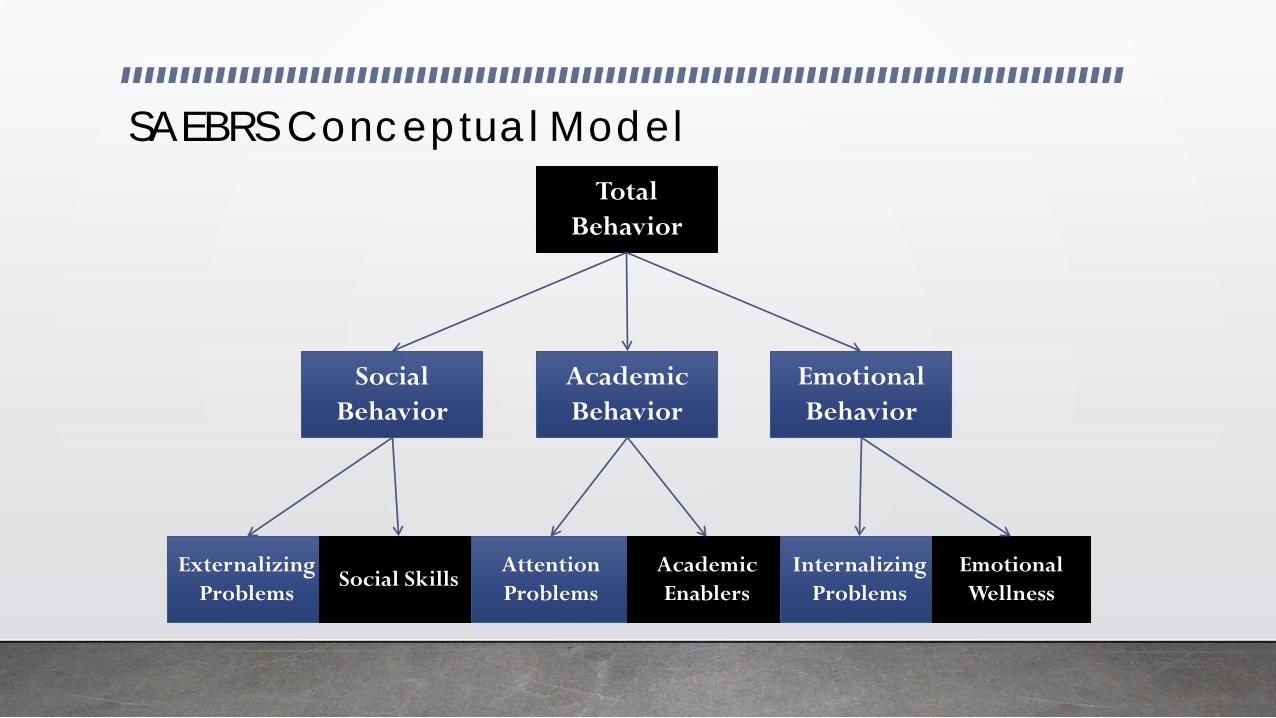
SAEBRS Conceptual Model
Externalizing Problems
Social SkillsAttention Problems
Academic Enablers
Internalizing Problems
Emotional Wellness
Social Behavior
Academic Behavior
Emotional Behavior
Total Behavior
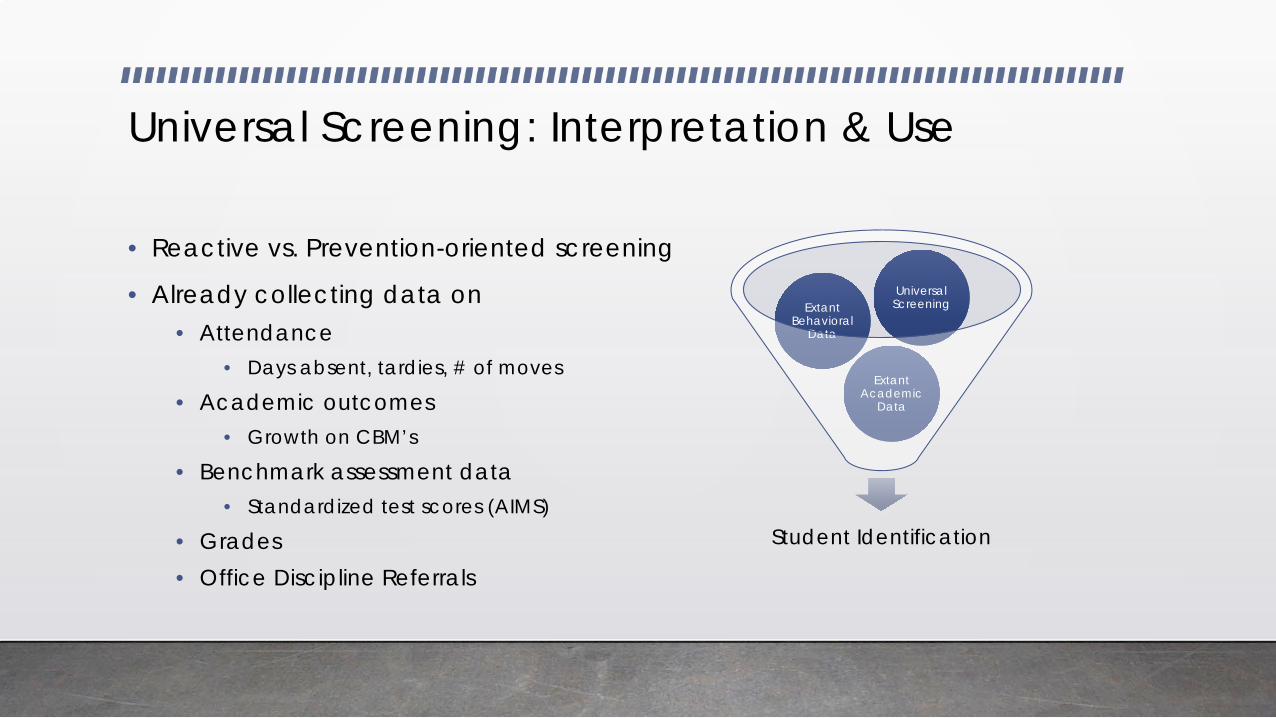
Universal Screening: Interpretation & Use
• Reactive vs. Prevention-oriented screening
• Already collecting data on• Attendance
• Days absent, tardies, # of moves
• Academic outcomes• Growth on CBM’s
• Benchmark assessment data• Standardized test scores (AIMS)
• Grades• Office Discipline Referrals
Student Identification
Extant Academic
Data
Extant Behavioral
Data
Universal Screening

Universal Screening: Interpretation & Use
Universal Screening
School-wide Base Rate < 20%,
but Classroom Base Rate ≥ 20%
School-wide Base Rate < 20%
& Classroom Base Rate ≤ 20%
School-wide Base Rate ≥ 20%
System Support (Tier 1)
Classroom Support (Tier 1)
Individual/Small Group Support
(Tier 2)

System Support (Tier 1)
• Start with universal strategies• Determine type of risk most prevalent
• SRSS or SSBD Example: • Externalizing Behavior
• Revise school-wide expectations or reinforcement plan • Or rather, ensure integrity of existing plan
• Internalizing Behavior• Implement social emotional learning curriculum:• Promoting Alternative Thinking Strategies (PATHS)• Second Step• Why Try?• Incredible Years
School-wide Base Rate ≥ 20%
System Support (Tier 1)
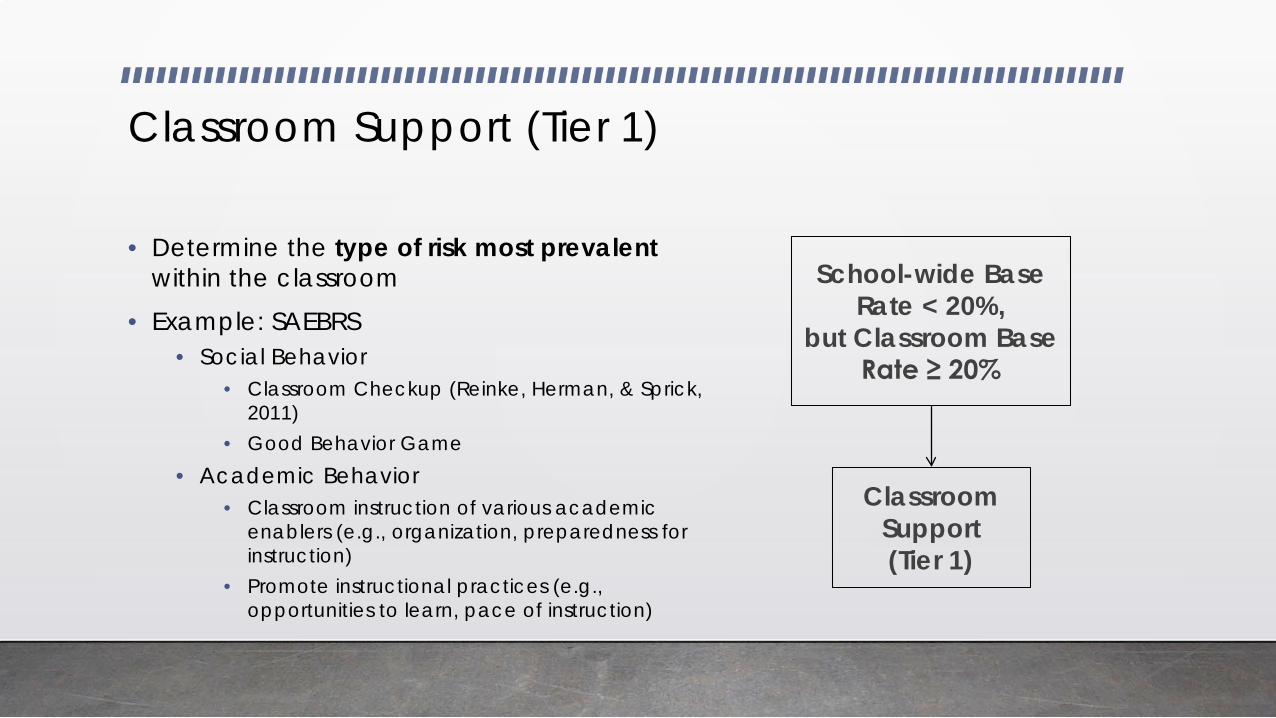
Classroom Support (Tier 1)
• Determine the type of risk most prevalent within the classroom
• Example: SAEBRS• Social Behavior
• Classroom Checkup (Reinke, Herman, & Sprick, 2011)
• Good Behavior Game• Academic Behavior
• Classroom instruction of various academic enablers (e.g., organization, preparedness for instruction)
• Promote instructional practices (e.g., opportunities to learn, pace of instruction)
School-wide Base Rate < 20%,
but Classroom Base Rate ≥ 20%
Classroom Support (Tier 1)

Individual or Group Level Support (Tier 2)
• Individual or small-group interventions
• Example: SAEBRS• Teaching Strategies
• Instruction of key skills • Social skills, academic enablers, emotional
competencies
• Antecedent/Consequence Strategies• Check In/Check Out (CICO) to prompt and
reinforce appropriate behaviors• Research supporting use with social, academic,
or emotional behavior
School-wide Base Rate < 20% &
Classroom Base Rate ≤ 20%
Individual/Small Group Support
(Tier 2)

School District of Philadelphia Model

Urban Schools are hard…
1. Staff Turnover• FREQUENT changes in administration and staff from year to year
2. Lack of Resources• High numbers in classrooms; few teachers/open vacancies• Basic supplies missing or diminished
3. Difficulty Communicating • HUGE districts with many schools
4. Community Challenges

Predicting Abandonment of SWPBIS
• Investigation of 1861 schools across three states• Of these, 70 schools stopped implementation• Most schools abandoned within first three years
• The only predictor of abandonment was urban settings
• 44 schools provided reason for abandonment• 82% School Administrator Support• 11% Insufficient Data Submission• 5% Competing Initiatives
Nese, McIntosh, Nese, Bloom, Johnson, Phillips, & Hoselton, 2016
State of Affairs
• Due to budget cuts in recent years in the School District of Philadelphia (SDP), mental health services have been severely cut or eliminated, significantly reducing the number of school-based mental health professionals necessary to provide comprehensive services.
• An estimated 100,000 youth in Philadelphia schools may not be able to access mental health services.
• Moreover, 1 in 3 children in Philadelphia live below the poverty line and do not have access to outside mental health services.

Pilot School Model
• Middle school (grades 5-8) in a K-8 building
• Eight teachers of ~200 students
• Implementing PBIS with fidelity across all three tiers (as of May 2018)
• High suspension/ODR rates

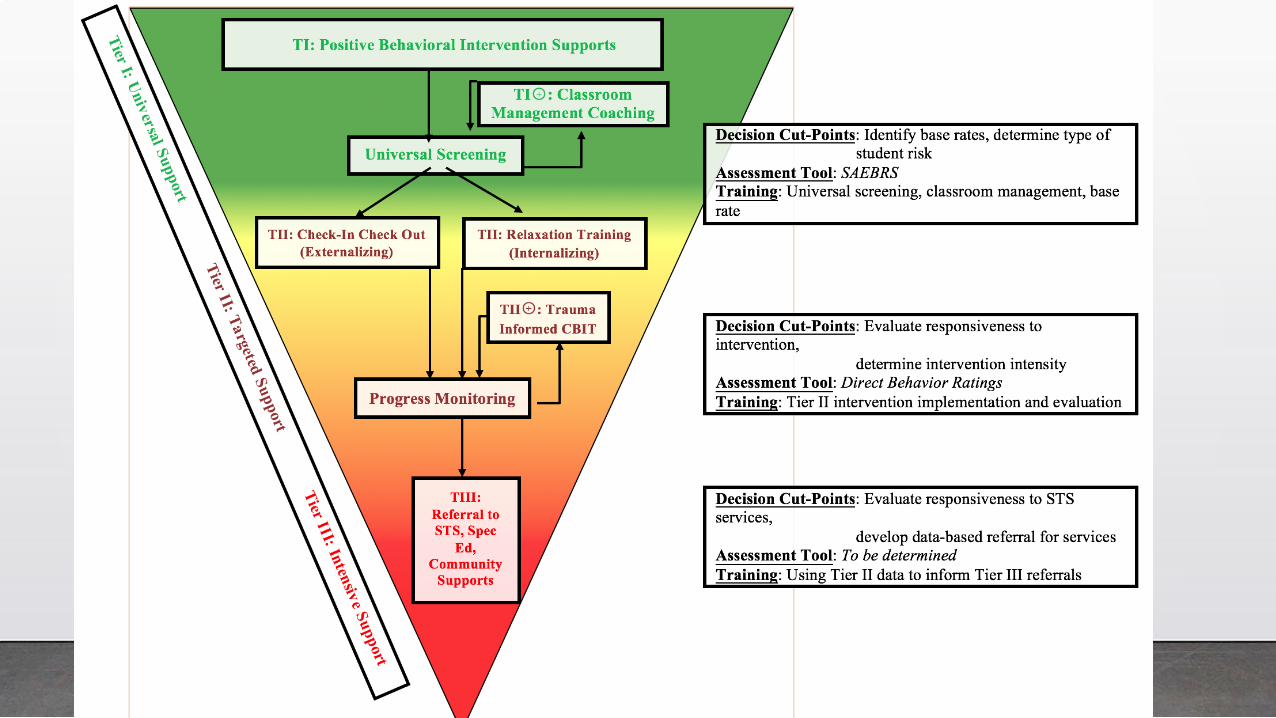
Multi-tiered Decision Making Framework
• Decision-making framework was developed via an iterative process that includes
• feedback from school-based partners,
• periodic and planned review of program effectiveness that will allow for necessary changes, and
• data to inform key decisional cut points.
• The framework is based upon and augment a Multi-tiered Systems of Support (MTSS) implementation that is currently being initiated in several schools within the SDP and more broadly across the state, as well as best practices specified within a trauma-informed approach

Teacher Training on the SAEBRS
• 90 minute in-service training for teachers
• Benefits and purpose of universal screening
• School and teacher’s role in student mental health screening
• Defining and recognizing behaviors on the screener• Videos of the behaviors
• Practice identifying and distinguishing between behaviors

Fall and Winter Screening Data
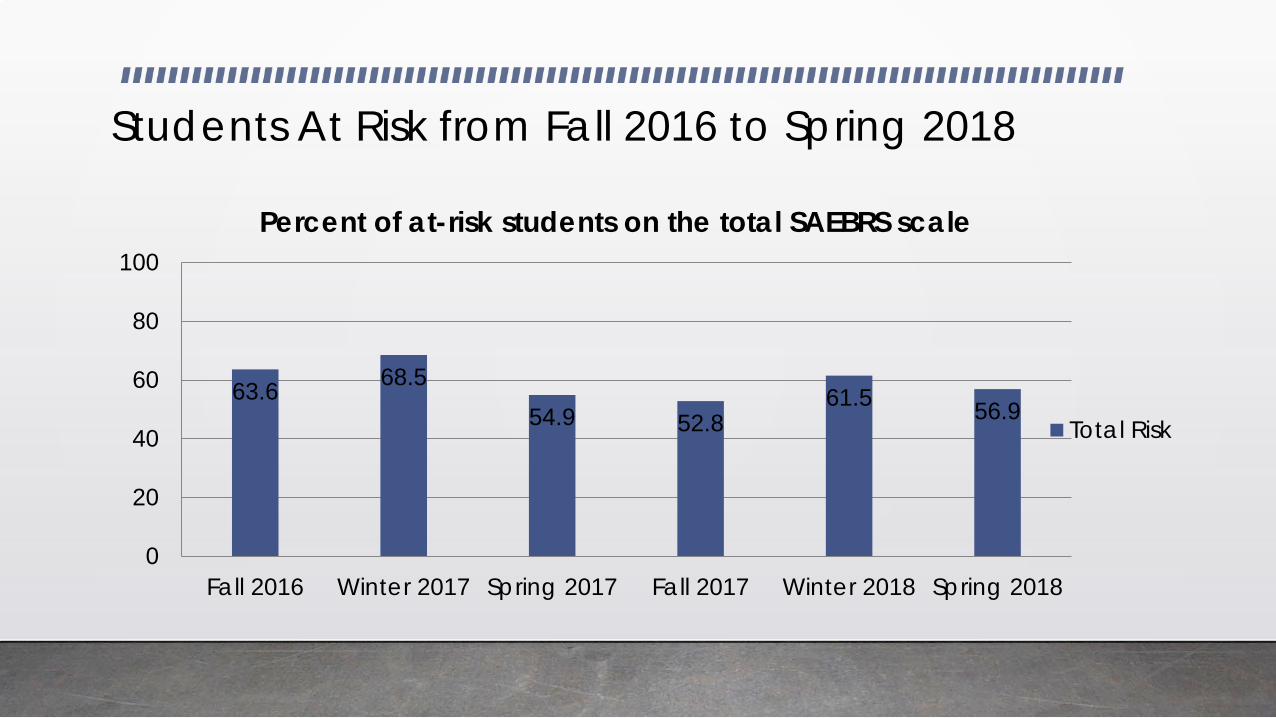
Students At Risk from Fall 2016 to Spring 2018
63.6 68.554.9 52.8
61.5 56.9
0
20
40
60
80
100
Fall 2016 Winter 2017 Spring 2017 Fall 2017 Winter 2018 Spring 2018
Percent of at-risk students on the total SAEBRS scale
Total Risk

Comparison of School-Wide Risk by Subscale and Grade in Spring 2018
67.9
55 58.368.266.1
57.547.9
40.9
83.9
5560.4
86.4
0102030405060708090
100
Fifth Sixth Seventh Eighth
Perc
ent
Grade
SocialAcademicEmotional
Teacher Training in Classroom Management
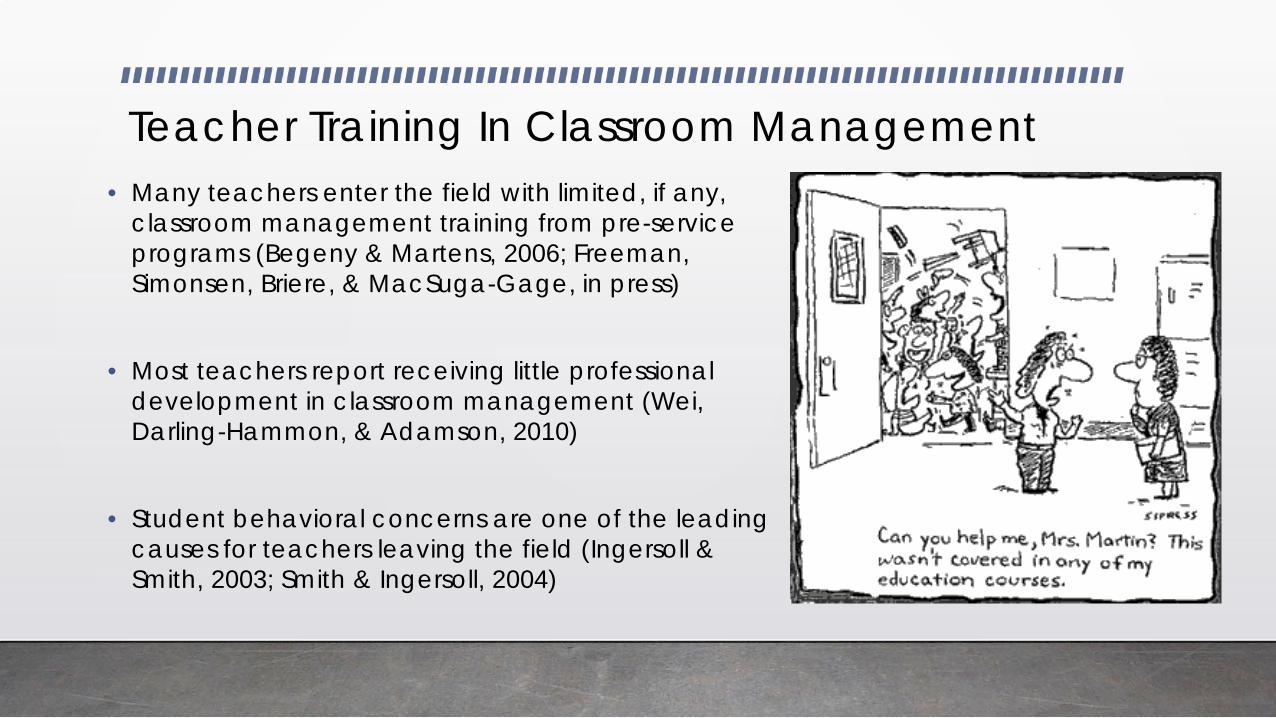
Teacher Training In Classroom Management• Many teachers enter the field with limited, if any,
classroom management training from pre-service programs (Begeny & Martens, 2006; Freeman, Simonsen, Briere, & MacSuga-Gage, in press)
• Most teachers report receiving little professional development in classroom management (Wei, Darling-Hammon, & Adamson, 2010)
• Student behavioral concerns are one of the leading causes for teachers leaving the field (Ingersoll & Smith, 2003; Smith & Ingersoll, 2004)

Increasing rates of effective instruction provided
to students with behavior problems has been associated
with a decrease in problembehavior
Sutherland, Alder, & Gunter, 2003; Simonsen & Myers, 2015

Explain the theory
Have a workshop discussion
Show example of
good practice
Staff get feedback on
their practice
Staff practice
new approach
Staff receive (and
give) coaching
There is no measurable impact on classroom practice up to this point
There is a large, measurable impact on classroom practice now, especially if coaching is provided
Petty (2004)
Joyce & Showers (1980, 2002)
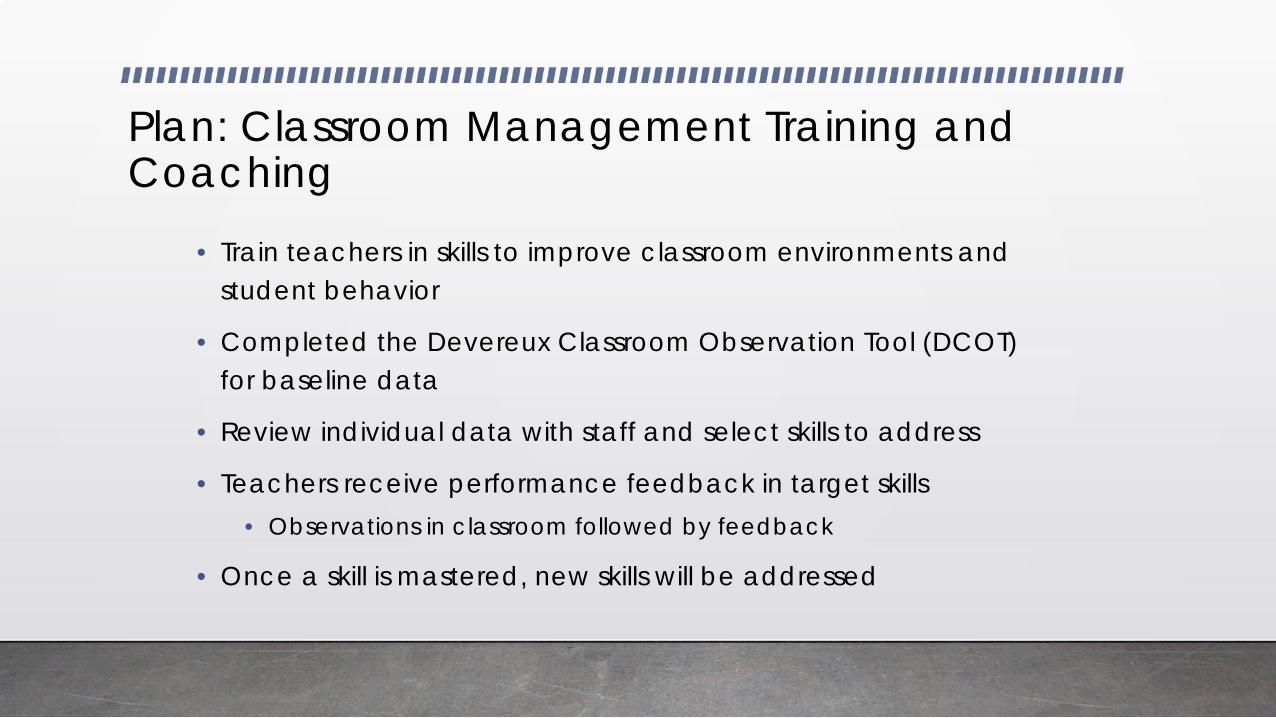
Plan: Classroom Management Training and Coaching
• Train teachers in skills to improve classroom environments and student behavior
• Completed the Devereux Classroom Observation Tool (DCOT) for baseline data
• Review individual data with staff and select skills to address
• Teachers receive performance feedback in target skills• Observations in classroom followed by feedback
• Once a skill is mastered, new skills will be addressed
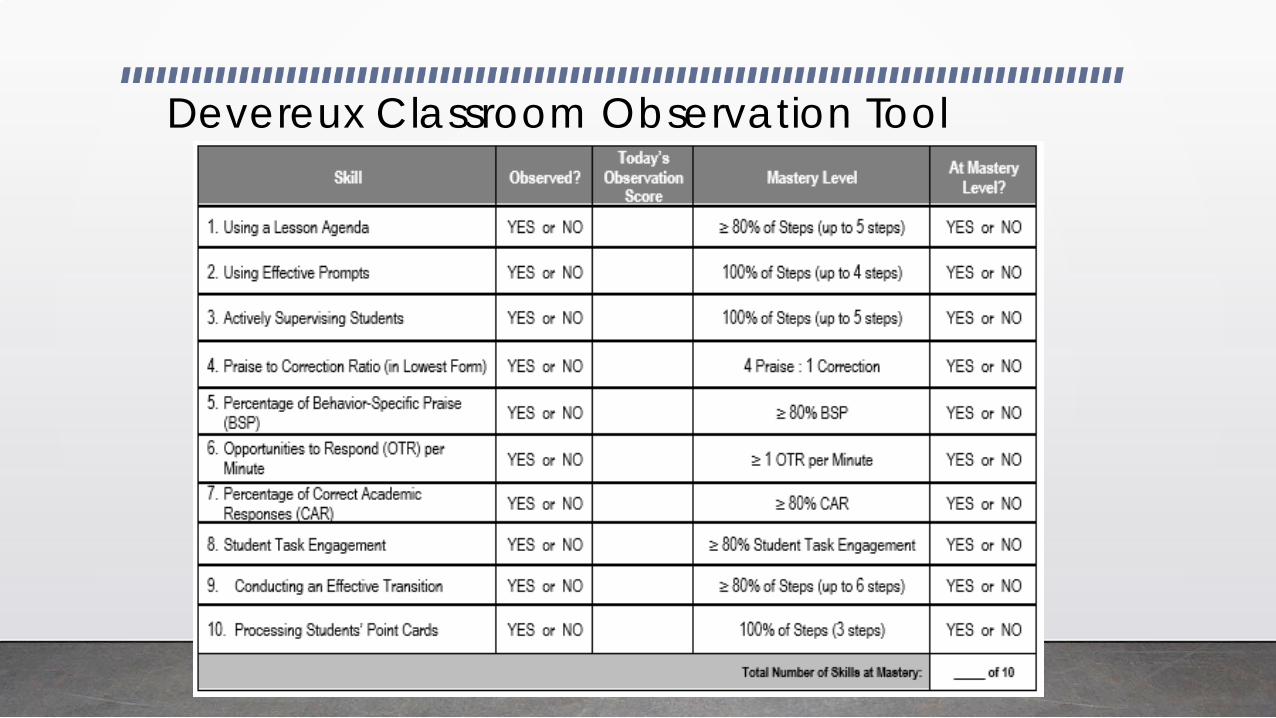
Devereux Classroom Observation Tool

25%13%
50%
0%
86%
14%
50%
0%
71%
75%87%
50%
100%
14%
86%
50%
100%
29%
0%
10%
20%
30%
40%
50%
60%
70%
80%
90%
100%
Perc
enta
ge o
f Obs
erva
tion
At o
r Bel
ow M
aste
ry
Observation Tool Categories
Baseline Mastery Level November 2017
At Mastery Below Mastery

Coach Role
Assignments• Each coach assigned two classrooms• Logistical considerations
Observations and Feedback• Observe one skill per week• Complete feedback form with score and graph• Leave hard copy with teacher immediately after observation
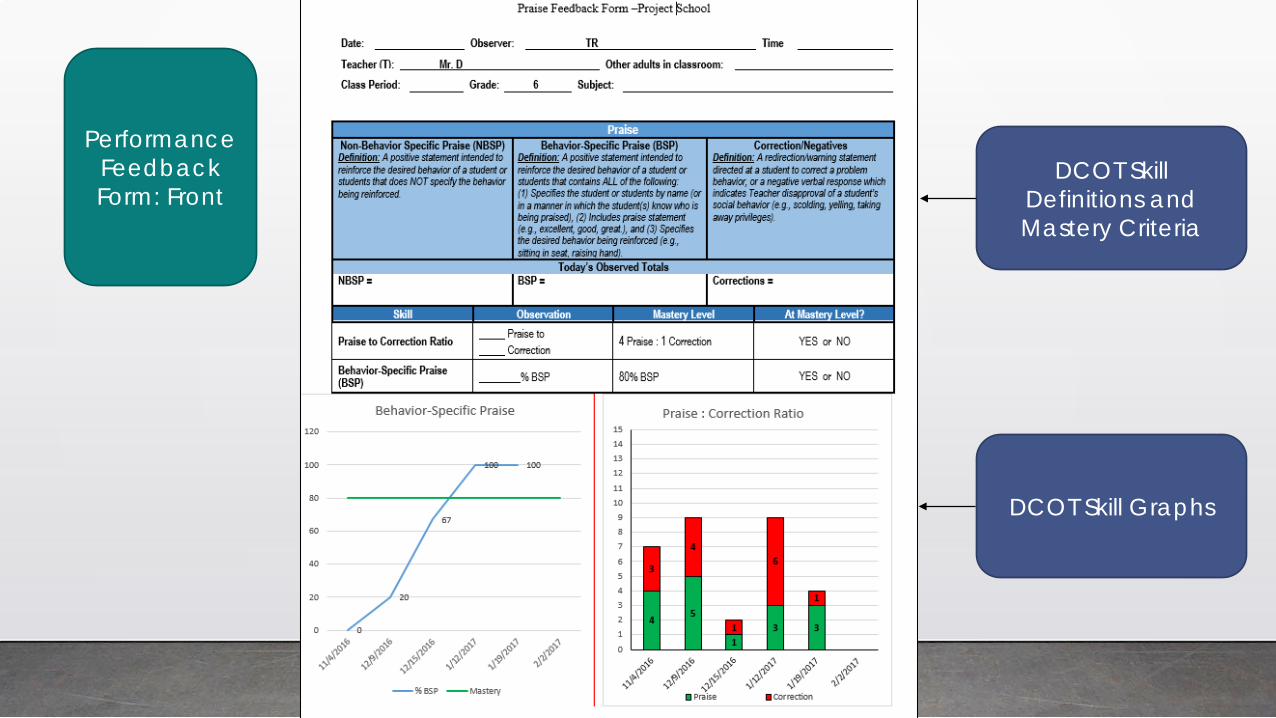
DCOT Skill Definitions and Mastery Criteria
DCOT Skill Graphs
Performance Feedback Form: Front
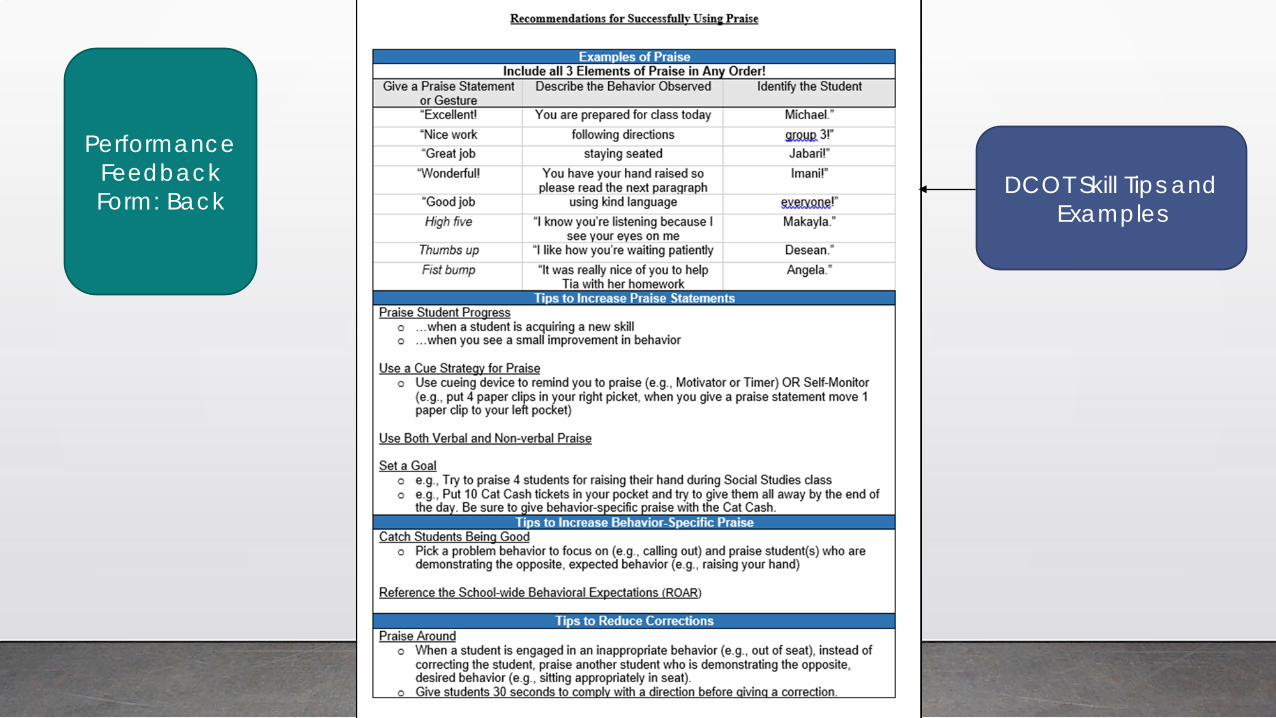
Performance Feedback Form: Back
DCOT Skill Tips and Examples

2017-2018 Outcome Data

May 2018 Group Results
15%9%
95%
54%
0.28
1.37
5.00
1.48
0
1
2
3
4
5
6
0%
10%
20%
30%
40%
50%
60%
70%
80%
90%
100%
Lesson Agenda Behavior-Specific Praise Praise Ratio OTR
Current Skill Averages
Baseline Average Current Average

Outcome Data
0%
10%
20%
30%
40%
50%
60%
70%
80%
90%
100%
Task Engagement
Task Engagement
BaselineAverage
May 2018Average
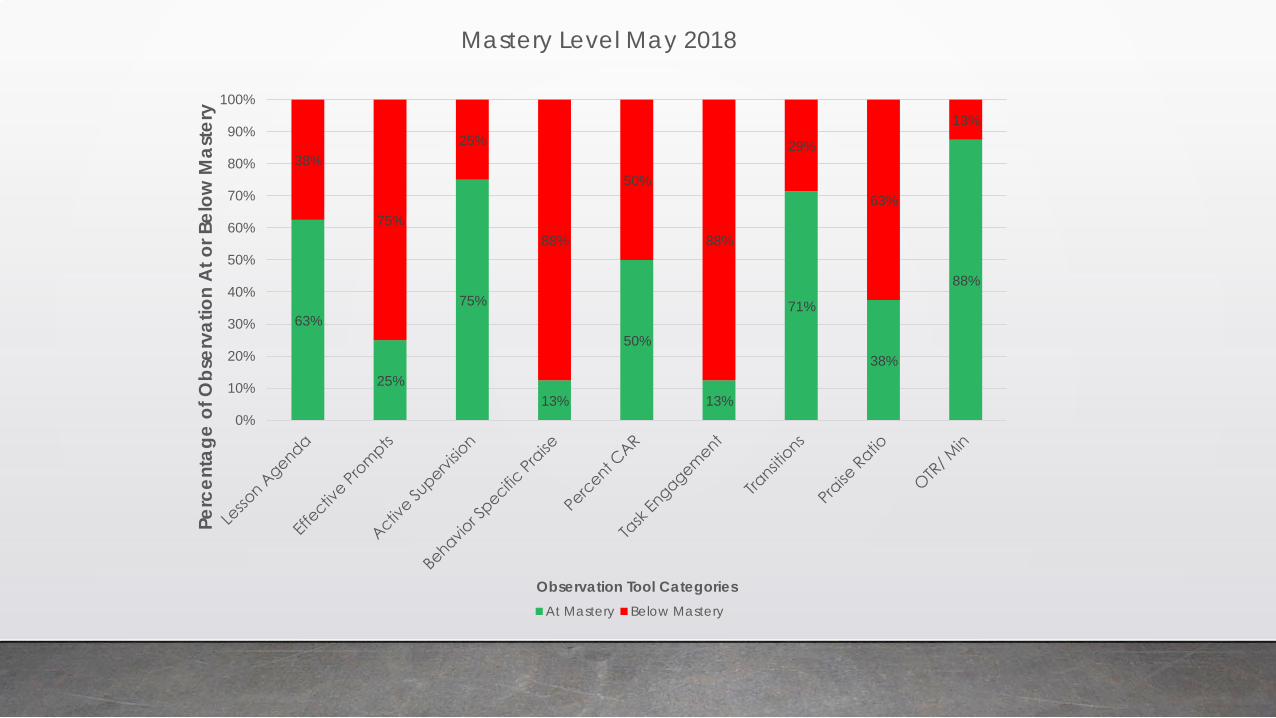
63%
25%
75%
13%
50%
13%
71%
38%
88%
38%
75%
25%
88%
50%
88%
29%
63%
13%
0%
10%
20%
30%
40%
50%
60%
70%
80%
90%
100%
Perc
enta
ge o
f Obs
erva
tion
At o
r Bel
ow M
aste
ry
Observation Tool Categories
Mastery Level May 2018
At Mastery Below Mastery
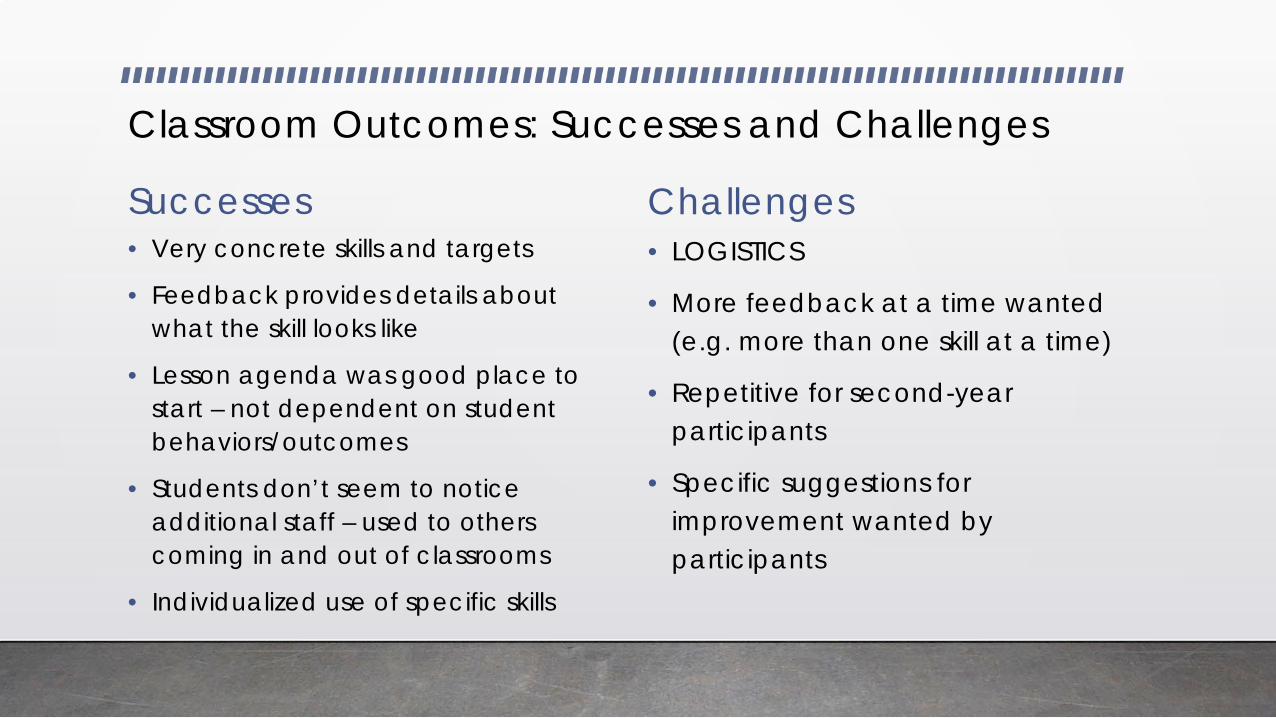
Classroom Outcomes: Successes and Challenges
Successes• Very concrete skills and targets
• Feedback provides details about what the skill looks like
• Lesson agenda was good place to start – not dependent on student behaviors/outcomes
• Students don’t seem to notice additional staff – used to others coming in and out of classrooms
• Individualized use of specific skills
Challenges• LOGISTICS
• More feedback at a time wanted (e.g. more than one skill at a time)
• Repetitive for second-year participants
• Specific suggestions for improvement wanted by participants
Secondary Prevention: Targeted Supports for At-Risk StudentsTier 2 Supports: Individual and Small Groups

Student Identification for Tier 2 Intervention
138 students at risk on SAEBRS-ES
Principal and school counselor identify students
Consent forms to parent or guardians of students
17 students in relaxation groups and CATS program
6 Students participate in a trauma-focused group
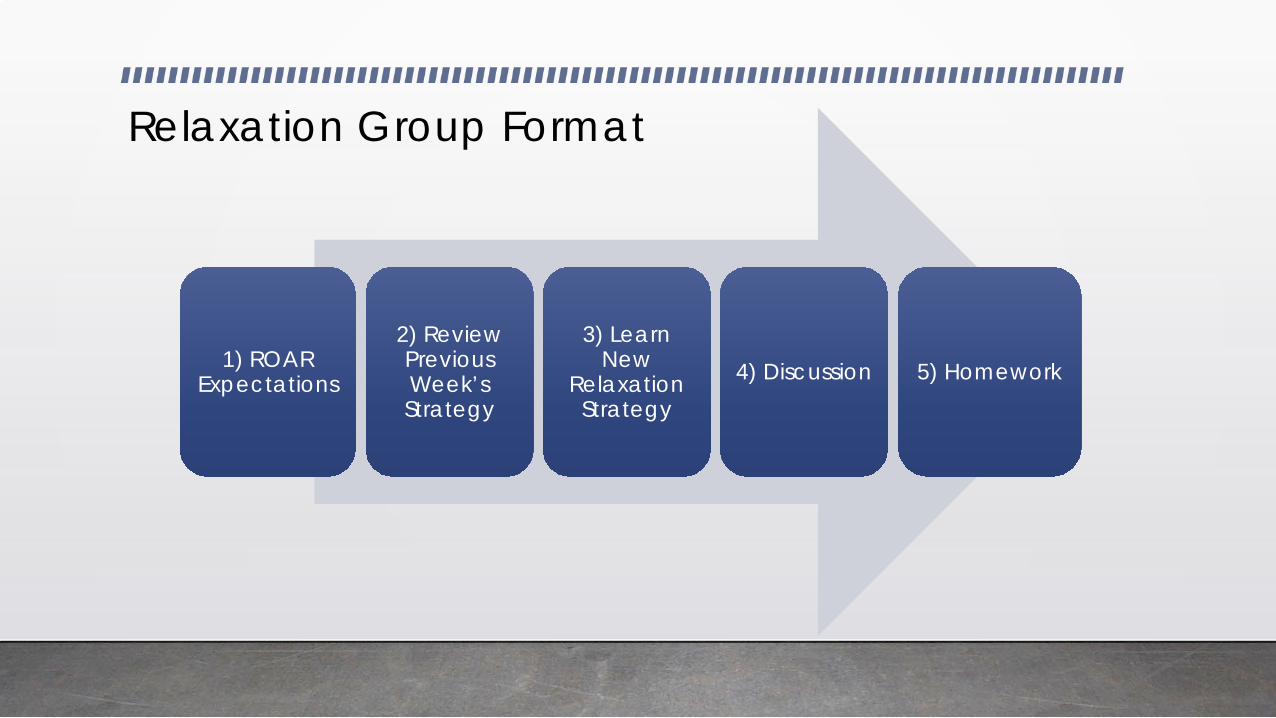
Relaxation Group Format
1) ROAR Expectations
2) Review Previous Week’s Strategy
3) Learn New
Relaxation Strategy
4) Discussion 5) Homework
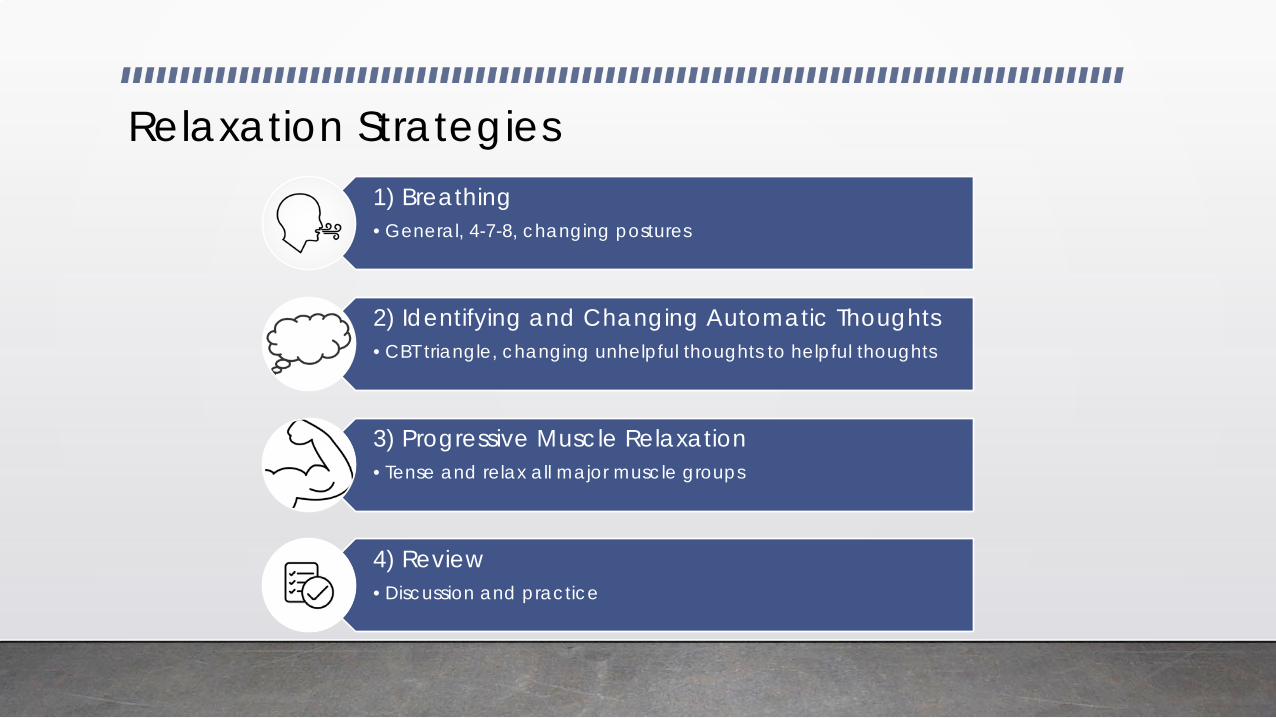
Relaxation Strategies 1) Breathing•General, 4-7-8, changing postures
2) Identifying and Changing Automatic Thoughts•CBT triangle, changing unhelpful thoughts to helpful thoughts
3) Progressive Muscle Relaxation•Tense and relax all major muscle groups
4) Review•Discussion and practice

CATS Program

Progress MonitoringStudent Direct Behavior Ratings (DBR): • A research supported
assessment that consists of the quantification of a behavior at a given point in time
• Commonly used to capture small increments of behavioral change in response to an intervention
(Christ, Riley-Tillman, & Chafouleas, 2009; Chafouleas, Sanetti, Kilgus, & Magin, 2012)

Student Comments about Relaxation Groups
“My mom says I have become nicer since I learned how to use
these strategies instead of fighting”
“I practiced my breathing when my sister was yelling at me so that I didn’t
yell back” “I taught my mom how to change her automatic thoughts and we practiced
together”
“I did 4-7-8 breathing when I failed a test and it
helped me stay calm and in the
classroom”

Tier 2: Trauma Screening• Trauma Exposure Checklist
• Child PTSD Screener
• Student assent and parent consent

Trauma Screening Data
Screening Guidelines
• Eligible students must have at least one exposure to trauma AND
• Related PTSD symptoms in the clinical range
• Indicated by scores >14 on PTSD screener
Students at our school
• Students experienced range of 4-14 traumatic events
• Average number = 9.3
• 10/13 students exhibit moderate to severe symptoms of PTSD
• Average score = 19.1
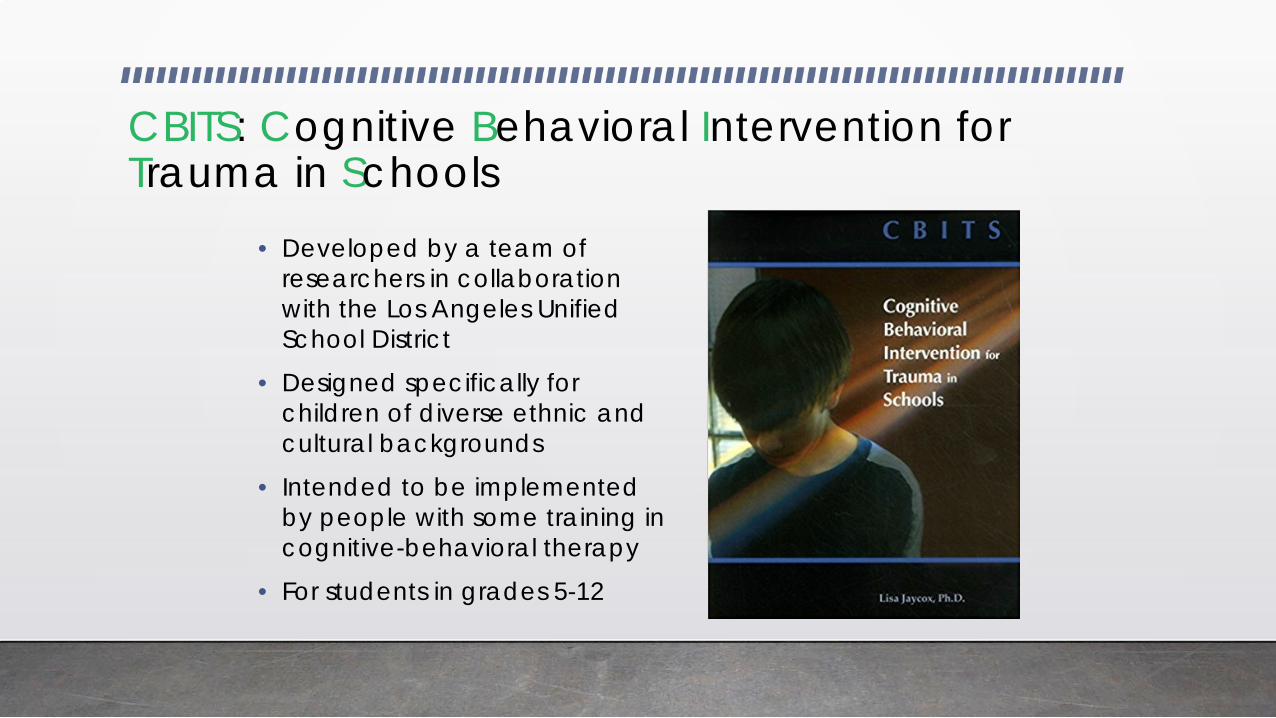
CBITS: Cognitive Behavioral Intervention for Trauma in Schools
• Developed by a team of researchers in collaboration with the Los Angeles Unified School District
• Designed specifically for children of diverse ethnic and cultural backgrounds
• Intended to be implemented by people with some training in cognitive-behavioral therapy
• For students in grades 5-12
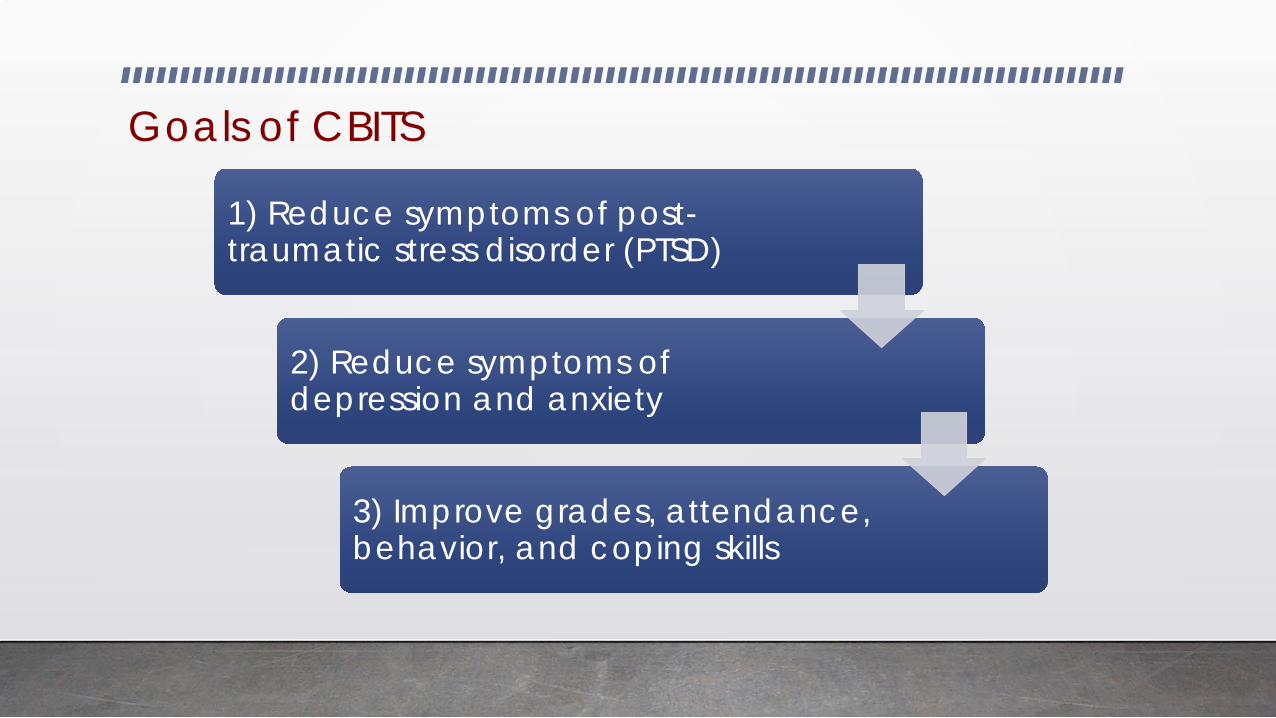
Goals of CBITS
1) Reduce symptoms of post-traumatic stress disorder (PTSD)
2) Reduce symptoms of depression and anxiety
3) Improve grades, attendance, behavior, and coping skills

Tier 2 Outcomes: Successes and Challenges
Successes• Students reported positive
changes in behavior after the groups
• Data sheets similar to currently existing CICO forms and simple to complete
Challenges• Progress monitoring
• Timing of intervention
• Consents
• Implementers and Sustainability

Implementation Processes and Challenges

Implementation Challenges
1. Quick Fix
2. Upside Down Triangle
3. Data Literacy
4. Staffing and Workload issues

Challenge 1: Quick Fix WANTED!
• The Problem:• Districts/Staff want to buy a program that will be the “fix”• They don’t understand that MTSS is a framework where THEY do the work • The “fix” happens over time
• Addressing It:• Clearly state expectations for implementation in the overview• Show data frequently to teams and staff• Celebrate small successes to keep buy in

Challenge 2: Upside Down Triangle
• The Problem:• Too many students “at-risk”
• Tier 2 and Tier 3 supports are stretched too thin and becomes reactive rather than preventative
• Addressing It:• Classroom Management
• Fidelity at Tier 1
Challenge 3: Data Based Decision Making
• The Problem:• Difficult for staff to:
• Understand data• Value collecting data• Use it to make decisions
• Addressing It:• Using data to make “feelings” real and show the team success• Sharing data with staff so they understand the importance of documentation
Challenge 4: Staffing/Workload Issues
• The Problem• Understaffed
• Hard to implement interventions
• Limited availability for trainings
• Difficulty scheduling regular meetings
• Staff Turnover• Difficulty maintaining fidelity and
buy in
• “Identity crisis”
• Addressing It:• Continuous retraining
• Coaching to support the maintenance of buy in and fidelity

Making the Sale
• District/Building administration needs to buy in first
• Have to provide the "Why " behind "Why Screen"
• Need to have the next steps thought out
• System Change in hard – Go Slow to Go Fast!!
• Sustainability

Questions? NATHANIEL VON DER EMBSE, PH.D.
UNIVERSITY OF SOUTH FLORIDA
JEN FRANCISCO, M.ED., BCBA
DEVEREUX CENTER FOR EFFECTIVE SCHOOLS