Multi-pronged approach needed to boost rural doctor workforce

General rights Copyright and moral rights for the publications made accessible in the public portal are retained by the authors and/or other copyright owners and it is a condition of accessing publications that users recognise and abide by the legal requirements associated with these rights.
• Users may download and print one copy of any publication from the public portal for the purpose of private study or research. • You may not further distribute the material or use it for any profit-making activity or commercial gain • You may freely distribute the URL identifying the publication in the public portal
If you believe that this document breaches copyright please contact us providing details, and we will remove access to the work immediately and investigate your claim.
Downloaded from orbit.dtu.dk on: Jun 21, 2018
A multi-pronged investigation into the effect of glucose starvation and culture durationon fed-batch CHO cell culture
Fan, Yuzhou; Jimenez Del Val, Ioscani; Müller, Christian; Lund, Anne Mathilde; Wagtberg Sen, Jette;Rasmussen, Søren Kofoed; Kontoravdi, Cleo; Baycin-Hizal, Deniz; Betenbaugh, Michael J.; Weilguny,Dietmar; Andersen, Mikael RørdamPublished in:Biotechnology and Bioengineering (Print)
Link to article, DOI:10.1002/bit.25620
Publication date:2015
Document VersionPeer reviewed version
Link back to DTU Orbit
Citation (APA):Fan, Y., Jimenez Del Val, I., Müller, C., Lund, A. M., Wagtberg Sen, J., Rasmussen, S. K., ... Andersen, M. R.(2015). A multi-pronged investigation into the effect of glucose starvation and culture duration on fed-batch CHOcell culture. Biotechnology and Bioengineering (Print), 112(10), 2172-2184. DOI: 10.1002/bit.25620

Acc
epte
d P
repr
int
This article is protected by copyright. All rights reserved
Systems Biotechnology Biotechnology and Bioengineering
DOI 10.1002/bit.25620
A multi-pronged investigation into the effect of glucose starvation and
culture duration on fed-batch CHO cell culture†
Yuzhou Fan1, 2
, Ioscani Jimenez Del Val3, Christian Müller
2, Anne Mathilde Lund
1, Jette
Wagtberg Sen2, Søren Kofoed Rasmussen
2, Cleo Kontoravdi
3, Deniz Baycin-Hizal
4, Michael
J. Betenbaugh4, Dietmar Weilguny
2* and Mikael Rørdam Andersen
1*
1Network Engineering of Eukaryotic Cell Factories, Department of Systems Biology,
Technical University of Denmark, Building 223, 2800 Kgs. Lyngby, Denmark
2Symphogen A/S, Pederstrupvej 93, 2750 Ballerup, Denmark
3Center for Process Systems Engineering, Department of Chemical Engineering, Imperial
College London, South Kensington Campus, London SW7 2AZ, UK
4Department of Chemical and Biomolecular Engineering, Johns Hopkins University,
Baltimore, MD 21218, USA
*Corresponding author.
Address correspondence to Mikael Rørdam Andersen, Department of Systems Biology,
Technical University of Denmark, Building 223, 2800 Kgs. Lyngby, Denmark;
+4545252675; [email protected]
Address correspondence to Dietmar Weilguny, Cell line and Upstream, Symphogen A/S,
Pederstrupvej 93, 2750 Ballerup, Denmark; +4588382683; [email protected]
Short running title: A multi-pronged investigation into fed-batch CHO cell culture
Keywords Chinese hamster ovary cells; fed-batch; monoclonal antibody; glycosylation; proteomics;
glucose starvation; culture duration.
†This article has been accepted for publication and undergone full peer review but has not been through the copyediting, typesetting, pagination and proofreading process, which may lead to differences between this version and the Version of Record. Please cite this article as doi: [10.1002/bit.25620] Additional Supporting Information may be found in the online version of this article. This article is protected by copyright. All rights reserved Received December 2, 2014; Revision Received March 1, 2015; Accepted April 7, 2015

Acc
epte
d P
repr
int
This article is protected by copyright. All rights reserved
Abstract
In this study, omics-based analysis tools were used to explore the effect of glucose starvation
and culture duration on monoclonal antibody (mAb) production in fed-batch CHO cell
culture to gain better insight into how these parameters can be controlled to ensure optimal
mAb productivity and quality. Titer and N-glycosylation of mAbs, as well as proteomic
signature and metabolic status of the production cells in the culture were assessed.
We found that the impact of glucose starvation on the titer and N-glycosylation of mAbs was
dependent on the degree of starvation during early stationary phase of the fed-batch culture.
Higher degree of glucose starvation reduced intracellular concentrations of UDP-GlcNAc and
UDP-GalNAc, but increased the levels of UDP-Glc and UDP-Gal. Increased GlcNAc and
Gal occupancy correlated well with increased degree of glucose starvation, which can be
attributed to the interplay between the dilution effect associated with change in specific
productivity of mAbs and the changed nucleotide sugar metabolism.
Herein, we also show and discuss that increased cell culture duration negatively affect the
maturation of glycans. In addition, comparative proteomics analysis of cells was conducted to
observe differences in protein abundance between early growth and early stationary phases.
Generally higher expression of proteins involved in regulating cellular metabolism,
extracellular matrix, apoptosis, protein secretion and glycosylation was found in early
stationary phase. These analyses offered a systematic view of the intrinsic properties of these
cells and allowed us to explore the root causes correlating culture duration with variations in
the productivity and glycosylation quality of monoclonal antibodies produced with CHO
cells. This article is protected by copyright. All rights reserved
Acc
epte
d P
repr
int
This article is protected by copyright. All rights reserved
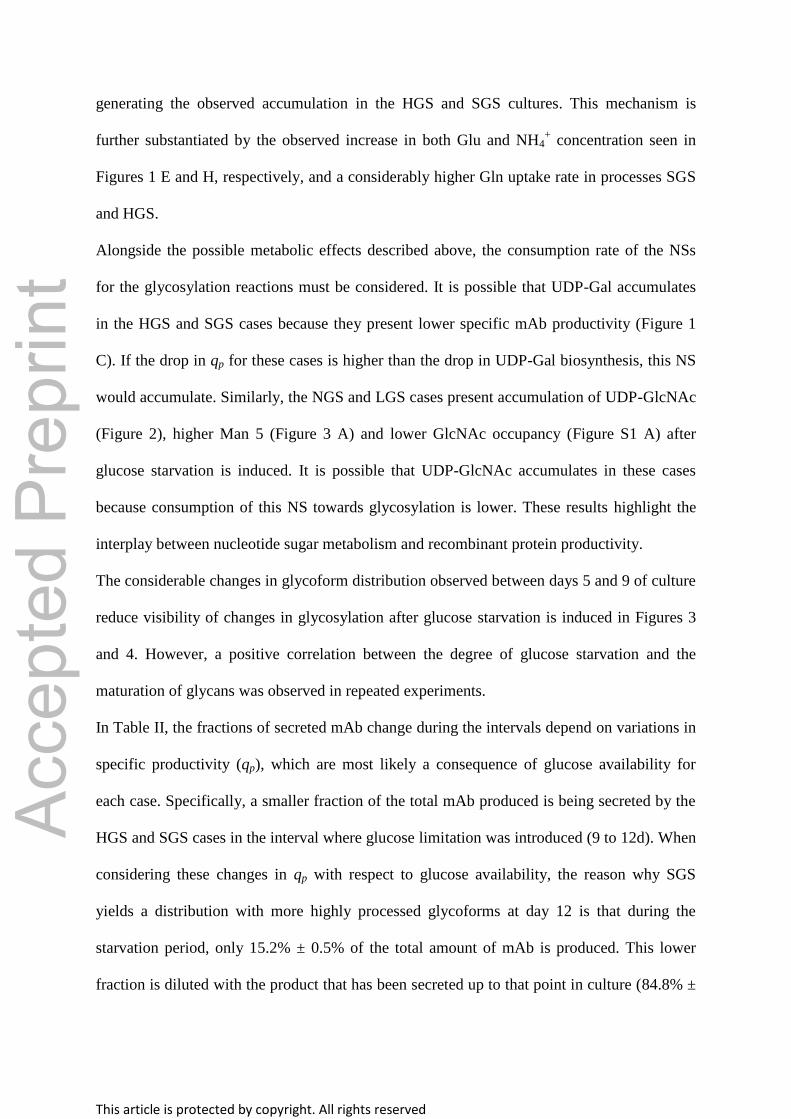
Introduction
Over the last decade Chinese hamster ovary (CHO) cells have been the predominant
expression system used in the pharmaceutical bioprocessing of recombinant monoclonal
antibodies (mAbs) due to their adaptability to industrial manufacturing environment and post-
translational modification compatibility with human patients (Lim et al. 2010). Fed-batch
culture has become a widely used approach for mAb production because of its value in
extending the viable and productive phase of the culture (Rouiller et al. 2013).
The manufacturing process is typically optimized for increasing the productivity of mAbs,
but this often increases the risk of compromising the critical quality attributes of the
recombinant product. A number of strategies aiming at improving final titer have been
proposed. For example, limiting the feed of glucose to minimize lactate accumulation (Dean
and Reddy 2013; Gagnon et al. 2011) and extending culture duration to prolong the
production window (Druz et al. 2013; Robinson et al. 1994), have been successfully
implemented. However, all these strategies require precise control of the production process.
The level of glucose limitation is crucial for the process, since it may cause undesired glucose
starvation and lead to reduced cell growth and productivity (Hu et al. 1987) and altered N-
glycosylation quality (Liu et al. 2014). Extended culture duration may also affect the mAb
quality in terms of N-glycosylation patterns (Pacis et al. 2011). N-glycosylation of mAbs
affects their pharmacokinetic characteristics and efficacy as a drug, including clearance rate,
stability, immunogenicity, antibody-dependent cellular cytoxicity (ADCC) and complement-
dependent cytoxicity (CDC) (Goetze et al. 2011; Hossler et al. 2009; Jefferis 2012; Raju
2008; Zheng et al. 2011).
Recently, CHO cell bioprocessing entered the omics era (Kildegaard et al. 2013), thanks to
the availability of the CHO-K1 and Chinese hamster genome sequences, along with draft
genomes of multiple cell lines (Cao et al. 2012; Lewis et al. 2013; Xu et al. 2011). This has

Acc
epte
d P
repr
int
This article is protected by copyright. All rights reserved
made other omics-based technologies more readily available for CHO cell culture, including
RNA-sequencing transcriptomics analysis (McGettigan 2013) and tandem mass
spectrometry-based proteomics analysis (Baycin-Hizal et al. 2012). In order to increase the
understanding of CHO cell physiology to better control the quality attributes of mAbs, a
multi-pronged approach that integrate data from cell culture behavior, metabolism, mAb
quality and omics-based phenotyping will become a trend for CHO cell culture process
development in the future.
This study is, to our best knowledge, the first time a multi-pronged approach has been used to
investigate the effect of glucose starvation and culture duration on mAb production in fed-
batch CHO cell culture. Here, we aim to understand how the titer and N-glycosylation of the
mAb product, as well as the proteomic signature and the intrinsic properties of the cells, are
affected by changing these process parameters. The results presented herein provide
mechanistic insight into how these process parameters influence mAb productivity and
quality, and thus should aid in the identification of an appropriate operating windows for
glucose limitation without running into glucose starvation and of the optimal harvest time.
Materials and methods
Cell culture and fed-batch process
Cell line A, an in-house CHO DG44 cell line producing mAb A was used as model cell line
in this study. Cells were maintained in proprietary serum-free basal medium in shake flask at
37˚C, 5% CO2, 200 rpm prior to the fed-batch process.
Fed-batch culture was carried out in 500 ml shake flasks (working volume 50 – 100 ml) at
37°C, 5% CO2, 200 rpm with an initial seeding density of 4×10⁵ viable cells/mL and
temperature shift from 37°C to 33.5°C on day 5. Proprietary feed was added to the culture on
days 2, 5, 7, 9 and 12 (10% of the initial culture volume). Glucose concentration was adjusted
to 33mM on day 5 and to 50mM on day 12. Cell culture was sampled before feeding on days

Acc
epte
d P
repr
int
This article is protected by copyright. All rights reserved
2, 5, 7, 9, 12 and 14 for monitoring cell growth (Vi-CELL XR, Beckman Coulter, Brea, CA),
cell metabolism (Bioprofile 100plus, Nova BioMedical, Waltham, WA) and mAb production
(Octet QK384 equipped with Protein A biosensors, ForteBio, Menlo Park, CA). Sampling for
intracellular nucleotide sugar quantification and mAb glycoprofiling was performed on days
2, 5, 9 and 12. Harvesting criteria for the culture was considered to be either when cell
viability fell below 70% or on day 14, whichever occurred first. Four different fed-batch
processes were performed in duplicate: severe glucose starvation (SGS), high glucose
starvation (HGS), low glucose starvation (LGS) and no glucose starvation (NGS). In each of
these processes, glucose concentration was set to 11mM (SGS), 22mM (HGS), 33mM (LGS)
and 50mM (NGS) on day 9 of the fed-batch culture. Additional sampling for comparative
proteomics analysis was performed on days 2 and 9 of the NGS process.
Nucleotide sugar analysis
Nucleotide sugar analysis was performed on harvested cell pellets using acetonitrile
extraction followed by high-performance anion-exchange (HPAEC) HPLC as described
previously (Fan et al. 2015; Jimenez Del Val et al. 2013).
Semi-high throughput mAb purification
The supernatant harvested from cell culture was filtered through a 0.22μm filter (Millipore,
Billerica, MA) and applied onto a Protein A HP MultiTrap™ 96-well filter plate (GE
Healthcare, Fairfield, CA) which had been previously equilibrated with PBS following the
manufacturer's instructions. Elution was performed using 0.1M citrate buffer (pH=3.5,
Sigma-Aldrich). The eluate was immediately transferred to a Zeba™ spin desalting plate
(Thermo Scientific, Waltham, MA) previously equilibrated with a 10mM citrate, 150mM
NaCl (pH=6.0) buffer (Sigma-Aldrich, St. Louis, MO). Purified mAb concentration was
measured using a NanoDrop ND-1000 system (Thermo Scientific) prior to sample storage at
-20°C.

Acc
epte
d P
repr
int
This article is protected by copyright. All rights reserved
mAb Glycoprofiling
mAb Glycoprofiling was performed with an in-house HPLC analysis method using
InstantAB labeled (Prozyme, Hayward, CA) glycans (Fan et al. 2015).
Statistical analysis of glycoform distributions
Differences among the glycoform distributions were evaluated by comparing the mean
obtained from two independent experiments. Depending on equality of variances, different
post-hoc tests were performed to assess the statistical significance of the differences among
the means. First, the variances of each treatment were compared using Levene’s test. If the
variances were observed to be equal, a one-way ANOVA was performed to evaluate the
differences between the means of the treatments. Where the ANOVA yielded statistically
significant differences (pANOVA<0.05), Tukey’s honest significant difference test was
performed post-hoc for pairwise comparisons. For data where the variances were found to be
unequal, a one-way Welch’s ANOVA was performed, and if this analysis yielded statistical
significance (pWELCH<0.05), the Games-Howell post hoc test was performed for pairwise
comparisons. All statistical analysis was performed using the IBM SPSS Statistics software,
v.20 (SPSS Inc. 2011).
Sample preparation for proteomics analysis
Two biological replicates from days 2 and 9 of the NGS fed batch process were subjected to
proteomics analysis using iTRAQ (isobaric Tags for Relative and Absolute Quantification)
labeling mass spectrometry (Aggarwal et al. 2006; Pottiez et al. 2012). The harvested cells
were washed with ice-cold PBS (Invitrogen, Life Technologies, Carlsbad, CA), flash-frozen
in liquid nitrogen and stored at -80°C prior to cell lysis. For lysis, the cells were thawed and
immediately resuspended in SDS-lysis buffer (2% SDS (w/v), 1mM EDTA and 0.1mM
phenylmethylsulfonyl fluoride [PMFS], pH = 8 adjusted with triethylammonium bicarbonate
[TEABC], Sigma-Aldrich) and sonicated on ice three times for 30 seconds with a probe

Acc
epte
d P
repr
int
This article is protected by copyright. All rights reserved
sonicator. The total protein concentration of the lysate was measured with the BCA assay
(Thermo scientific).
The lysates were then reduced by incubation in a final concentration of 4.5mM Tris-(2-
carboxyethyl) phosphine (TCEP, Sigma-Aldrich) at 60°C for 1 hour and subsequently
alkylated by incubation in a final concentration of 8.3mM methyl methanethiosulfonate
(MMTS, Sigma-Aldrich) at room temperature in the dark for 30 min using a modified filter-
aided sample preparation (FASP) protocol based on Wisniewski et al. (2009). 90µg of the
obtained protein from each sample were diluted with 9M Sequanal grade urea (Thermo
scientific) to obtain a final SDS concentration of 0.09% (w/v). This mixture was incubated at
room temperature in the dark for 1 hour after which the low-molecular-weight substances
were removed by ultracentrifugation using a 10KDa cutoff 0.5ml Amicon filter (Millipore).
The retained proteins were digested by incubation with 50µL of LysC digestion buffer (50
mM TEABC, pH=8) containing 4.5 µg of LysC enzyme (Wako Pure Chemical Industries,
Japan) at 37°C for 4 hours and additional incubation with 350µL trypsin LysC digestion
buffer (50 mM TEABC, pH=8) containing 10 µg trypsin enzyme (Promega Corporation,
Madison, WI) at 37°C overnight. The digested peptides were dried using SpeedVac (Savant,
Thermo Scientific) prior to iTRAQ labelling. The iTRAQ 8-plex reagent was dissolved in
50μL of isopropanol following the manufacturer's instructions (AB Sciex, Framingham,
MA). Each dried peptide sample was dissolved in a mixture of 17µL H2O, 20µL 0.5M
TEABC and 50µL of iTRAQ 8-plex reagent solution and incubated for 2 hours at room
temperature in the dark. Peptides from different samples with their unique iTRAQ labeling
were mixed, dried and resuspended into 1mL of 10mM TEABC prior to peptide fractionation
using basic pH reversed-phase liquid chromatography (bRPLC).

Acc
epte
d P
repr
int
This article is protected by copyright. All rights reserved
Fractionation of peptides
The bRPLC method was performed to improve identification of unique peptides in the
sample as was described byBaycin-Hizal et al. (2012). Peptides were fractionated on an
XBridge C18 Column (5 µm, 2.1 x 100 mm, Waters, Milford, MA) with an XBridge C18
Guard Column (5 µm, 2.1 x 10 mm, Waters), using an Agilent HPLC system consisting of a
1100 series binary pump, a 1200 series UV detector and a 1200 series micro-fraction
collector. Fractionation of peptides was carried out by a linear gradient (T0 min =10% B, T10
min=10% B, T50 min=35% B, T50.1 min=70% B, T60 min =70% B, T60,1min = 100% B,
T70 min = 100% B, T70.1 min = 10% B, T95 min = 10% B) between solvent A (10 mM
TEABC, Sigma-Aldrich) and solvent B (10 mM TEABC in 90%v/v Acetonitrile, Sigma-
Aldrich) with a flow rate of 250µL/min. 84 bRP fractions were collected and re-combined
into 24 fractions and then dried in a SpeedVac (Savant, Thermo Scientific) prior to liquid
chromatography/tandem mass spectrometry (LC-MS/MS) analysis.
LC-MS/MS analysis
The LC-MS/MS analysis of the different fractions of the peptides was performed using an
LTQ Orbitrap Velos MS/MS in FTFT (Thermo Scientific) interfaced with a 2D nanoLC
system (Eksigent, AB Sciex), as described previously (Baycin-Hizal et al. 2012), but with the
following modified parameters. Precursor and fragment ions were explored in tandem MS
analysis at a resolution of 30000 and 15000, respectively. Survey scans (full ms) were
acquired on the Orbitrap within an m/z range between 350-1700Da. Precursor ions were
individually isolated with a 1.2Da window and fragmented (MS/MS) using 40% collision
energy in order to achieve higher collision dissociation (HCD) activation. The MS/MS
spectra were analyzed using the Mascot software (v2.2.2, Matrix Science, London, UK) in
the framework of ProteomeDiscoverer v1.4 (PD1.3; Thermo Scientific) with fixed
modifications of N-terminal 8-plex-iTRAQ labeling and cysteine methylthiolation and

Acc
epte
d P
repr
int
This article is protected by copyright. All rights reserved
variable modifications of methionine oxidation and 8-plex-iTRAQ labeling of tyrosine and
lysine.
MS data analysis
The obtained MS data was compared against the cricetulus_g_v2 custom database, which
was constructed using the RefSeq annotation of the CHO genomic sequence downloaded in
October, 2013. Protein identification was performed using Mascot v2.2.2 (Matrix Science)
where the searches were processed with a confidence threshold of 1% False Discovery Rate
(FDR). Protein ratios were calculated based on the median value of the unique peptide ratios.
Comparative proteomics analysis
A BLASTp search of all identified proteins was performed against the mouse, human and rat
RefSeq databases (accessed on November, 2013) in order to find the closest homologous
proteins (lowest E-value) in these species. Identifiers, including RefSeq Protein Accession,
ENSEMBL gene ID, UNIPROT accession and Agilent ID for each protein were subsequently
obtained using the Gene ID conversion Tool from the DAVID database (Huang da et al.
2009a; Huang da et al. 2009b) (from November, 2013). Gene set enrichment analysis (GSEA)
(Subramanian et al. 2005) was performed on the proteins that exhibited differential expression
between days 2 and 9. The resulting data were used to identify the up and down-regulated
gene sets (between 15 and 500 genes per set) between days 2 and 9 of the NGS fed-batch
process. This analysis was performed using both the functional database (a combination of
Biocarta, KEGG and Reactome databases) and the gene ontology database (downloaded from
Molecular Signatures Database v4.0, http://www.broadinstitute.org/gsea/msigdb/index.jsp).
Leading edge genes (genes that are core representatives of their gene set with FDR q-value
cutoff of 0.25) were identified using Leading-edge analysis. An enrichment map (Merico et
al. 2010) of the gene clusters were obtained in Cytoscape v3.1.1 using the GSEA results as
input, a p-value cutoff of 0.05 and an FDR q-value cutoff of 0.25. A direct search using all

Acc
epte
d P
repr
int
This article is protected by copyright. All rights reserved
identified proteins from MS analysis against an in-house reconstruction of the CHO secretory
pathway network (Table SX) was performed with a log2 expression cut off of ±0.8 and a p-
value cutoff of 0.05 in order to analyze the secretion machinery of the cells. Moreover, all
identified proteins that are involved in nucleotide sugar biosynthesis pathway and glycan
biosynthesis pathway were sorted out and evaluated.
Results and Discussion
During fed-batch manufacturing of mAbs, glucose concentration and culture duration are
considered to be critical parameters for both productivity and quality (Pacis et al. 2011; Xie et
al. 1997). Therefore, lack of control in these parameters is always risky for mAb
manufacture. Here, we investigate the effect of glucose starvation during early stationary
phase of fed-batch culture and the effect of culture duration on mAb productivity and
glycosylation. Our results contribute to further understand how glucose starvation and culture
duration impact CHO cell physiology in fed-batch culture processes and yields insight into
potential metabolic and/or proteomic causes for these effects.
Effect of glucose starvation
Culture performance and mAb productivity of four culture processes with different degrees of
glucose starvation (SGS, HGS, LGS and NGS) are shown in Figure 1 and are summarized in
Table I. As would be expected, glucose starvation during early stationary phase resulted in
earlier onset of cell death (Figures 1 A and B), reduced integral viable cell concentration
(IVC) (Figure 1 C), lactate depletion (Figure 1 E), and increased accumulation of NH4+
(Figure 1 F). Additionally, the level of glucose starvation negatively correlated with mAb
titer (Figure 1 C) and specific productivity (qp) (Figure 1 C slope of the curves).
Nucleotide sugars (NSs) are metabolites that are required as substrates for the elongation of
oligosaccharide chains during the process of glycosylation. Their concentrations in the cell
have been demonstrated to be one of the major causes of alterations in mAb glycopatterns

Acc
epte
d P
repr
int
This article is protected by copyright. All rights reserved
(Chee Furng Wong et al. 2005; Fan et al. 2015; Wong et al. 2010b). It has been previously
suggested that glucose depletion can reduce the biosynthesis of nucleotide sugars
(Kochanowski et al. 2008). In accordance with this hypothesis, we observed reduced (LGS)
or even fully depleted (HGS and SGS) intracellular concentrations of uridine diphosphate N-
acetylglucosamine (UDP-GlcNAc) and uridine diphosphate N-acetylgalactosamine (UDP-
GalNAc) when glucose availability was limited during early stationary phase of the fed-batch
culture (Figure 2 – bottom). Counterintuitively though, considerable accumulation of uridine
diphosphate glucose (UDP-Glc) and uridine diphosphate galactose (UDP-Gal) was observed
after glucose starvation was induced at day 9 of culture (Figure 2 – top). Although this
finding may be seen as conflicting, a clear explanation can be found when considering the
steps involved in NS biosynthesis and glutamine metabolism in CHO cells. Figure 2 shows a
simplified metabolic diagram for NS biosynthesis from glucose and glutamine (Gln) as
primary substrates. There, we see that Fru-6P and Gln are combined to yield glucosamine 6-P
(GlcN-6P), which eventually is converted to UDP-GlcNAc. Glutamine, in turn, has been
widely reported to be consumed as an important carbon and energy source by CHO cells
(Ahn and Antoniewicz 2013; Dean and Reddy 2013; Templeton et al. 2013; Young 2013).
These authors have reported that considerable amounts of the Gln consumed during CHO cell
culture is deamidated to yield ammonia and glutamate (Glu), the latter of which is then
converted to TCA cycle intermediates such as oxaloacetate and -ketoglutarate ( -KG). It is
likely that under glucose starvation, glutamine and other amino acids uptake towards TCA
cycle intermediates is increased in an attempt to sustain cellular energetic requirements, and
that this increased glutaminolysis towards TCA cycle intermediates translates into a
decreased flux of Gln towards GlcN-6P and eventual UDP-GlcNAc formation.
Simultaneously, the flux of glucose that is not being converted to UDP-GlcNAc due to lack
of Gln availability may be funneled towards UDP-Glc and UDP-Gal formation, possibly
Acc
epte
d P
repr
int
This article is protected by copyright. All rights reserved
generating the observed accumulation in the HGS and SGS cultures. This mechanism is
further substantiated by the observed increase in both Glu and NH4+ concentration seen in
Figures 1 E and H, respectively, and a considerably higher Gln uptake rate in processes SGS
and HGS.
Alongside the possible metabolic effects described above, the consumption rate of the NSs
for the glycosylation reactions must be considered. It is possible that UDP-Gal accumulates
in the HGS and SGS cases because they present lower specific mAb productivity (Figure 1
C). If the drop in qp for these cases is higher than the drop in UDP-Gal biosynthesis, this NS
would accumulate. Similarly, the NGS and LGS cases present accumulation of UDP-GlcNAc
(Figure 2), higher Man 5 (Figure 3 A) and lower GlcNAc occupancy (Figure S1 A) after
glucose starvation is induced. It is possible that UDP-GlcNAc accumulates in these cases
because consumption of this NS towards glycosylation is lower. These results highlight the
interplay between nucleotide sugar metabolism and recombinant protein productivity.
The considerable changes in glycoform distribution observed between days 5 and 9 of culture
reduce visibility of changes in glycosylation after glucose starvation is induced in Figures 3
and 4. However, a positive correlation between the degree of glucose starvation and the
maturation of glycans was observed in repeated experiments.
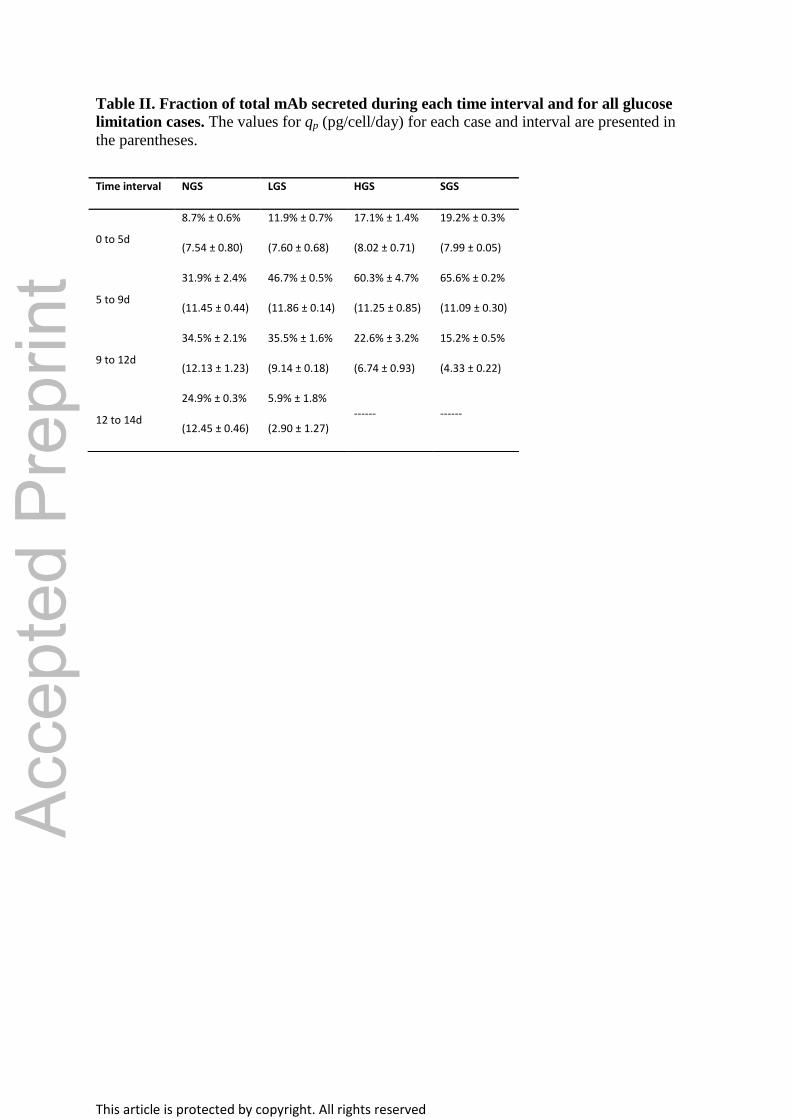
In Table II, the fractions of secreted mAb change during the intervals depend on variations in
specific productivity (qp), which are most likely a consequence of glucose availability for
each case. Specifically, a smaller fraction of the total mAb produced is being secreted by the
HGS and SGS cases in the interval where glucose limitation was introduced (9 to 12d). When
considering these changes in qp with respect to glucose availability, the reason why SGS
yields a distribution with more highly processed glycoforms at day 12 is that during the
starvation period, only 15.2% ± 0.5% of the total amount of mAb is produced. This lower
fraction is diluted with the product that has been secreted up to that point in culture (84.8% ±

Acc
epte
d P
repr
int
This article is protected by copyright. All rights reserved
0.5%), and it is the dilution effect which leads to lower apparent decreases in mature
glycoforms between days 9 and 12 (Figure 4). In contrast, a larger fraction of the total mAb is
produced for the cases of less glucose starvation during the starvation period and thus, the
dilution effect associated with changes in qp may mask the impact of cellular metabolism (via
nucleotide sugar biosynthesis) on glycosylation.
In order to account for the effect of qp on the glycan distributions after glucose limitation, the
relative amount of each mAb glycoform produced (fi) during the interval was calculated
based on a material balance for glycoform i (mAbi) over the starvation period:
… Eq. 1
Where qp is the mAb specific productivity and Xv is the average cell density over the time
interval (from t1=9d to t2=12d for the starvation period). And considering
that , we find a simpler expression for fi:
… Eq. 2
In equation 2, fi represents the mass fraction of mAb glycoform i produced relative to the
total amount of mAb secreted during the time interval. Because Fc glycan variation accounts
for very small changes in mAb molecular weight (<0.05%), fi was assumed to be a close
approximation to the mole fraction of mAb glycoform i per total moles of mAb produced
over the starvation interval.
Figure 4 shows the fractions calculated with equation 2 for the interval before (day 5 to 9)
and after (day 9 to 12) glucose starvation is induced for all degrees of glucose limitation
(NGS, LGS, HGS and SGS). As expected, there are no statistical differences between the
cases prior to glucose starvation (day 5 to 9) given that up to this point, all cultures were
performed under similar conditions. However, statistically significant differences can be

Acc
epte
d P
repr
int
This article is protected by copyright. All rights reserved
observed for Man5, G1F and G2F between the time intervals and among certain glucose
starvation conditions during the 9 to 12d interval.
Figure 4A shows that more Man5 is secreted during the 9 to 12d interval for all but the SGS
culture. Within this interval, and depending on the different glucose starvation conditions,
there is a decreasing trend where less Man5 is produced at higher glucose starvation. These
results are reflected in GlcNAc occupancy (Figure 4, bottom row).
When considering the intracellular UDP-GlcNAc concentrations presented in Figure 2, it is
evident that lack of availability of this NS is not causing the increase in Man5 secretion for
the NGS and LGS cultures. This is further substantiated by the small decrease in G0F
glycoform secretion after glucose starvation for NGS, and no statistically significant changes
in A1G0F secretion (Figures 4 B and C). If UDP-GlcNAc availability were limiting,
secretion of both these glycoforms would also be negatively impacted. Furthermore, the
intracellular accumulation of UDP-GlcNAc, the increase in Man5 secretion, and the relative
stability of G0F secretion imply that the rate limiting step is the reaction catalysed by the
GnTI enzyme. The measured ranges for extracellular pH and ammonia concentration are
below those that have been previously reported to impact the activity or Golgi localisation of
GnTI (Borys et al. 1993; Gawlitzek et al. 2000; Rivinoja et al. 2009). The remaining possible
cause for increased Man5 secretion in the least glucose-deprived cultures is the abundance of
GnTI relative to specific mAb productivity (Figure S2). When considering this is the
limitation, intracellular accumulation of UDP-GlcNAc is explained: a low GnTI to qp ratio in
NGS and LGS reduces the rate of GlcNAc transfer onto Man5, and because less UDP-
GlcNAc is being consumed for this reaction, this NS accumulates within the cells.
In contrast to GlcNAc occupancy, production of galactosylated glycoforms (G1F and G2F,
Figures 4 D and E, respectively) increases with higher glucose starvation. No statistical
differences were observed for G1F secretion before and after starvation for the HGS and SGS
Acc
epte
d P
repr
int
This article is protected by copyright. All rights reserved
cultures, but a decrease of 1.5% ± 0.3% was observed for NGS and LGS (p<0.05). In general,
more G2F glycoform was produced during the starvation interval. However, a more
pronounced increase in G2F secretion before and after starvation was observed for the HGS
and SGS cultures (P<0.001). The above results are also clearly reflected in Gal occupancy
(Figure 4, bottom row). Specifically, galactose occupancy was not affected for the HGS and
SGS cases, but was observed to decrease for NGS and LGS (p<0.05).
When comparing galactose occupancy with intracellular UDP-Gal availability (Figure 2), we
see a positive correlation. Higher intracellular UDP-Gal availability occurs for the most
glucose starved cultures (HGS and SGS). In turn, these cultures present higher galactose
occupancy during the starvation interval. The mechanisms underlying the interplay between
intracellular UDP-Gal concentration, galactose occupancy and specific mAb productivity are
consistent with the arguments put forth for GlcNAc. UDP-Gal accumulation in HGS and SGS
is unlikely due to excess biosynthesis because these cultures were performed under
considerable glucose limitation. Considering this, the most likely cause for intracellular UDP-
Gal accumulation is that it is being consumed at a lower rate due to the low specific mAb
productivity observed under these glucose starvation conditions (HGS and SGS). In turn, a
lower qp also implies higher residence time within the Golgi apparatus which would allow for
further processing of the mAb-bound glycans, leading to higher galactose occupancy.
Effect of culture duration
Appropriate harvest criteria need to be selected for mAb manufacture. Here, we analyzed the
fed-batch culture at different time points and try to understand the balance between titer and
quality of the mAbs in relation to the culture duration.
As shown in Figure 1 C, the specific productivity of mAbs was lower in early growth phase
(slope 1, day 2 to 5) comparing to that in late growth phase and early stationary phase (slope
2, day 5 to 9), which indicates there is an increase in qp after temperature shift.
Acc
epte
d P
repr
int
This article is protected by copyright. All rights reserved
With regards to glycosylation (Figure 3 and Figure S1), it has been demonstrated by a trend
of overall increases in Man5 and A1G0F, and decreases in G1F, G2F, and GlcNac and
galactose occupancy along cultivation. This finding is in accordance with the apparent
accumulation of UDP-GlcNAc and UDP-Gal during the cell culture as well (Figure 2).
More specifically, the most dramatic changes in glycoform distribution observed in this study
occur between days 5 and 9 (Figure 3), where Man5 glycoform abundance increases by
11.6% ± 0.3% and the G1F glycoform decreases by 11.9% ± 0.7%. The similarity between
the changes in Man5 and G1F abundance is striking and is likely related: higher Man5
production leaves less glycoprotein substrate available for galactosylation during later stages
of the glycosylation process within the Golgi apparatus. It is therefore possible that the drop
in galactosylation is a direct consequence of high Man5 secretion.
A similar correlation (glycans become less processed with extended culture duration) has also
been reported in other studies (Bibila and Robinson 1995; Hooker et al. 1995; Pacis et al.
2011; Robinson et al. 1994; Shi and Goudar 2014), which indicate that this could be a general
phenomenon. Three major hypotheses have been proposed explaining such a phenomenon:
(1) A bottleneck in the availability of nucleotide sugar substrates with respect to culture
duration may exist (Hooker et al. 1995). However, this possibility can be ruled out in the
NGS process, as the nucleotide sugar substrates such as UDP-GlcNAc and UDP-Gal were
accumulated in the cells over time (Figure 2). (2) Cell death and lysis, may elevate the
activity of extracellular glycosidase, especially sialidase in the culture, and thus increase the
glycan degradation (Chee Furng Wong et al. 2005). However, it has also been demonstrated
that CHO-derived glycosidases including β-galactosidase, β-hexosaminidase may be less
likely to contribute to the lower GlcNAc and Gal occupancy, since they exhibit very low
activity at typical culture pH (Gramer and Goochee 1993). (3) Reduced expression or activity
of Golgi-associated mannosidase and glycosyltransferases during the course of culture

Acc
epte
d P
repr
int
This article is protected by copyright. All rights reserved
(Robinson et al. 1994) can lead to high mannose and low galactosylation. However, as
reported previously, the changes in expression of GlcNAc transferase I (GnT1) during the
course of a cell culture is cell line-dependent and do not show any general trend of decline
(Fan et al. 2015; Pacis et al. 2011). Additionally, no apparent down-regulation was observed
in the expressions of GlcNAc transferase II (GnTII) and various galactose transferases (GalT)
along with increased culture duration (Wong et al. 2010a). Temperature shift may contribute
to the decreases before and after day 5 in glycan maturation as a result of reduced activities of
these enzymes. Additionally, Figure 1 C also shows that the qp increases after the temperature
shift on day 5 (slope 1 vs. slope 2). Therefore, it is possible that this increase in qp causes the
decrease in glycoform complexity between 5 and 9 days of culture (This correlation is also
indicated by Figure S2). If the abundance of GnTI relative to the qp goes below a certain
level, lower GlcNAc occupancy will be achieved. These results point to the importance of
considering the capability of glycosylation machinery available with respect to specific
productivity. However, all the three major hypotheses do not completely explain the reported
system-level data. Further investigations are needed in understanding the root cause of this
type of glycosylation change.
Comparative proteomics analysis between early growth phase and early stationary
phase in fed-batch
In order to gain insight into the fundamental differences in the cell culture from early growth
phase to early stationary phase, in-depth analysis of proteome changes in cells from the two
phases in the NGS process was performed.
In total across all samples, 5113 proteins were identified with FDR<1% in the proteomics
data (Table SIII), in which 4647 proteins were processed using gene set enrichment analysis
(GSEA, Table SV). 3294 proteins were enriched into 228 and 334 gene sets using functional
database and gene ontology database, respectively (Tables SVI and SVIII). Enrichment maps

Acc
epte
d P
repr
int
This article is protected by copyright. All rights reserved
illustrating GSEA results were built. The enriched gene sets containing genes with
statistically significant changes in protein level between early growth phase and early
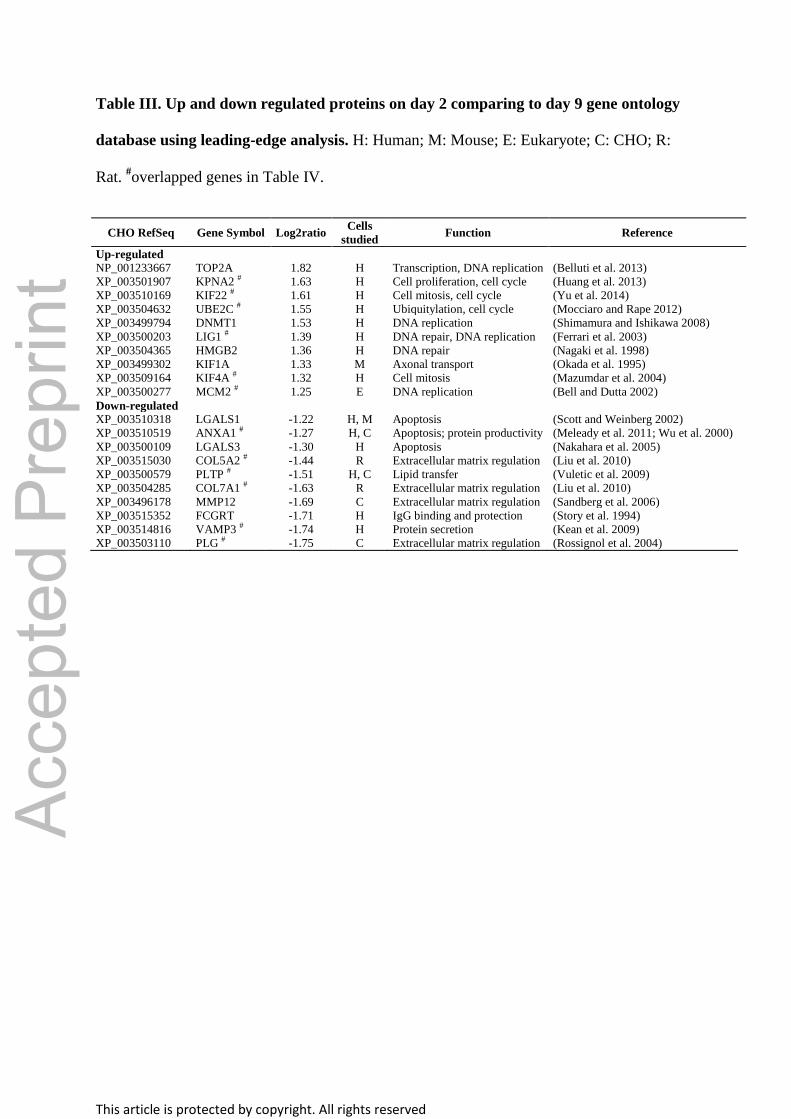
stationary phase were shown in Figure 5. Further leading-edge analysis (LEA) was performed
using the output from GSEA (Supplementary material II). The top 10 up and down-regulated
genes (Tables III and IV) and enriched gene sets (Tables SI and SII) from LEA were shown.
Briefly, the genes in the gene sets with transcription, cell cycle and nucleotide metabolism
related activity were generally expressed at higher level in early growth phase, which is
consistent with the rapid cell growth during this phase. The majority of proteins encoded by
these genes are located in nucleus (283 proteins).
On the other hand, the genes in the gene sets regarding glucose, lipid, and nucleotide sugar
metabolism, environmental sensing and signal transduction, protein trafficking and secretion,
extracellular matrix regulation, glycosylation and apoptosis related activity were up-regulated
in early stationary phase. The proteins encoded by these genes are mainly located at
membrane (262 proteins) and extracellular region (45 proteins).
Specifically, increasing environmental sensing and signal transduction related activity in
early stationary phase involved a number of gene sets found in both databases. This implies
that cells may be more sensitive to and tightly regulated upon environmental changes, for
example media and process conditions in early stationary phase than in early growth phase.
Another interesting point we found is that protein trafficking and secretion were more active
in early stationary phase with regard to in early growth phase, as a large set of genes involved
in this activity were up-regulated. Therefore, we suggest that the cellular machinery in
relation to protein secretion was more active for cells in early stationary phase than in early
growth phase. In contrast to that, genes in the gene sets regarding glycosylation related
activity are very few, although they were shown to be up-regulated (Figure 5).
Acc
epte
d P
repr
int
This article is protected by copyright. All rights reserved
Taking one step more, we further specifically analyzed the proteome involved in the secretion
machinery (Table SXI), nucleotide sugar synthesis pathway (Table SXII) and biosynthesis
pathway of N-glycans (Table SXIII).
The relative activation of secretion machinery during the early stationary phase has been
demonstrated in (Table SXI). We found that 12 proteins were up-regulated in early stationary
phase within our cut-off criteria. Out of the 12 proteins three (XP_007653021,
XP_003499981 and XP_003512468) are directly related to protein transport in the cell and
three (XP_003504664, XP_003501071 and XP_003507839) are responsible for protein
folding. In contrast, only seven proteins were up-regulated in early growth phase within the
cut-off criteria. Interestingly, three of them were heat-shock proteins (HSP), which may
reflect the effect of temperature shift during the culture. It is also worth to mention that many
of the HSPs are glycosylated (Baycin-Hizal et al. 2012), and the glycosylation of them might
compete with recombinant protein glycosylation.
In the nucleotide sugar synthesis pathway, Proteins XP_007612718, NP_001233687 and
XP_003515993 that are responsible for UDP-Glc and UDP-Gal biosynthesis were slightly
up-regulated in early stationary phase (Table SXII). The expressions of NP_001233638 and
XP_003514714 that can direct UDP-GlcNAc to UDP-GalNAc and N-Acetyl-D-
mannosamine (ManNAc), respectively, were higher in early stationary phase. These results
are in agreement with the findings above (Figure 5) that genes involved in nucleotide sugar
metabolism were generally up-regulated in early stationary phase.
Regarding the biosynthesis pathway of N-glycans (Table SXIII), three proteins
(XP_003500143, XP_003500900, XP_003508783) that are responsible for initiation of N-
glycosylation in the ER were slightly up-regulated during early stationary phase. Very
interestingly, the expression of only two protein α-mannosidase II (XP_003499415) and

Acc
epte
d P
repr
int
This article is protected by copyright. All rights reserved
GnT1 (NP_001230909) involved in glycan maturation in Golgi apparatus were slightly
higher during early stationary phase.
Taken together, the essential causal link between producing the more processed glycans in
early growth phase than in early stationary phase could be narrowed down to the following
two possibilities: Firstly, it may be attributed to the overall capabilities of protein secretion
machinery from early growth phase to early stationary phase in the cells gradually exceeding
the capability of protein glycosylation machinery that is specifically responsible for glycan
maturation (indicated by the proteomics data and the data of intervals day 0-5 and day 5-9 in
Figure S2). Secondly, it is also possible that the activities of enzymes that raise GlcNac and
Gal occupancy may be reduced due to certain environmental change and/or physiological
response (e.g. temperature shift and/or pH gradient across the network of ER and Golgi
apparatus) of the cells with the cultivation duration increased.
Conclusion
Using the multi-pronged omics-based approaches, we have shown here the effects of glucose
starvation and culture duration on fed-batch CHO cell culture producing monoclonal
antibody and the underlying reasons that cause such effects. Glucose starvation at early
stationary phase of the fed-batch culture exhibited a negative impact on growth, viability, and
specific productivity of the cells. It was also shown that the changes of glycoforms (increased
GlcNAc and Gal occupancy) in regard to increased degree of glucose starvation are most
likely as a result of interplay between the dilution effect associated with change in qp and the
changed nucleotide sugar metabolism. On the other hand, the effect of culture duration on the
glycopatterns is dramatic. In general, longer culture duration seems to generate a higher
abundance of less processed glycan structures. Especially between samples from early growth
phase (days 2 and 5) and early stationary phase (day 9), the extent of such effect is immense,
which was thought to be correlated with the fundamental physiological difference between

Acc
epte
d P
repr
int
This article is protected by copyright. All rights reserved
cells in the two phases. For that reason, we took one step further to examine the differences
between proteome levels in these two phases. We found that the expression of proteins
regarding cell cycle progression and cell divisions are generally up-regulated in early growth
phase. On the other hand, expression of proteins that is responsible for regulating cellular
metabolism, extracellular matrix, apoptosis, protein secretion and glycosylation is generally
higher in early stationary phase. Very importantly, a large repertoire of proteins concerning
secretion machinery was generally up-regulated in early stationary phase, whereas only two
proteins (α-mannosidase II and GnT1) regarding glycan maturation in Golgi apparatus were
found to be slightly up-regulated. In this way, we gained deeper insight into the culture
behavior and recombinant protein production on the basis of the molecular features of the
cells. From the process control perspective, this proteome information could help discover
and apply knowledge of cellular functions in response to changes in process conditions, in
order to explore possiblities of producing recombinant product with optimal productivity and
quatlity.
We have not excluded the possibility of cell line specific effects on our data, and ideally
different cell lines should be further investigated. However, the omics-based analysis
constitutes a powerful tool for studying the physiological profiles of cells under different
culture conditions and linking that with the quantity and quality of the recombinant product.
Acc
epte
d P
repr
int
This article is protected by copyright. All rights reserved
References
Aggarwal K, Choe LH, Lee KH. 2006. Shotgun proteomics using the iTRAQ isobaric tags.
Brief Funct Genomic Proteomic 5(2):112-20.
Ahn WS, Antoniewicz MR. 2013. Parallel labeling experiments with [1,2-(13)C]glucose and
[U-(13)C]glutamine provide new insights into CHO cell metabolism. Metab Eng
15:34-47.
Baycin-Hizal D, Tabb DL, Chaerkady R, Chen L, Lewis NE, Nagarajan H, Sarkaria V,
Kumar A, Wolozny D, Colao J and others. 2012. Proteomic analysis of Chinese
hamster ovary cells. J Proteome Res 11(11):5265-76.
Bibila TA, Robinson DK. 1995. In pursuit of the optimal fed-batch process for monoclonal
antibody production. Biotechnol Prog 11(1):1-13.
Borys MC, Linzer DI, Papoutsakis ET. 1993. Culture pH affects expression rates and
glycosylation of recombinant mouse placental lactogen proteins by Chinese hamster
ovary (CHO) cells. Bio/Technology 11(6):720-724.
Cao Y, Kimura S, Itoi T, Honda K, Ohtake H, Omasa T. 2012. Construction of BAC-based
physical map and analysis of chromosome rearrangement in Chinese hamster ovary
cell lines. Biotechnol Bioeng 109(6):1357-67.
Chee Furng Wong D, Tin Kam Wong K, Tang Goh L, Kiat Heng C, Gek Sim Yap M. 2005.
Impact of dynamic online fed-batch strategies on metabolism, productivity and N-
glycosylation quality in CHO cell cultures. Biotechnol Bioeng 89(2):164-77.
Dean J, Reddy P. 2013. Metabolic analysis of antibody producing CHO cells in fed-batch
production. Biotechnol Bioeng 110(6):1735-47.
Druz A, Son YJ, Betenbaugh M, Shiloach J. 2013. Stable inhibition of mmu-miR-466h-5p
improves apoptosis resistance and protein production in CHO cells. Metab Eng 16:87-
94.
Acc
epte
d P
repr
int
This article is protected by copyright. All rights reserved
Fan Y, Jimenez Del Val I, Müller C, Wagtberg Sen J, Rasmussen SK, Kontoravdi C,
Weilguny D, Andersen MR. 2015. Amino acid and glucose metabolism in fed-batch
CHO cell culture affects antibody production and glycosylation. Biotechnol Bioeng
112(3):521-535.
Gagnon M, Hiller G, Luan YT, Kittredge A, DeFelice J, Drapeau D. 2011. High-end pH-
controlled delivery of glucose effectively suppresses lactate accumulation in CHO
fed-batch cultures. Biotechnol Bioeng 108(6):1328-37.
Gawlitzek M, Ryll T, Lofgren J, Sliwkowski MB. 2000. Ammonium alters N-glycan
structures of recombinant TNFR-IgG: degradative versus biosynthetic mechanisms.
Biotechnol Bioeng 68(6):637-46.
Goetze AM, Liu YD, Zhang Z, Shah B, Lee E, Bondarenko PV, Flynn GC. 2011. High-
mannose glycans on the Fc region of therapeutic IgG antibodies increase serum
clearance in humans. Glycobiology 21(7):949-59.
Gramer MJ, Goochee CF. 1993. Glycosidase Activities in Chinese Hamster Ovary Cell
Lysate and Cell Culture Supernatant. Biotechnol Prog 9(4):366-373.
Hooker AD, Goldman MH, Markham NH, James DC, Ison AP, Bull AT, Strange PG,
Salmon I, Baines AJ, Jenkins N. 1995. N-glycans of recombinant human interferon-γ
change during batch culture of chinese hamster ovary cells. Biotechnol Bioeng
48(6):639-648.
Hossler P, Khattak SF, Li ZJ. 2009. Optimal and consistent protein glycosylation in
mammalian cell culture. Glycobiology 19(9):936-49.
Hu WS, Dodge TC, Frame KK, Himes VB. 1987. Effect of glucose on the cultivation of
mammalian cells. Dev Biol Stand 66:279-90.

Acc
epte
d P
repr
int
This article is protected by copyright. All rights reserved
Huang da W, Sherman BT, Lempicki RA. 2009a. Bioinformatics enrichment tools: paths
toward the comprehensive functional analysis of large gene lists. Nucleic Acids Res
37(1):1-13.
Huang da W, Sherman BT, Lempicki RA. 2009b. Systematic and integrative analysis of large
gene lists using DAVID bioinformatics resources. Nat Protoc 4(1):44-57.
Jefferis R. 2012. Isotype and glycoform selection for antibody therapeutics. Arch Biochem
Biophys 526(2):159-66.
Jimenez Del Val I, Kyriakopoulos S, Polizzi KM, Kontoravdi C. 2013. An optimized method
for extraction and quantification of nucleotides and nucleotide sugars from
mammalian cells. Anal Biochem 443(2):172-80.
Kildegaard HF, Baycin-Hizal D, Lewis NE, Betenbaugh MJ. 2013. The emerging CHO
systems biology era: harnessing the 'omics revolution for biotechnology. Curr Opin
Biotechnol 24(6):1102-7.
Kochanowski N, Blanchard F, Cacan R, Chirat F, Guedon E, Marc A, Goergen JL. 2008.
Influence of intracellular nucleotide and nucleotide sugar contents on recombinant
interferon-gamma glycosylation during batch and fed-batch cultures of CHO cells.
Biotechnol Bioeng 100(4):721-33.
Lewis NE, Liu X, Li Y, Nagarajan H, Yerganian G, O'Brien E, Bordbar A, Roth AM,
Rosenbloom J, Bian C and others. 2013. Genomic landscapes of Chinese hamster
ovary cell lines as revealed by the Cricetulus griseus draft genome. Nat Biotechnol
31(8):759-65.
Lim Y, Wong NS, Lee YY, Ku SC, Wong DC, Yap MG. 2010. Engineering mammalian cells
in bioprocessing - current achievements and future perspectives. Biotechnol Appl
Biochem 55(4):175-89.
Acc
epte
d P
repr
int
This article is protected by copyright. All rights reserved
Liu B, Spearman M, Doering J, Lattova E, Perreault H, Butler M. 2014. The availability of
glucose to CHO cells affects the intracellular lipid-linked oligosaccharide distribution,
site occupancy and the N-glycosylation profile of a monoclonal antibody. J
Biotechnol 170:17-27.
McGettigan PA. 2013. Transcriptomics in the RNA-seq era. Curr Opin Chem Biol 17(1):4-
11.
Merico D, Isserlin R, Stueker O, Emili A, Bader GD. 2010. Enrichment map: a network-
based method for gene-set enrichment visualization and interpretation. PLoS ONE
5(11):e13984.
Pacis E, Yu M, Autsen J, Bayer R, Li F. 2011. Effects of cell culture conditions on antibody
N-linked glycosylation—what affects high mannose 5 glycoform. Biotechnol Bioeng
108(10):2348-2358.
Pottiez G, Wiederin J, Fox HS, Ciborowski P. 2012. Comparison of 4-plex to 8-plex iTRAQ
quantitative measurements of proteins in human plasma samples. J Proteome Res
11(7):3774-81.
Raju TS. 2008. Terminal sugars of Fc glycans influence antibody effector functions of IgGs.
Curr Opin Immunol 20(4):471-8.
Rivinoja A, Hassinen A, Kokkonen N, Kauppila A, Kellokumpu S. 2009. Elevated Golgi pH
impairs terminal N-glycosylation by inducing mislocalization of Golgi
glycosyltransferases. J Cell Physiol 220(1):144-154.
Robinson DK, Chan CP, Yu Lp C, Tsai PK, Tung J, Seamans TC, Lenny AB, Lee DK, Irwin
J, Silberklang M. 1994. Characterization of a recombinant antibody produced in the
course of a high yield fed-batch process. Biotechnol Bioeng 44(6):727-735.
Acc
epte
d P
repr
int
This article is protected by copyright. All rights reserved
Rouiller Y, Perilleux A, Collet N, Jordan M, Stettler M, Broly H. 2013. A high-throughput
media design approach for high performance mammalian fed-batch cultures. MAbs
5(3):501-11.
Shi HH, Goudar CT. 2014. Recent advances in the understanding of biological implications
and modulation methodologies of monoclonal antibody N-linked high mannose
glycans. Biotechnol Bioeng 111(10):1907-1919.
SPSS Inc. 2011. IBM SPSS Statistics for Windows. Armonk, NY: IBM Corp.
Subramanian A, Tamayo P, Mootha VK, Mukherjee S, Ebert BL, Gillette MA, Paulovich A,
Pomeroy SL, Golub TR, Lander ES and others. 2005. Gene set enrichment analysis:
A knowledge-based approach for interpreting genome-wide expression profiles.
PNAS 102(43):15545-15550.
Templeton N, Dean J, Reddy P, Young JD. 2013. Peak antibody production is associated
with increased oxidative metabolism in an industrially relevant fed-batch CHO cell
culture. Biotechnol Bioeng 110(7):2013-+.
Wisniewski JR, Zougman A, Nagaraj N, Mann M. 2009. Universal sample preparation
method for proteome analysis. Nat Methods 6(5):359-62.
Wong DC, Wong NS, Goh JS, May LM, Yap MG. 2010a. Profiling of N-glycosylation gene
expression in CHO cell fed-batch cultures. Biotechnol Bioeng 107(3):516-28.
Wong NS, Wati L, Nissom PM, Feng HT, Lee MM, Yap MG. 2010b. An investigation of
intracellular glycosylation activities in CHO cells: effects of nucleotide sugar
precursor feeding. Biotechnol Bioeng 107(2):321-36.
Xie L, Nyberg G, Gu X, Li H, Mollborn F, Wang DI. 1997. Gamma-interferon production
and quality in stoichiometric fed-batch cultures of Chinese hamster ovary (CHO) cells
under serum-free conditions. Biotechnol Bioeng 56(5):577-82.
Acc
epte
d P
repr
int
This article is protected by copyright. All rights reserved
Xu X, Nagarajan H, Lewis NE, Pan S, Cai Z, Liu X, Chen W, Xie M, Wang W, Hammond S
and others. 2011. The genomic sequence of the Chinese hamster ovary (CHO)-K1 cell
line. Nat Biotechnol 29(8):735-41.
Young JD. 2013. Metabolic flux rewiring in mammalian cell cultures. Curr Opin Biotechnol
24(6):1108-15.
Zheng K, Bantog C, Bayer R. 2011. The impact of glycosylation on monoclonal antibody
conformation and stability. MAbs 3(6):568-76.
Figure legends
Figure 1. Comparison of four fed-batch cultures with different levels of glucose starvation.
Viable cell density, viability and integral of viable cells (IVC) vs. titer are presented in A, B
and C, respectively. Glucose, lactate and ammonia concentrations in the course of cell culture
are shown in D, E and F, respectively. The error bars represent the standard deviation
calculated from duplicate experiments. The average specific production (+) or consumption
(–) rate of glucose, lactate, glutamine, glutamate and ammonia from day 9 to day 12 were
calculated as: . and are the concentration of nutrients or
metabolites in the cell culture on day 9 after feeding and on day 12 before feeding,
respectively. and are IVC on day 9 and day 12, respectively. Slope 1: from
day 2 to day 5; slope 2: from day 5 to day 9.
Figure 2. Intracellular nucleotide sugar analysis. Time course of concentration of
intracellular nucleotide sugars (UDP-Glc, UDP-Gal, UDP-GlcNAc and UDP-GalNAc) from
the cell cultures with different levels of glucose starvation were shown. Nucleotide sugar
synthesis typically starts from degradation of glucose through glycolysis, in which glucose
converts into glucose-6-phosphate and fructose-6 phosphate. Degradation of intracellular
glucose generates Glucose-6-phosphate (Glc-6P), which is a critical substrate involved in

Acc
epte
d P
repr
int
This article is protected by copyright. All rights reserved
glycolysis. Glc-6P can further become Fructose-6-pahospate (Fru-6P), which can enter into
the TCA cycle for energy production, or together with glutamine supply biosynthesis of
UDP-glucosamine (UDP-GlcNAc) and UDP-galactosamine (UDP-GalNAc. Alternatively,
Glc-6P can turn into Glucose-1-phosphate (Glc-1P), which is responsible for generating
UDP-glucose (UDP-Glc), UDP-galactose (UDP-Gal). In case of glucose starvation, lactate
can be used as alternative carbon source to drive the TCA cycle. Once lactate is depleted,
cells will mainly depend on using glutamine and other amino acids to support energy
production and thus generate NH4+.
Figure 3. Glycoprofiles of mAbs produced from the cell cultures with different levels of
glucose starvation. (A) Mannose 5, (B) A1G0F, (C) G1F and (D) G2F
Figure 4. Fraction of mAb glycoforms secreted before and during glucose limitation. The
fraction of the Man5 (A), A1G0F (B), G0F (C), G1F (D) and G2F (E) glycoforms are
presented for the intervals before (5 to 9d) and after (9 to 12d) of glucose limitation. Each bar
represents the different conditions of glucose limitation during the day 9 to 12 period: NGS,
LGS, HGS and SGS. The values shown correspond to means for duplicate (n=2) cultures and
statistical analysis was performed as described in the materials and methods. The criteria for
significant differences are: * for p<0.05, ** for p<0.01 and *** for p<0.001.
Figure 5. Enrichment map based on gene set enrichment analysis of comparative proteomics.
The analysis has been done using (A) functional database and (B) gene ontology database,
respectively. All enriched gene sets are represented as dots. The size of the dot indicates the
size of the gene set. Red dot signifies the genes in that gene set is generally up-regulated in
early growth phase (on day 2) of the fed-batch culture, whereas blue dot stands for general
up-regulation of the genes in early stationary phase (on day 9). Overlapped genes between the
two gene sets were shown as green line. The thickness of the green light represents the size of

Acc
epte
d P
repr
int
This article is protected by copyright. All rights reserved
the overlapped genes. Further clustering of the enriched gene sets based on their descriptions
was indicated using light blue circles.

Acc
epte
d P
repr
int
This article is protected by copyright. All rights reserved
Table I. Culture performance and mAb production under glucose starvations. * Control.
Process
name Description Glutamine Glutamate Lactate NH4+
Culture
process
mAb
production
NGS* No glucose starvation Not consumed Highly consumed Almost not
consumed Consumed Uninterrupted Uninterrupted
LGS Low glucose starvation Consumed Highly consumed Consumed and
depleted Produced Uninterrupted Reduced
HGS High glucose starvation Highly consumed Consumed Highly consumed
and depleted
Highly
produced Early-ended Highly reduced
SGS Severe glucose starvation Highly consumed Consumed Highly consumed
and depleted
Extremely
produced Early-ended
Extremely
reduced
Acc
epte
d P
repr
int
This article is protected by copyright. All rights reserved
Table II. Fraction of total mAb secreted during each time interval and for all glucose
limitation cases. The values for qp (pg/cell/day) for each case and interval are presented in
the parentheses.
Time interval NGS LGS HGS SGS
0 to 5d
8.7% ± 0.6%
(7.54 ± 0.80)
11.9% ± 0.7%
(7.60 ± 0.68)
17.1% ± 1.4%
(8.02 ± 0.71)
19.2% ± 0.3%
(7.99 ± 0.05)
5 to 9d
31.9% ± 2.4%
(11.45 ± 0.44)
46.7% ± 0.5%
(11.86 ± 0.14)
60.3% ± 4.7%
(11.25 ± 0.85)
65.6% ± 0.2%
(11.09 ± 0.30)
9 to 12d
34.5% ± 2.1%
(12.13 ± 1.23)
35.5% ± 1.6%
(9.14 ± 0.18)
22.6% ± 3.2%
(6.74 ± 0.93)
15.2% ± 0.5%
(4.33 ± 0.22)
12 to 14d
24.9% ± 0.3%
(12.45 ± 0.46)
5.9% ± 1.8%
(2.90 ± 1.27)
------ ------
Acc
epte
d P
repr
int
This article is protected by copyright. All rights reserved
Table III. Up and down regulated proteins on day 2 comparing to day 9 gene ontology
database using leading-edge analysis. H: Human; M: Mouse; E: Eukaryote; C: CHO; R:
Rat. #overlapped genes in Table IV.
CHO RefSeq Gene Symbol Log2ratio Cells
studied Function Reference
Up-regulated
NP_001233667 TOP2A 1.82 H Transcription, DNA replication (Belluti et al. 2013)
XP_003501907 KPNA2 # 1.63 H Cell proliferation, cell cycle (Huang et al. 2013)
XP_003510169 KIF22 # 1.61 H Cell mitosis, cell cycle (Yu et al. 2014)
XP_003504632 UBE2C # 1.55 H Ubiquitylation, cell cycle (Mocciaro and Rape 2012)
XP_003499794 DNMT1 1.53 H DNA replication (Shimamura and Ishikawa 2008)
XP_003500203 LIG1 # 1.39 H DNA repair, DNA replication (Ferrari et al. 2003)
XP_003504365 HMGB2 1.36 H DNA repair (Nagaki et al. 1998)
XP_003499302 KIF1A 1.33 M Axonal transport (Okada et al. 1995)
XP_003509164 KIF4A # 1.32 H Cell mitosis (Mazumdar et al. 2004)
XP_003500277 MCM2 # 1.25 E DNA replication (Bell and Dutta 2002)
Down-regulated
XP_003510318 LGALS1 -1.22 H, M Apoptosis (Scott and Weinberg 2002)
XP_003510519 ANXA1 # -1.27 H, C Apoptosis; protein productivity (Meleady et al. 2011; Wu et al. 2000)
XP_003500109 LGALS3 -1.30 H Apoptosis (Nakahara et al. 2005)
XP_003515030 COL5A2 # -1.44 R Extracellular matrix regulation (Liu et al. 2010)
XP_003500579 PLTP # -1.51 H, C Lipid transfer (Vuletic et al. 2009)
XP_003504285 COL7A1 # -1.63 R Extracellular matrix regulation (Liu et al. 2010)
XP_003496178 MMP12 -1.69 C Extracellular matrix regulation (Sandberg et al. 2006)
XP_003515352 FCGRT -1.71 H IgG binding and protection (Story et al. 1994)
XP_003514816 VAMP3 # -1.74 H Protein secretion (Kean et al. 2009)
XP_003503110 PLG # -1.75 C Extracellular matrix regulation (Rossignol et al. 2004)

Acc
epte
d P
repr
int
This article is protected by copyright. All rights reserved
Table IV. Up and down regulated proteins on day 2 comparing to day 9 found in
functional database using leading-edge analysis. H: Human; M: Mouse; E: Eukaryote; C:
CHO; #overlapped genes in Table III.
CHO RefSeq Gene Symbol Log2ratio Cells
studied Function Reference
Up-regulated
XP_003501907 KPNA2 #
Same as in table III
XP_003510169 KIF22 #
XP_003504632 UBE2C #
XP_003500203 LIG1 #
XP_003509164 KIF4A #
XP_003500277 MCM2 #
XP_003509175 MCM3 1.25 E DNA replication (Bell and Dutta 2002)
XP_003506293 DUT 1.25 H DNA replication (McIntosh et al. 1992)
XP_003498829 EIF5 1.15 R Translation initiation (Si et al. 1996)
XP_003512004 MCM5 1.14 E DNA replication (Bell and Dutta 2002)
Down-regulated
XP_003498026 CTSB -1.22 H Apoptosis, (Bruneel et al. 2005)
XP_003502412 IDUA -1.22 H Glycosaminoglycan metabolism (Bie et al. 2013)
XP_003515581 ABCA4 -1.22 M Phospholipid translocation (Weng et al. 1999)
NP_001233729 NEU1 -1.26 C Glycosylation (Chee Furng Wong et al. 2005)
XP_003510519 ANXA1 #
Same as in table III
XP_003515030 COL5A2 #
XP_003500579 PLTP #
XP_003504285 COL7A1 #
XP_003514816 VAMP3 #
XP_003503110 PLG #

Acc
epte
d P
repr
int
This article is protected by copyright. All rights reserved
Figure 1

Acc
epte
d P
repr
int
This article is protected by copyright. All rights reserved
Figure 2

Acc
epte
d P
repr
int
This article is protected by copyright. All rights reserved
Figure 3

Acc
epte
d P
repr
int
This article is protected by copyright. All rights reserved
Figure 4

Acc
epte
d P
repr
int
This article is protected by copyright. All rights reserved
Figure 5