A MULTI DIMENSIONAL MODEL OF PERCEIVED RISK … · A Multi-Dimensional Model. . . . ... 2004 Athens...
16
A Multi-Dimensional Model. . . . Carroll, Connaughton, Spengler and Byon Marketing Management Journal, Spring 2014 80 INTRODUCTION The sport industry has experienced impressive growth over the past decade and is estimated to be a $470 billion annual industry within the United States (Plunkett Research, 2013). One of the most visible parts of this wide-reaching industry is spectator sport. Live sport events represent a major source of revenue for sport organizations through the sale of tickets, concessions, parking and licensed merchandise. Despite the immense popularity of professional and collegiate sport in the U.S., however, several challenges exist for sport organizations. The global recession has significantly affected consumer spending on sport and recreation, (Plunkett Research, 2009), and the reality of collegiate sport in particular is that a majority of athletic departments operate at a deficit and require institutional support in order to remain financially solvent (Fulks, 2010; Sargeant & Berkowitz, 2014). Increased competition for sport consumers’ time and dollars has led to a crowded sport marketplace. According to Trail and Kim (2010), the total number of U.S. professional teams at all levels competing for sport spectators’ dollars has grown to over 600. Furthermore, economic concerns have affected the amount of discretionary income at a consumer’s disposal. These concerns highlight the importance of gaining a better understanding of the factors affecting a person’s decision to purchase a ticket and attend a sport event. Literature on why people attend sport events is mostly centered on motivation (e.g., Trail & James, 2001; Wann, 1995). Research shows that attendance is significantly predicted by fan motivation (Kim & Chalip, 2004), but Zhang et al. (2001) suggested that examining factors in addition to motivation was important in understanding attendance at sport events. Furthermore, Trail and Kim (2010) noted the importance of examining constraints or barriers to attendance due to the effect they may have on potential sport consumers’ decision-making process. Given that consumer behavior research has shown that consumers tend to weigh negative information more heavily than positive information when assessing the attributes of a potential purchase (Kanouse, 1984), understanding barriers to attendance may be just as important as understanding factors positively affecting attendance. Perceived risk has been investigated as an important construct affecting consumer The Marketing Management Journal Volume 24, Issue 1, Pages 80-95 Copyright © 2014, The Marketing Management Association All rights of reproduction in any form reserved A MULTI-DIMENSIONAL MODEL OF PERCEIVED RISK IN SPECTATOR SPORT MICHAEL S. CARROLL, Troy University DANIEL P. CONNAUGHTON, University of Florida JOHN O. SPENGLER, University of Florida KEVIN K. BYON, University of Georgia Risk perception influences consumer decision-making, and despite research on what motivates people to attend sport events, little research exists on barriers (e.g. constraints) to attendance. The purpose of this research was to identify items measuring perceived risk associated with attending collegiate football games. Perceived risk items were identified and subjected to an exploratory factor analysis (EFA) and confirmatory factor analysis (CFA). College students (N = 711) from two universities in the southeastern US participated in the study. Results of the EFA yielded a five-factor, 28-item model. The model was submitted to a CFA, and a five-factor, 21-item model emerged. Results indicated that while Performance Risk and Time Risk were the highest among the various dimensions, consumers perceived little risk with attendance at a collegiate football game. Overall, the findings support the multi-dimensional nature of perceived risk and highlight its importance as a potential constraint for sport spectators.
Transcript of A MULTI DIMENSIONAL MODEL OF PERCEIVED RISK … · A Multi-Dimensional Model. . . . ... 2004 Athens...
A Multi-Dimensional Model. . . . Carroll, Connaughton, Spengler and Byon
Marketing Management Journal, Spring 2014 80
INTRODUCTION
The sport industry has experienced impressive growth over the past decade and is estimated to be a $470 billion annual industry within the United States (Plunkett Research, 2013). One of the most visible parts of this wide-reaching industry is spectator sport. Live sport events represent a major source of revenue for sport organizations through the sale of tickets, concessions, parking and licensed merchandise. Despite the immense popularity of professional and collegiate sport in the U.S., however, several challenges exist for sport organizations. The global recession has significantly affected consumer spending on sport and recreation, (Plunkett Research, 2009), and the reality of collegiate sport in particular is that a majority of athletic departments operate at a deficit and require institutional support in order to remain financially solvent (Fulks, 2010; Sargeant & Berkowitz, 2014). Increased competition for sport consumers’ time and dollars has led to a crowded sport marketplace. According to Trail and Kim (2010), the total number of U.S. professional teams at all levels competing for sport
spectators’ dollars has grown to over 600. Furthermore, economic concerns have affected the amount of discretionary income at a consumer’s disposal. These concerns highlight the importance of gaining a better understanding of the factors affecting a person’s decision to purchase a ticket and attend a sport event. Literature on why people attend sport events is mostly centered on motivation (e.g., Trail & James, 2001; Wann, 1995). Research shows that attendance is significantly predicted by fan motivation (Kim & Chalip, 2004), but Zhang et al. (2001) suggested that examining factors in addition to motivation was important in understanding attendance at sport events. Furthermore, Trail and Kim (2010) noted the importance of examining constraints or barriers to attendance due to the effect they may have on potential sport consumers’ decision-making process. Given that consumer behavior research has shown that consumers tend to weigh negative information more heavily than positive information when assessing the attributes of a potential purchase (Kanouse, 1984), understanding barriers to attendance may be just as important as understanding factors positively affecting attendance. Perceived risk has been investigated as an important construct affecting consumer
The Marketing Management Journal Volume 24, Issue 1, Pages 80-95 Copyright © 2014, The Marketing Management Association All rights of reproduction in any form reserved
A MULTI-DIMENSIONAL MODEL OF PERCEIVED RISK IN SPECTATOR SPORT
MICHAEL S. CARROLL, Troy University DANIEL P. CONNAUGHTON, University of Florida
JOHN O. SPENGLER, University of Florida KEVIN K. BYON, University of Georgia
Risk perception influences consumer decision-making, and despite research on what motivates people to attend sport events, little research exists on barriers (e.g. constraints) to attendance. The purpose of this research was to identify items measuring perceived risk associated with attending collegiate football games. Perceived risk items were identified and subjected to an exploratory factor analysis (EFA) and confirmatory factor analysis (CFA). College students (N = 711) from two universities in the southeastern US participated in the study. Results of the EFA yielded a five-factor, 28-item model. The model was submitted to a CFA, and a five-factor, 21-item model emerged. Results indicated that while Performance Risk and Time Risk were the highest among the various dimensions, consumers perceived little risk with attendance at a collegiate football game. Overall, the findings support the multi-dimensional nature of perceived risk and highlight its importance as a potential constraint for sport spectators.
A Multi-Dimensional Model. . . . Carroll, Connaughton, Spengler and Byon
81 Marketing Management Journal, Spring 2014
decision-making in other fields such as consumer behavior (Lim, 2003) and tourism (Reisinger & Mavondo, 2005), but has received little attention within the field of sport management. Research in sport tourism has examined the perceived risks associated with attendance at such international events as the 2004 Athens Olympic Games (Taylor & Toohey, 2007; Toohey & Taylor, 2008), 2008 Beijing Olympic Games (Boo & Gu, 2010; Qi, Gibson, & Zhang, 2009), FIFA World Cup (Kim & Chalip, 2004; Toohey, Taylor, & Lee, 2003), and the 2003 Rugby World Cup (Taylor & Toohey, 2006). Given the scarcity of research examining constraints as barriers to attendance within sport management, a better understanding of perceived risk in the sport attendance context would be beneficial to sport organizations. The purpose of this study was to identify and validate items measuring perceived risk as affecting spectator decision making regarding attendance at collegiate football games. Results of this study could be used by marketers to identify and address areas of risk for potential spectators that may negatively influence attendance intentions.
LITERATURE REVIEW Consumer behavior focuses on why and how consumers choose to spend their money on products and services. The amount of risk a consumer perceives when purchasing a product or service can affect their purchasing behavior (Bettman, 1973). Although perceived risk has garnered attention in other fields of study, it has not been fully investigated as a constraint within the context of sport spectator attendance. Furthermore, the limited number of empirical studies that have examined risk in the context of spectators have done so from a sport tourism viewpoint and either taken a simple measure of risk as one potential constraint to attendance (Kim & Chalip, 2004) or focused solely on risk associated with terrorism at mega-events (e.g., Taylor & Toohey, 2006; 2007). Within the spectator sport industry, the primary product sold to consumers is the sport event (i.e., competition) itself, along with a variety of services (Shank, 2005). The unique characteristics of a sport event (e.g., intangibility, heterogeneity, unpredictability, perishability) are similar to those of services.
Compared to other consumer-based products, services have been shown to entail higher levels of perceived risk (McDougall & Snetsinger, 1990; Mitchell & Greatorex, 1993; Murray & Schlacter, 1990). A better understanding of perceived risk as a constraint to spectator sport consumption would enable sport marketers to better allocate their resources toward reducing perceived risk and the potential negative influence it may have on future attendance.
PERCEIVED RISK Although studied extensively for the past 50 years, the concept of risk has been difficult to define and/or operationalize (Boo & Gu, 2010; Roehl & Fesenmaier, 1992; Slovic & Weber, 2002). Reisinger and Mavondo (2005) define risk as “exposure to the chance of injury or loss, a hazard or dangerous chance or the potential to lose something of value” (p. 212). Roehl and Fesenmaier (1992) state that “a choice involves risk when the consequences associated with the decision are uncertain and some outcomes are more desirable than others” (p. 17). In the consumer behavior literature, no widely utilized definition of perceived risk exists and definitions often vary depending on the context of the study. According to Haddock (1993), perceived risk is formed within a specific context and from an individual standpoint. As noted by Boo and Gu (2010), the characteristics of perceived risk differ “across individuals, across hazards, and across settings/situations” (p.139). Due to the context-specific nature of perceived risk, we have adapted Reisinger and Mavondo’s (2005) definition to fit the context of spectator sport. Thus, we define perceived risk as a person’s perceptions of the uncertainty and negative consequences derived from attending a sporting event. Many studies have investigated motivations behind sport event attendance; however, few studies have examined potential constraints and/or perceptions of constraints to attendance at sport events. Most prior research has focused on sport mega-events and perceptions regarding risk associated with terrorism. For example, Toohey et al. (2003) investigated perceptions of safety and responses to security measures of 2002 FIFA World Cup spectators. Specifically, subjects were asked how the September 11, 2001 terrorist attacks on the United States
A Multi-Dimensional Model. . . . Carroll, Connaughton, Spengler and Byon
Marketing Management Journal, Spring 2014 82
influenced their motivations to attend the event, how safe they felt in South Korea during the World Cup, and how the various risk management and security measures undertaken by the event organizers affected their level of enjoyment. Results suggested that almost 85% of respondents were not concerned with security issues during their attendance at the World Cup, and only 10% had considered not attending the event due to security-related concerns. Only 1% of respondents indicated an extremely high level of concern regarding security issues. Additionally, only 6% of respondents reported that the security measures employed by event organizers detracted from their level of enjoyment. Additionally, Taylor and Toohey (2007) investigated the effect of perceptions of terrorism at the 2004 Athens Olympics on attendees’ enjoyment of the event. Similar to the findings of Toohey et al. (2003), respondents reported that safety was not a major concern to them in Athens during the Olympics and did not view the threat of terrorism as a deterrent to attending the Olympic Games. Kim and Chalip (2004) investigated the effect of fan motives, travel motives, event interest, travel constraints, and attendance intentions on travel to the FIFA World Cup among soccer fans. Both desire to attend and ability to attend were measured. Three constraints consisting of three items apiece were measured and included risk constraints, financial constraints, and interpersonal constraints. The risk constraint items measured the extent to which respondents would be worried about their health and safety when traveling to the FIFA World Cup. Generally, respondents were not concerned about attending the World Cup in South Korea. Respondents who reported a higher perception of risk also reported less desire, but a higher ability, to attend the event (Kim & Chalip, 2004). In their studies, Toohey and Taylor (2007) note that risk perception is typically mild when attending the Olympic Games but much higher prior to attendance or by those not attending. Furthermore, the authors noted that attendees’ primary reason for attending the 2004 Olympic Games was to have a once-in-a-lifetime experience. Considering the small number of studies undertaken in this research area and the noted limitations (i.e., focus on
mega-events), additional research is needed to clarify the concept of perceived risk within the context of sport spectatorship. Dimensions of Perceived Risk Perceived risk has been measured in the consumer behavior, tourism, and leisure/recreation fields of study and has most often been conceptualized as a multi-dimensional construct. Five perceived risk dimensions have been consistently identified within the consumer behavior literature: (a) performance, (b) financial, (c) social, (d) psychological, and (e) physical (Jacoby & Kaplan, 1972; Kaplan, Syzbillo, & Jacoby, 1974). Roselius (1971) introduced a sixth dimension, time risk. Based on previous research, the proposed conceptual model hypothesizes perceived risk as comprised of six dimensions: (a) performance, (b) financial, (c) social, (d) psychological, (e) physical; and (f) time. A brief description of each dimension follows. Performance risk. The outcomes of sport events are by nature uncontrollable and unpredictable. Viewing attendance at a sport event as a service purchase, and taking into consideration the heterogeneity of services, the performance dimension of perceived risk becomes particularly salient. The spectator pays a set amount to attend a game, but the benefits they receive vary depending upon the performance of the athletes involved. The game may constitute a close victory for the spectator’s favored team, leading to a memorable and enjoyable experience and a feeling that the purchase delivered expected benefits (e.g., high level of competition, an exciting game atmosphere, etc.). Alternatively, the game may be a blowout loss for the spectator’s favored team, with fans leaving in droves during halftime, in which the spectator may feel that he or she did not receive a performance worth what was spent in order to attend the game. It is this uncertainty regarding the performance at a sport event that contributes to perceived risk. Financial risk. Within the consumer behavior literature, the desired outcome of a product purchase decision is need satisfaction, in which positive outcomes are hoped for despite uncertainty regarding the actual purchase itself (Stone & Grønhaug, 1993). Research
A Multi-Dimensional Model. . . . Carroll, Connaughton, Spengler and Byon
83 Marketing Management Journal, Spring 2014
investigating the financial risk dimension within this field focuses on perceptions by a consumer that the purchase of a product will not give the desired benefits or fulfill needs satisfactorily, leading to a waste of money or a need to replace the product (Mitchell & Greatorex, 1993). The purchase of a game ticket for a sport event necessarily involves financial risk, insofar as the spectator may feel that he or she may not get their money’s worth from attending the event. The sport product (i.e., event) is an experience service that is simultaneously produced and consumed. As such, the consumer cannot make judgments regarding the quality and/or value of the service until consumption occurs. After a spectator has purchased a ticket and experienced the event they are left with nothing tangible. All of these factors serve to heighten the nature of financial risk in regards to sport spectating. Social risk. Within consumer behavior research, this dimension has been most often conceptualized as potential feelings of embarrassment or a loss of self-esteem as a result of a purchase of a product or failure of a product after purchase (Jacoby & Kaplan, 1972). According to Murray and Schlacter (1990), most service environments entail a certain degree of human involvement as integral to the product itself. As such, potential contact between the service provider and the consumer, as well as contact between the consumer and others within the environment, increases the chance of sensitive or potentially embarrassing situations with others, thus heightening the social risk involved with a purchase. In their study, Murray and Schlacter (1990) found that services were associated with greater levels of social risk than products. Several authors have noted the importance of social identification or affiliation in the decision to attend a sport event (e.g., Trail & James, 2001; Wann, 1995). In the context of a sport event, spectators typically find themselves in an environment with thousands of other people, oftentimes in extremely close proximity to others who may be strangers. Psychological risk. The psychological dimension of risk is perhaps the least understood of the six common dimensions utilized in consumer behavior research. By definition, the purchase of a product or service
entails a certain amount of uncertainty and the potential for negative consequences (Stone & Grønhaug, 1993). When a person assesses a purchase containing risk, either consciously or subconsciously, it creates internal tension leading to psychological discomfort (1993). The psychological dimension of risk has been shown to be important in explaining the variance in overall perceived risk in consumer behavior, but it has been conceptualized in different ways. Murray and Schlacter (1990) found that services are associated with greater perceived psychological risk as compared to consumer products. The authors speculated that this may be because services frequently entail a greater level of human interaction, whereas the purchase of a product can be completed without such interaction. Physical risk. The physical risk dimension includes multitude of concerns spectators may face when attending a collegiate football game. Spectators are often subjected to extremely crowded situations, which can result in discomfort and in some situations and physical injury, especially when tensions rise due to a heated victory or loss. The link between sport attendance and violence has been studied extensively in the context of football “hooliganism” in Europe (Spaaij, 2007). Fans may become more likely to commit an aggressive or violent act following a loss than a victory, as fan aggression following a loss by a favorite team can be viewed as an attempt to recoup the self-esteem loss experienced by the fan due to their team’s defeat. As such, heated rivalry games can heighten this already present danger. Too many or too frequent interactions with unruly fans can decrease attendance at sport events (Hunt, Bristol, & Bashaw, 1999). Also included within the physical risk dimension is risk of injury due to a terrorist attack, which has been examined briefly within the context of sport event attendance (Taylor & Toohey, 2007; Toohey et al., 2003). The current study conceptualizes terrorism-related risk as one component within physical risk. Finally, the physical risk dimension also includes risk of injury due to environmental issues (e.g., heat). Time risk. With an average length exceeding three hours in length, spectators attending collegiate football games give up a significant
A Multi-Dimensional Model. . . . Carroll, Connaughton, Spengler and Byon
Marketing Management Journal, Spring 2014 84
portion of time in order to attend. This is in addition to the time spent traveling to and from the game itself. In one of the few studies that examined perceived risk involving sport centers, Mitchell and Greatorex (1993) found that when asked to rate the time loss associated with six different services, sport centers were rated as the second highest. Furthermore, of all of the dimensions of perceived risk related to services at sport centers, the time loss dimension was rated the highest. In their study investigating intentions to attend a sport event, Cunningham and Kwon (2003) distributed questionnaires to college students investigating factors that contributed to their control over decisions to attend a collegiate hockey game. Respondents reported that a lack of time and/or money were the largest constraints to attendance.
METHOD Participants The aim of the current study was to identify and validate dimensions and items measuring spectators’ perceived risk associated with attendance at collegiate football games. This study used a convenience sampling method, utilizing a student sample from two universities located in the southeastern region of the United States. Participation in this survey was voluntary, and a participant had to be 18-years-old or older to participate. A total of 761 questionnaires were collected resulting in 711 useable questionnaires used for data analyses. Of the sample, 38.0% were male and 61.6% female. Roughly half of the respondents were between 18 and 20 years-old, and nearly 92% were between 18 and 23-years-old. A majority of respondents were Caucasian (61.3%). The other respondents were Hispanic (12.7%), African American (11.7%), Asian/Pacific Islander (9.3%), Mixed Race (3.1%), and Other (1.5%). Measures A preliminary questionnaire was formed through a comprehensive literature review of perceived risk research in the fields of consumer behavior, tourism, and marketing, interviews with industry practitioners, and a focus group consisting of a sample of the
intended survey population. The perceived risk factors and items were identified primarily based on existing scales and research findings discussed below. In particular, all adoptions and modifications took into consideration the unique environmental features of collegiate football games. A modified version of Laroche, McDougall, Bergeron, and Yang’s (2004) Perceived Risk Scale was used. The scale measured five dimensions of perceived risk, using three items for each dimension except for the social risk dimension which was comprised of two items. The scale consisted of the following five dimensions and demonstrated good psychometric properties: financial risk (α = .90), time risk (α = .91), performance risk (α = .88), social risk (α = .92), and psychological risk (α = .95). However, two limitations regarding Laroche et al.’s scale were identified: (a) the scale did not include the physical risk dimension, and (b) some dimensions were measured with only two items. To address the limitations, the current study used a total of 37 items assessing six perceived risk dimensions, including financial risk (6 items), time risk (6 items), performance risk (6 items), social risk (6 items), psychological risk (6 items), and physical risk (7 items). The response format for perceived risk items was a 7-point Likert-type scale (1 = strongly disagree and 7 = strongly agree). To avoid response bias from order effect, the items were randomly placed in the questionnaire (Hair, Black, Babin, Anderson, & Tatham, 2005). Procedures Following initial identification of the items, the questionnaire was submitted to a panel of experts for content validity purposes. The panel of experts included four university professors and two practitioners. Of the university professors, two specialize in sport marketing and measurement, and the other two specialize in sport law and risk management. Of the practitioners, one is an Operations and Facility Coordinator and the other is a Director of Marketing within a college athletic department. Each panel member was asked to examine the relevance, representativeness, clarity, test format, item content of the questionnaire, and its associated sections. Based on feedback from
A Multi-Dimensional Model. . . . Carroll, Connaughton, Spengler and Byon
85 Marketing Management Journal, Spring 2014
the panel, the preliminary questionnaire was slightly modified mainly focusing on word clarity. After the questionnaire was modified and Institutional Review Board (IRB) approval was received, a pilot study was conducted on a student sample (N = 57). The purpose of the pilot study was to further examine the content validity of the items from the perspective of the targeted population and to examine the reliability of the items (Hair et al., 2005). Following the pilot study, a survey packet was developed consisting of the revised items and an Informed Consent form explaining the purpose of the study and requesting cooperation from the participant. Results of the pilot study indicated high internal consistency among the factors (α = .825 - .992) and thus, all items were retained for the main study. In terms of sample size required to complete the Exploratory Factor Analyses (EFA) and Confirmatory Factor Analyses (CFA), the current study adopted the recommendation of Hair et al. (2005), who suggested 10 respondents per each observed variable. The initial items consisted of 37 observed variables and thus, a minimum number of 370 questionnaires were required. This threshold was exceeded as a total of 711 usable questionnaires were used for subsequent data analyses. Data Analyses After data collection, the sample was randomly split into two halves. The first half of the data (n = 355) was used to conduct an EFA with the second set used to conduct a CFA. To examine if the data were appropriate for a factor analysis, the Kaiser-Meyer-Olkin (KMO) measure of sampling adequacy value and Bartlett’s Test of Sphericity (BTS) value were calculated by SPSS 15.0 (Kaiser, 1974). Once the data were found to be usable for factor analysis, a principal component extraction (PCA) method with varimax rotation of identified items was conducted in order to identify factors. Per Hair et al. (2005), the following criteria were used to retain factors and items: (a) a factor had to have an eigenvalue greater than or equal to 1, (b) an item had to have a factor loading equal to or greater than .50, (c) a factor had to consist of at least three items, (d) no double-loading was
permitted, (e) the resulting curve in the scree plot test was used to determine the factors (Cattell, 1966), and (f) the identified factors and items had to be interpretable. Following the EFA, reliability was examined by using SPSS 15.0 to calculate Cronbach’s alpha coefficients for identified factors (Cronbach, 1951). The second half of the data was used to conduct a confirmatory factor analysis (CFA) of the data. AMOS version 7.0 (Arbuckle, 2006) was used to conduct the CFA on the second data set, using the factor structure determined from the EFA. Following the suggestions of Hair et al. (2005), several goodness of fit indexes were utilized, including the chi-square statistic (χ2), normed chi-square (χ2/df), root mean square error of approximation (RMSEA), standardized root mean residual (SRMR), comparative fit index (CFI), and expected cross validation index (ECVI) (Bentler, 1990; Bollen, 1989; Hu and Bentler, 1999; Steiger, 1990). In order to assess convergent validity, the researchers of the current study evaluated indicator loadings, statistically significant z-values, and average variance extracted (AVE) values. Generally, an item loading value equal to or greater than .707 (i.e., R2 value ³ .50) is considered an acceptable loading for good convergent validity (Anderson and Gerbing, 1988). According to Bagozzi and Yi (1988), a factor with an AVE value greater than .50 indicates good convergent validity. Discriminant validity was examined through (a) analysis of the interfactor correlations, and (b) comparison of the AVE values with squared correlation of any of two latent constructs (Fornell and Larcker, 1981). According to Kline (2005), interfactor correlations should be less than .85 to establish discriminant validity. A more conservative indicator of discriminant validity is if the squared correlation between two constructs is lower than the AVE for each construct (Fornell and Larcker, 1981). Reliability for the perceived risk items was assessed by three tests: Cronbach’s alpha (α) values, Construct Reliability (CR), and AVE scores. For determining internal consistency (α) and CR, the .70 cut-off value recommended by Hair et al. (2005) was used. The suggested .50 benchmark AVE value as suggested by Bagozzi and Yi (1988) was chosen for this study.
A Multi-Dimensional Model. . . . Carroll, Connaughton, Spengler and Byon
Marketing Management Journal, Spring 2014 86
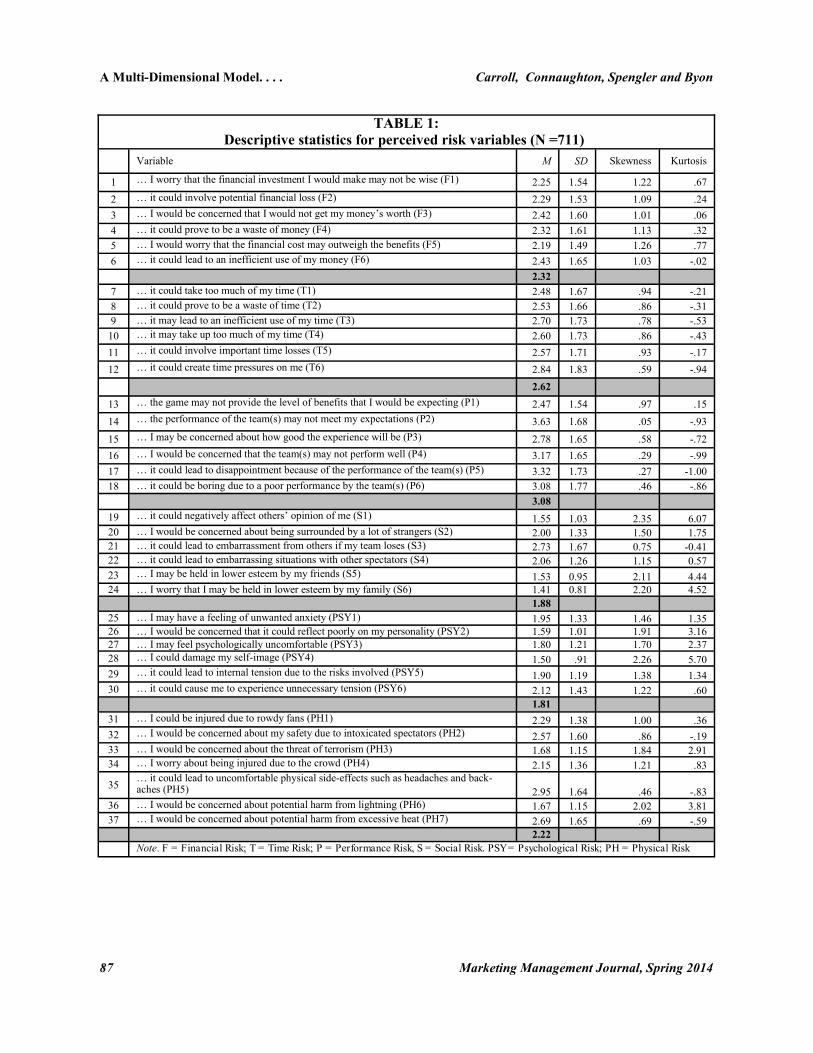
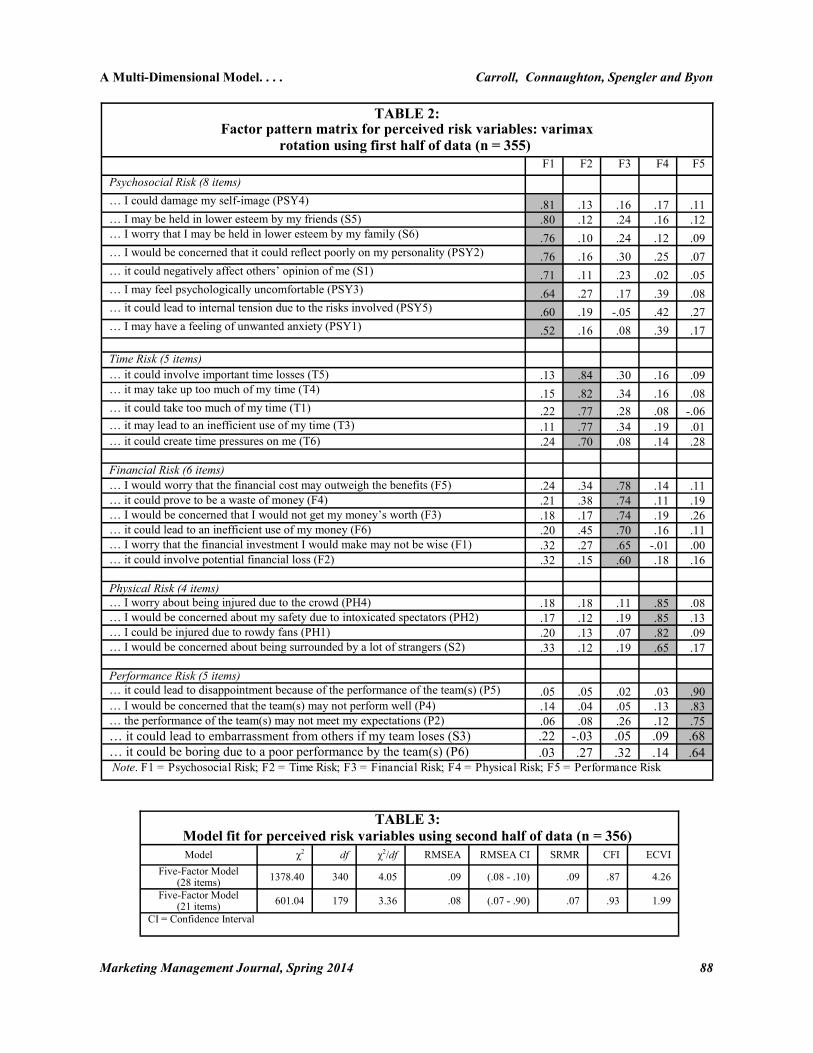
RESULTS Descriptive Statistics Descriptive statistics including mean and standard deviation for the perceived risk variables are presented in Table 1. Of the 37 items, no items had a mean score above 4.00 (i.e., midpoint on the 7-point Likert scale), indicating that, overall, respondents perceived low risk with attending a collegiate football game. The average mean score across all 37 perceived risk items was 2.33. Of the perceived risk dimensions, the highest average mean score was Performance Risk (M = 3.08; SD = 1.67), followed by Time Risk (M = 2.62; SD = 1.72). The lowest average mean score was Psychological Risk (M = 1.81; SD = 1.18) followed by Social Risk (M = 1.88; SD = 1.18). All skewness values were well within the acceptable range while kurtosis values for five variables (S1, S5, S6, PSY2, and PSY4) were slightly above the threshold. After careful consideration of other criteria, including skewness value and item relevance to the respective dimensions, the decision was made to retain the five items (Table 2). Exploratory Factor Analysis Utilizing the first data set (n = 355), an EFA of the perceived risk variables was conducted in order to identify the simple factor structure and reduce data (Stevens, 1996). The KMO measure of sampling adequacy value (Kaiser, 1974) was .94, verifying sampling adequacy and BTS was 9432.37 (p < .001). Therefore, a factor analysis was deemed appropriate. As a result of PCA, followed by varimax rotation, five factors with 28 items emerged, explaining 70.1% of the total variance. The scree plot test also supported the five-factor model. The results of the rotated pattern matrix utilizing varimax rotation are reported in Table 2. Nine items were deleted, including one item (T2) that was discarded due to double loading, seven items (i.e., S4, PSY6, P3, PH5, PH6, PH7, PH3) that were removed for failing to meet the pre-determined minimum factor loading criteria of .50, and one item (P1) that was deleted due to its loading onto a factor absent theoretical justification. The five factors were labeled Psychosocial Risk (8 items), Time Risk (5 items), Financial Risk (6 items), Physical Risk
(4 items), and Performance Risk (5 items). The resolved factor structure was overall consistent with the conceptual model for the perceived risk construct in this study, although two dimensions, Psychological Risk and Social Risk, loaded onto the same factor and were combined. This will be addressed within the discussion section. All five factors showed high reliability scores: Psychosocial Risk (α = .91), Time Risk (α = .91), Financial Risk (α = .91), Physical Risk (α = .83), and Performance Risk (α = .86) (See Table 2). The 28-item, 5-factor model was retained for subsequent CFA. Confirmatory Factor Analysis The second half of the data set (n = 356) for the perceived risk variables, containing 28 items under five factors, was submitted to a CFA using ML estimation (Hair et al., 2005). Goodness of fit indexes revealed that the five-factor, 28-item measurement model did not fit the data well (Table 3). The chi-square statistic was significant (χ2 = 1378.40, p < .001), which is known to be sensitive to sample size. The normed chi-square value ( χ2/df = 4.05) was above the recommended 3.0 value specified by Bollen (1989), but Kline (2005) notes that values as high as 5.0 have been recommended as a reasonable fit of the data, and that the normed chi-square does not completely correct for the influence of a large sample size. The RMSEA value indicated that the five-factor showed a mediocre fit (RMSEA = .09, 90% CI [.09, .10]; Hu and Bentler, 1999). The SRMR value (.09) was within the range of acceptable fit (≤ .10; Kline). The CFI value (.87) was below the cut-off (> .90) recommended by Hu and Bentler (1999). Although no specific criteria exist for the ECVI value, smaller values are preferable. The ECVI for the five-factor model was 4.26. In totality, the model fit tests suggested the need for a re-specification of the model. Prior to a model respecification, factor loadings failing to meet the pre-determined criterion of .707 were also removed, resulting in a five-factor model with 21 items: Psychosocial Risk (5 items), Time Risk (5 items), Financial Risk (5 items), Physical Risk (3 items), and Performance Risk (3 items). The re-specified five-factor, 21-item model was submitted to a CFA. Overall goodness of fit indicated that the re-specified model fit the data reasonably well and was much better than the
A Multi-Dimensional Model. . . . Carroll, Connaughton, Spengler and Byon
87 Marketing Management Journal, Spring 2014
TABLE 1: Descriptive statistics for perceived risk variables (N =711)
Variable M SD Skewness Kurtosis
1 … I worry that the financial investment I would make may not be wise (F1) 2.25 1.54 1.22 .67
2 … it could involve potential financial loss (F2) 2.29 1.53 1.09 .24
3 … I would be concerned that I would not get my money’s worth (F3) 2.42 1.60 1.01 .06
4 … it could prove to be a waste of money (F4) 2.32 1.61 1.13 .32
5 … I would worry that the financial cost may outweigh the benefits (F5) 2.19 1.49 1.26 .77
6 … it could lead to an inefficient use of my money (F6) 2.43 1.65 1.03 -.02
2.32
7 … it could take too much of my time (T1) 2.48 1.67 .94 -.21
8 … it could prove to be a waste of time (T2) 2.53 1.66 .86 -.31
9 … it may lead to an inefficient use of my time (T3) 2.70 1.73 .78 -.53
10 … it may take up too much of my time (T4) 2.60 1.73 .86 -.43
11 … it could involve important time losses (T5) 2.57 1.71 .93 -.17
12 … it could create time pressures on me (T6) 2.84 1.83 .59 -.94
2.62
13 … the game may not provide the level of benefits that I would be expecting (P1) 2.47 1.54 .97 .15
14 … the performance of the team(s) may not meet my expectations (P2) 3.63 1.68 .05 -.93
15 … I may be concerned about how good the experience will be (P3) 2.78 1.65 .58 -.72
16 … I would be concerned that the team(s) may not perform well (P4) 3.17 1.65 .29 -.99
17 … it could lead to disappointment because of the performance of the team(s) (P5) 3.32 1.73 .27 -1.00
18 … it could be boring due to a poor performance by the team(s) (P6) 3.08 1.77 .46 -.86
3.08
19 … it could negatively affect others’ opinion of me (S1) 1.55 1.03 2.35 6.07
20 … I would be concerned about being surrounded by a lot of strangers (S2) 2.00 1.33 1.50 1.75
21 … it could lead to embarrassment from others if my team loses (S3) 2.73 1.67 0.75 -0.41
22 … it could lead to embarrassing situations with other spectators (S4) 2.06 1.26 1.15 0.57
23 … I may be held in lower esteem by my friends (S5) 1.53 0.95 2.11 4.44
24 … I worry that I may be held in lower esteem by my family (S6) 1.41 0.81 2.20 4.52
1.88
25 … I may have a feeling of unwanted anxiety (PSY1) 1.95 1.33 1.46 1.35
26 … I would be concerned that it could reflect poorly on my personality (PSY2) 1.59 1.01 1.91 3.16
27 … I may feel psychologically uncomfortable (PSY3) 1.80 1.21 1.70 2.37
28 … I could damage my self-image (PSY4) 1.50 .91 2.26 5.70
29 … it could lead to internal tension due to the risks involved (PSY5) 1.90 1.19 1.38 1.34
30 … it could cause me to experience unnecessary tension (PSY6) 2.12 1.43 1.22 .60
1.81
31 … I could be injured due to rowdy fans (PH1) 2.29 1.38 1.00 .36
32 … I would be concerned about my safety due to intoxicated spectators (PH2) 2.57 1.60 .86 -.19
33 … I would be concerned about the threat of terrorism (PH3) 1.68 1.15 1.84 2.91
34 … I worry about being injured due to the crowd (PH4) 2.15 1.36 1.21 .83
35 … it could lead to uncomfortable physical side-effects such as headaches and back-aches (PH5) 2.95 1.64 .46 -.83
36 … I would be concerned about potential harm from lightning (PH6) 1.67 1.15 2.02 3.81
37 … I would be concerned about potential harm from excessive heat (PH7) 2.69 1.65 .69 -.59
2.22
Note. F = Financial Risk; T = Time Risk; P = Performance Risk, S = Social Risk. PSY = Psychological Risk; PH = Physical Risk
A Multi-Dimensional Model. . . . Carroll, Connaughton, Spengler and Byon
Marketing Management Journal, Spring 2014 88
TABLE 2: Factor pattern matrix for perceived risk variables: varimax
rotation using first half of data (n = 355) F1 F2 F3 F4 F5
Psychosocial Risk (8 items)
… I could damage my self-image (PSY4) .81 .13 .16 .17 .11
… I may be held in lower esteem by my friends (S5) .80 .12 .24 .16 .12
… I worry that I may be held in lower esteem by my family (S6) .76 .10 .24 .12 .09
… I would be concerned that it could reflect poorly on my personality (PSY2) .76 .16 .30 .25 .07
… it could negatively affect others’ opinion of me (S1) .71 .11 .23 .02 .05
… I may feel psychologically uncomfortable (PSY3) .64 .27 .17 .39 .08
… it could lead to internal tension due to the risks involved (PSY5) .60 .19 -.05 .42 .27
… I may have a feeling of unwanted anxiety (PSY1) .52 .16 .08 .39 .17
Time Risk (5 items)
… it could involve important time losses (T5) .13 .84 .30 .16 .09
… it may take up too much of my time (T4) .15 .82 .34 .16 .08
… it could take too much of my time (T1) .22 .77 .28 .08 -.06
… it may lead to an inefficient use of my time (T3) .11 .77 .34 .19 .01
… it could create time pressures on me (T6) .24 .70 .08 .14 .28
Financial Risk (6 items)
… I would worry that the financial cost may outweigh the benefits (F5) .24 .34 .78 .14 .11
… it could prove to be a waste of money (F4) .21 .38 .74 .11 .19
… I would be concerned that I would not get my money’s worth (F3) .18 .17 .74 .19 .26
… it could lead to an inefficient use of my money (F6) .20 .45 .70 .16 .11
… I worry that the financial investment I would make may not be wise (F1) .32 .27 .65 -.01 .00
… it could involve potential financial loss (F2) .32 .15 .60 .18 .16
Physical Risk (4 items)
… I worry about being injured due to the crowd (PH4) .18 .18 .11 .85 .08
… I would be concerned about my safety due to intoxicated spectators (PH2) .17 .12 .19 .85 .13
… I could be injured due to rowdy fans (PH1) .20 .13 .07 .82 .09
… I would be concerned about being surrounded by a lot of strangers (S2) .33 .12 .19 .65 .17
Performance Risk (5 items)
… it could lead to disappointment because of the performance of the team(s) (P5) .05 .05 .02 .03 .90
… I would be concerned that the team(s) may not perform well (P4) .14 .04 .05 .13 .83
… the performance of the team(s) may not meet my expectations (P2) .06 .08 .26 .12 .75
… it could lead to embarrassment from others if my team loses (S3) .22 -.03 .05 .09 .68
… it could be boring due to a poor performance by the team(s) (P6) .03 .27 .32 .14 .64 Note. F1 = Psychosocial Risk; F2 = Time Risk; F3 = Financial Risk; F4 = Physical Risk; F5 = Performance Risk
TABLE 3: Model fit for perceived risk variables using second half of data (n = 356) Model χ2 df χ2/df RMSEA RMSEA CI SRMR CFI ECVI
Five-Factor Model (28 items)
1378.40 340 4.05 .09 (.08 - .10) .09 .87 4.26
Five-Factor Model (21 items)
601.04 179 3.36 .08 (.07 - .90) .07 .93 1.99
CI = Confidence Interval
A Multi-Dimensional Model. . . . Carroll, Connaughton, Spengler and Byon
89 Marketing Management Journal, Spring 2014
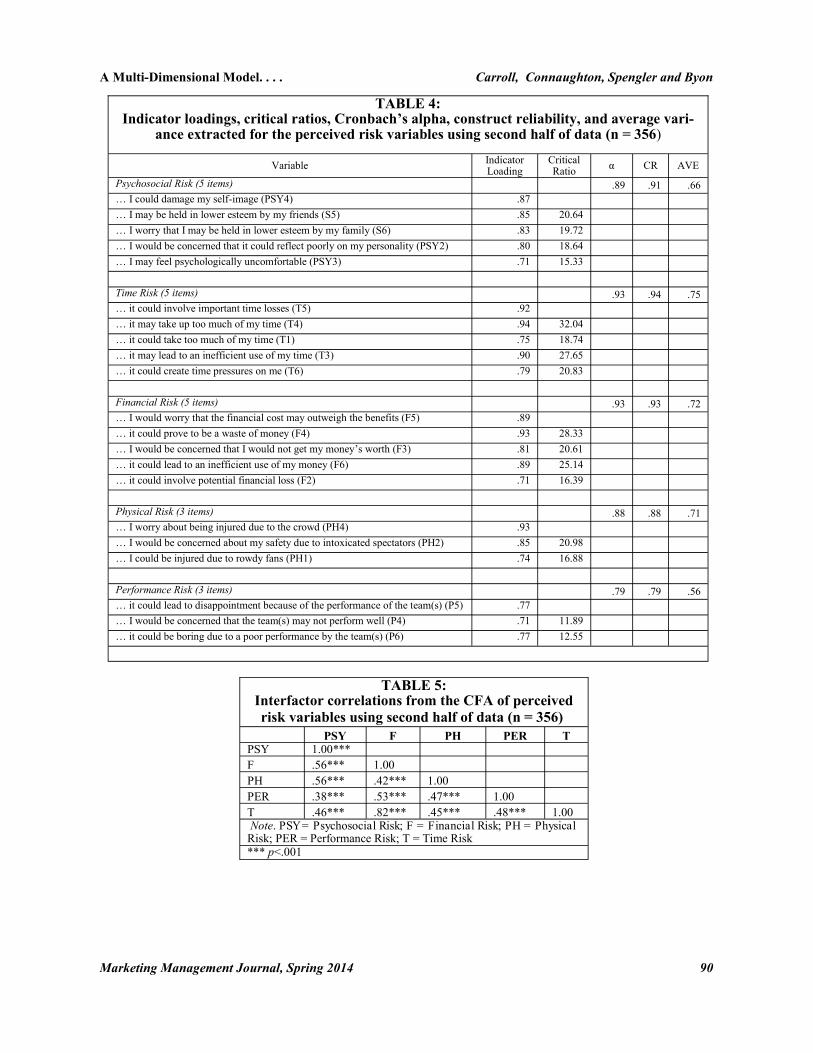
original five-factor, 28-item model (χ2 = 601.04, p < .001; χ2/df = 3.36; RMSEA = .08, 90% CI [.07, .09]; SRMR = .07; CFI = .93; and ECVI = 1.99). The Cronbach’s alpha values for all of the perceived risk factors were above the recommended .70 threshold, ranging from .79 to .93. The CR values for all of the perceived risk factors were also above the recommended .70 threshold (Fornell & Larcker, 1981), ranging from .79 to .94. Finally, the AVE values for the perceived risk factors were all above the recommended .50 threshold (Bagozzi & Yi, 1988), ranging from .56 to .75 (see Table 4). These values indicate that the items were internally consistent within the dimensions. Convergent validity of the perceived risk items was assessed through examining the indicator loadings and critical ratio values (Table 4). All indicator loadings were above the recommended .707 threshold (Hair et al., 2005), except for one item on Psychosocial Risk (PSY3 - I may feel psychologically uncomfortable). A decision was made to retain the item due to its theoretical relevance to the factor as well as the fact that it was only slightly lower (.705) than the recommended cut-off threshold of .707. Critical ratio values ranged from 11.89 (P4 - I would be concerned that the team(s) may not perform well) to 32.04 (T4 – it may take up too much of my time), indicating that all values were statistically significant (p < .001). Based upon these tests, the five-factor perceived risk model showed good convergent validity. Discriminant validity of the perceived risk factors was assessed through examination of interfactor correlations and AVE values. Interfactor correlations ranged from .42 to .82, all below the recommended .85 threshold (Kline, 2005) for establishing discriminant validity (Table 5). Additionally, all squared correlations were below the corresponding AVE values, indicating discriminant validity (Fornell & Larcker, 1981).
DISCUSSION Growing competition among sport providers and decreased discretionary income for sport consumers highlight the importance of investigating and understanding the factors that
may influence spectator decision-making regarding future attendance. Previous studies investigating spectator attendance and sport consumption have focused primarily on motivation and market demand variables (Trail & James, 2001; Wann, 1995). Research into perceived risk as a constraint represents a tool for not only understanding sport consumers’ decision-making but also a means for targeting areas in need of improvement for sport marketers and organizations. Due to its use within a number of scholarly fields, measurement of the perceived risk construct has been inconsistent and has varied greatly. The identification and validation of these items of perceived risk holds great potential for sport managers interested in identifying areas of perceived risk held by potential consumers that may be negatively influencing their decision to attend (or not attend) an event. In investigating perceptions of risk and travel intentions, Qi, Gibson, and Zhang (2009) recommend integrating risk perception dimensions into classic travel decision-making models in order to better understand the role of constraints and facilitators on destination decisions. We would argue that these items could be used by sport managers to effectively do the same thing, namely by identifying areas that serve as constraints to attendance. Kim and Chalip (2004) demonstrated the value of this endeavor but did not conceptualize perceived risk as multi-dimensional in nature. Being able to effectively evaluate these constraints enables sport managers to “more effectively serve existing fans, as well as attract new ones” (Kim & Trail, 2010, p.207). Knowledge regarding perceived risk could be particularly significant for sport teams experiencing low attendance by allowing sport managers to focus resources on areas in need of improvement. Overall, respondents did not perceive much risk in attending a collegiate football game, with an average mean of 2.33 across the perceived risk dimensions on a 7-point Likert scale. This is consistent with previous research that examined perceptions regarding safety and security in regards to terrorism at attendance at mega sport events (Taylor & Toohey, 2007; Toohey et al., 2003). Of the perceived risk dimensions, respondents reported the highest amount of risk within the Performance Risk dimension. Within
A Multi-Dimensional Model. . . . Carroll, Connaughton, Spengler and Byon
Marketing Management Journal, Spring 2014 90
TABLE 4: Indicator loadings, critical ratios, Cronbach’s alpha, construct reliability, and average vari-
ance extracted for the perceived risk variables using second half of data (n = 356)
Variable Indicator Loading
Critical Ratio α CR AVE
Psychosocial Risk (5 items) .89 .91 .66 … I could damage my self-image (PSY4) .87 … I may be held in lower esteem by my friends (S5) .85 20.64 … I worry that I may be held in lower esteem by my family (S6) .83 19.72 … I would be concerned that it could reflect poorly on my personality (PSY2) .80 18.64 … I may feel psychologically uncomfortable (PSY3) .71 15.33 Time Risk (5 items) .93 .94 .75 … it could involve important time losses (T5) .92 … it may take up too much of my time (T4) .94 32.04 … it could take too much of my time (T1) .75 18.74 … it may lead to an inefficient use of my time (T3) .90 27.65 … it could create time pressures on me (T6) .79 20.83 Financial Risk (5 items) .93 .93 .72 … I would worry that the financial cost may outweigh the benefits (F5) .89 … it could prove to be a waste of money (F4) .93 28.33 … I would be concerned that I would not get my money’s worth (F3) .81 20.61 … it could lead to an inefficient use of my money (F6) .89 25.14 … it could involve potential financial loss (F2) .71 16.39 Physical Risk (3 items) .88 .88 .71 … I worry about being injured due to the crowd (PH4) .93 … I would be concerned about my safety due to intoxicated spectators (PH2) .85 20.98 … I could be injured due to rowdy fans (PH1) .74 16.88 Performance Risk (3 items) .79 .79 .56 … it could lead to disappointment because of the performance of the team(s) (P5) .77 … I would be concerned that the team(s) may not perform well (P4) .71 11.89 … it could be boring due to a poor performance by the team(s) (P6) .77 12.55
TABLE 5: Interfactor correlations from the CFA of perceived
risk variables using second half of data (n = 356) PSY F PH PER T PSY 1.00***
F .56*** 1.00
PH .56*** .42*** 1.00
PER .38*** .53*** .47*** 1.00
T .46*** .82*** .45*** .48*** 1.00 Note. PSY = Psychosocial Risk; F = Financial Risk; PH = Physical Risk; PER = Performance Risk; T = Time Risk *** p<.001
A Multi-Dimensional Model. . . . Carroll, Connaughton, Spengler and Byon
91 Marketing Management Journal, Spring 2014
the Performance Risk dimension (M = 3.08; SD = 1.57), one item, “performance of the team(s) may not meet my expectations,” was above the midpoint with a mean score of 3.63. This result may imply that respondents were concerned, albeit slightly, that the game could prove to be boring or unexciting due to the performance of one or both teams. As mentioned previously, attendance at a collegiate football game requires a substantial amount of time. Even in the event of a blowout victory for the spectator’s favored team, the spectator may feel that he or she wasted time particularly if the game was not exciting. This could be especially pertinent in the case of a highly talented and successful team that often produces such lopsided victories. Alternatively, the results may be very different in the case of a team that is not very successful and struggles against most opponents. The second highest dimension of perceived risk according to the data analysis was Time Risk, consistent with previous studies in which the time loss dimension was rated the highest among perceived risk related to services at sport centers (Mitchell & Greatorex, 1993). Additionally, Cunningham and Kwon (2003) distributed questionnaires to college students asking about factors that contributed to their decisions to attend a hockey game. Respondents reported that lack of time was one of the largest constraints to attendance. Respondents did not report perceiving much Physical Risk associated with attendance at collegiate football games. This dimension included physical risks occurring from weather, large crowds, terrorism, and other spectators. As previously mentioned, the small amount of research investigating perceived risk and attendance at sport events has generally focused on the physical risk dimension, most notably physical risk arising due to the threat of terrorism (Taylor & Toohey, 2007; Toohey et al., 2003). In the current study, respondents did not report much perceived risk regarding terrorism. This may be due to two reasons. First, the events of September 11, 2001 occurred over ten years ago, and the threat of terrorism may have subsided in the minds of respondents. Second, the sport industry has enacted a number of security measures to protect spectators against the threat of
terrorism, including pat-down searches, increased security, and biometrics including facial-recognition software used in sport venues. These measures have been widely publicized and may have served to somewhat alleviate spectators fears regarding terrorism. The review of literature yielded a six-factor model of perceived risk, yet during data analysis, the derived factors for the EFA saw the Psychological Risk and Social Risk items loaded onto the same factor. Due to statistical and theoretical reasoning, the two factors were combined and named Psychosocial Risk. Despite the hypothesized distinction between the two dimensions, previous research does support the notion of a psychosocial dimension of risk, combining the Psychological and Social risk dimensions. Cheron and Ritchie (1982) reported in their study regarding perceived risk and leisure activities, the Psychological and Social dimensions of risk were highly correlated (r = .98), leading to a combination of the two dimensions into the Psychosocial Risk dimension. Likewise, Kaplan et al. (1974) found a high correlation (r = .79) between the two dimensions. These results led Mitchell and Greatorex (1993) to combine both dimensions into one factor labeled Psychosocial Risk. The Psychological dimension of risk is perhaps the least understood of the six common dimensions utilized in consumer behavior research. The Psychological Risk dimension attempts to tap into perceived risks regarding self-image and self-esteem; it is an inward-focused dimension. The Social Risk dimension, on the other hand, attempts to tap into perceived risks stemming from others’ view of the respondent; it is an outward-focused dimension. Respondents may not have fully understood the item, and/or respondent fatigue may have led respondents to simply view the items as measuring the same thing or to just put the same response as preceding questions. Theoretically, it may be that the two factors are distinct. Thus, it is suggested that future research use a priori models such as a combined model (i.e., Psychosocial Risk) alongside a separate distinct model (Psychological Risk and Social Risk) and use a CFA procedure to determine which conceptualization is preferred.
A Multi-Dimensional Model. . . . Carroll, Connaughton, Spengler and Byon
Marketing Management Journal, Spring 2014 92
MANAGERIAL IMPLICATIONS
Perceived risk is important for sport marketers to take into consideration when thinking about marketing strategies and event planning. Its impact on consumer decision-making is well-documented within the consumer behavior literature yet less so within the sport industry. The results of this study suggest that consumers, by and large, did not report much risk with sport event attendance. At the same time, Performance and Time Risk were both the highest reported of the dimensions measured. As a way to lessen the impact of those risks, sport marketers could do a number of things. Performance Risk is directly tied to the performance of the teams and is thus outside of the control of the marketer. However, this could potentially be lessened though the augmentation of things ancillary to the contest itself. For example, a less than exciting contest between two teams can nonetheless be made enjoyable by focusing efforts on creating a fun and exciting atmosphere, thus taking some of the focus off of the event itself. Promotions that focus on having a great time at the stadium/ballpark or ones that focus on the sport experience as a family event can perhaps override the worry that the event itself will be uninspiring or a blowout victory for one team over the other. As for Time Risk, marketers should monitor issues at the sport venue that impact the time spent there. For example, analyzing traffic flow, both outside the venue as well as inside, can give a marketer a good idea as to where problematic congestion occurs and how those areas may be dealt with effectively. Although Physical Risk did not rate high in this study, it may be more of a constraint with venues in certain sections of the US, especially in areas that have extremes in temperature. Marketers may wish to lessen the chance that prospective consumers will stay home rather than attend a sport event in the middle of a hot and humid day by lettings fans know of the abundance of water fountains, misting stations, etc. in the stadium or other devices used to help spectators cope with extreme heat. Likewise, marketing an event as family friendly may better persuade parents that their children will be safe from harm in a stadium surrounded by thousands of other spectators. Clearly stating an alcohol
policy and standing by it can cut down on the sort of crowd violence that can ensue with sport events and intoxication. These risks may fluctuate depending upon such variables as location, venue size, and type of event, and sport marketers are encouraged to assess their particular event and venue to identify areas in which potential spectators may experience these risks. The current study contributes to the literature by identifying and validating items measuring perceived risk in a sport spectator-specific context and providing the groundwork for perceived risk research within the sport management domain. Nonetheless, more work regarding these items measuring the specific dimensions of perceived risk is needed in future studies.
LIMITATIONS AND SUGGESTIONS FOR FUTURE STUDIES
The current study contains a number of limitations. Due to the use of a convenience sample, caution should be used with generalizing the results of the current study to other sport events or populations. To overcome this limitation, future research should replicate the current study using different contexts (e.g., professional sport events) and a non-student sample. Differences in age, socioeconomic status, and sport should be examined in future research regarding perceived risk and sport consumption. Second, team identification was not measured in the current study. It may be assumed that spectators with different levels of identification would behave differently in various consumption settings (e.g., Wann & Branscombe, 1993). This concept has been shown to play a moderating role (e.g., Theodorakis, Koustelios, Robinson, & Barlas, 2009). It would be more meaningful to measure perceived risk based on the level of team identification, thus allowing sport managers to better understand different spectator groups. Furthermore, MacCallum, Roznowski, and Necowitz (1992) argue that model respecification should be accompanied with an additional independent sample for cross-validation of the respecified model in order to avoid capitalizing on chance. Therefore, interpretation of the results requires caution until a further validation with an independent
A Multi-Dimensional Model. . . . Carroll, Connaughton, Spengler and Byon
93 Marketing Management Journal, Spring 2014
sample is conducted. Despite the aforementioned limitations, the current study serves as a first and exploratory step toward incorporating perceived risk into the sport management domain.
REFERENCES
Anderson, D., & Gerbing, D. W. (1988).
Structural equation modeling in practice: A review and recommended two-step approach. Psychological Bulletin, 103, 411-423.
Arbuckle, J. (2006) AMOS 7.0 User’s Guide. Small Walters, Chicago.
Bagozzi, R. P., & Yi, Y. (1988). On the evaluation of structural equation models. Journal of the Academy of Marketing Science, 16(1), 74-94.
Bentler, P. M. (1990). Comparative fit indices in structural models. Psychological Bulletin, 107, 238-246.
Bettman, J. R. (1973). Perceived risk and its components: A model and empirical test. Journal of Marketing Research, 10, 184-190.
Bollen, K. A. (1989). Structural equations with latent variables. New York: John Wiley & Sons.
Boo, S., & Gu, H. (2010) Risk perception of mega-events, Journal of Sport and Tourism, 15, 139-161.
Cattell, R. B. (1966). The scree test for the number of factors. Multivariate Behavioral Research, 1, 245-276.
Cheron, E. J., & Ritchie, J. R. B. (1982). Leisure activities and perceived risk. Journal of Leisure Research, 14(2), 139-154.
Cronbach, L. J. (1951). Coefficient alpha and the internal structure of test. Psychometrika, 16, 297-334.
Cunningham, G. B., & Kwon, H. H. (2003). The theory of planned behaviour and intentions to attend a sport event. Sport Management Review, 6(2), 127-145.
Fornell, C., & Larcker, D. (1981). Evaluating structural equation models with unobservable variables and measurement error. Journal of Marketing Research, 18(1), 39-50.
Fulks, D. L. (2010). Revenues and expenses: 2004-2009 NCAA Division I intercollegiate athletics programs report. Retrieved from http://www.ncaapublications.com/p-4202-revenues-and-expenses-2004-2009.aspx
Funk, D. C., Mahony, D. F., Nakazawa, M., & Hirakawa, S. (2001). Development of the Sport Interest Inventory (SII): Implications for measuring unique consumer motives at sporting events. International Journal of Sports Marketing and Sponsorship, 3, 291-316.
Haddock, C. (1993). Managing risks in outdoor activities. Wellington: New Zealand Mountain Safety Council.
Hair, J. F., Black, W. C., Babin, B. J., Anderson, R. E., & Tatham, R. L. (2005). Multivariate
Data Analysis (6th ed.). Upper Saddle River, NJ: Prentice Hall.
Hu, L. T., & Bentler, P. M. (1999). Cutoff criteria for fit indexes in covariance structure analysis: Conventional criteria versus new alternatives. Structural Equation Modeling, 6(1), 1-55.
Hunt, K. A., Bristol, T., & Bashaw, R. E. (1999). A conceptual approach to classifying sports fans. The Journal of Services Marketing, 13(6), 439-452.
Jacoby, J., & Kaplan, L. (1972). The components of perceived risk. In M. Venkatesan (Ed.), Proceedings, Third Annual Conference, Association for Consumer Research. University of Chicago, 382-393.
Kanouse, D. E. (1984). Explaining negativity biases in evaluation and choice behavior theory and research. Advances in Consumer Research, 11, 703-708.
Kaplan, L. B., Syzbillo, G. J., & Jacoby, J. (1974). Components of perceived risk in product purchase. Journal of Applied Psychology, 59, 287-291.
Kim, N., & Chalip, L. (2004). Why travel to the FIFA World Cup? Effects of motives, background, interest, and constraints. Tourism Management, 25, 695-707.
Kline, R. B. (2005). Principles and practice of structural equation modeling (2nd ed.). New York: Guilford.
Laroche, M., McDougall, G. H. G., Bergeron, J., & Yang, Z. (2004). Exploring how intangibility affects perceived risk. Journal of Service Research, 6, 373-389.
Lim, N. (2003). Consumers’ perceived risk: Sources versus consequences. Electronic Consumer Research and Applications, 2, 216-228.
A Multi-Dimensional Model. . . . Carroll, Connaughton, Spengler and Byon
Marketing Management Journal, Spring 2014 94
Slovic, P., & Weber, E.U. (2002, April). Perception of risk posed by extreme events. Paper presented at the Risk Management Strategies in an Uncertain World Conference, Palisades, NY.
Spaaij, R. (2007). Football hooliganism in the Netherlands: Patterns of continuity and change. Soccer & Society, 8(2/3), 316-334.
Steiger, J. H. (1990). Structural model evaluation and modification: An internal estimation approach. Multivariate Behavioral Research, 25, 173-180.
Stevens, J. (1996). Applied multivariate statistics for the social sciences (3rd ed.). Mahwah, NJ:
Lawrence Erlbaum. Stone, R. N., & Grønhaug, K. (1993). Perceived
risk: Further considerations for the marketing discipline. European Journal of Marketing. 27(3), 39-50.
Taylor, T., & Toohey, K. (2006) Security, perceived safety, and event attendee enjoyment at the 2003 Rugby World Cup, Tourism Review International, 10(4), 257-267.
Taylor, T., & Toohey, K. (2007). Perceptions of terrorism threats at the 2004 Olympic Games: Implications for sport events. Journal of Sport & Tourism, 12(2), 99-114.
Toohey, K., & Taylor, T. (2008) Mega events, fear, and risk: Terrorism and the Olympic Games, Journal of Sport Management, 22(4), 451-469.
Toohey, K., Taylor, T., & Lee, C. (2003). The FIFA World Cup 2002: The effects of terrorism on sport tourists. Journal of Sport Tourism, 8, 167-185.
Theodorakis, N., Koustelios, A., Robinson, L., & Barlas, A. (2009) Moderating the role of team identification on the relationship between service quality and repurchase intentions among spectators of professional sports, Managing Service Quality, 19(4), 456-473.
Trail, G. T., & James, J. (2001). The motivation scale for sport consumption: Assessment of the scale’s psychometric properties. Journal of Sport Behavior, 24(1), 108-127.
Trail, G. T., & Kim, Y. K. (2010). Constraints and motivators: A new model to explain sport consumer behavior. Journal of Sport Management 24, 190-210.
MacCallum, R. C., Roznowski, M., & Necowitz, L. B. (1992). Model modifications in covariance structure analysis: The problem of capitalization on chance. Psychological Bulletin, 111, 490-504.
McDougall, G. H. G., & Snetsinger, D. W. (1990, Fall). Determinants of ease of evaluation: Products and services compared. Canadian Journal of Administrative Sciences, 4, 426-446.
Mitchell, V. W., & Greatorex, M. (1993). Risk perception and reduction in the purchase of consumer services. The Service Industries Journal, 13, 179-200.
Murray, K. B., & Schlacter, J. L. (1990). The impact of services versus goods on consumer’s assessment of perceived risk and variability. Journal of the Academy of Marketing Science, 18(1), 51-65.
Plunkett Research (2013). Sports industry overview. Retrieved August 6, 2013 from: http://www.plunkettresearch.com/sports-recreation-leisure-market-research/industry-statistics.
Plunkett Research. (2009). Plunkett’s sports industry almanac 2009. Houston, TX: Plunkett Research.
Qi, C., Gibson, H., & Zhang, J. (2009) Perceptions of risk and travel intentions: The case of China and the Beijing Olympic Games, Journal of Sport and Tourism, 14, 43-67.
Reisinger, Y., & Mavondo, F. (2005). Travel anxiety and intentions to travel internationally: Implications of travel risk perception. Journal of Travel Research, 43, 212-225.
Roehl, W. S., & Fesenmaier, D. R. (1992). Risk perceptions and pleasure travel: An exploratory analysis. Journal of Travel Research, 30(4), 17-26.
Roselius, T. (1971). Consumer rankings of risk reduction methods. Journal of Marketing, 35(1), 56-61.
Sargeant, K., & Berkowitz, S. (2014, February 23). Subsidy of Rutgers athletics jumps 67.9% to $47 million. USA Today. Retrieved March 18, 2014 from http://www.usatoday.com/story/sports/college/ 2014/02/23/rutgers-university-athletics-subsidy-jumps/5761371/
Shank, M. D. (2005). Sport Marketing: A strategic perspective. (3rd ed.). Upper Saddle River, NJ: Prentice Hall.
A Multi-Dimensional Model. . . . Carroll, Connaughton, Spengler and Byon
95 Marketing Management Journal, Spring 2014
Wann, D. L. (1995). Preliminary validation of the sport fan motivation scale. Journal of Sport and Social Issues, 19, 377-396.
Wann, D. L., & Branscombe, N. R. (1993). Sports fans: Measuring degree of identification with the team. International Journal of Sport Psychology, 24, 1-17.
Zhang, J. J., Pease, D. C., Lam, E. T. C., Bellerive, L. M., Pham, U. L., Williamson, D. P., & Lee, J. T. (2001). Sociomotivational factors affecting spectator attendance at minor league hockey games. Sport Marketing Quarterly, 10(1), 43-56.