A Molecular Phylogeny of the Bivalve Mollusks - Molecular Biology
11
A Molecular Phylogeny of the Bivalve Mollusks S. Laura Adamkewicz, * M. G. Harasewych,? Judith Blake,$ Deborah Saudek,$ and Carol J. Bult$ *Department of Biology, George Mason University; tDivision of Mollusks, Institution; and $The Institute for Genomic Research, Rockville, Maryland National Museum of Natural History, Smithsonian A phylogenetic reconstruction based on 506 nucleotides near the 5’ end of the 18s subunit of ribosomal DNA (rDNA) in 2 gastropod, 3 chiton and 28 bivalve mollusks supported the monophyly and sister group relationship of the subclasses Heterodonta and Palaeoheterodonta but could not confidently establish either the monophyly or the phylogenetic relationships of the morphologically well defined subclasses Pteriomorphia, Protobranchia, and Anomalodesmata. When both gastropods and chitons were included in the analysis, one or the other invariably emerged within Bivalvia. Some evidence indicates that this apparent polyphyly may be the consequence of unequal rates of evolution and of rapid changes in the protobranch and anomalodesmatan lineages. The taxa usually included in Pteriomorpha emerge as a grade rather than a clade, although in a sequence that differs from morphologically based phylogenies. Introduction One of the most powerful uses of molecular char- acters in systematics is the ability to examine ancient divergences for which morphology is a weak guide. Thus, many workers have used sequence data to inves- tigate the relationships among animal phyla and the classes within them (e.g. Philippe, Chenuil, and Addoute 1994; Boore et al., 1995; Halanych et al. 1995; Win- nepenninckx, Backeljau, and DeWachter 1996). Of the protostome phyla, Mollusca are among the most ancient and diverse. Living representatives of this phylum are usually divided into seven classes: (1) Aplacophora (so- lenogasters and caudofoveates), (2) Polyplacophora (chitons), (3) Monoplacophora (pseudometameric, lim- pet-like animals), (4) Scaphopoda (tusk shells), (5) Bi- valvia (oysters, scallops, clams), (6) Gastropoda (snails), and (7) Cephalopoda (octopus, squid). Classes 3-7 are grouped in the clade Conchifera. The commonest and most speciose classes in the modern fauna are the bi- valves and the gastropods. To date, molecular investi- gations of the mollusks have focused primarily on re- lationships of other phyla to the Mollusca, represented by the classes Gastropoda, Bivalvia, and the Polypla- cophora, the latter being regarded as basal. In an analysis of molluscan phylogeny that includ- ed five other animal phyla, Winnepenninckx, Backeljau, and DeWachter (1994) compared complete sequences of 18s rDNA from representatives of three molluscan classes: two gastropods, two bivalves, and a chiton. Based on both distance and parsimony analyses, they concluded that both gastropod and bivalve classes, as well as the phylum Mollusca, were monophyletic. At the same time, they commented on the unorthodox po- sition of the chiton in their phylogeny, where it formed a clade with the gastropods, this clade being the sister group to the bivalves, contrary to morphological evi- dence. Given their very few molluscan taxa, Winnepen- ninckx, Backeljau, and DeWachter called for the ex- Key words: Mollusca, Bivalvia, molecular phylogeny, 18s rDNA. Address for correspondence and reprints: S. Laura Adamkewicz, Department of Biology, George Mason University, Fairfax, Virginia 22030. E-mail: ladamkew @gmu.edu. Mol. Biol. Evol. 14(6):619-629. 1997 0 1997 by the Society for Molecular Biology and Evolution. ISSN: 0737-4038 amination of more taxa to resolve molluscan relation- ships. Kenchington et al. (1994), also using 18s rDNA data, did examine many more bivalve taxa. Using all complete sequences available at the time, this group compared 13 bivalves belonging to four superfamilies in two subclasses, in addition to an arthropod, a chiton, and a gastropod (these last two taxa and five of the bivalves are included in the present study). Kenching- ton’s study produced a phylogeny in which the gastro- pod was sister taxon to the bivalves and the chiton was included among the pteriomorph bivalves, leading Ken- chington et al. to conclude that the Bivalvia were poly- phyletic with respect to the Polyplacophora. They also recommended the acquisition of sequence data for many more taxa. These contradictions concerning relationships among the classes of mollusks will not be resolved until much denser taxonomic coverage is available, and such coverage must begin with a thorough examination of relationships within each single class, with sufficient taxa to guard against the distorting effects of any par- ticular species. Lecointre et al. (1993) have demonstrat- ed the large and unpredictable effect that choice of taxa can have on a phylogeny and have strongly supported the view that increasing the number of taxa is as or more important than extending the length of sequence per tax- on. To that end, it was the purpose of this present study to increase greatly the number of bivalve taxa and the breadth of coverage of the class represented by partial sequences of the 18s rDNA gene. This would allow us to examine more powerfully the relationships among members of Bivalvia, which are interesting in their own right. We have also included additional polyplacophor- ans and gastropods in an effort to determine the rela- tionships among the three classes. Systematists are in broad agreement about divisions at the highest taxonomic levels of Bivalvia. All recog- nize five major subdivisions of the class, each of which is represented in this study: (1) Protobranchia (a small group of deposit-feeding deep-sea clams), (2) Pterio- morphia (mussels, scallops, and oysters), (3) Anomalo- desmata (a small group of marine clams including all septibranch clams), (4) Palaeoheterodonta (including all 619 Downloaded from https://academic.oup.com/mbe/article/14/6/619/1080893 by guest on 21 November 2021
Transcript of A Molecular Phylogeny of the Bivalve Mollusks - Molecular Biology

A Molecular Phylogeny of the Bivalve Mollusks
S. Laura Adamkewicz, * M. G. Harasewych,? Judith Blake,$ Deborah Saudek,$ and Carol J. Bult$ *Department of Biology, George Mason University; tDivision of Mollusks, Institution; and $The Institute for Genomic Research, Rockville, Maryland
National Museum of Natural History, Smithsonian
A phylogenetic reconstruction based on 506 nucleotides near the 5’ end of the 18s subunit of ribosomal DNA (rDNA) in 2 gastropod, 3 chiton and 28 bivalve mollusks supported the monophyly and sister group relationship of the subclasses Heterodonta and Palaeoheterodonta but could not confidently establish either the monophyly or the phylogenetic relationships of the morphologically well defined subclasses Pteriomorphia, Protobranchia, and Anomalodesmata. When both gastropods and chitons were included in the analysis, one or the other invariably emerged within Bivalvia. Some evidence indicates that this apparent polyphyly may be the consequence of unequal rates of evolution and of rapid changes in the protobranch and anomalodesmatan lineages. The taxa usually included in Pteriomorpha emerge as a grade rather than a clade, although in a sequence that differs from morphologically based phylogenies.
Introduction
One of the most powerful uses of molecular char- acters in systematics is the ability to examine ancient divergences for which morphology is a weak guide. Thus, many workers have used sequence data to inves- tigate the relationships among animal phyla and the classes within them (e.g. Philippe, Chenuil, and Addoute 1994; Boore et al., 1995; Halanych et al. 1995; Win- nepenninckx, Backeljau, and DeWachter 1996). Of the protostome phyla, Mollusca are among the most ancient and diverse. Living representatives of this phylum are usually divided into seven classes: (1) Aplacophora (so- lenogasters and caudofoveates), (2) Polyplacophora (chitons), (3) Monoplacophora (pseudometameric, lim- pet-like animals), (4) Scaphopoda (tusk shells), (5) Bi- valvia (oysters, scallops, clams), (6) Gastropoda (snails), and (7) Cephalopoda (octopus, squid). Classes 3-7 are grouped in the clade Conchifera. The commonest and most speciose classes in the modern fauna are the bi- valves and the gastropods. To date, molecular investi- gations of the mollusks have focused primarily on re- lationships of other phyla to the Mollusca, represented by the classes Gastropoda, Bivalvia, and the Polypla- cophora, the latter being regarded as basal.
In an analysis of molluscan phylogeny that includ- ed five other animal phyla, Winnepenninckx, Backeljau, and DeWachter (1994) compared complete sequences of 18s rDNA from representatives of three molluscan classes: two gastropods, two bivalves, and a chiton. Based on both distance and parsimony analyses, they concluded that both gastropod and bivalve classes, as well as the phylum Mollusca, were monophyletic. At the same time, they commented on the unorthodox po- sition of the chiton in their phylogeny, where it formed a clade with the gastropods, this clade being the sister group to the bivalves, contrary to morphological evi- dence. Given their very few molluscan taxa, Winnepen- ninckx, Backeljau, and DeWachter called for the ex-
Key words: Mollusca, Bivalvia, molecular phylogeny, 18s rDNA.
Address for correspondence and reprints: S. Laura Adamkewicz, Department of Biology, George Mason University, Fairfax, Virginia 22030. E-mail: ladamkew @gmu.edu.
Mol. Biol. Evol. 14(6):619-629. 1997 0 1997 by the Society for Molecular Biology and Evolution. ISSN: 0737-4038
amination of more taxa to resolve molluscan relation- ships. Kenchington et al. (1994), also using 18s rDNA data, did examine many more bivalve taxa. Using all complete sequences available at the time, this group compared 13 bivalves belonging to four superfamilies in two subclasses, in addition to an arthropod, a chiton, and a gastropod (these last two taxa and five of the bivalves are included in the present study). Kenching- ton’s study produced a phylogeny in which the gastro- pod was sister taxon to the bivalves and the chiton was included among the pteriomorph bivalves, leading Ken- chington et al. to conclude that the Bivalvia were poly- phyletic with respect to the Polyplacophora. They also recommended the acquisition of sequence data for many more taxa.
These contradictions concerning relationships among the classes of mollusks will not be resolved until much denser taxonomic coverage is available, and such coverage must begin with a thorough examination of relationships within each single class, with sufficient taxa to guard against the distorting effects of any par- ticular species. Lecointre et al. (1993) have demonstrat- ed the large and unpredictable effect that choice of taxa can have on a phylogeny and have strongly supported the view that increasing the number of taxa is as or more important than extending the length of sequence per tax- on. To that end, it was the purpose of this present study to increase greatly the number of bivalve taxa and the breadth of coverage of the class represented by partial sequences of the 18s rDNA gene. This would allow us to examine more powerfully the relationships among members of Bivalvia, which are interesting in their own right. We have also included additional polyplacophor- ans and gastropods in an effort to determine the rela- tionships among the three classes.
Systematists are in broad agreement about divisions at the highest taxonomic levels of Bivalvia. All recog- nize five major subdivisions of the class, each of which is represented in this study: (1) Protobranchia (a small group of deposit-feeding deep-sea clams), (2) Pterio- morphia (mussels, scallops, and oysters), (3) Anomalo- desmata (a small group of marine clams including all septibranch clams), (4) Palaeoheterodonta (including all
619
Dow
nloaded from https://academ
ic.oup.com/m
be/article/14/6/619/1080893 by guest on 21 Novem
ber 2021

620 Adamkewicz et al.
7 PROTOBRANCHIA
I ANOMALODESMATA
PALAEOHETERODONTA
HETERODONTA
A STAROBOGATOV (1992)
PROTOBRANCHIA
PTERIOMORPHIA -
PALAEOHETERODONTA
HETERODONTA
ANOMALODESMATA
C WALLER (1997)
7 PROTOBRANCHIA
PTERIOMORPHIA
I TRIGONIIDAE 1
PALAEOTAXODONTA 1 PROTOBRANCHIA LIPODONTA
ANOMALODESMATA
PALAEOHETERODONTA
OSTREOIDEA
PECTINOIDEA 1 PTERIOMORPHIA MYTILOIDA
ARCOIDA 1 NEOTAXODONTA
HETERODONTA
B COPE (1996)
7 PROTOBRANCHIA
MYTlLOlDA
ARCOIDA 1 PTERIOMORPHIA OSTREO~DEA
PECTINOIDEA
PALAEOHETERODONTA
VENEROIDA 1 HETERODONTA MYOIDA
ANOMALODESMATA
D MORTON (1996)
,- PROTOBRANCHIA
E SALVINI-PLAWEN & STEINER (1996) F PRESENT STUDY
FIG. l.--Summaries of five recent morphology-based hypotheses of phylogenetic relationships among major groups within the molluscan class Bivalvia compared with the results of our molecular study. The nomenclature, taxonomic rank, and exact composition of some higher groups vary among these authors but have been standardized here for purposes of comparison. Earlier classifications of Bivalvia are summarized in Newell (1969; fig. 102).
freshwater mussels), and (5) Heterodonta (most marine clams). The Protobranchia are believed to be the most ancient clade and to comprise the sister taxon to the remaining bivalves. The majority of living species be- long to the Pteriomorphia, the Palaeoheterodonta, or the Heterodonta, the latter representing the most recent ma- jor radiation. So different are the Protobranchia that Waller (1997) preferred to recognize only one other sub- class, the Autobranchia, containing the other four major groups. Others, such as Abbott and Dance (1986) rec- ognized each of the five groups as a subclass. Disagree- ment begins with the relationships among the five groups, particularly with regard to which group diverged first from the protobranchs and how many distinct clades exist within the Bivalvia (fig. 1). Some systematists, in- cluding Waller (1997), Morton (1996), and Salvini-
Plawen and Steiner ( 1996), regard the Heterodonta and Anomalodesmata as closely related and recently di- verged. Others, such as Cope (1996) and Starobogatov (1992), hypothesize that Anomalodesmata is an ancient group that diverged from the base of the bivalve tree. There is little consensus as to the placement of the Pa- laeoheterodonta or as to whether the Pteriomorphia form a grade or a clade. All of these views were based on careful morphological and paleontological studies, mak- ing the addition of molecular information of great in- terest.
Bowman (1989), in a prodigious effort relying on direct sequencing of both 28s and 18s r-RNA, was the first to investigate these relationships within a broad sampling of bivalves. She combined data from two pub- lished sequences with 19 new sequences from species
Dow
nloaded from https://academ
ic.oup.com/m
be/article/14/6/619/1080893 by guest on 21 Novem
ber 2021

Phylogeny of the Bivalves 621
in 15 superfamilies representing 4 subclasses, but she was unable to achieve a uniform data matrix, instead using sequences from different genes/regions for differ- ent groups of taxa (Bowman 1989, pp. 80-81). We have attempted to emulate Bowman’s efforts at very broad taxonomic coverage using PCR cycle sequencing of DNA to produce a uniform data matrix for all species. In order to maximize the number of species represented, sequencing effort was confined to the 5’ region of the 18s rDNA gene corresponding to positions 26-582 of Winnepenninckx, Backeljau, and DeWachter’s (1994) complete sequence for the gastropod Onchidella celtica (Cuvier, 18 17). For this restricted portion of the gene, we obtained data from 21 previously unsequenced taxa (20 bivalves and 1 chiton), obtained new data from 7 taxa for which published sequences are available (6 bi- valves and 1 chiton), and included published sequence for 6 taxa (3 bivalves, 2 gastropods, and 1 chiton). Al- together our data matrix contained 33 taxa: 28 bivalves, 2 gastropods and 3 chitons (table 1). These 28 bivalves represent 9 of the 10 orders recognized by Abbott and Dance (1986) and 22 of the 41 extant superfamilies rec- ognized by Morton (1996).
While this coverage is far from complete, each ma- jor lineage of the Bivalvia is represented by multiple taxa, permitting a more thorough testing of phylogenetic hypotheses. The questions that we have attempted to investigate are: (1) What are the relationships among the bivalve superfamilies represented in our data? (2) To which morphologically based bivalve phylogeny, if any, do the molecular data conform most closely? (3) What are the relationships among the three molluscan classes represented in our data?
Materials and Methods Sample Collection and DNA Extraction
DNA was extracted from foot, adductor muscle, or whole animal by the method of Doyle and Doyle (1987) as communicated to us by Andrew McArthur (Univer- sity of Victoria) and modified in our laboratory (Adam- kewicz and Harasewych 1996). This method has proven to be both simple and superior to most others in the quality of DNA produced from mollusks. Once extract- ed, all DNA was stored frozen at -20°C. With the ex- ceptions of Cuspidaria and Periploma, which were pre- served specimens maintained in alcohol, all of the spe- cies sequenced for this project were collected living, fro- zen immediately, and maintained frozen until their DNA was extracted. All identifications were confirmed by one of us (M.G.H.) and the shells have been placed in the collections of the National Museum of Natural History. Collection localities and catalog numbers for the vouch- er specimens are given in table 1. Data on voucher spec- imens are also available via the World Wide Web (http: //www.tigr.org) in the Sequences, Sources, Taxa (SST) database (Bult et al. 1997).
Primer Design
Initial PCR amplification of the target region of the gene for the small subunit of ribosomal DNA (18s
rDNA) was always performed with the primers devel- oped by Holland, Hacker, and Williams (1991), which were: (forward) 5’-GCC AGT AGC ATA TGC TTG TCT C and (reverse) 5’-AGA CTT GCC TCC AAT GGA TCC. The sequencing reactions were then gener- ated with these primers and also with another set of internal primers designed by one of us (C.J.B.) as fol- lows: (forward) 5’-GCC GGC GAC G(T/C)A TCT TTC and (reverse) 5’-GAA AGA T(A/G)C GTC GCC GGC. Used in combination, these four primers produced dou- ble coverage of the entire region.
Production of Sequencing Template
Initial PCR amplifications were performed using a Perkin-Elmer 480 thermal cycler and a reaction mix of 50 l.~l containing 500 ng of genomic DNA, 1.23 U of Amplitaq Taq polymerase (Perkin-Elmer), 0.25 pM of each primer, 200 I_LM of each dNTP 1.5 mM MgC12, and 5 ~1 of 10 X Perkin-Elmer PCR reaction buffer. All PCR reactions were performed as “hot start” reactions with the following parameters: 5 min at 95”C, addition of Taq polymerase, 25 cycles of the pattern 45 s at 94°C for denaturing, 2 min at 50°C for annealing, and 1 min at 72°C for extension. Following the 25 cycles, an 8-min final extension was performed at 72”C, after which the reaction mix was held at 4°C. Five microliters of each PCR product was evaluated on a 1% (w/v) agarose gel and the remaining reaction mix was transferred to a Mi- crocon 100 ultrafiltration device (Amicon Inc., Beverly, Mass.) for removal of primers, unreacted dNTPs, and salts. An initial wash with 200 pl of 40% (v/v) isopro- panol was performed prior to a wash with 450 ~1 of sterile distilled water.
DNA Sequencing and Data Management
Five microliters of cleaned PCR product were used as a template for sequencing on an Applied Biosystems 373A automated DNA sequencer using fluorescence dye terminator cycle sequencing kits (Applied Biosystems/Perkin Elmer). Sequence data were edited and then assembled into a consensus sequence using modified TIGR Assembler software (Fleischmann et al. 1995). Each consensus sequence was then edited using modified ABI Sequence Editor software.
Multiple Sequence Alignment
The confirmed consensus sequences of our 27 taxa were translated into multiple FASTA file format (Pear- son and Lipman 1988), combined with GenBank pub- lished sequences for six taxa, and viewed with Genetic Data Environment (GDE) version 2.0 (Smith et al. 1994). The sequences were aligned using the multiple sequence alignment algorithm (MSA) of Sutton (Bult et al. 1997).
Phylogenetic Analyses
Phylogenetic analyses using parsimony were con- ducted using the heuristic search function of PAUP 4.0.0d49 (Swofford 1996) with and without character reweighting using the resealed consistency index. When characters were reweighted, a base weight of 100 was used. All bootstrap analyses (2,000 replicates) used the
Dow
nloaded from https://academ
ic.oup.com/m
be/article/14/6/619/1080893 by guest on 21 Novem
ber 2021

622 Adamkewicz et al.
Table 1 Locality Data, Tissues Extracted, Voucher Specimen Information, and Sequence Accession Numbers for Taxa Used in this Study
Taxonomic Position of Each Species”
Collection Locality
Tissue Extracted
USNMb GSDB’ Catalog Accession Number Number
Class Polyplacophora Order Neoloricata
Suborder Ishnochitonina Acanthopleuru grunulutu (Gmelin, 1791). . . . . . . . . . . . . Acunthopleuru juponicu (Lischke, 1873) . . . . . . . . . . . . .
Suborder Acanthochitonina Cryptochiton stelleri (Middendorff, 1847) . . . . . . . . . . . .
Class Gastropoda Subclass Gymnomorpha
Order Systellommatophora Superfamily Onchidoidea
Onchidellu celticu (Cuvier, 18 17) . . . . . . . . . . . . . . . . . . . Subclass Pulmonata
Order Stylommatophora Superfamily Achatinoidea
Limicoluriu kumbeul (Bruguiere, 1792) . . . . . . . . . . . . . . Class Bivalvia
Subclass Protobranchia Order Solemyoida
Superfamily Solemyoidea Solemyu velum Say, 1823. . . , . . . . . . . . . . , . . . . . . . . . . .
Order Nuculoida Superfamily Nuculoidea
Nuculu proximu Say, 1822. . . . . . . . , . . . . . . . . . . . . . . . , Superfamily Nuculanoidea
Yoldiu limutulu (Say, 183 1). . . . . . . . . . . . . . . . . . . . . . . . Subclass Anomalodesmata
Order Pholadomyoida Superfamily Pandoroidea
Periplomu fragile (Totten, 1835). . . . . . . . . . . . . . . . . . . . Superfamily Poromyoidea
Cuspiduriu glacialis (G. 0. Sars, 1878). . . . . . . . . . . . . . Subclass Pteriomorphia
Order Arcoida Superfamily Arcoidea
Anuduru ovulis (Bruguiere, 1789). . . . . . . . . . . . . . . . . . . Order Mytiloida
Superfamily Mytiloidea Mytilus edulis Linne, 1758. . . . . . . . . . . . . . . . . . . . . . . . . Geukensiu demissu (Dillwyn, 18 17) . . . . . . . . . . . . . . . . .
Order Pterioida Superfamily Pterioidea
Pteriu breviulutu (Dunker, 1872). . . . . . . . . . . . . . . . . . . . Superfamily Pinnoidea
Atrinu rigidu (Lightfoot, 1786) . . . . . . . . . . . . . . . . . . . . . Order Ostreoida
Superfamily Ostreoidea Crussostreu virginicu (Gmelin, 179 1). . . . . . . . . . . . . . . .
Superfamily Pectinoidea Argopecten irrudiuns (Lamark, 18 19). . . . . . . . . . . . . . . . Plucopecten mugellunicus (Gmelin, 1791). . . . . . . . . . . .
Subclass Palaeoheterodonta Order Unionoida
Superfamily Unionoidea Anodontu imbecilis Say, 1829. . . . . . . . . . . . . . . . . . . . . . Elliptio complunutu (Lightfoot, 1786) . . . . . . . . . . . . . . .
Subclass Heterodonta Order Veneroida
Superfamily Galeommatoidea Divuriscintillu yoyo Mikkelsen and Bieler, 1989. . . . . . .
Superfamily Chamoidea Arcinellu cornutu Conrad, 1866 . . . . . . . . . . . . . . . . . . . .
Superfamily Mactroidea Muliniu luterulis (Say, 1822). . . . . . . . . . . . . . . . . . . . . . .
Superfamily Solenoidea Ensis directus Conrad, 1843 . . . . . . . . . . . . . . . . . . . . . . .
Pt. Antonio, Jamaica NA
Bamfield, Canada
Buccal mass NA
Buccal mass
888684 L78872 NA X702 1 Od
888657 L78873
NA
NA
Woods Hole, Mass.
Woods Hole, Mass.
Woods Hole, Mass.
New Jersey
New Jersey
Sanibel, Fla.
Lewis, Del. Lewis, Del.
Minabe, Japan
Ft. Pierce, Fla.
Lewis, Del.
NA NA
NA NA X7021 Id
NA NA X66374d
Siphon 888665 L78846
Foot
Adductor and foot
888666 L78847
888668 L78848
Whole animal
Whole animal
832796 L78845
857559 L78844
Adductor 88868 1 L78852
Adductor Adductor
888682 L78854 888683 L78853
Adductor
Adductor
888685 L78849
888609 L78850
Adductor
NA NA
888693 L7885 1
NA Ll 1265d NA X5 3899d
Lake Worth, Fla. Fairfax, Va.
Adductor Adductor
888686 L78858 888687 L78857
Ft. Pierce, Fla.
Sanibel, Fla.
NA
Lewis, Del.
Whole animal
Adductor
NA
Adductor
888688 L78869
88865 1 L78866
NA Ll 1268d
888689 L7887 1
Dow
nloaded from https://academ
ic.oup.com/m
be/article/14/6/619/1080893 by guest on 21 Novem
ber 2021
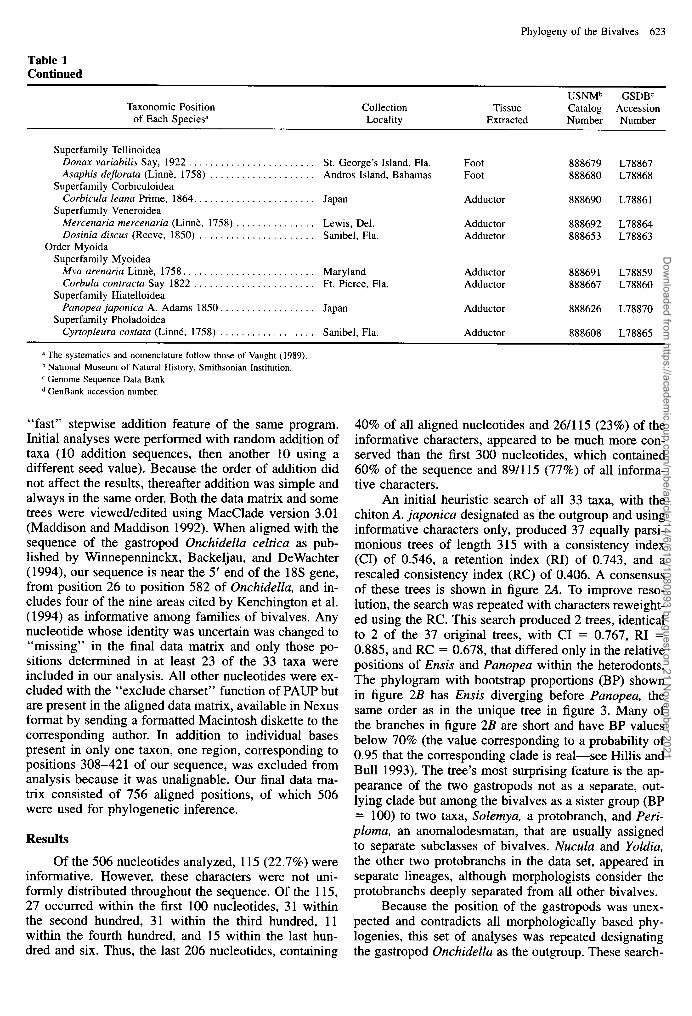
Phylogeny of the Bivalves 623
Table 1 Continued
Taxonomic Position of Each Species”
Collection Locality
Tissue Extracted
USNMb GSDB’ Catalog Accession Number Number
Superfamily Tellinoidea Donax variabilis Say, 1922 . . . . . . . . . . . . Asaphis dejlorata (Link, 1758) . . . . . . . .
Superfamily Corbiculoidea Corbicufa leana Prime, 1864. . . . . . . . . . .
Superfamily Veneroidea Mercenaria mercenaria (Linne, 1758) . . . Dosinia discus (Reeve, 1850) . . . . . . . . . .
Order Myoida Superfamily Myoidea
Mya arenaria Link, 1758. . . . . . . . . . . . . Corbula contracta Say 1822 . . . . . . . . . . .
Superfamily Hiatelloidea Panopea japonica A. Adams 1850. . . . . .
Superfamily Pholadoidea Cyrtopleura costata (Link, 1758) . . . . . .
........... St. George’s Island, Fla. Foot 888679 L78867
........... Andros Island, Bahamas Foot 888680 L78868
........... Lewis, Del. Adductor 888692 L78864
........... Sanibel, Fla. Adductor 888653 L78863
........... Maryland Adductor 888691 L78859
........... Ft. Pierce, Fla. Adductor 888667 L78860
Japan Adductor 888690 L7886 1
Japan Adductor 888626 L78870
Sanibel, Fla. Adductor 888608 L78865
a The systematics and nomenclature follow those of Vaught (1989). b National Museum of Natural History, Smithsonian Institution. c Genome Sequence Data Bank. d GenBank accession number.
“fast” stepwise addition feature of the same program. Initial analyses were performed with random addition of taxa (10 addition sequences, then another 10 using a different seed value). Because the order of addition did not affect the results, thereafter addition was simple and always in the same order. Both the data matrix and some trees were viewed/edited using MacClade version 3.01 (Maddison and Maddison 1992). When aligned with the sequence of the gastropod Onchidellu celtica as pub- lished by Winnepenninckx, Backeljau, and DeWachter (1994), our sequence is near the 5’ end of the 18s gene, from position 26 to position 582 of Onchidellu, and in- cludes four of the nine areas cited by Kenchington et al. (1994) as informative among families of bivalves. Any nucleotide whose identity was uncertain was changed to “missing” in the final data matrix and only those po- sitions determined in at least 23 of the 33 taxa were included in our analysis. All other nucleotides were ex- cluded with the “exclude char-set” function of PAUP but are present in the aligned data matrix, available in Nexus format by sending a formatted Macintosh diskette to the corresponding author. In addition to individual bases present in only one taxon, one region, corresponding to positions 308-421 of our sequence, was excluded from analysis because it was unalignable. Our final data ma- trix consisted of 756 aligned positions, of which 506 were used for phylogenetic inference.
Results
Of the 506 nucleotides analyzed, 115 (22.7%) were informative. However, these characters were not uni- formly distributed throughout the sequence. Of the 115, 27 occurred within the first 100 nucleotides, 31 within the second hundred, 31 within the third hundred, 11 within the fourth hundred, and 15 within the last hun- dred and six. Thus, the last 206 nucleotides, containing
40% of all aligned nucleotides and 26/l 15 (23%) of the informative characters, appeared to be much more con- served than the first 300 nucleotides, which contained 60% of the sequence and 89/l 15 (77%) of all informa- tive characters.
An initial heuristic search of all 33 taxa, with the chiton A. juponica designated as the outgroup and using informative characters only, produced 37 equally parsi- monious trees of length 3 15 with a consistency index (CI) of 0.546, a retention index (RI) of 0.743, and a resealed consistency index (RC) of 0.406. A consensus of these trees is shown in figure 2A. To improve reso- lution, the search was repeated with characters reweight- ed using the RC. This search produced 2 trees, identical to 2 of the 37 original trees, with CI = 0.767, RI = 0.885, and RC = 0.678, that differed only in the relative positions of Ensis and Punopea within the heterodonts. The phylogram with bootstrap proportions (BP) shown in figure 2B has Ensis diverging before Panopea, the same order as in the unique tree in figure 3. Many of the branches in figure 2B are short and have BP values below 70% (the value corresponding to a probability of 0.95 that the corresponding clade is real-see Hillis and Bull 1993). The tree’s most surprising feature is the ap- pearance of the two gastropods not as a separate, out- lying clade but among the bivalves as a sister group (BP = 100) to two taxa, Solemya, a protobranch, and Peri- ploma, an anomalodesmatan, that are usually assigned to separate subclasses of bivalves. Nuculu and Yoldia, the other two protobranchs in the data set, appeared in separate lineages, although morphologists consider the protobranchs deeply separated from all other bivalves.
Because the position of the gastropods was unex- pected and contradicts all morphologically based phy- logenies, this set of analyses was repeated designating the gastropod OnchideZZa as the outgroup. These search-
Dow
nloaded from https://academ
ic.oup.com/m
be/article/14/6/619/1080893 by guest on 21 Novem
ber 2021

624 Adamkewicz et al.
- Nucula Yoldia Anadara Geukensia -
- Mytilus E Argopecten
Placopecten Pteria
r Atrina
I I Crassostrea
- EEZ7ta
Diva riscin tilla Donax
E Asaphis Cyttopleura
E Arcinella r Ma
Corbula - Corbicula
Mulinia Dosinia Mercenaria
A
w A. granulata - A. japonica r Crypfochiton
- Yoldia
75 100
I 64 100 -
Cuspidaria
25
66 - Divariscintilla _ 64 Donax 61 100 t Asaphis
- Cyrtopleura 66 Arcinella
,a Ma 04 $8 orbula
B FIG. 2.-Phylogenetic relationships among 28 Bivalvia, 3 Polyplacophora, and 2 Gastropoda based on 506 bp of the 18s rDNA gene. A,
Consensus of 37 most-parsimonious trees (length = 315; CI = 0.546; RI = 0.743; RC = 0.406) generated in a heuristic search with Acantho- pleura japonica designated as the outgroup. B, One of two most-parsimonious trees (CI = 0.767; RI = 0.885; RC = 0.678) resulting from a heuristic search following reweighting of the data using the resealed consistency index. This tree is identical to one of the 37 trees of length 315 produced by the unweighted search. Bootstrap values are shown only for nodes with BP of >50%.
es again produced 37 trees topologically identical to the first set, differing only in the position of the root. The three chitons still behaved as a monophyletic group (BP = 100) but appeared among the bivalves in the position previously occupied by the gastropods.
The tree shown in figure 2B contains only nine branches with lengths greater than eight, and four are in the clade containing the gastropods and Cuspid&a, as are three of the nodes with BP of >95. To test the hy- pothesis that the gastropod placement was an artifact of long-branch attraction, the analysis leading to figure 2B was repeated with Periploma and Solemya excluded from the data matrix. In this search, the two gastropods emerged as sister group to the scallops on the next near- est long branch.
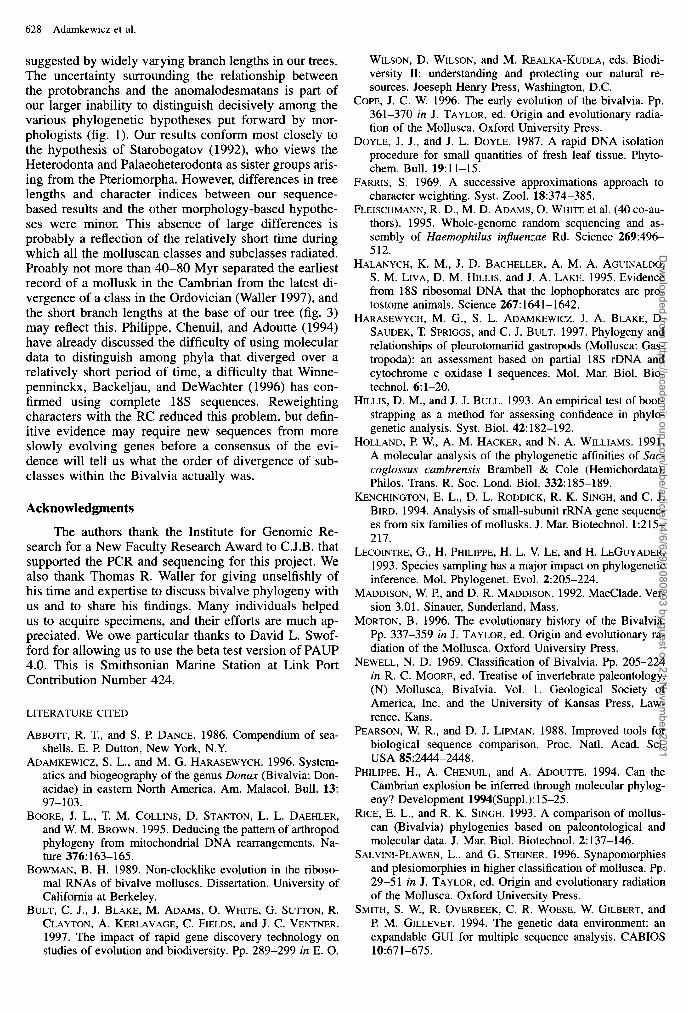
The incongruity of the position of the gastropods made us reluctant to proceed further with this data set. Because morphological opinion unanimously considers chitons to be more distantly related to the bivalves than are gastropods, additional analyses aimed only at inves- tigating the relationships within the class Bivalvia were performed excluding both gastropods and using only the chitons as the outgroup. A heuristic search like the ones above but using the reduced data set yielded 14 trees of minimum length 296 with CI = 0.557, RI = 0.740, and RC = 0.412. Reweighting using the RC produced a unique tree (length = 11,940, CI = 0.757, RI = 0.879, RC = 0.665), shown in figure 3, which was identical to one of the 14 unweighted trees.
In this reweighted tree, the relationships among the more derived taxa were unchanged and the sister group
status of the subclasses Palaeoheterodonta and Hetero- donta, each well supported as a separate lineage, re- ceived good support (BP = 72, P > 0.95). The rela- tionships within the Heterodonta did not reflect their morphological subdivision into two orders, the Venero- ida and Myoida. Taxa referred to these two orders are grouped in a single clade with BP = 84. The subclasses Pteriomorphia, Anomalodesmata and Protobranchia were not well resolved with respect to one another. The Pteriomorphia appeared to form a grade rather than a single clade but the relationships among its subgroups were not well resolved and bootstrap support for clades other than the scallops (Argopecten + Plucopecten) and the mussels (Mytilus + Geukensia) was low. The Pro- tobranchia and Anomalodesmata were not segregated at all.
The sensitivity of this phylogeny to selection of taxa was investigated by repeating both unweighted and reweighted heuristic searches while systematically ex- cluding one bivalve taxon at a time, always using the chitons as the outgroup. Effects on both the number of minimum-length trees and the degree of resolution were tabulated. As shown in table 2, six taxa had major ef- fects when removed, three more than doubling the num- ber of minimum-length trees and three decreasing the number to less than half. Despite having major effects on the numbers of minimum-length trees, none of these removals affected branch lengths or BP values by more than a few percent (53%). The removal of most taxa produced either no change in the number of trees (13 of 28 taxa) or minor change. The average for all trials was
Dow
nloaded from https://academ
ic.oup.com/m
be/article/14/6/619/1080893 by guest on 21 Novem
ber 2021

F Cyptochifon A. granulata
75 A. japonica I Cuspidaria
I - Nucula 100
66
25
FIG. 3.-The single most-parsimonious tree (length = 11,940; CI = 0.757; RI = 0.879; RC = 0.665) (length = 296; CI = 0.557; RI = 0.740; RC = 0.412) resulting from a heuristic search, characters reweighted using the resealed consistency index, when gastropods are excluded from the data set and the three polyplacophorans are designated as the outgroup. Branch lengths shown are for an unweighted tree of length 296 identical to the reweighted tree. Bootstrap values are shown onlv for nodes with BP of >50%. An asterisk following the taxon identifies I
Phylogeny of the Bivalves 625
POLYPLACOPHORA
ANOMALODESMATA
PROTOBRANCHIA
PTERIOMORPHA
PALAEOHETERODONTA
those heterodonts placed in the Myoida in most classifications.
14.75 trees, or an increase of approximately one tree from the original search. The effect on the lengths of the shortest trees was modest in all cases, the range be- ing -25 to - 1, with an average change of -9 steps (-3%).
As could be expected from the results of removing single taxa, removing single clades had little effect ex- cept for a few cases. Deleting any of the basal clades, whose five taxa included three of the most sensitive, left the more derived portions of the tree intact. Also to be expected, removing most clades simply caused fewer, shorter trees to be found. The results of removing some of the inner clades were, however, unexpected. Remov- ing either the scallops (Argopecten + Plucopecten), the tellins (Donux + Asuphis), or the venerid clams (Mer- cenaria + Dosinia) caused a substantial increase in the number of equally parsimonious trees, from 14 to 104, 49, or 56 respectively. Each of these tests removed only two taxa. While none of the species had a high impact individually, in pairs the effect of their removal was sub- stantial.
HETERODONTA
The data showed clear signs of mutational satura- tion. Of the original 115 informative characters, 107 in- volved bivalve taxa only. When these were examined using three categories (transitions [TS] only, transver- sions [TV] only, or a mixture of both), 39 characters contained only transitions, 33 contained only transver- sions, and 35 contained both, yielding a TS : TV ratio of 39:33 or 1.2: 1. If a somewhat less stringent definition was used (not more than one taxon nonconforming), the ratio was 47:43 or 1.1: 1. When the character changes reported by PAUP as supporting each node were also classified by type, the TS : TV ratio was 137: 15 1 or 1: 1.1, again nearly unity. Such TS : TV ratios were lower than would be expected if most sites had experienced only a single mutational change. The consistency of each character was also related to the type of change. The 33 transversions had an average CI of 0.79 and 22 of them (67%) had CI = 1. The 39 transitions had an average CI of 0.66 and only 38% had a CI = 1. The 35 mixed characters had an average CI of 0.58 and only 23% had a CI = 1. This pattern suggested that weighting
Dow
nloaded from https://academ
ic.oup.com/m
be/article/14/6/619/1080893 by guest on 21 Novem
ber 2021

626 Adamkewicz et al.
Table 2 Taxa Whose Removal Had a Major Effect on the Phylogeny
Change in Number of
Deleted Trees Effect on Effect of Taxon (and length)a Resolutionb Reweighting
My a. . . . . . . . . 14 + 56 (294) Heterodonts Unique tree, only poorly re- Arcinella solved moved from
original tree Cyrtopleura . . 14 + 56 (283) Same as Mya Same as Mya A trina . . . . . . . 14 + 31 (287) Oyster clade Unique tree, pro-
disappears tobranchs and anomalodesma- ceans united
Nucula . . . . . . 14 + 4 (288) Resolution im- Same as Atrina proved
Cuspidaria . . . 14 + 2 (272) Well resolved, Same as Atrina oysters with protobranchs and anomalo- desmaceans
Yoldia . . . . . . . 14 + 2 (287) Same as Cuspi- Same as Atrina daria
a Comparisons are to an unweighted tree of length 296 identical to the tree in figure 3 which was produced by reweighting.
b Prior to reweighting.
characters by type of change should produce a result similar to reweighting characters with the RC. However, when this experiment was tried with two weighting schemes, a ratio of mixed : TS : TV of 1:2:3 or of 1:3: 10, multiple trees were produced and these trees were both more different from morphologically based trees and less well resolved than those generated by reweight- ing with the RC.
As would be expected with saturated data, the deeper nodes, uniting the more distantly related taxa, were not well resolved unless a weighting or reweight- ing scheme was applied. At the same time, the data also showed that the 18s sequence had not changed rapidly enough to resolve differences within single families or genera. Only one step separated the two species of chi- tons in the genus Acanthopleura, although one occurs in the northern Pacific and the other occurs in the Ca- ribbean. Similarly, branch lengths for closely related bi- valves were short, reflecting few changes within these more recent divergences. When published sequences for other bivalves (Mactridae, eight species; Mytilus, four species) were examined for the same 506 bases as our taxa, few or no differences were found within either group. Because PAUP could not resolve them with only 506 bases, these species were not included in this study.
An attempt was also made to repeat as nearly as possible Bowman’s (1989, p. 191) analysis of 21 bi- valves using the amphibian Xenopus as the outgroup. Although neither our set of sequences nor our set of taxa was identical to Bowman’s, 18 of our taxa were from the same superfamilies (9 from the same genera), with only 3 of her superfamilies not represented in our data set. Neither Bowman’s original analysis nor our recon- struction produced tree topologies concordant with mor-
Our data strongly support the assertion of Lecointre et al. (1993) that dense representation of taxa is as im- portant as length of sequence for stable phylogenetic reconstruction. The effect of removing one species from our matrix was unpredictable and could be large, as could the effect of removing one clade. Furthermore, these effects did not depend on which order or super- family was represented, because sensitive clades often did not contain a sensitive species. The only protection against such effects is broad taxonomic coverage. Our failure to reproduce the results of Bowman (1989), even with similar taxonomic coverage at the level of the su- perfamily, also supports the conclusions of Lecointre et al. (1993). Because neither our selection of species nor our exact gene region was identical to Bowman’s, we can only conclude that the incongruence was caused by the inclusion of different taxa and sequences. Because our sequences already included both slower and faster changing regions, expanding the data set to include comnlete seauences of the 18s rDNA gene mav not in- phologically based hypotheses. Unlike our analysis of I_ 1 ” d
33 taxa, our reconstruction of Bowman’s tree using a subset of 18 of our bivalves plus Xenopus failed to re- solve the heterodonts from the pteriomorphs. Bowman’s tree did show the heterodonts as a distinct clade, but the pteriomorphs appeared to be polyphyletic and the single palaeoheterodont was most closely allied with the Pro- tobranchia. The contrast between the two analyses less- ened, however, when bootstrap results were compared. Bowman’s bootstrap test of her tree showed significance support only for the heterodont clade and for the pairing of the scallops Argopecten and Placopecten, both sup- ported by our analysis. Neither Bowman’s tree nor our reconstruction corresponded with either our most re- solved reweighted tree or with any of the phylogenetic hypotheses outlined in figure 1.
The phylogenetic hypotheses represented in figure 1 were compared by bringing our most resolved tree (fig. 3) into the MacClade version 3.01 program (Mad- dison and Maddison 1992) and then altering it to rep- resent each hypothesis and noting the effect on tree length, CI, RI, and RC (Harasewych et al. 1997, table 2). This comparison required that all of the published hypotheses be greatly simplified, primarily by restricting them to relationships among the major subgroups of the Bivalvia. Otherwise, the taxonomic units considered by each author were too diverse for reasonable compari- sons. As table 3 shows, the largest increase in tree length and decrease in index values was caused by resolving the Anomalodesmata and the Protobranchia in our tree, a move also required by every other hypothesis. Once that change was in effect, our tree had statistics virtually identical to those of Starobogatov (1992) and only slightly different from those of Cope (1996) and Waller (1997). Most of the additional increases in length and decreases in indices for the hypotheses of Morton (1996) and Salvini-Plawen and Steiner ( 1996) were caused by the separation of the orders Myoida and Veneroida rath- er than by the positions of the subclasses.
Discussion
Dow
nloaded from https://academ
ic.oup.com/m
be/article/14/6/619/1080893 by guest on 21 Novem
ber 2021

Phylogeny of the Bivalves 627
Table 3 A Comparison of the Phylogenetic Hypotheses in Figure 1
Hypothesis Length” (A%)b CIc (A%) Rid (A%) RC’ (A%)
Present study (fig. 3),‘ Anomalodesmacea not separated . . . . . 296 0.56 0.74 0.41 Present study (fig. 10, Anomalodesmacea separated . . . . . . . . 326 ( + 10%) 0.51(-9%) 0.68 (-8%) 0.34 (- 17%) Starobogatov (1992) (fig. 1A) . . . . . . . 327 (+ 10%) 0.50 (-11%) 0.68 (-8%) 0.34 (- 17%) Cope (1996) (fig. l&. . . . . . . . . . . . . . 329 (+ll%) 0.50 (-11%) 0.67 (-9%) 0.34 (- 17%) Waller (1977) (fig. 1C). . . . . . . . . . . . . 330(+11%) 0.50 (-11%) 0.67 (-9%) 0.34 (- 17%) Morton (1996) (fig. 10). . . . . . . . . . . . 358 (+21%) 0.46 (- 18%) 0.62 (- 16%) 0.28 (-32%) Salvini-Plawen and Steiner (1996) . . . 35 1 (+ 18%) 0.47 (- 16%) 0.63 (-15%) 0.30 (-27%)
a Minimum length of the tree in MacClade. b Change from the minimum tree in percent. c Consistency index. d Retention index. e Resealed consistency index. f Length and indices are for an unweighted tree identical to the reweighted tree shown in figure 3.
sulate against the effects of particular species. Ideally, nepenninckx, Backeljau, and DeWachter (1996) have one wants complete sequences from many genes and been unable to do so and have concluded that the task many taxa, but, given the limits on time, effort, and may not be possible. A more extensive set of species, expense, we believe that the inclusion of partial se- containing many more basal taxa, is clearly needed. Ad- quences from several different genes will be more in- ditionally, the problem of suitable outgroups must be formative than longer sequences from fewer genes and solved, perhaps, on the evidence of substantial homo- that the inclusion of more species may be more infor- plasy in our data, by examining different, more highly mative still. conserved sequences.
One use for which complete 18s sequences appear to be important is to distinguish among closely related species. Rice and Singh (1993), using complete 18s se- quences, were able to fully resolve groups of closely related species within individual families and genera, taxa which we were unable to resolve using partial se- quences. Based on its resolution of relationships within orders as well as within the most recently radiated sub- class, the Heterodonta, the 5’ region of the 18s gene used in our study appears best suited to resolving inter- mediate relationships among the Bivalvia and should be used to broaden taxonomic coverage by including rep- resentatives of more families rather than more genera or species. That this familial and ordinal level coverage is desirable is made clear by Salvini-Plawen and Steiner (1996), who have called for systematic coverage at all levels of hierarchy to advance phylogenetic knowledge.
Our findings resemble those of Kenchington et al. (1994) in that chitons can be made to appear within the Bivalvia. In our results, their position is interchangeable with that of the gastropods, whichever is designated as the outgroup causing the other to appear within Bival- via. Clearly, the chitons themselves are monophyletic regardless of their position in the phylogeny, but we consider the relationships among the three molluscan classes much more difficult to assess. Distantly related taxa may behave as random outgroups, joining the in- group at the longest branch and making the root position for the tree unreliable (Wheeler 1990). This the gastro- pods appear to do. Until the effects of long-branch at- traction can be excluded, the issue of bivalve polyphyly, and the relationships among the molluscan classes, is unlikely to be resolved using the 18s rDNA gene. Using the largest set of complete 18s sequences to date, Win-
Within Class Bivalvia, our data clearly support the Palaeoheterodonta as the sister group of the Heterodon- ta. Although the BP = 72 value for this node is modest, it should correspond to a probability of 0.95 that the clade is real (Hillis and Bull 1993) and the node was consistently supported throughout our analysis. The Pteriomorphia appear to form a grade rather than a sep- arate clade. Because branch lengths among the Pteriom- orphia are short and BP values are low, except those supporting the monophyly of the scallops, our results are suggestive rather than persuasive. Another surprise in our results is the apparently polyphyletic nature of the heterodont orders Myoida and Veneroida. Mya, Cor- b&z, and Cytropleura, all myoids, and the veneroid clams such as Mercenaria and Corbicula form an inner clade with good bootstrap support (BP = 84). Other taxa referred to Veneroida, such as Divariscintillu and Ensis, as well as the myoid Panopea, all emerge outside this clade. The veneroid superfamily Tellinoidea, represented by Donux and Asaphis, is also outside the clade, al- though this superfamily is regarded as being closely re- lated to the superfamily containing Mercenaria. Only additional work by both morphologists and molecular systematists can resolve these issues. Molecular data for other genes as well as for more taxa are needed to con- firm these findings, but our data do challenge the con- ventional view of relationships within the subclass Het- erodonta.
The inability of 18s sequence data to resolve the monophyly of the subclass Protobranchia is especially surprising, because morphologists are united in regard- ing the Protobranchia to be the sister group of all other Bivalvia. This lack of resolution may be caused by un- equal rates of change in different bivalve lineages, as
Dow
nloaded from https://academ
ic.oup.com/m
be/article/14/6/619/1080893 by guest on 21 Novem
ber 2021
628 Adamkewicz et al.
suggested by widely varying branch lengths in our trees. The uncertainty surrounding the relationship between the protobranchs and the anomalodesmatans is part of our larger inability to distinguish decisively among the various phylogenetic hypotheses put forward by mor- phologists (fig. 1). Our results conform most closely to the hypothesis of Starobogatov (1992), who views the Heterodonta and Palaeoheterodonta as sister groups aris- ing from the Pteriomorpha. However, differences in tree lengths and character indices between our sequence- based results and the other morphology-based hypothe- ses were minor. This absence of large differences is probably a reflection of the relatively short time during which all the molluscan classes and subclasses radiated. Proably not more than 40-80 Myr separated the earliest record of a mollusk in the Cambrian from the latest di- vergence of a class in the Ordovician (Waller 1997), and the short branch lengths at the base of our tree (fig. 3) may reflect this. Philippe, Chenuil, and Adoutte (1994) have already discussed the difficulty of using molecular data to distinguish among phyla that diverged over a relatively short period of time, a difficulty that Winne- penninckx, Backeljau, and DeWachter (1996) has con- firmed using complete 18s sequences. Reweighting characters with the RC reduced this problem, but defin- itive evidence may require new sequences from more slowly evolving genes before a consensus of the evi- dence will tell us what the order of divergence of sub- classes within the Bivalvia actually was.
Acknowledgments
The authors thank the Institute for Genomic Re- search for a New Faculty Research Award to C.J.B. that supported the PCR and sequencing for this project. We also thank Thomas R. Waller for giving unselfishly of his time and expertise to discuss bivalve phylogeny with us and to share his findings. Many individuals helped us to acquire specimens, and their efforts are much ap- preciated. We owe particular thanks to David L. Swof- ford for allowing us to use the beta test version of PAUP 4.0. This is Smithsonian Marine Station at Link Port Contribution Number 424.
LITERATURE CITED
ABBOTT, R. T., and S. l? DANCE. 1986. Compendium of sea- shells. E. l? Dutton, New York, N.Y.
ADAMKEWICZ, S. L., and M. G. HARASEWYCH. 1996. System- atics and biogeography of the genus Donax (Bivalvia: Don- acidae) in eastern North America. Am. Malacol. Bull. 13: 97-103.
BOORE, J. L., T. M. COLLINS, D. STANTON, L. L. DAEHLER, and W. M. BROWN. 1995. Deducing the pattern of arthropod phylogeny from mitochondrial DNA rearrangements. Na- ture 376:163-165.
BOWMAN, B. H. 1989. Non-clocklike evolution in the riboso- ma1 RNAs of bivalve molluscs. Dissertation, University of California at Berkeley.
BULT, C. J., J. BLAKE, M. ADAMS, 0. WHITE, G. SUTTON, R. CLAYTON, A. KERLAVAGE, C. FIELDS, and J. C. VENTNER. 1997. The impact of rapid gene discovery technology on studies of evolution and biodiversity. Pp. 289-299 in E. 0.
WILSON, D. WILSON, and M. REALKA-KUDLA, eds. Biodi- versity II: understanding and protecting our natural re- sources. Joeseph Henry Press, Washington, D.C.
COPE, J. C. W. 1996. The early evolution of the bivalvia. Pp. 361-370 in J. TAYLOR, ed. Origin and evolutionary radia- tion of the Mollusca. Oxford University Press.
DOYLE, J. J., and J. L. DOYLE. 1987. A rapid DNA isolation procedure for small quantities of fresh leaf tissue. Phyto- them. Bull. 19: 11-15.
FARRIS, S. 1969. A successive approximations approach to character weighting. Syst. Zool. l&374-385.
FLEISCHMANN, R. D., M. D. ADAMS, 0. WHITE et al. (40 co-au- thors). 1995. Whole-genome random sequencing and as- sembly of Haemophilus injluenzae Rd. Science 269:49& 512.
HALANYCH, K. M., J. D. BACHELLER, A. M. A. AGUINALDO, S. M. LIVA, D. M. HILLIS, and J. A. LAKE. 1995. Evidence from 18s ribosomal DNA that the lophophorates are pro- tostome animals. Science 267:1641-1642.
HARASEWYCH, M. G., S. L. ADAMKEWICZ, J. A. BLAKE, D. SAUDEK, T. SPRIGGS, and C. J. BULT. 1997. Phylogeny and relationships of pleurotomariid gastropods (Mollusca: Gas- tropoda): an assessment based on partial 18s rDNA and cytochrome c oxidase I sequences. Mol. Mar. Biol. Bio- technol. 6: l-20.
HILLIS, D. M., and J. J. BULL. 1993. An empirical test of boot- strapping as a method for assessing confidence in phylo- genetic analysis. Syst. Biol. 42: 182-192.
HOLLAND, I? W., A. M. HACKER, and N. A. WILLIAMS. 1991. A molecular analysis of the phylogenetic affinities of Sac- coglossus cambrensis Brambell & Cole (Hemichordata). Philos. Trans. R. Sot. Lond. Biol. 332:185-189.
KENCHINGTON, E. L., D. L. RODDICK, R. K. SINGH, and C. J. BIRD. 1994. Analysis of small-subunit rRNA gene sequenc- es from six families of mollusks. J. Mar. Biotechnol. 1:215- 217.
LECOINTRE, G., H. PHILIPPE, H. L. V. LE, and H. LEGUYADER. 1993. Species sampling has a major impact on phylogenetic inference. Mol. Phylogenet. Evol. 2:205-224.
MADDISON, W. l?, and D. R. MADDISON. 1992. MacClade. Ver- sion 3.01. Sinauer, Sunderland, Mass.
MORTON, B. 1996. The evolutionary history of the Bivalvia. Pp. 337-359 in J. TAYLOR, ed. Origin and evolutionary ra- diation of the Mollusca. Oxford University Press.
NEWELL, N. D. 1969. Classification of Bivalvia. Pp. 205-224 in R. C. MOORE, ed. Treatise of invertebrate paleontology, (N) Mollusca, Bivalvia. Vol. 1. Geological Society of America, Inc. and the University of Kansas Press, Law- rence, Kans.
PEARSON, W. R., and D. J. LIPMAN. 1988. Improved tools for biological sequence comparison. Proc. Natl. Acad. Sci. USA 85:2444-2448.
PHILIPPE, H., A. CHENUIL, and A. ADOUTTE. 1994. Can the Cambrian explosion be inferred through molecular phylog- eny? Development 1994(Suppl.): 15-25.
RICE, E. L., and R. K. SINGH. 1993. A comparison of mollus- can (Bivalvia) phylogenies based on paleontological and molecular data. J. Mar. Biol. Biotechnol. 2:137-146.
SALVINI-PLAWEN, L., and G. STEINER. 1996. Synapomorphies and plesiomorphies in higher classification of mollusca. Pp. 29-51 in J. TAYLOR, ed. Origin and evolutionary radiation of the Mollusca. Oxford University Press.
SMITH, S. W., R. OVERBEEK, C. R. WOESE, W. GILBERT, and F? M. GILLEVET. 1994. The genetic data environment: an expandable GUI for multiple sequence analysis. CABIOS 10:671-675.
Dow
nloaded from https://academ
ic.oup.com/m
be/article/14/6/619/1080893 by guest on 21 Novem
ber 2021

Phylogeny of the Bivalves 629
STAROBOGATOV, Y. I. 1992. Morphological basis for phylogeny and classification of Bivalvia. Ruthenica 2: l-25.
SWOFFORD, D. L. 1996. PAUP: phylogenetic analysis using parsimony. Version 4.O.Od49 (beta test version). Laboratory of Molecular Systematics, Smithsonian Institution, Wash- ington, D.C.
VAUGHT, K. C. 1989. A classification of living Mollusca. American Malacologists, Melbourne, Fla.
WALLER, T. R. 1997. Origin of the molluscan class Bivalvia and a phylogeny of major groups. In I? A. JOHNSON and J. HAGGART, eds. The Bivalvia: half a billion years of evo- lution-essays in honor of Norman D. Newell. University of Calgary Press (in press).
WHEELER, W. C. 1990. Nucleic acid sequence phylogeny and random outgroups. Cladistics 6:363-367.
WINNEPENNINCKX, B., T. BACKELJAU, and R. DEWACHTER. 1994. Small ribosomal subunit RNA and the phylogeny of Mollusca. Nautilus 2(Suppl.):98-110.
- 1996. Investigation of molluscan phylogeny on the basis of 18s rRNA sequences. Mol. Biol. Evol. 13:1306- 1317.
MANOLO GOUY, reviewing editor
Accepted February 12, 1997
Dow
nloaded from https://academ
ic.oup.com/m
be/article/14/6/619/1080893 by guest on 21 Novem
ber 2021