A MODEL TO GUIDE DEVELOPMENT OF … model to guide development of environmental final governing...
118
A MODEL TO GUIDE DEVELOPMENT OF ENVIRONMENTAL FINAL GOVERNING STANDARDS FOR OVERSEAS UNITED STATES DEPARTMENT OF DEFENSE INSTALLATIONS Sean R. Marshall, Captain, USAF AFIT-GEM-ENV-14-M-37 DEPARTMENT OF THE AIR FORCE AIR UNIVERSITY AIR FORCE INSTITUTE OF TECHNOLOGY Wright-Patterson Air Force Base, Ohio DISTRIBUTION STATEMENT A. APPROVED FOR PUBLIC RELEASE; DISTRIBUTION UNLIMITED
Transcript of A MODEL TO GUIDE DEVELOPMENT OF … model to guide development of environmental final governing...
A MODEL TO GUIDE DEVELOPMENT OF ENVIRONMENTAL FINAL
GOVERNING STANDARDS FOR OVERSEAS UNITED STATES
DEPARTMENT OF DEFENSE INSTALLATIONS
Sean R. Marshall, Captain, USAF
AFIT-GEM-ENV-14-M-37
DEPARTMENT OF THE AIR FORCE AIR UNIVERSITY
AIR FORCE INSTITUTE OF TECHNOLOGY
Wright-Patterson Air Force Base, Ohio
DISTRIBUTION STATEMENT A.
APPROVED FOR PUBLIC RELEASE; DISTRIBUTION UNLIMITED

The views expressed in this thesis are those of the author and do not reflect the official
policy or position of the United States Air Force, Department of Defense, or the United
States Government. This material is declared a work of the United States Government
and is not subject to copyright protection in the United States.

AFIT-GEM-ENV-14-M-37
A MODEL TO GUIDE DEVELOPMENT OF ENVIRONMENTAL FINAL
GOVERNING STANDARDS FOR OVERSEAS DEPARTMENT OF DEFENSE
INSTALLATIONS
THESIS
Presented to the Faculty
Department of Systems and Engineering Management
Graduate School of Engineering and Management
Air Force Institute of Technology
Air University
Air Education and Training Command
In Partial Fulfillment of the Requirements for the
Degree of Master of Science in Engineering Management
Sean R. Marshall, B.S.E.
Captain, USAF
March 2014
DISTRIBUTION STATEMENT A.
APPROVED FOR PUBLIC RELEASE; DISTRIBUTION UNLIMITED
AFIT-GEM-ENV-14-M-37
A MODEL TO GUIDE DEVELOPMENT OF ENVIRONMENTAL FINAL
GOVERNING STANDARDS FOR OVERSEAS UNITED STATES
DEPARTMENT OF DEFENSE INSTALLATIONS
Sean R. Marshall, B.S.E.
Captain, USAF
Approved:
//signed//____________________________ 27 February 2014
Willie Harper, PhD (Chairman) Date
//signed//____________________________ 27 February 2014
Mark Goltz, PhD (Member) Date
//signed//____________________________ 3 March 2014
Steve Schuldt, Capt, USAF, P.E. (Member) Date
//signed//____________________________ 27 February 2014
Alfred E. Thal Jr., PhD (Member) Date

AFIT-GEM-ENV-14-M-37
iv
Abstract
The Overseas Environmental Baseline Guidance Document (OEBGD) establishes
the baseline environmental standards for United States (U.S.) forces operating overseas
and is the template for the development of Environmental Final Governing Standards
(FGS). FGS are required at any long-term U.S. installation and set the standard of
environmental compliance for U.S. forces in each individual country. The purpose of this
research is to analyze the FGS of different countries and compare their requirements to
the OEBGD requirements. The individual FGS were scored according to if sections were
more stringent, less stringent or the same as the OEBGD. The countries analyzed were
then plotted in a model of environmental performance and governance called the Lester
Model. The Lester Model categorizes the countries according to their environmental
performance and governance scores. While the results did not indicate that a country’s
position in the Lester Model has a strong relationship with the overall strictness of the
FGS, the analysis did identify a number of mistakes in the FGS. The mistakes found
ranged from spelling errors to formatting mistakes to inconsistent references.
AFIT-GEM-ENV-14-M-37
v
To my wonderful girlfriend who helped me through this and my classmates who made my
time at AFIT all the more enjoyable.

vi
Acknowledgments
A big thanks to the environmental offices in EUCOM, CENTCOM, and PACOM
that provided me with the documents I needed in a quick and timely manner. Without
your help, I would not have been able to complete this research.
Sean R. Marshall

vii
Table of Contents
Page
Abstract .............................................................................................................................. iv
Acknowledgments.............................................................................................................. vi
Table of Contents .............................................................................................................. vii
List of Figures .................................................................................................................... ix
List of Tables .......................................................................................................................x
I. Introduction .....................................................................................................................1
Background .....................................................................................................................1
Research Objectives ........................................................................................................3 Methodology ...................................................................................................................3
Assumptions/Limitations ................................................................................................4 Preview ............................................................................................................................4
II. Literature Review ............................................................................................................6
Lester Model ...................................................................................................................6 Environmental Federalism and U.S. military bases ........................................................8
Environmental Performance Index .................................................................................9
World Governance Indicators .......................................................................................15
Summary .......................................................................................................................18
III. Methodology ................................................................................................................19
Lester Model Construction ............................................................................................19 OEBGD and FGS Comparisons ....................................................................................20
Summary .......................................................................................................................26
IV. Analysis and Results ....................................................................................................27
Lester Model .................................................................................................................27 Belgium .........................................................................................................................29
Germany ........................................................................................................................29 Italy ...............................................................................................................................30 Japan ..............................................................................................................................30
Kuwait ...........................................................................................................................31 Netherlands ...................................................................................................................31 Sultanate of Oman .........................................................................................................33
viii
Portugal .........................................................................................................................33
State of Qatar.................................................................................................................34 Kingdom of Saudi Arabia .............................................................................................34 Republic of Korea .........................................................................................................35
Spain ..............................................................................................................................36 Republic of Turkey .......................................................................................................37 United Arab Emirates ....................................................................................................37 United Kingdom ............................................................................................................38 Air Emissions Chapter Comparisons ............................................................................38
Drinking Water Chapter Comparisons ..........................................................................39 Wastewater Chapter Comparisons ................................................................................41 Hazardous Materials Chapter Comparisons ..................................................................43 Hazardous Waste Chapter Comparisons .......................................................................45
Solid Waste Chapter Comparisons................................................................................47 Petroleum, Oil, and Lubricants Chapter Comparisons .................................................48
Analysis .........................................................................................................................50 Summary .......................................................................................................................53
V. Conclusions and Recommendations ............................................................................54
Chapter Overview .........................................................................................................54 Review of Findings .......................................................................................................54
Significance of Research ...............................................................................................55 Recommendations for Future Research ........................................................................58
Summary .......................................................................................................................58
Appendix A – OEBGD and FGS Comparisons .................................................................59
Bibliography ....................................................................................................................103

ix
List of Figures
Page
Figure 1. Lester Model plot for countries in this analysis ................................................ 28
Figure 2. FGS Scores by Country ..................................................................................... 50
Figure 3. Correlation plot between EPI and FGS Scores.................................................. 51
Figure 4. Correlation plot between WGI and FGS Scores................................................ 52

x
List of Tables
Page
Table 1. Lester Model states by category ........................................................................... 7
Table 2. List of EPI indicators and weights ...................................................................... 14
Table 3. Breakdown of Lester Model Construction.......................................................... 20
Table 4. Breakdown of OEBGD section comparisons ..................................................... 21
Table 5. Lester Model ....................................................................................................... 27
Table 6. Air Emissions chapter comparisons .................................................................... 39
Table 7. Drinking Water chapter comparisons ................................................................. 41
Table 8. Wastewater chapter comparisons ........................................................................ 43
Table 9. Hazardous Materials chapter comparisons ......................................................... 44
Table 10. Hazardous Waste chapter comparisons ............................................................ 46
Table 11. Solid Waste chapter comparisons ..................................................................... 48
Table 12. Petroleum, Oil, and Lubricants chapter comparisons ....................................... 49
Table 13. Table of Asia-Pacific Countries without existing FGS .................................... 57
1
A MODEL TO GUIDE DEVELOPMENT OF ENVIRONMENTAL FINAL GOVERNING
STANDARDS FOR OVERSEAS UNITED STATES DEPARTMENT OF DEFENSE
INSTALLATIONS
I. Introduction
When establishing long-term overseas installations, the Department of Defense (DoD)
must establish Environmental Final Governing Standards (FGS) with the host nation that sets the
standard for environmental compliance that the United States (U.S.) must follow. The document
that sets the minimum standard for environmental compliance for U.S. military forces overseas is
the Overseas Environmental Baseline Guidance Document (OEBGD), DoD Instruction 4715.05-
G. The OEBGD’s purpose is to provide criteria and management procedures for developing
country-specific FGS and to establish standards for U.S. forces in countries for which a FGS
does not exist (Office of the Under Secretary of Defense for Acquisition, Technology, and
Logistics, 2007). The OEBGD is supposed to establish the minimum requirements for
environmental compliance at overseas installations. Environmental Executive Agents (EEA) are
the parties who have been delegated the responsibility to enforce and establish FGS for each
individual country.
Background
In an address to the Australian Parliament, President Barack Obama (2011) announced
that the U.S. would be refocusing on the Asia Pacific region of the world. With the war effort in
Afghanistan and Iraq decreasing, the U.S. would be shifting its attention to the countries along
the Pacific Ocean. This shift to the Asia Pacific region means that there will be an increased
U.S. military presence in the region. In a 2012 speech at the Shangri-La Security Dialogue,
former Secretary of Defense Leon Panetta (2012) further emphasized that the U.S. focus on the

2
Asia Pacific region. He also spoke of expanding alliances and increasing military cooperation
with other nations along the Pacific Ocean. This expanding involvement of U.S. military forces
in the Asia Pacific region means that U.S. forces will also need new locations to operate from. If
the U.S. military establishes new footprints in countries with which there are no current
installations, the U.S. will need to draft new FGS.
A previously unpublished research paper studied the differences between the FGS for
Japan, Republic of Korea, and Germany and how each FGS differed from each other and the
OEBGD (Baker, Murley, & Pickenpaugh, 2012). The authors believed that the differences in
FGS must be tied to each government’s economic and environmental policies and used the
Environmental Performance Index, a composite index of environmental data, to try and describe
why each country scored as they did. They concluded that countries with stronger environmental
policies would have more stringent FGS and that U.S. forces overseas would be required to
follow increased environmental requirements (Baker et al, 2012).
This research effort is to further expand on Baker, Murley, and Pickenpaugh’s (Baker et
al, 2012) results by studying more of the environmental agreements that the U.S. has with other
countries by comparing more FGS to the OEBGD. In addition to comparing the FGS, the
countries will be categorized using an adaption of a model of state environmental commitment
and institutional capability developed by Lester (Lester, 1994). To adapt Lester’s model to
countries, the Environmental Performance Index was used to represent a country’s
environmental commitment and performance and the World Governance Indicators were used to
represent a country’s institutional capability.
3
Research Objectives
The objective of this research is to discover if a country’s position in the Lester Model is
indicative of how strict the FGS is or would be for countries that do not have a FGS. Reviewing
the FGS will also determine if there are any FGS that have less stringent requirements than the
OEBGD, as the OEBGD should be the minimum standard for all criteria. An analysis of the
different FGS may also highlight any areas of concern that environmental policy makers should
be aware of.
Methodology
Following the research of Baker, Murley, and Pickenpaugh, seven chapters of the
OEBGD were used to analyze the different FGS. Those selected chapters were Chapter 2 – Air
Emissions, Chapter 3 – Drinking Water, Chapter 4 – Wastewater, Chapter 5 – Hazardous
Materials, Chapter 6 – Hazardous Waste, Chapter 7 – Solid Waste, and Chapter 9 – Petroleum,
Oil, and Lubricants. To compare the OEBGD and the different FGS, the OEBGD was divided
into subject areas according to the subchapter headings. The FGS were then scored according to
whether the requirements in each subject area were more stringent, had the same, or less
stringent than the OEBGD. The countries were then categorized by the Lester Model using the
Environmental Performance Index (EPI) and the World Governance Indicators (WGI) as
measures for environmental performance and institutional capacity, respectively. A
methodology was developed to score the FGS relative to the OEBGD, and an analysis conducted
to determine if the FGS score was correlated to the Lester Model category. The scores of the
FGS were compared within these categories to determine if the countries in each category scored
similarly.

4
Assumptions/Limitations
This analysis was based upon several limitations and assumptions that allowed for the
construction of the Lester Model and the analysis of the Final Governing Standards. The
OEBGD is over 5 years old and was last updated in 2007. This could mean that its standards and
procedures are out of date. The different FGS are not all from the same year but this research
uses the 2012 EPI and WGI data to determine placement in the Lester Model. While the WGI is
updated every year, the EPI is only updated every couple of years with 2012 being the most
recent update. It was then assumed that the differences between the countries’ most current
environmental and governance scores would be similar enough to the years that the FGS were
written to compare them to the Lester Model. Spain and Turkey’s FGS are over 5 years old and
the only FGS that have not been updated since 2010. While this is not a problem comparing
them to the 2007 OEBGD, it may cause errors when using the 2012 EPI and WGI data.
It was decided to use the WGI and EPI to build the Lester Model because they are
publicly available and regularly updated, peer-reviewed databases that measure governance and
environmental performance. To construct the Lester Model, it was assumed that the EPI and
WGI were good measures of a country’s environmental commitment and institutional capacity,
respectively. Because the Lester Model construct uses point estimates to categorize the
countries, it ignored the standard errors in the EPI and WGI. The EPI also does not have
sufficient data to gives scores to all countries, including some countries with which the U.S. has
an FGS.
Preview
The remainder of this thesis is divided into four chapters. Chapter 2 contains a literature
review of the tools used in this research. Chapter 3 discusses the methodology used in this

5
research. Chapter 4 will review the findings of this research for each country and then for each
chapter of the OEBGD. Chapter 5 will discuss the outcome of this research and any future
research opportunities.
6
II. Literature Review
This chapter provides an overview of applicable literature related to this research and is
divided into three sections. This first section describes the original Lester Model. The second
chapter describes how the Lester Model was applied to the environmental compliance
requirements of United States (U.S.) military installations in the continental U.S. The next
section describes the Environmental Performance Index and its construction. It also highlights
the limitations and criticisms of the Environmental Performance Index. The last section
describes the World Governance Indicators and its construction, as well as its major criticisms.
Lester Model
The 1970s and 1980s saw a gradual decline in the power of the federal government and a
push to strengthen the power of the states during the presidencies of Nixon, Reagan, and Bush
(Lester, 1994). While the federal government had traditionally been the driving force and
funding source behind environmental laws and enforcement, the federalist policies of the 1970s
and 1980s gave much of that power back to the states. There were many in government and
academia that argued that states were more effective at implementing and enforcing
environmental policies because of their proximity to the problem (Lester, 1994). In response to
the federal cuts to environmental regulation, the states would have to figure out their own way to
enforce and fund environmental regulation. The federal government sets minimum levels of
regulations and it is up to the states to decide if the minimum is sufficient or if further regulation
is required.
According to Lester (1994), a state’s response to the decentralization of federal
environmental programs is a function of that state government’s institutional capacity and the

7
state’s commitment to environmental protection. Lester’s model (1994) for the categorization of
American states by their commitment to good environmental policies and the institutional
capabilities of their individual state governments is hereafter referred to as the Lester Model.
The Lester Model groups states into four categories: Progressives, Strugglers, Delayers, and
Regressives. The Progressives category represents states that have strong institutional
capabilities and a strong commitment to environmental protection. The Strugglers category
represents states with weak institutional capabilities and a strong commitment to environmental
protection. The Delayers category represents states with strong institutional capabilities and a
low commitment to environmental protection. The Regressives category represents states with
weak institutional capabilities and a low commitment to environmental protection. Table 1
shows the breakdown of the 50 states into the four categories of the Lester Model. To build his
model, Lester used a state environmental performance model called the Green Index and a model
of state government capability designed by Bowman and Kearney (1998) of the University of
South Carolina.
Table 1. Lester Model states by category
Progressives Strugglers Delayers Regressives
California
Florida
Maryland
Massachusetts
Michigan
New Jersey
New York
Oregon
Washington
Wisconsin
Colorado
Connecticut
Delaware
Hawaii
Idaho
Iowa
Maine
Minnesota
Montana
Nevada
New Hampshire
North Carolina
North Dakota
Rhode Island
Vermont
Alabama
Alaska
Arkansas
Georgia
Illinois
Louisiana
Missouri
Ohio
Oklahoma
Pennsylvania
South Carolina
Tennessee
Texas
Virginia
West Virginia
Arizona
Indiana
Kansas
Kentucky
Mississippi
Nebraska
New Mexico
South Dakota
Utah
Wyoming
8
Environmental Federalism and U.S. military bases
In response to the Lester Model, Smith (1997) surveyed environmental offices at military
installations in a state in each of the four categories. His objective was to determine if the
experiences of the environmental compliance personnel assigned to these installations matched
the expected environmental requirements and enforcement from the Lester Model categories.
The states and installations Smith (1997) focused on were California (Travis Air Force Base),
Colorado (Fort Carson and Air Force Academy), Oklahoma (Fort Sill and Altus Air Force Base),
and Wyoming (F.E. Warren Air Force Base. Overall, he concluded that the installations’
experiences with the state environmental requirements were consistent with the Lester Model
classifications.
In California, the military environmental offices saw increased regulatory and
enforcement action, as one might expect from a state within the Progressives category. The local
environmental agencies added additional requirements to the baseline federal standards and were
fairly stringent in their enforcement of said policies (Smith, 1997). In several instances,
California’s enforcement agencies tried to enforce policies on the installation for which they had
no authority and had to be overridden by the federal government (Smith, 1997). In Colorado,
both Fort Carson and the Air Force Academy experienced environmental regulation as expected
from the Strugglers category. The state of Colorado was forced to divert resources to air quality
because the cities of Denver and Colorado Springs were in air quality nonattainment areas and
thus did not have the proper personnel to adequately manage its entire environmental compliance
program. The military environmental offices in Colorado claimed that the state would try to
develop and enforce blanket stringent standards and group the installations with other heavily
polluted sites in the state because it lacked the capacity to adequately manage its hazardous
9
waste program (Smith, 1997). The environmental offices at F.E. Warren, which has some sites
in Colorado, also claimed that the enforcement in Colorado was much tougher than enforcement
in the state of Wyoming.
In Oklahoma, Fort Sill and Altus Air Force Base experienced environmental regulation as
was to be expected from a state in the Delayers category. The two installations have very good
relationships with the state environmental agencies and characterized them as “active and able”
(Smith, 1997). The state environmental offices were willing and able to enforce the minimum
federal regulations but did not advocate anything beyond that (Smith, 1997). In Wyoming, the
F.E. Warren Air Force Base environmental office experienced relatively minimum
environmental enforcement as expected from a state in the Regressive category. The state
enforced federal standards but with no perceived stringency, with the exception of groundwater.
The state also sought input from the installation when drafting enforcement standards. As
mentioned above, the environmental office at F.E. Warren claimed that enforcement at sites in
Colorado was much more stringent than any enforcement in Wyoming (Smith, 1997).
Environmental Performance Index
In the early 2000s, the United Nations (UN) convened a gathering of world leaders in an
event called the Millennium Summit to discuss the role of the UN in the next century (United
Nations, 2000). Part of the UN declaration was for countries to make every effort to adopt
sustainable development practices and protect the environment. Unfortunately, there were no
metrics to measure how countries were meeting goals in comparison to other countries around
the world. In reponse to the need for quantitative measurements of environmental performance,
the Yale Center for Environmental Law and Policy (YCELP) and the Center for Earth
Information Science Information Network (CIESIN) at Columbia University developed the

10
Environmental Sustainability Index (ESI) in 2000 in conjunction with the World Economic
Forum (WEF) and the Joint Research Centre, European Commission (Emerson et al., 2012; Etsy,
Levy, Srebotnjak, & de Sherbinin, 2005). The object of the ESI was to “provide science-based
quantitative metrics as an aid to achieving long-term sustainable development goals” (Emerson
et al., 2012) and was designed to counter the use of GDP as a measure to compare countries.
The creators of the ESI sought to create a measuring system with a broader, more policy-oriented
emphasis that attempts to capture everything from natural resource endowments to pollution
rates to institutional mechanisms for change (Etsy et al, 2005)
The last iteration of the ESI in 2005 used 76 individual data sets to develop 21 indicators
of environmental sustainability to score countries in five categories: environmental systems,
reducing environmental stresses, reducing human vulnerability to environmental stresses,
societal and institutional capacity to respond to environmental challenges, and global
stewardship (Etsy et al, 2005). The indicators were chosen after a review of the available science
and literature as well as through discussions with experts in the fields of environmental science,
govenmental policy, and business. These indicators were intended to be applicable across
varying political and societial boundaries and to be easily quantifible and scale-neutral, but lack
of adequate data and incomplete sources of information resulted in data gaps and limitations
(Etsy, Levy, Srebotnjak, & de Sherbinin, 2005). Even though the authors endeavoredto do their
best to use only the best quality data in the ESI, they acknowledged that the ESI is not perfect but
an iterative tool that “helps to identify the leaders and laggards with regard to a broad range of
environmental issues” (Etsy et al, 2005).
As the first major attempt at a comprehensive environmental ranking of countries, the
ESI received criticism from the scientific community for trying to simplify the complex nature of

11
environmental science. Criticisms have ranged from simple disagreements with parts of the
methodology (Jha & Murthy, 2003) to accusing the ESI of using misleading data to make “dirty
nations look clean” (Keeping Score, 2001). The ESI has been accused of making top member
countries of the WEF look cleaner and more sustainable through data manipulation and improper
indicator weighting (Keeping Score, 2001; Morse & Fraser, 2005). A large number of the ESI
indicators are normalized by using population, GDP, or per capita, which gives richer and more
populated nations an advantage over smaller nations that may pollute less but also have
significantly smaller populations and economies. The Social and Institutional Capacity and the
Global Stewardship components favor rich and powerful nations because the ESI assumes that
the capacity to protect the environment is the same as actually doing things to protect the
environment (Keeping Score, 2001). These two components have variables that are unfairly
slanted towards countries with larger economies and infrastructure that participate in
multinational agreements.
In 2006, the ESI was renamed the Environmental Performance Index (EPI) and focused
“on a narrower set of environmental issues for which governments can be held accountable”
(Emerson et al., 2012). The 2012 EPI is the latest iteration of the EPI series and includes a Pilot
Trend EPI which tracks and ranks countries according to their EPI and ESI scores over the last
decade. The creators of the EPI acknowledge that there are still problems with the data
collection due to the nature of some of the indicators and that individual indicators may favor
certain countries over others; however, they believe that the close correlation with GDP lends
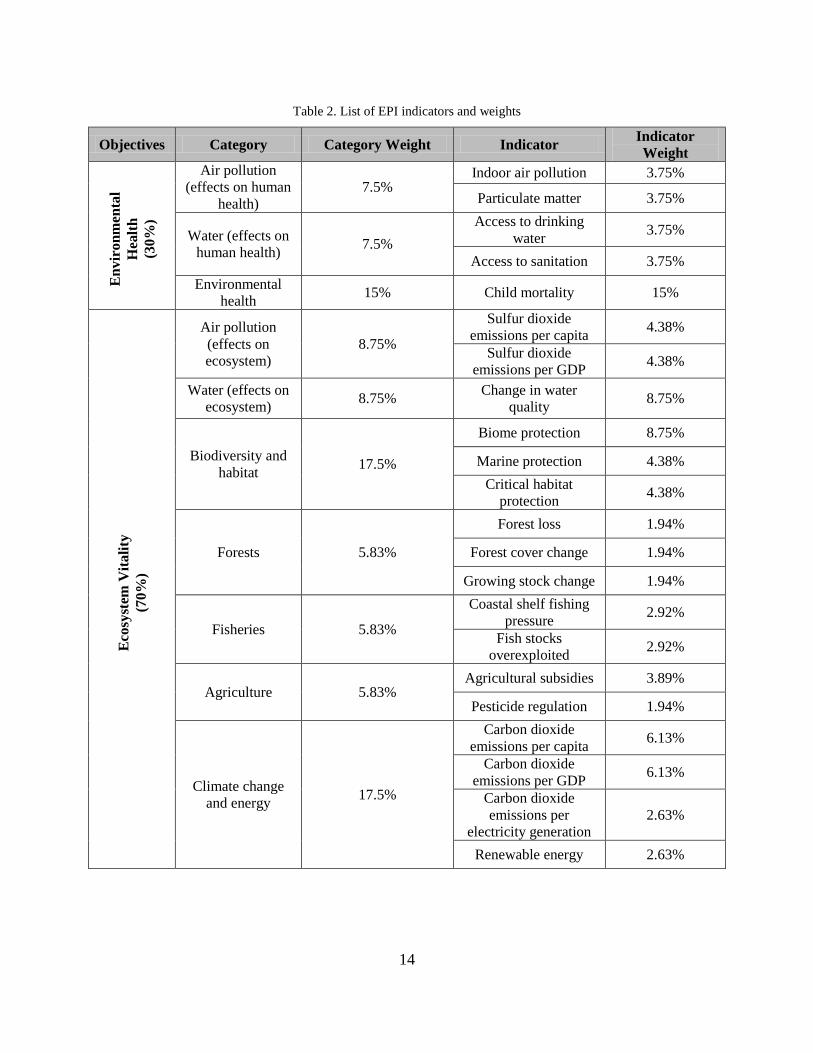
support to the validity of the EPI (Emerson et al., 2012). The 2012 EPI uses 22 indicators of
environmental performance, listed in Table 2, separated into ten categories that must meet the
criteria of relevance, performance orientation, established scientific methodology, data quality,
12
time series availability, and completeness (Emerson et al., 2012). The range for each indicator is
calculated as the difference between the target score and the score of the worst performer.
Targets are calculated from a number of sources including treaties, international standards,
national regulatory requirements, expert judgment, and time series analysis (Emerson et al.,
2012). The score for each country is then calculated by using the difference between the range
and that country’s distance from the target (e.g., range is 100% - 5% = 95% access to sanitation
and country’s access to sanitation is 65% so the difference is 95 – 65 = 35) and then normalizing
it against the range of the indicator for a proximity-to-target score (Emerson et al., 2012).
Many of the criticisms of the ESI also hold true for the EPI. While the EPI has a
different purpose and less variables, the overall structure of the EPI is very similar to the ESI.
The respective 30% and 70% weightings for the Environmental Health (EH) and Environmental
Vitality (EV) categories is to compensate for the fact that the EH category has a much higher
correlation with the overall EPI scores then the EV category (Emerson et al., 2012). The authors
of the EPI claim to use this arbitrary 30/70 ratio to prevent countries with high EH scores but low
EV scores from having high EPI scores. The 30/70 ratio essentially forces the EV objective to
play a higher part in the EPI scoring. The individual indicators were given weights based upon
expert judgments or data quality rather than how much the indicators actually contributed to the
overall score (Emerson et al., 2012). The EPI report makes no mention of standard errors in the
final overall EPI score and assumes no deviation in the final score.
The EPI has been used in literature as a proxy for measuring the environmental
performance of countries. The following examples are recent uses of the EPI in research.
Bernauer and Boehmelt (2013) believe that societies have more economic freedoms and stronger
welfare systems also have stronger environmental policies and therefore, better environmental
13
performance. They used the EPI as one of the variables in their model to determine if these
“kinder” societies had better environmental performance. In their research, they tested their
variables against the components of the EPI to see where social policy had the more significant
effects on the EPI components. The results implied that these societies with stronger social
policies had positive effects on the EH component of the EPI, but a weaker effect on EV.
Hershfield, Bang, and Weber (2013) used the EPI to measure if the age of a country was
correlated with the environmental performance of that country. The authors defined the age of a
country as the point at which the existing form of government began or since gaining
independence. Their results indicated that the country age accounted for approximately 6% of
the variation in the country’s environmental performance. Vachon (2012) used the EPI to test
whether countries that had higher technological and innovation capacity also had better
environmental performance scores. Vachon’s hypothesis was that countries with higher
technological capacity had corporations that were adopting new technologies that were more
eco-efficient and that would have a positive effect on the country’s environmental performance.
Vachon concluded that there technological capacity is positively linked to environmental
performance, but as corporations get more efficient at production they also tend to produce more,
so technological capacity was negatively linked to carbon footprint.
14
Table 2. List of EPI indicators and weights
Objectives Category Category Weight Indicator Indicator
Weight
En
vir
on
men
tal
Hea
lth
(30
%)
Air pollution
(effects on human
health)
7.5% Indoor air pollution 3.75%
Particulate matter 3.75%
Water (effects on
human health) 7.5%
Access to drinking
water 3.75%
Access to sanitation 3.75%
Environmental
health 15% Child mortality 15%
Eco
syst
em V
itali
ty
(70%
)
Air pollution
(effects on
ecosystem)
8.75%
Sulfur dioxide
emissions per capita 4.38%
Sulfur dioxide
emissions per GDP 4.38%
Water (effects on
ecosystem) 8.75%
Change in water
quality 8.75%
Biodiversity and
habitat 17.5%
Biome protection 8.75%
Marine protection 4.38%
Critical habitat
protection 4.38%
Forests 5.83%
Forest loss 1.94%
Forest cover change 1.94%
Growing stock change 1.94%
Fisheries 5.83%
Coastal shelf fishing
pressure 2.92%
Fish stocks
overexploited 2.92%
Agriculture 5.83% Agricultural subsidies 3.89%
Pesticide regulation 1.94%
Climate change
and energy 17.5%
Carbon dioxide
emissions per capita 6.13%
Carbon dioxide
emissions per GDP 6.13%
Carbon dioxide
emissions per
electricity generation
2.63%
Renewable energy 2.63%

15
World Governance Indicators
Similar to the ESI, the World Governance Indicators (WGI) project was created to put
numerical values to subjective data and create a metric to measure something that is difficult to
define, much less measure. Instead of environmental performance or sustainability, the WGI is
an attempt to “score” nations around the world according to different aspects of governance. The
WGI is a research project of The World Bank’s Macroeconomics and Growth Team that rates
governments across six broad dimensions of governance (Kaufmann, Kraay, & Mastruzzi, 2010):
1. Voice and Accountability – perceptions of the extent to which a country’s citizens are
able to participate in selecting their government, as well as freedom of expression,
freedom of association, and a free media.
2. Political Stability and Absence of Violence/Terrorism – perceptions of the likelihood
that the government will be destabilized or overthrown by unconstitutional or violent
means, including politically-motivated violence and terrorism.
3. Government Effectiveness – perceptions of the quality of public services, the quality of
the civil service and the degree of its independence from political pressures, the quality of
policy formulation and implementation, and the credibility of the government’s
commitment to such policies.
4. Regulatory Quality – perceptions of the ability of the government to formulate and
implement sound policies and regulations that permit and promotes private sector
development.
5. Rule of Law – perceptions of the extent to which agents have confidence in and abide by
the rules of society, and in particular the quality of contract enforcement, property rights,
the police, and the courts, as well as the likelihood of crime and violence.
6. Control of Corruption – perceptions of the extent to which public power is exercised for
private gain, including both petty and grand forms of corruption, as well as “capture” of
the state by elites and private interests.
The 31 data sources used to score countries include surveys and subjective assessments from a
variety of sources including commercial entities, non-governmental organizations (NGOs), and
other organizations that capture perceptions of the six dimensions of governance (Kaufmann,
Kraay, & Mastruzzi, 2010). The survey and assessments are compiled for each country for each
16
dimension of governance and scored. The different data sources are then combined using a
statistical tool called the unobserved components model (UCM) (Kaufmann, Kraay, &
Mastruzzi, 2010). Each country’s score in the six categories is then normalized between -2.5 and
2.5, with larger numbers representing a better score. For each dimension of governance, the
WGI gives each country a percentile rank based upon that dimension’s score. Unlike the EPI,
the WGI includes the standard error in the point estimate and the 90% confidence upper and
lower bounds for each ranking.
A major criticism of the WGI is that they do not actually measure how well a country’s
government performs but rather the perception of how well the government performs in each
dimension (Thomas, 2010). The WGI authors acknowledge this is a problem, but their counter
argument is that the respondents are often experts in the specific governments they monitor and
many of them have first-hand experience in dealing with the governments (Kaufmann, Kraay, &
Mastruzzi, 2010). The data sources used to construct the WGI all use their own methodology
and are organizations with differing objectives and biases. To combat the problems with using
multiple unstandardized data sources, the WGI uses margins of error in their measurements to
help compensate for the fact that the data they are using are “imperfect proxies” to measure
something that is inherently difficult to measure (Kaufmann, Kraay, & Mastruzzi, 2010). A
problem with using perceptions to measure governance is that many of the data sources may
have incorrect perceptions and biases as to what constitutes good governance (Langbein &
Knack, 2010), but the WGI authors claim there when the results and demographics of the data
sources are studied there is no statistical significance to the claim of biases (Kaufmann, Kraay, &
Mastruzzi, 2010).
17
Another criticism of the WGI is that the six dimensions of governance do not accurately
represent what they intend to represent. According to Thomas (2010), the clustering of the
variables is not based on research and evidence but assumptions and biases of the WGI authors.
Thomas (2010) also claims that because of the way the WGI is constructed, it lacks construct
validity. The six dimensions of governance are supposed to represent six discreet aspects of a
country’s governance but in reality they may be multiple observations of a single underlying
concept. Langbein and Knack (2010) tested the six dimensions of the WGI using exploratory
factor analysis, path analysis, and confirmatory factor analysis to test this theory. Their analysis
showed that instead of six distinct factors, there was a single dominant factor. They concluded
that the six dimensions were actually measuring the same underlying concept of governance.
The following are some examples of the WGI use as a proxy for the governance of
countries. Hershfield et al (2013) also used the WGI as a control variable in their research that
was described in the previous section. They averaged the composite scores of the WGI to create
a composite score because of the collinearity between the six dimensions. Lio and Liu (2008)
used the WGI to develop a model to determine if there was a link between agricultural
productivity and the governance of a country. To aggregate the six dimensions of the WGI into a
single variable, they originally used a principal components analysis to determine the weighting
of the six dimensions but found that it gave them a very similar result as giving each component
an equal weighting. The results from their model showed that countries with better governance
yielded better agricultural production if all other factors were equal. The WGI has also been
used in the literature when comparing countries on a limited basis to explain differences between
geographical neighbors (Kwon, 2013; Ragasa et al, 2013)
18
Summary
This chapter reviewed the development of the Lester Model and its application to the
U.S. military. It also covered the construction and issues pertaining to the EPI and the WGI. As
mentioned in the previous sections, both the EPI and the WGI have their limitations but can be
useful when comparing countries across difficult subjects such as environmental performance
and governance. The original construction of the Lester Model is not applicable outside of the
U.S. so a new Lester Model is required in order to compare and categorize foreign countries.
19
III. Methodology
This chapter discusses the methods used to complete this research. The first section
contains information on creating the Lester Model from the raw WGI and EPI data and building
the four categories. The following section then describes the methodology used to compare and
score the FGS. The comparisons are based upon the baseline requirements and subject areas of
the OEBGD.
Lester Model Construction
To get a singular score of governance for each country, the mean of the six WGI scores
were used in the initial model construction. This gave equal weight to each of the indicators as
fundamental factors of governance. Principal Components Analysis was not used to determine
variable weights in my model as the model assumes that all the factors are equally important and
as discussed in the previous chapter, may all measure the same concept of governance. As with
the previous studies mention in Chapter 2, this research will use the equal-weighting, or average,
of the six dimensions of the WGI. This model ignores the standard errors associated with each
individual country score and instead only uses the point estimate for the analysis and model
construction.
To ensure that all the data was on the same scale and easily compared, the raw numbers
from the EPI and WGI were normalized by scaling from 0 to 1 using the following equation:
minmax
min
XX
XXX i
Equation
1
(1)
Where:
Xi = raw data value for country i

20
Xmin = raw minimum value of data set
Xmax = raw maximum value of data set
The four quadrants of the Lester Model were created using the normalized EPI and WGI
scores. The WGI values were placed on the x-axis and EPI values were placed on the y-axis.
Table 3 shows the division points for each of the quadrants.
Table 3. Breakdown of Lester Model Construction
Category EPI and WGI break points
Progressive 1 >= WGI > 0.5 and 1 >= EPI > 0.5
Strugglers 0 <= WGI <= 0.5 and 1 >= EPI > 0.5
Delayers 1 >= WGI > 0.5 and 0 <= EPI <= 0.5
Regressives 0 <=WGI <= 0.5 and 0 <= EPI <= 0.5
OEBGD and FGS Comparisons
There are two U.S. Government websites that maintain copies of the FGS, the DoD
Environment, Safety and Occupational Health Network and Information Exchange (DENIX) and
FedCenter.gov website. Both websites are controlled U.S. Government websites and require a
need to access or a Common Access Card (CAC) to view and download the files. In the event
that the data either website is incorrect or missing, the DoD overseas environmental offices
responsible for compliance should have the most updated information and copies of the FGS.
The basic design of the FGS mirrors very closely, the layout of the OEBGD. While the
FGS should have country-specific information and requirements, they all follow the same format
and design of the OEBGD. Only the Spain FGS (discussed further in Chapter 4) has a slightly
different chapter arrangement but the data is still comparable to the OEBGD. Error! Reference
21
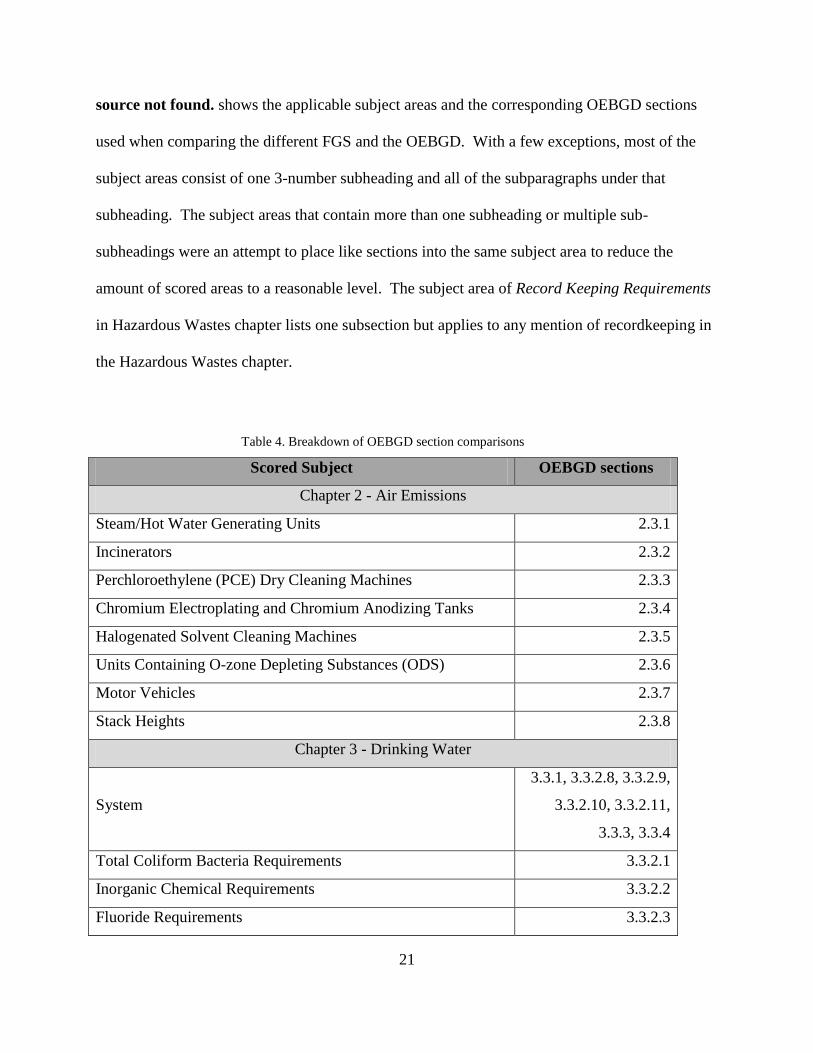
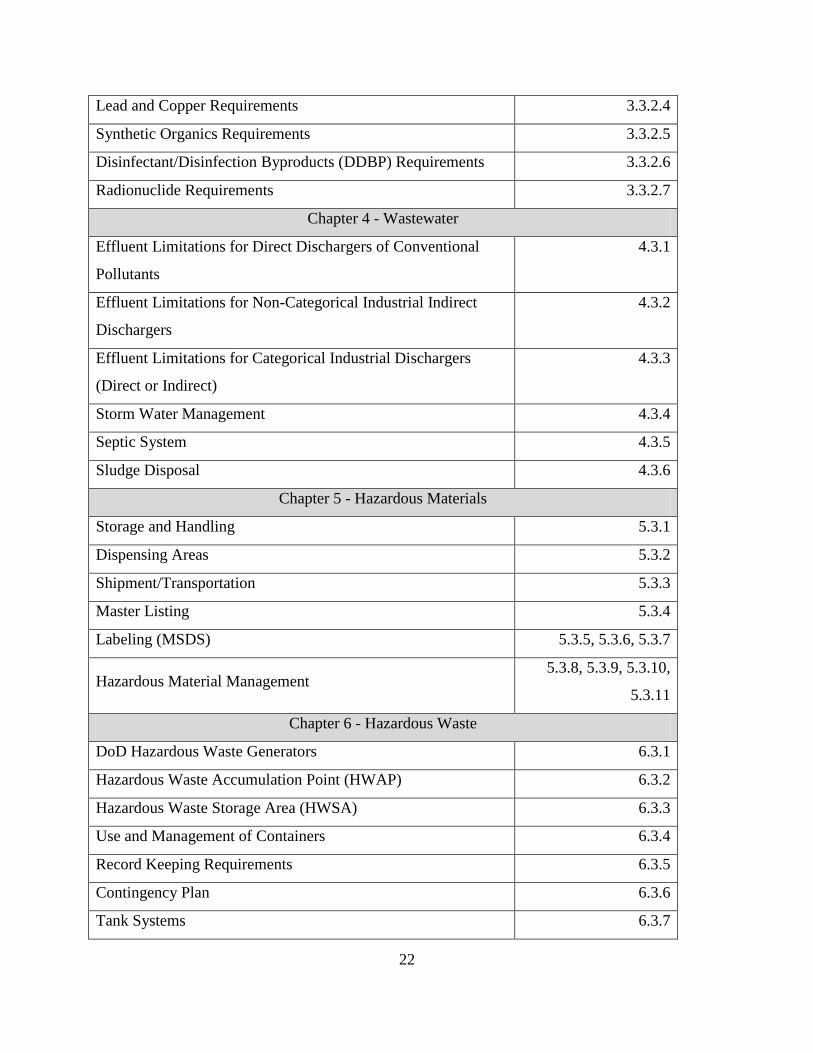
source not found. shows the applicable subject areas and the corresponding OEBGD sections
used when comparing the different FGS and the OEBGD. With a few exceptions, most of the
subject areas consist of one 3-number subheading and all of the subparagraphs under that
subheading. The subject areas that contain more than one subheading or multiple sub-
subheadings were an attempt to place like sections into the same subject area to reduce the
amount of scored areas to a reasonable level. The subject area of Record Keeping Requirements
in Hazardous Wastes chapter lists one subsection but applies to any mention of recordkeeping in
the Hazardous Wastes chapter.
Table 4. Breakdown of OEBGD section comparisons
Scored Subject OEBGD sections
Chapter 2 - Air Emissions
Steam/Hot Water Generating Units 2.3.1
Incinerators 2.3.2
Perchloroethylene (PCE) Dry Cleaning Machines 2.3.3
Chromium Electroplating and Chromium Anodizing Tanks 2.3.4
Halogenated Solvent Cleaning Machines 2.3.5
Units Containing O-zone Depleting Substances (ODS) 2.3.6
Motor Vehicles 2.3.7
Stack Heights 2.3.8
Chapter 3 - Drinking Water
System
3.3.1, 3.3.2.8, 3.3.2.9,
3.3.2.10, 3.3.2.11,
3.3.3, 3.3.4
Total Coliform Bacteria Requirements 3.3.2.1
Inorganic Chemical Requirements 3.3.2.2
Fluoride Requirements 3.3.2.3
22
Lead and Copper Requirements 3.3.2.4
Synthetic Organics Requirements 3.3.2.5
Disinfectant/Disinfection Byproducts (DDBP) Requirements 3.3.2.6
Radionuclide Requirements 3.3.2.7
Chapter 4 - Wastewater
Effluent Limitations for Direct Dischargers of Conventional
Pollutants
4.3.1
Effluent Limitations for Non-Categorical Industrial Indirect
Dischargers
4.3.2
Effluent Limitations for Categorical Industrial Dischargers
(Direct or Indirect)
4.3.3
Storm Water Management 4.3.4
Septic System 4.3.5
Sludge Disposal 4.3.6
Chapter 5 - Hazardous Materials
Storage and Handling 5.3.1
Dispensing Areas 5.3.2
Shipment/Transportation 5.3.3
Master Listing 5.3.4
Labeling (MSDS) 5.3.5, 5.3.6, 5.3.7
Hazardous Material Management 5.3.8, 5.3.9, 5.3.10,
5.3.11
Chapter 6 - Hazardous Waste
DoD Hazardous Waste Generators 6.3.1
Hazardous Waste Accumulation Point (HWAP) 6.3.2
Hazardous Waste Storage Area (HWSA) 6.3.3
Use and Management of Containers 6.3.4
Record Keeping Requirements 6.3.5
Contingency Plan 6.3.6
Tank Systems 6.3.7
23
Standards for the Management of Used Oil and Lead-Acid
Batteries
6.3.8
Hazardous Waste Training 6.3.9
Hazardous Waste Disposal 6.3.10
Chapter 7 - Solid Waste
Solid Waste Management Plan
7.3.1, 7.3.2, 7.3.3,
7.3.4, 7.3.5, 7.3.6,
7.3.7, 7.3.8, 7.3.9
New Municipal Solid Waste Landfills 7.3.10, 7.3.11
Municipal Solid Waste Landfill Operation 7.3.12
Open Burning 7.3.13
Composting Operations 7.3.14
Composting Usage 7.3.15
Chapter 9 - Petroleum, Oil, and Lubricants
General POL Storage Container Criteria 9.3.2
Additional POL Storage Container Criteria 9.3.3
Storage Container Wastes 9.3.4
General Transport and Distribution Criteria 9.3.5
Personnel Training 9.3.6
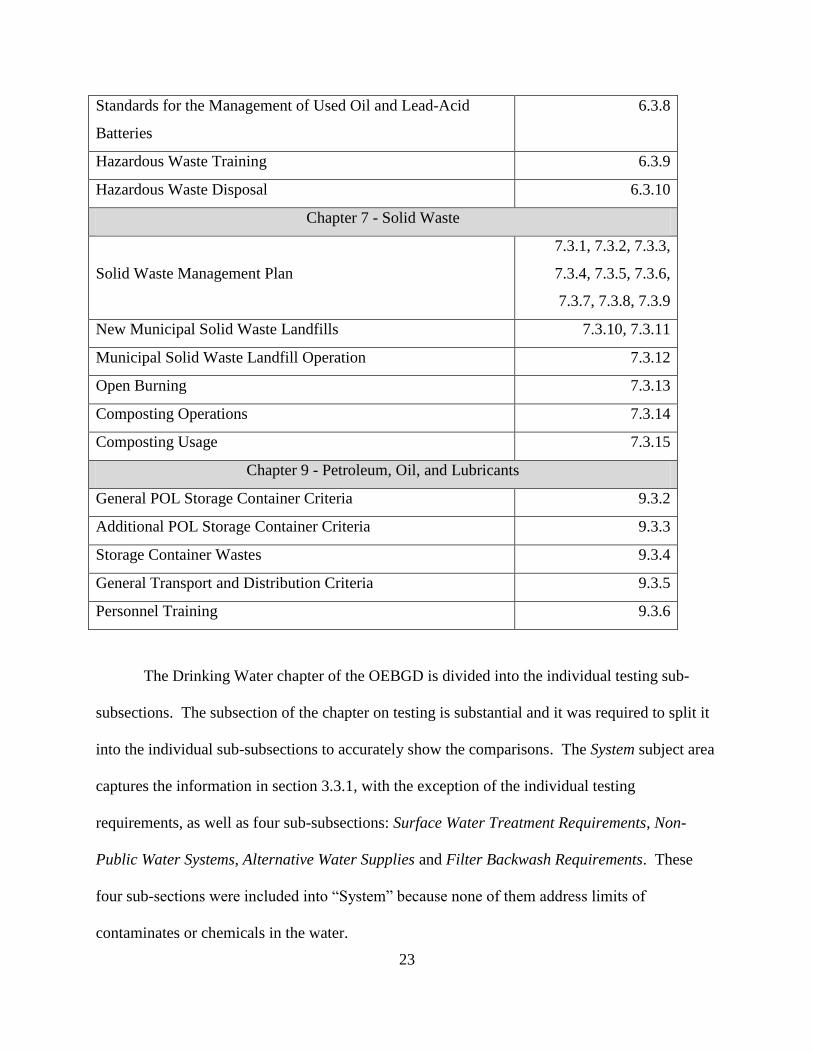
The Drinking Water chapter of the OEBGD is divided into the individual testing sub-
subsections. The subsection of the chapter on testing is substantial and it was required to split it
into the individual sub-subsections to accurately show the comparisons. The System subject area
captures the information in section 3.3.1, with the exception of the individual testing
requirements, as well as four sub-subsections: Surface Water Treatment Requirements, Non-
Public Water Systems, Alternative Water Supplies and Filter Backwash Requirements. These
four sub-sections were included into “System” because none of them address limits of
contaminates or chemicals in the water.
24
The Hazardous Materials chapter has two scored subject areas with multiple OEBGD
sections because those sections contain related information that can be compiled into a single
subject area. The sections in the Labeling (MSDS) subject area all pertain to the use of Material
Safety Data Sheets (MSDS). The sections in the Hazardous Material Management subject area
contain the last four sections of Chapter 5 in the OEBGD and consist of generic use and
management of hazardous materials. The Solid Waste Management Plan subject area in the
Solid Waste Chapter contains nine sections that are all related to an installation’s solid waste
management plan. The New Municipal Solid Waste Landfills (MSWL) subject covers two
sections of the OEBGD that reference plans for new landfills. These sections were combined
into similar subject areas to simplify the analysis and reduce unnecessary and redundant subject
areas.
The Final Governing Standards were scored according to how they compared to the
baseline standards in the OEBGD. Each chapter and subject area of the OEBGD was compared
with each FGS to determine whether or not they were more or less stringent. The chapter
heading was given a score of 1 if it had additional sections that were not in the OEBGD or a zero
if it had no additional sections. If a chapter was missing sections, the section score receives a
zero, not the chapter heading score. This score is only to capture if there are additional country
requirements that are not identified in the OEBGD.
The subject areas are only scored with a 1, 0, or -1, regardless of how much more
stringent or less stringent the FGS is than the OEBGD. The tables referenced in each subject
area also count towards the score for that subject area. Areas that had the same or similar
requirements as the OEBGD receive a 0. Areas did not score a point if they specified what

25
regulations, manuals, instructions, etc., where the OEBGD says to use applicable regulations and
Host Nation (HN) agreements and did not mention any further requirements or restrictions.
Each subject area that was more stringent or had additional requirements was scored with
a 1. Some examples of more stringent requirements are stricter maximum contaminant levels
(MCL) of chemicals, stricter emission standards, stricter control limits, greater minimum
separation distances, prohibited actions, and specified minimum requirements not identified in
the OEGBGD. Examples of additional requirements include, but are not limited to, additional
regional requirements within a country, additional criteria, or additional monitoring.
Additionally, the FGS would use words that conveyed mandatory action such as shall, will, must,
etc., which would give the subject area a higher score if the OEBGD had no such requirement.
Words that conveyed a best practice but not mandatory such as should, can, may, etc., were not
considered to be more stringent than the OEBGD. Conversely, any subject area that was less
stringent or had less requirements than the OEBGD was scored with a -1. Areas would receive a
score of -1 if they had less strict MCL standards or were missing sections that were in the
OEBGD. A negative score is assigned even if the FGS says to contact HN authorities but lists
no or less criteria for the subject area. The rationale behind this is that if there was an agreement
or treaty prohibiting an activity, the FGS should identify it. In the event of a subject area having
both negative and positive scores, the area should be assigned a score that properly indicates
whether the FGS is intending to be more or less stringent than the OEBGD. In one example
(explained in the Republic of Korea section of the Results), the FGS does not have a monitoring
requirement for populations larger than 10,000 but has stricter monitoring requirements for all
other populations which makes it score higher than the OEBGD.
26
Summary
This chapter summarized the methodology used in the comparison of FGS and the
OEBGD and the construction of the Lester Model with the WGI and EPI. This research will use
two publicly available and peer-reviewed indices to construct the Lester Model in order to
compare foreign governments. The different FGS were compared according to subject areas
from the OEBGD and scored according to the methodology outlined in this section.

27
IV. Analysis and Results
This chapter discusses the results of the OEBGD and FGS comparisons and the
construction of the Lester Model. The first section discusses the Lester Model product. The
following sections go into a further analysis of how each country fits in the Lester Model and
provide an explanation of any negative scores. This analysis will then discuss relevant findings
by each OEBGD chapter. The results showed a high level of compliance across all of the
countries and none of the FGS were overall less stringent than the OEBGD. While the Lester
Model did not produce results as predicted, this chapter will also address the prediction
capability of the research model.
Lester Model
Table 5 shows how the countries used in this analysis fall into the Lester Model. Fifteen
different FGS were used in this comparison and more than half of those countries fall into the
Progressives category. Unfortunately, none of the countries fall into the Strugglers category, but
the Kingdom of Saudi Arabia is very close to the division between the Strugglers and
Regressives categories.
Table 5. Lester Model
Progressives Strugglers Delayers Regressives
Belgium
Germany
Italy
Japan
Netherlands
Portugal
Republic of Korea
Spain
United Kingdom
(none) Sultanate of Oman
State of Qatar
United Arab Emirates
Kuwait
Kingdom of Saudi Arabia
Republic of Turkey

28
Figure 1 is the Lester Model plot of all the countries used in this analysis. The six
countries in the Delayers and Regressives categories are clustered in one area of the Lester
Model as they all fall near the dividing line between the Delayers and Regressives. The
following sections will discuss the FGS by country and as well as give an overview of the results
of each chapter.
Figure 1. Lester Model plot for countries in this analysis
Belgium
Germany Italy
Japan
Kuwait
Netherlands
Oman
Portugal
Qatar
Saudi Arabia
South Korea
Spain
Turkey
United Arab Emirates
United Kingdom
0.00
0.50
1.00
0.00 0.50 1.00
No
rmal
ize
d E
PI
Sco
re
Normalized Average WGI Score
Lester Model
Progressives Strugglers
Regressives Delayers
29
Belgium
Belgium is in the Progressive category with an EPI score of 63.02 and an average WGI
score of 1.34. The FGS identifies the US Army Installation Command, Europe Region
(IMCOM-Europe) as the EEA. The Belgium FGS’s last complete update was in May 2010 with
revisions to Chapter 10 made in July 2012 (United States Army: Installation Management
Command - Europe, 2010a).
The FGS had a final score of 20 with the same requirements as the OEBGD in 28 areas,
higher scores in 24 areas, and scores lower in 4 areas. The four areas that the FGS scores
negative in are Chapter 2 – Incinerators, Chapter 6 – Hazardous Waste Storage Area and
Hazardous Waste Disposal, and Chapter 9 – General POL Storage Container Criteria. The FGS
does not have any criteria for incinerators and only states that the installation should contact the
EEA for additional information. The Hazardous Waste Storage Area of the FGS received a
negative score because it does not mention testing and maintenance of equipment. The
Hazardous Waste Disposal section does not have a section on ignitable, reactive, or incompatible
wastes as contained in the OEBGD. In Chapter 9, the FGS does not have any criteria on
containment area floor maximum permeability.
Germany
Germany is in the Progressives category with an EPI score of 66.91 and an average WGI
score of 1.45. The FGS identifies the U.S. Army IMCOM-Europe as the EEA. The Germany
FGS’s last complete update was made in February 2010 with revisions made in Chapters 10 and
13 made in July 2012 (United States Army: Installation Management Command - Europe,
2010b). The FGS had a final score of 33 with the same requirements as the OEBGD in twenty-
three areas and higher scores in thirty-three areas. There were no negative scores and the FGS is

30
overall much more stringent than the OEBGD and has additional criteria for different areas of
the country.
Italy
Italy is in the Progressive category with an EPI score of 68.9 and an average WGI score
of 0.48. The FGS identifies the Commander Navy Region Europe Africa Southwest Asia
(CNREURAFSWA) as the EEA. The Italy FGS was last updated and revalidated in September
2012 (Commander, Navy Region Europe, Africa, Southwest Asia, 2012).
The FGS final score was 28 with same requirements as the OEBGD in twenty-four areas,
higher scores in thirty areas, and scores lower in two areas. Italy has two sections that score
negative and they are the two sections that have to do with landfills: Chapter 7 – New Municipal
Solid Waste Landfills and Municipal Solid Waste Landfill Operation. The Italy FGS doesn’t
have the same amount of criteria as the OEBGD for landfill requirements. The Italy FGS has
waste chapters that are completely different from any of the other FGS. The FGS classifies
waste into two categories based upon its origin, urban or special, and then further divides these
two categories into non-hazardous and hazardous waste (Commander, Navy Region Europe,
Africa, Southwest Asia, 2012). This classification makes the FGS different from any of the other
FGS studied and makes it very difficult to compare the two chapters with the OEBGD.
Japan
Japan is in the Progressives category with an EPI score of 63.36 and an average WGI
score of 1.25. The FGS identifies the Commander, U.S. Forces Japan (COMUSJAPAN) as the
EEA. The Japan FGS was last updated and revalidated in Dec 2012 (Headquarters, U.S. Forces
Japan, 2012). The FGS final score was 13 with the same requirements as the OEBGD in 43

31
areas and higher scores in 13 areas. Japan had scored the lowest of all the Progressives and
second lowest of all the countries but had no negative scores.
Kuwait
Kuwait is in the Regressive category with an EPI score of 35.54 and an average WGI
score of -0.06. The FGS identifies U.S. Central Command (USCENTCOM) as the EEA. The
Kuwait FGS was last updated in March 2011 (United States Army Central Command, 2011).
The FGS final score was 14 with the same requirements as the OEBGD in forty-two
areas and higher scores in 14 areas. There were also three errors found in the FGS, two in
Chapter 2 – Drinking Water and one in Chapter 6 – Hazardous Waste. Firstly, the Fluoride
Requirements section states that the content of fluoride in the drinking water shouldn’t exceed 4
mg/L as stated in Table C3.T3 of the FGS, but Table C3.T3 has the MCL of fluoride as 1.5 mg/L
(United States Army Central Command, 2011). Secondly, the title for the table for synthetic
organic compounds limits has a header that repeats the heading for Table C3.T5. Also in the
same table, the MCL for Di (2-ethylhexyl) adipate is stated as “0.” and is missing numbers after
the decimal point (United States Army Central Command, 2011). The third mistake is an
inconsistency between two sections of Chapter 6. Under the DoD Hazardous Waste Generators
section, subparagraph C6.3.1.3. states that shippers of hazardous waste must keep manifests for a
minimum of five years, but the Recordkeeping Requirements section states that manifests will be
retained for three years (United States Army Central Command, 2011).
Netherlands
The Netherlands is in the Progressives category with an EPI score of 65.65 and an
average WGI score of 1.72. The FGS identifies U.S. Army IMCOM-Europe as the EEA. The

32
Netherlands FGS’s last complete update was in May 2010 with revisions made to Chapter 10 in
July 2012 (United States Army: Installation Management Command - Europe, 2010c).
The FGS final score was 21 with the same requirements as the OEBGD in thirty-one
areas, higher scores in twenty-three areas, and lower scores in two areas. The two negative
scores were Chapter 2 – Incinerators and Chapter 6 – Hazardous Waste Disposal. As with
Belgium, the Netherlands FGS doesn’t contain standards for incinerators but states that
installations should contact the EEA. The standards for hazardous waste land disposal are not
outlined in the FGS but it states that hazardous wastes will only be land-disposed in landfills
approved by Dutch authorities and the hazardous waste incinerator standards section in the FGS
do not list all the requirements as the OEBGD (United States Army: Installation Management
Command - Europe, 2010c).
In addition to the two negative scores, four mistakes were found in the Netherlands FGS.
The first mistake is in section C2.3.9. Fluorinated Greenhouse Gases and is the error statement
“Error! Reference source not found.” This is likely meant to reference Table C2.T1 Fluorinated
Greenhouse Gases as it is the only table pertaining to fluorinated greenhouse gases after the
chapter. The next mistake is the same mistake in the Fluoride Requirements as the Kuwait FGS.
The Netherlands FGS states that the MCL is 4 mg/L and references Table C3.T17 but that table
shows the MCL of fluoride to be 1.1 mg/L. The third mistake is in section C4.3.2.1 Effluent
Limits and references non-existent paragraphs. The mistake is likely the result of deleting the
referencing mistake in the OEBGD but the paragraph references were not completely deleted so
the FGS states “see subparagraphs C4.3.3.1.8., 0., and 0. for a list of categorical standards”
(United States Army: Installation Management Command - Europe, 2010c). The fourth mistake
found was a spelling error where the FGS spells “terratogen” instead of teratogen.
33
Sultanate of Oman
The Sultanate of Oman (Oman) is in the Delayers category with an EPI score of 44 and
an average WGI score of 0.15. The Oman FGS does not identify an EEA but states that U.S. Air
Forces Central (USAFCENT) is the Lead Environmental Component for Oman. The FGS was
last updated in December 2012 (U.S. Air Forces Central, 2012). The FGS final score was 20
with the same requirements as the OEBGD in thirty-six areas and higher scores in twenty areas.
Oman’s WGI score places it just over the dividing line between Regressives and Delayers but
Oman’s score of 20 makes it more likely that Oman does not belong in the Regressive category.
Although there were not negative scores, there were four mistakes found in the Oman
FGS. The first mistake was again the discrepancy between the fluoride MCL in the text and in
the tables. The text of the Fluoride Requirements section puts the MCL at 4 mg/L but referenced
Table C3.T3 sets the MCL for fluoride at 1.5 mg/L. The second mistake is the same error found
in the OEBGD in C4.3.2.1 Effluent Limits where the FGS references subparagraphs that do not
exist. The third mistake is a typing error in section C6.3.10.8.1.3 Biodegradation. The FGS
states “11W being biodegraded” instead of “HW being biodegraded.” The fourth mistake is in
the FGS table of contents and is likely a formatting mistake. The C1.1. PURPOSE header has
text from that section incorrectly formatted in the style of the section header and the word
processing program automatically populated that text in the table of contents (U.S. Air Forces
Central, 2012).
Portugal
Portugal is in the Progressives category with an EPI score of 57.64 and an average WGI
of 0.93. The FGS identifies the Deputy Commander of U.S. Air Forces Europe (USAFE/CV) as
34
the EEA but authority is delegated to the USAFE Civil Engineer for all matters except for the
duty to approve waivers to the FGS (Headquarters, United States Air Forces Europe, 2011).
The FGS final score was 26 with the same requirements as the OEBGD in twenty-six
areas, higher scores in twenty-eight areas, and lower scores in two areas. The two negative
scores were Chapter 2 – Motor Vehicles and Chapter 6 – Hazardous Waste Disposal. The
Portugal FGS omits the section on the emissions of motor vehicles in Chapter 2. In Chapter 6,
the FGS omits the sections in Chapter 6 of the OEBGD on treatment technologies to reduce the
volume or hazardous characteristics of waste and also does not have criteria for hazardous waste
landfills and only states that waste may only be disposed of in permitted landfills (Headquarters,
United States Air Forces Europe, 2011).
State of Qatar
The State of Qatar (Qatar) is in the Delayers category with an EPI score of 46.59 and an
average WGI score of 0.73. The Qatar FGS does not identify any party as the EEA or Lead
Environmental Component but the FGS was prepared by USAFCENT on behalf of
USCENTCOM. The Qatar FGS was last updated in March 2011 (U.S. Air Forces Central,
2011). The FGS final score was 17 with the same requirements as the OEBGD in thirty-nine
areas and higher scores in seventeen areas.
Kingdom of Saudi Arabia
The Kingdom of Saudi Arabia (KSA) is in the Regressives category with an EPI score of
49.97 and an average WGI score of -0.33. The KSA FGS does not identify any party as the EEA
or Lead Environmental Component but the FGS was prepared by USAFCENT on behalf of
USCENTCOM. The FGS was last updated in December 2010.

35
The FGS final score was 20 with the same requirements as the OEBGD in thirty-six areas
and higher scores in twenty areas. While there were no negatives in the KSA FGS, there was
one error found. In Chapter 5 – Hazardous Materials, the end of the chapter has an incorrect
numbering sequence. The bulleted numbers jump from “5.4.2.5” to "5.4.6”, when it should go to
“5.4.3” (U.S. Air Forces Central, 2010). The KSA plots in the Lester Model very close to the
dividing line between Strugglers and Regressives and could very easily be in the Strugglers
category. While only point estimates are used in this study, the margin of error on the EPI score
could mean that the KSA should be in the Strugglers category and its FGS score of 20 lends
credibility to that assumption
Republic of Korea
The Republic of Korea (ROK) is in the Progressives category with an EPI score of 57.2
and an average WGI score of 0.73. The FGS identifies the Commander of U.S. Forces Korea
(USFK) as the EEA although the EEA responsibilities have been delegated to the USFK
Assistant Chief of Staff Engineer. The FGS was last updated in June 2012.
The FGS final score was 21 with the same requirements as the OEBGD in thirty-three
areas, higher scores in twenty-two areas, and a lower score in one area. The negative score is
because the ROK FGS does not identify necessary coliform monitoring requirements for
populations greater than 50,000 while the OEBGD continues to list requirements for larger
populations. In addition, the FGS doesn’t have requirements for monitoring of lead and copper
in populations greater than 100,000 but its additional requirements for populations under 100,000
made it score higher than the OEBGD. Also of concern are the criteria for effluent limitations in
Chapter 4. While the FGS has additional requirements not in the OEBGD, the FGS does not
state whether the limitations are not to exceed the concentration or if the concentration is
36
monthly and weekly averages as they are in the OEBGD (Headquarters, United States Forces
Korea, 2012).
Spain
Spain is in the Progressives category with an EPI score of 60.31 and an average WGI
score of 0.86. The FGS identifies the Commander in Chief of U.S. Naval Forces Europe
(CINCUSNAVEUR) as the EEA. The Spain FGS was last updated in July 2008 and no new
FGS has been published as of this research even though the Spain FGS states that the EEA will
update and revalidate the FGS at least every two years (Commander, Navy Region Europe,
2008).
The FGS final score was 32 with the same requirements as the OEBGD in thirty-six
areas, higher scores in sixteen areas, and lower scores in four areas. The four areas with negative
scores are Chapter 2 – Stack Heights, Chapter 3 – Disinfectant/Disinfection Byproducts (DDBP)
Requirements, and Chapter 9 – Additional POL Storage Criteria and Personnel Training. The
FGS makes no mention of stack heights or personnel training. Spain’s general POL criteria have
more requirements than the OEBGD but it does not address the subsections in the OEBGD’s
section “Additional POL Storage Criteria.” The FGS has a less stringent MCL for total
trihalomethanes of 0.10 mg/L as opposed to the OEBGD MCL of 0.08 mg/L and does not
address any of the other disinfectants specified in the OEBGD. In addition to the negative
scores, one mistake was found in the FGS. Section C7.3 Solid Waste Management Strategy lists
three Spanish goals for waste reduction but two of the goals list the same target date with
different total reduction amounts (Commander, Navy Region Europe, 2008).
37
Republic of Turkey
The Republic of Turkey (Turkey) is in the Regressives category with an EPI score of 44.8
and an average WGI score of -0.07. The FGS does not specifically identify the EEA but it can
be implied from the title page that the Headquarters (HQ) USAFE is the EEA. The Turkey FGS
was last updated in July 2008.
The FGS final score was 1 with the same requirements as the OEBGD in fifty-five areas
and a higher score in one. The only difference between the OEBGD requirements and the FGS
was an additional section called Hazardous Waste Minimization that required installations to
develop and use plans to reduce the amount of hazardous waste transported. The FGS and the
OEBGD were almost word for word identical and that also meant that the FGS has the same
mistake as the OEBGD in section C4.3.2.1 in which it references subparagraphs that do not exist.
United Arab Emirates
The United Arab Emirates (UAE) is in the Delayers category with an EPI score of 50.91
and an average WGI score of 0.57. The FGS identifies USCENTCOM as the EEA and
CNREURAFSWA as the Lead Environmental Component. The UAE FGS was last updated in
March 2012. The FGS final score was 34 with the same requirements as the OEBGD in twenty-
two areas and higher scores in thirty-four areas. The UAE point estimate is right on the edge
between the Progressives and Delayers category and with the margin of error in the EPI score,
the UAE could just as easily be in the Progressives category. The UAE FGS had the highest
score of all the countries in this analysis and that lends credibility to the notion that perhaps the
UAE should be a Progressive instead of a Delayer.
38
United Kingdom
The United Kingdom (UK) is in the Progressives category with an EPI score of 68.82 and
an average WGI score of 1.37. The FGS identifies HQ USAFE/CV as the EEA for Portugal.
The FGS was last updated in March 2013.
The FGS final score was 32 with the same requirements as the OEBGD in twenty-four
areas and higher scores in thirty-two areas. While there are no negative scores, there was one
mistake found in the FGS. In Table C2.T3 Emission Standards for Incinerators, the FGS
mistakenly has “955” instead of “95%” for the amount reduction of hydrogen chloride in existing
units with a rated at greater than 250 tons per day (Headquarters, United States Air Forces
Europe, 2013). There are also eight sections of the UK FGS has don’t necessarily have stricter
requirements than the OEBGD but require that installations contact local authorities to determine
if there are any stricter requirements than specified in the FGS. These sections were given a
higher score than the OEBGD because these sections in the OEBGD make no mention of
contacting host nation authorities to determine stricter requirements.
Air Emissions Chapter Comparisons
Table 6 shows the breakdown in points for each of the countries and subject areas in the
Air Emissions chapter. The Air Emissions comparisons had 60 total instances where the FGS
had a more stringent or additional requirements than the OEBGD. The countries in the
Progressive category had an average score of 4.89, the Delayers had an average score of 3, and
the Regressives had an average score of 1. 13 of the 15 countries had additional criteria and
sections that were not in the OEBGD. There were several subjects that appeared in multiple
FGS but are not in the OEBGD and they are ambient air quality standards, volatile organic
compounds (VOC) limits, and motor vehicle filling stations emissions.
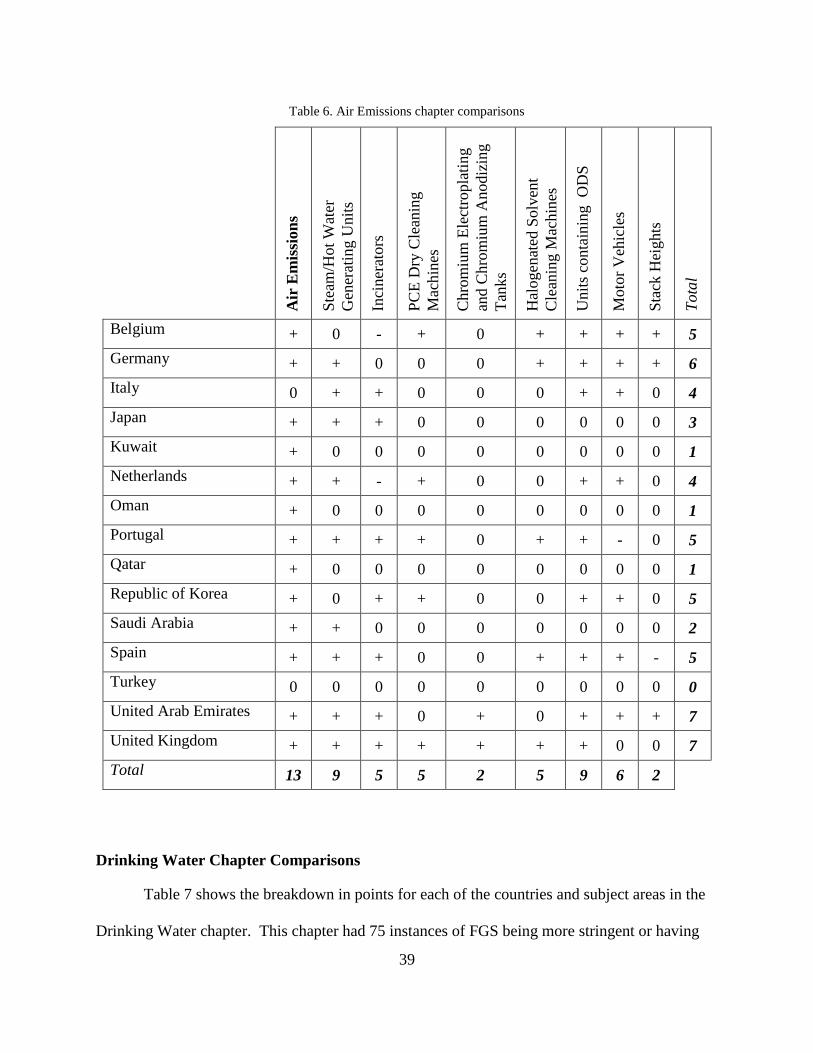
39
Table 6. Air Emissions chapter comparisons
Air
Em
issi
on
s
Ste
am/H
ot
Wat
er
Gen
erat
ing U
nit
s
Inci
ner
ators
PC
E D
ry C
lean
ing
Mac
hin
es
Chro
miu
m E
lect
ropla
ting
and C
hro
miu
m A
nodiz
ing
Tan
ks
Hal
ogen
ated
Solv
ent
Cle
anin
g M
achin
es
Unit
s co
nta
inin
g O
DS
Moto
r V
ehic
les
Sta
ck H
eights
Tota
l
Belgium + 0 - + 0 + + + + 5
Germany + + 0 0 0 + + + + 6
Italy 0 + + 0 0 0 + + 0 4
Japan + + + 0 0 0 0 0 0 3
Kuwait + 0 0 0 0 0 0 0 0 1
Netherlands + + - + 0 0 + + 0 4
Oman + 0 0 0 0 0 0 0 0 1
Portugal + + + + 0 + + - 0 5
Qatar + 0 0 0 0 0 0 0 0 1
Republic of Korea + 0 + + 0 0 + + 0 5
Saudi Arabia + + 0 0 0 0 0 0 0 2
Spain + + + 0 0 + + + - 5
Turkey 0 0 0 0 0 0 0 0 0 0
United Arab Emirates + + + 0 + 0 + + + 7
United Kingdom + + + + + + + 0 0 7
Total 13 9 5 5 2 5 9 6 2
Drinking Water Chapter Comparisons
Table 7 shows the breakdown in points for each of the countries and subject areas in the
Drinking Water chapter. This chapter had 75 instances of FGS being more stringent or having

40
additional requirements than the OEBGD. The Progressives average score was 4.78, the
Delayers average score was 6.67, and the Regressives average score was 3.33. The Drinking
Water chapter had the most instances of positive scores of all the chapters in this study. The top
three areas of scoring were (in order) Inorganic Chemical Requirements, Synthetic Organics
Requirements, and System. Eight of the FGS had additional sections or requirements that were
not identified in the OEBGD. There were only two subjects that were in multiple FGS and they
were other water quality-related criteria and permitting required for using bodies of water.
Oman, Qatar, and KSA have an additional section on other drinking water properties but the
KSA FGS has much more criteria than Oman and Qatar. Spain and Germany require
installations acquire permits before using water bodies as sources of drinking water. The scores
in this chapter were somewhat unexpected with Qatar, KSA, Oman, and UAE scoring higher
than all of the other countries with the exception of Italy, which scored the highest.
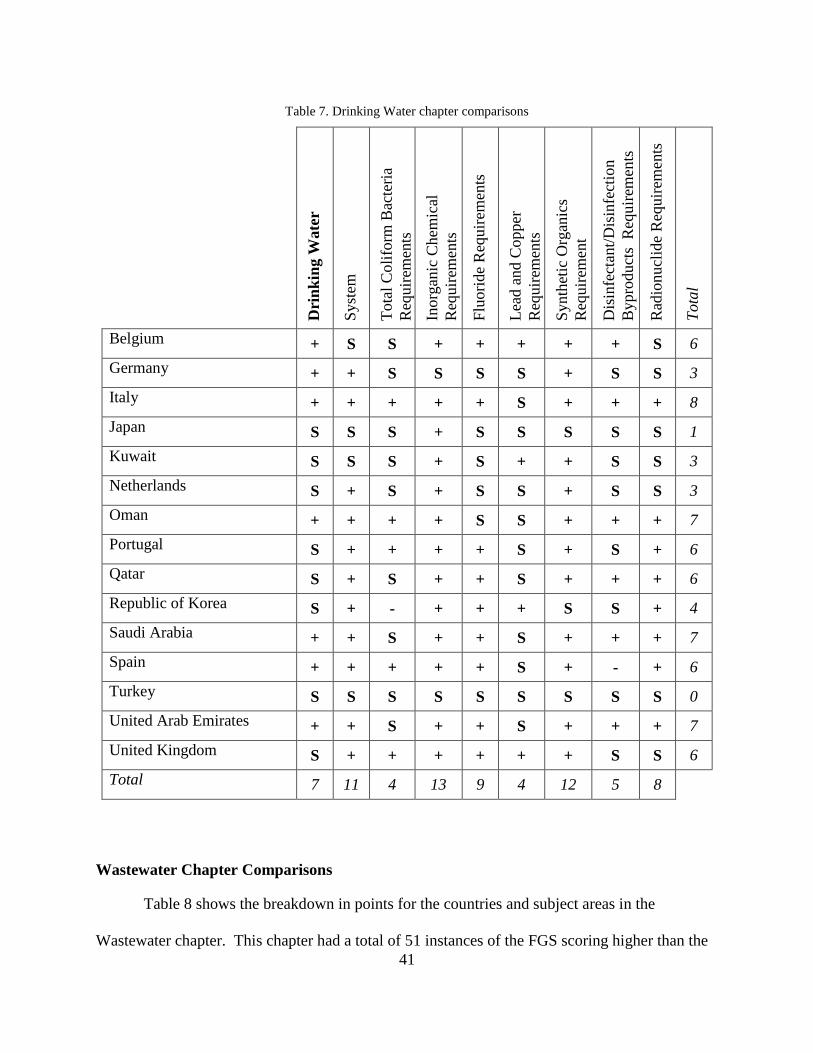
41
Table 7. Drinking Water chapter comparisons
Dri
nk
ing W
ate
r
Syst
em
Tota
l C
oli
form
Bac
teri
a
Req
uir
emen
ts
Inorg
anic
Chem
ical
Req
uir
emen
ts
Flu
ori
de
Req
uir
emen
ts
Lea
d a
nd C
opper
Req
uir
emen
ts
Synth
etic
Org
anic
s
Req
uir
emen
t
Dis
infe
ctan
t/D
isin
fect
ion
Bypro
duct
s R
equir
emen
ts
Rad
ionucl
ide
Req
uir
emen
ts
Tota
l
Belgium + S S + + + + + S 6
Germany + + S S S S + S S 3
Italy + + + + + S + + + 8
Japan S S S + S S S S S 1
Kuwait S S S + S + + S S 3
Netherlands S + S + S S + S S 3
Oman + + + + S S + + + 7
Portugal S + + + + S + S + 6
Qatar S + S + + S + + + 6
Republic of Korea S + - + + + S S + 4
Saudi Arabia + + S + + S + + + 7
Spain + + + + + S + - + 6
Turkey S S S S S S S S S 0
United Arab Emirates + + S + + S + + + 7
United Kingdom S + + + + + + S S 6
Total 7 11 4 13 9 4 12 5 8
Wastewater Chapter Comparisons
Table 8 shows the breakdown in points for the countries and subject areas in the
Wastewater chapter. This chapter had a total of 51 instances of the FGS scoring higher than the

42
OEBGD and there were no negative scores in this chapter. The average score of the
Progressives category was 3.89, the Delayers had an average score of 3.67, and the Regressives
had an average score of 1.67. Nine of the countries had additional sections or requirements that
were not in the OEBGD. Four of the countries in the CENTCOM Area of Responsibility (Qatar,
Oman, UAE, and KSA) had additional requirements for discharges to marine environments.
Only two countries did not have more stringent requirements for effluent limitations of
conventional pollutants and three countries did not have more stringent requirements for limits of
non-categorical industrial indirect dischargers.

43
Table 8. Wastewater chapter comparisons
Wast
ewate
r
Eff
luen
t L
imit
atio
ns
for
Dir
ect
Dis
char
ger
s of
Conven
tional
Poll
uta
nts
Eff
luen
t L
imit
atio
ns
for
Non-C
ateg
ori
cal
Indust
rial
Indir
ect
Dis
char
ger
s
Eff
luen
t L
imit
atio
ns
for
Cat
egori
cal
Indust
rial
Dis
char
ger
s (
Dir
ect
or
Indir
ect)
Sto
rm W
ater
Man
agem
ent
Sep
tic
Syst
em
Slu
dge
Dis
posa
l
Tota
l
Belgium S + + + S S S 3
Germany S + + + + + S 5
Italy + + + + + + S 6
Japan S + + + S S S 3
Kuwait S + + S S S S 2
Netherlands + S + S S S S 2
Oman + + S S + S S 3
Portugal + + + S S S S 3
Qatar + + S S S S S 2
Republic of Korea + + + + S S S 4
Saudi Arabia + + + S S S S 3
Spain S + + + + S S 4
Turkey S S S S S S S 0
United Arab Emirates + + + + + S + 6
United Kingdom + + + + S + S 5
Total 9 13 12 8 5 3 1
Hazardous Materials Chapter Comparisons
Table 9 shows the breakdown in points for countries and subject areas in the Hazardous
Materials chapter. This chapter had a total of 32 instances of a FGS scoring higher than the
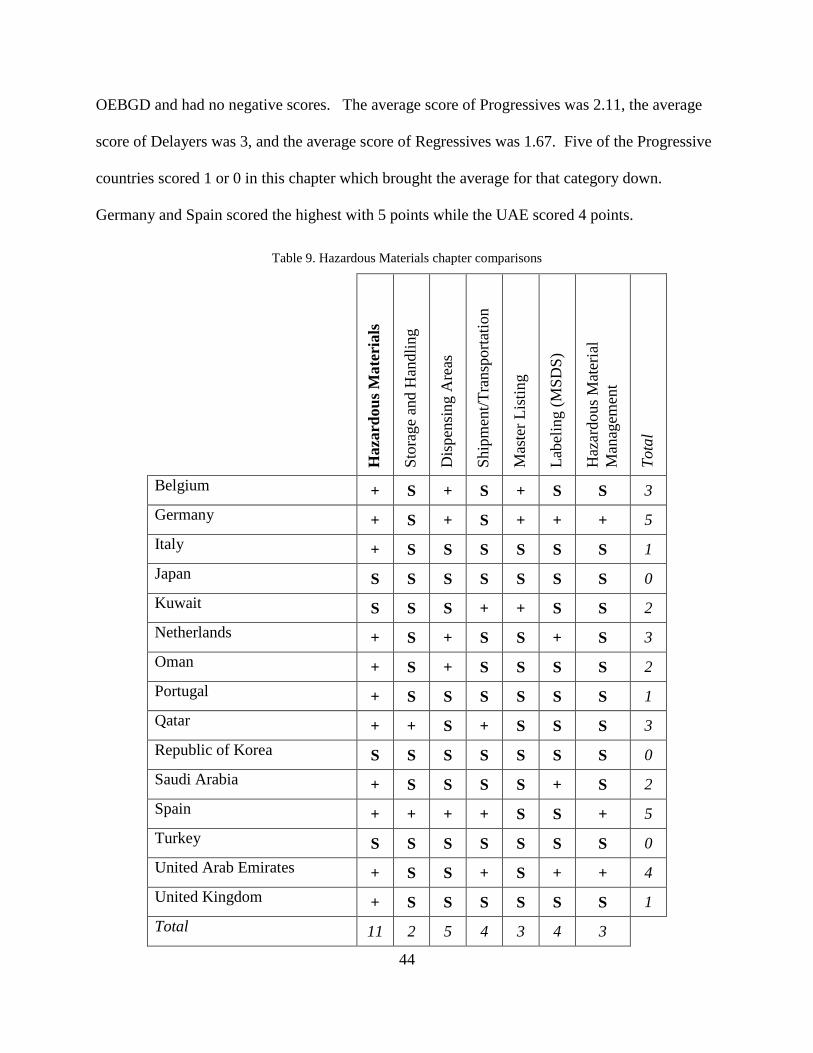
44
OEBGD and had no negative scores. The average score of Progressives was 2.11, the average
score of Delayers was 3, and the average score of Regressives was 1.67. Five of the Progressive
countries scored 1 or 0 in this chapter which brought the average for that category down.
Germany and Spain scored the highest with 5 points while the UAE scored 4 points.
Table 9. Hazardous Materials chapter comparisons
Haza
rdou
s M
ate
rials
Sto
rage
and H
andli
ng
Dis
pen
sing
Are
as
Ship
men
t/T
ransp
ort
atio
n
Mas
ter
Lis
ting
Lab
elin
g (
MS
DS
)
Haz
ardous
Mat
eria
l
Man
agem
ent
Tota
l
Belgium + S + S + S S 3
Germany + S + S + + + 5
Italy + S S S S S S 1
Japan S S S S S S S 0
Kuwait S S S + + S S 2
Netherlands + S + S S + S 3
Oman + S + S S S S 2
Portugal + S S S S S S 1
Qatar + + S + S S S 3
Republic of Korea S S S S S S S 0
Saudi Arabia + S S S S + S 2
Spain + + + + S S + 5
Turkey S S S S S S S 0
United Arab Emirates + S S + S + + 4
United Kingdom + S S S S S S 1
Total 11 2 5 4 3 4 3
45
Hazardous Waste Chapter Comparisons
Table 10 shows the breakdown in points for countries and subject areas in the Hazardous
Waste chapter. This chapter had a total of 60 instances of a FGS scoring higher than the
OEBGD. The Progressives scored an average of 4.11, the Delayers 3.67, and the Regressives
2.67. Belgium had 0 points from this chapter because it had two negative scores cancel out the
two positive scores. The two subject areas that had the most points were Record Keeping
Requirements and Standards for the Management of Used Oil and Lead Acid Batteries which
both had 9 points. The higher scores in record keeping came from the fact that the nine countries
required that documents must be kept on file longer than specified in the OEBGD and all five of
the countries in the CENTCOM AOR had stricter record keeping requirements. Japan was the
only Progressive country that did not have stricter requirements for used oil or batteries while the
UAE was the only non-Progressive country to have stricter requirements. Hazardous Waste
Disposal would have had the most points scored with 10 except negative scores from Belgium,
the Netherlands, and Portugal brought the final score to 7.

46
Table 10. Hazardous Waste chapter comparisons
Haza
rdou
s W
ast
e
Haz
ardous
Was
te G
ener
ators
Haz
ardous
Was
te A
ccum
ula
tion
Poin
t
Haz
ardous
Was
te S
tora
ge
Are
a
Use
and M
anag
emen
t of
Conta
iner
s
Rec
ord
Kee
pin
g R
equir
emen
ts
Conti
ngen
cy P
lan
Tan
k S
yst
ems
Sta
ndar
ds
for
the
Man
agem
ent
of
Use
d O
il a
nd L
ead
-Aci
d B
atte
ries
Haz
ardous
Was
te T
rain
ing
Haz
ardous
Was
te D
isposa
l
Tota
l
Belgium S S S - S S S + + S - 0
Germany + + S S S S S + + S S 4
Italy + S S + + + S + + S + 7
Japan + S S S S + S S S S + 3
Kuwait S + S S S + S S S S + 3
Netherlands S S S + + S S + + S - 3
Oman S S S S + + S S S S + 3
Portugal S + S + S + S S + S - 3
Qatar S S S S S + S S S S + 2
Republic of Korea S + S S S S S + + S + 4
Saudi Arabia + + S S S + S S S S + 4
Spain + S + + + + S + + S + 8
Turkey + S S S S S S S S S S 1
United Arab
Emirates S + S S + + + S + S + 6
United Kingdom S + S + + S S S + S + 5
Total 6 7 1 4 6 9 1 6 9 0 7

47
Solid Waste Chapter Comparisons
Table 11 shows the breakdown in points for countries and subject areas in the Solid
Waste chapter. This chapter had a total of 51 instances of a FGS scoring higher than the
OEBGD. The average score of the Progressives was 3.89, the average score of the Delayers was
3, and the average score of the Regressives was 1.67. Only two of the Progressives scored lower
than a 3, ROK and Italy. The ROK FGS had the same requirements as the OEBGD but had three
additional sections and the Italy FGS had two negatives from the lack of landfill criteria that
brought its score down to 2. The Solid Waste Management Plan area had the highest score with
12 and the ROK was the Progressive that did not have a positive score in that area, while all of
the Delayers and Kuwait had more requirements in that area.

48
Table 11. Solid Waste chapter comparisons
Soli
d W
ast
e
Soli
d W
aste
Man
agem
ent
Pla
n
New
Munic
ipal
Soli
d W
aste
Lan
dfi
lls
Munic
ipal
Soli
d W
aste
Lan
dfi
ll O
per
atio
n
Open
Burn
ing
Com
post
ing O
per
atio
ns
Com
post
ing U
sage
Tota
l
Belgium + + S S S S + 3
Germany + + + + S + + 6
Italy + + - - S + + 2
Japan S + S + S S + 3
Kuwait S + + + S S S 3
Netherlands + + S S S + + 4
Oman + + + + S S S 4
Portugal + + + + + S S 5
Qatar + + S S S S S 2
Republic of Korea + S S S S S S 1
Saudi Arabia + S S S S + S 2
Spain + + S + S + + 5
Turkey S S S S S S S 0
United Arab Emirates S + S + S + S 3
United Kingdom + + + + S + + 6
Total 11 12 4 7 1 7 7
Petroleum, Oil, and Lubricants Chapter Comparisons
Table 12 shows the breakdown in points for countries and subject areas in the Petroleum,
Oil, and Lubricants (POL) chapter. This chapter had a total of 18 instances where a FGS scored
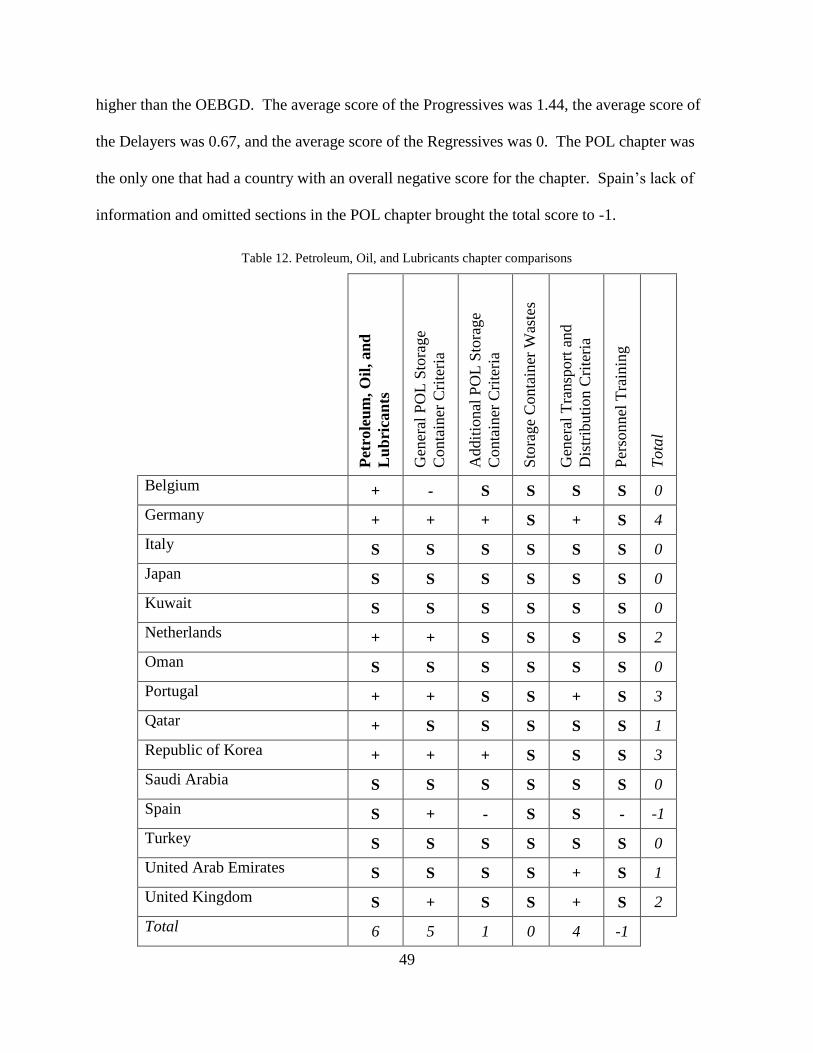
49
higher than the OEBGD. The average score of the Progressives was 1.44, the average score of
the Delayers was 0.67, and the average score of the Regressives was 0. The POL chapter was
the only one that had a country with an overall negative score for the chapter. Spain’s lack of
information and omitted sections in the POL chapter brought the total score to -1.
Table 12. Petroleum, Oil, and Lubricants chapter comparisons
Pet
role
um
, O
il, an
d
Lu
bri
can
ts
Gen
eral
PO
L S
tora
ge
Conta
iner
Cri
teri
a
Addit
ional
PO
L S
tora
ge
Conta
iner
Cri
teri
a
Sto
rage
Conta
iner
Was
tes
Gen
eral
Tra
nsp
ort
and
Dis
trib
uti
on C
rite
ria
Per
sonnel
Tra
inin
g
Tota
l
Belgium + - S S S S 0
Germany + + + S + S 4
Italy S S S S S S 0
Japan S S S S S S 0
Kuwait S S S S S S 0
Netherlands + + S S S S 2
Oman S S S S S S 0
Portugal + + S S + S 3
Qatar + S S S S S 1
Republic of Korea + + + S S S 3
Saudi Arabia S S S S S S 0
Spain S + - S S - -1
Turkey S S S S S S 0
United Arab Emirates S S S S + S 1
United Kingdom S + S S + S 2
Total 6 5 1 0 4 -1
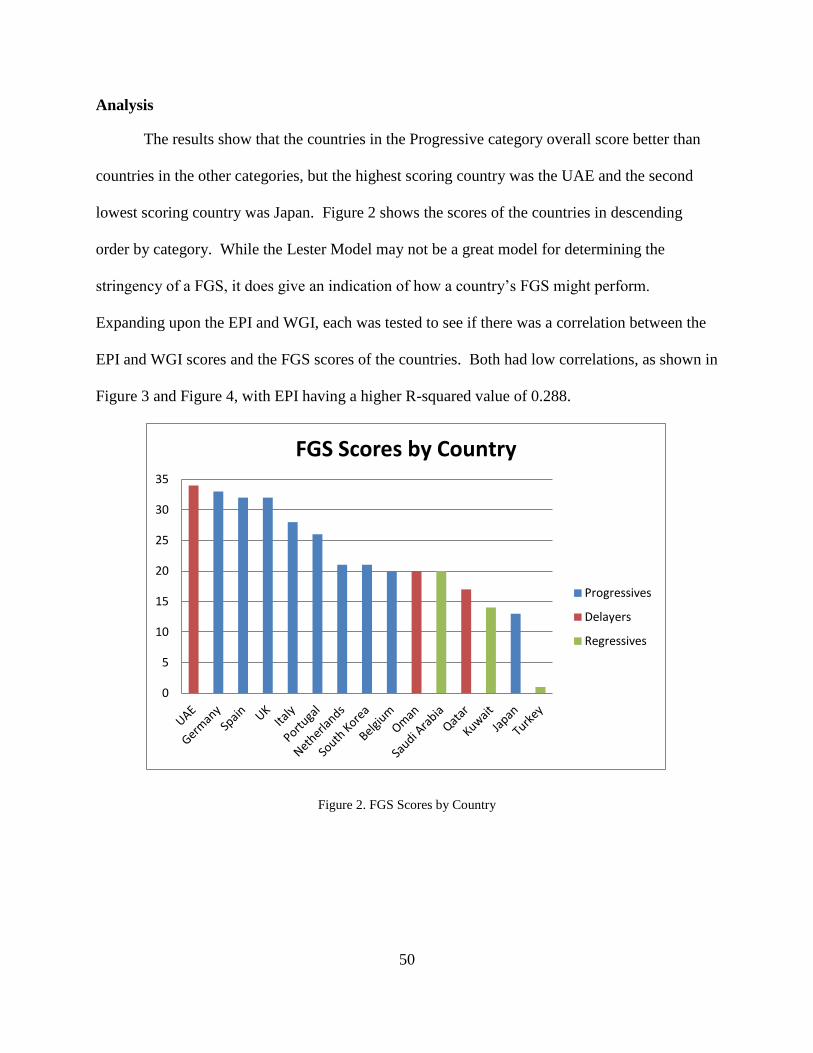
50
Analysis
The results show that the countries in the Progressive category overall score better than
countries in the other categories, but the highest scoring country was the UAE and the second
lowest scoring country was Japan. Figure 2 shows the scores of the countries in descending
order by category. While the Lester Model may not be a great model for determining the
stringency of a FGS, it does give an indication of how a country’s FGS might perform.
Expanding upon the EPI and WGI, each was tested to see if there was a correlation between the
EPI and WGI scores and the FGS scores of the countries. Both had low correlations, as shown in
Figure 3 and Figure 4, with EPI having a higher R-squared value of 0.288.
Figure 2. FGS Scores by Country
0
5
10
15
20
25
30
35
FGS Scores by Country
Progressives
Delayers
Regressives

51
Figure 3. Correlation plot between EPI and FGS Scores
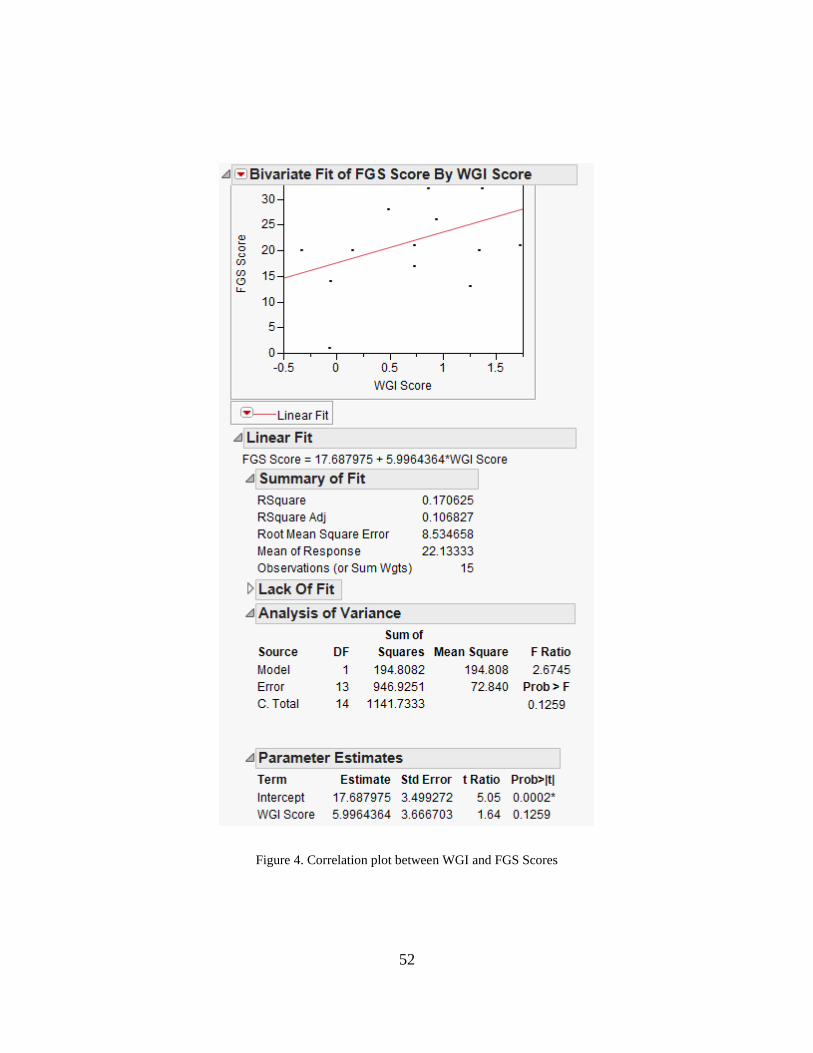
52
Figure 4. Correlation plot between WGI and FGS Scores

53
Summary
This chapter contained the results of this analysis and the outcomes of the FGS
comparisons. None of the countries in this analysis plotted into the Strugglers category while 9
of the 15 countries were placed in the Progressives category. The analysis of the FGS did not
show a strong relationship between FGS scores and Lester Model categories. However, the
analysis did highlight a number of errors in the FGS.
54
V. Conclusions and Recommendations
Chapter Overview
This research investigated if there were relationships between how stringent the different
FGS were and a country’s position in the Lester Model. This chapter will discuss the overall
conclusions and findings of the research. The next section will review the findings and what was
discovered during the analysis. Following that, the next section will discuss the significance of
the research. The following section will then discuss future research streams from this research.
Review of Findings
The different Final Governing Standards did not perform as was expected in the Lester
Model. While the Progressive category did score higher than the other categories on average and
the Regressives score was the lowest, there was no strong relationship that showed that FGS
comparison scores matched with the Lester Model categories. A country in the Delayers
category had the highest FGS score while a country in the Progressives category had the second
lowest FGS score. The analysis did identify a number of errors in the different FGS that should
have been fixed before publication. The correlation between the EPI and FGS was low, but it
did account for almost 1/3 of the variation in the FGS score. This doesn’t predict the final FGS
stringency, but still could be used as a frame of reference when drafting new FGS.
When this research was first started, the FGS websites were not updated and did not
work. The links in the database were broken and even after the links were fixed by the website
managers, many of the FGS were dated prior to the OEBGD. In order to get a hold of the most
recent FGS for each country, the responsible commands were contacted and the environmental
managers supplied the necessary documents. Since the completion of this thesis effort, the
55
DENIX website has now been completely updated and the most current FGS are all available on
the website.
Significance of Research
While the research didn’t provide the predictive model as anticipated, the comparisons
did highlight a number of errors in the FGS. There were a total of fifteen errors found across six
FGS which is a fairly small amount for the sheer volume of writing. Of the errors, only 4 of
them are significant because they deal with MCLs or minimum requirements. The other 11 errors
are spelling or formatting mistakes that of no real consequence. The significant errors are
contradictory statements (2 – Kuwait, 1 – Netherlands, and 1 – Oman) where the text has more
than one requirement or conflicting requirements. This could cause confusion or a non-
compliance situation if someone uses the incorrect requirement without knowing that there was a
more stringent requirement elsewhere in the chapter. The other mistakes are either spelling or
formatting mistakes and in the cases where the FGS has incorrect information, it is obvious
enough that there is a mistake. In these cases, anyone looking for that information in the FGS
should contact the responsible EEA for clarification.
While the model developed in this research doesn’t have a strong predictive capability, it
can still be useful to the drafters of future FGS to understand where a country falls in the Lester
Model or to know what the country’s EPI and WGI scores are. Not all countries (especially
smaller ones) have an EPI score, so using the EPI score as a starting reference point for the
stringency of a FGS is limited. Table 13 shows countries in the Asia-Pacific region that the U.S.
does not have current FGS with and have both EPI and WGI scores. Unlike the countries that
the U.S. currently has FGS with, there are no Delayers in the Asia-Pacific region but a number of
countries in the Strugglers category. Using the EPI as a preliminary measure of FGS stringency
56
could be useful to drafters as a reference point should the need arise to create a new FGS with
any of these countries.
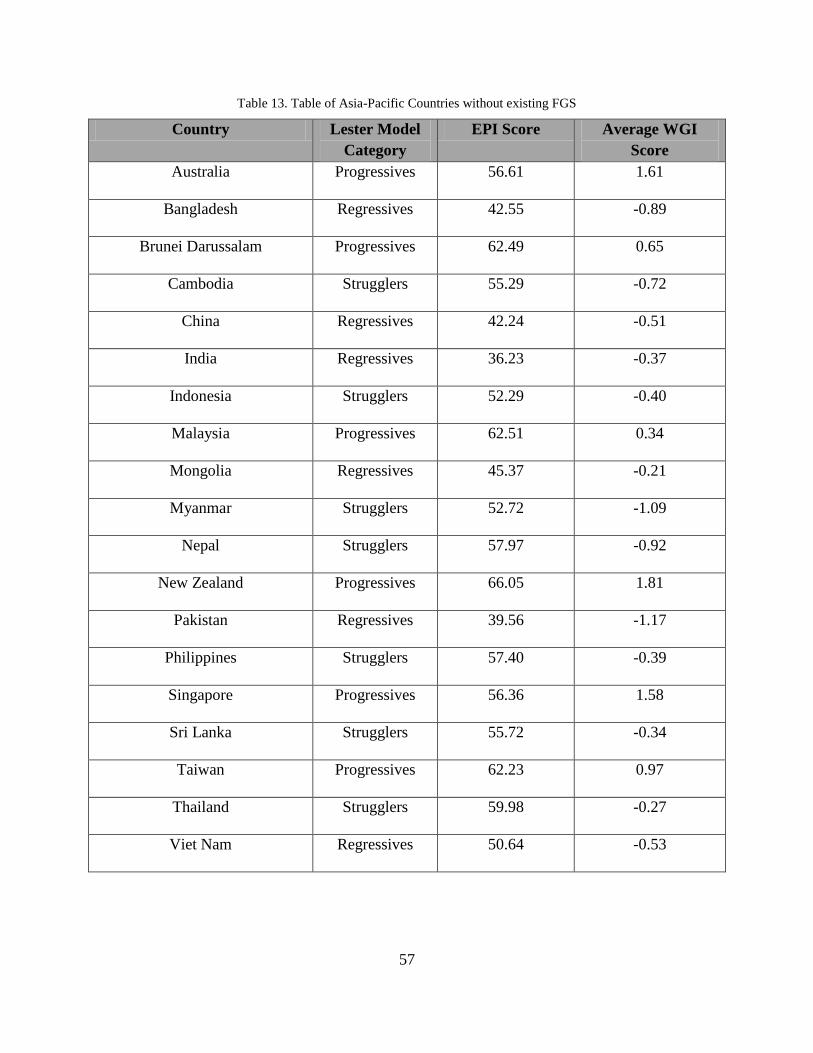
57
Table 13. Table of Asia-Pacific Countries without existing FGS
Country Lester Model
Category
EPI Score Average WGI
Score
Australia Progressives 56.61 1.61
Bangladesh Regressives 42.55 -0.89
Brunei Darussalam Progressives 62.49 0.65
Cambodia Strugglers 55.29 -0.72
China Regressives 42.24 -0.51
India Regressives 36.23 -0.37
Indonesia Strugglers 52.29 -0.40
Malaysia Progressives 62.51 0.34
Mongolia Regressives 45.37 -0.21
Myanmar Strugglers 52.72 -1.09
Nepal Strugglers 57.97 -0.92
New Zealand Progressives 66.05 1.81
Pakistan Regressives 39.56 -1.17
Philippines Strugglers 57.40 -0.39
Singapore Progressives 56.36 1.58
Sri Lanka Strugglers 55.72 -0.34
Taiwan Progressives 62.23 0.97
Thailand Strugglers 59.98 -0.27
Viet Nam Regressives 50.64 -0.53
58
Recommendations for Future Research
Future research could follow the methodology of Lt Col Smith and interview the
environmental offices at each installation that falls under a FGS. The experience of the
personnel responsible for environmental compliance in each of these countries may validate the
position of these countries in the Lester Model. Interviews could capture important factors that
influence the drafting of FGS that are not captured in the document itself. Expanding on that
possibility, another research opportunity would be to conduct interviews with people who are
heavily involved in the drafting and upkeep of FGS to determine what factors influence FGS
stringency the most.
A third potential research project would be research if the constant upkeep of FGS is an
activity that is worth keeping. While the OEBGD is supposed to be the baseline environmental
standards for U.S. forces, there are contingency environments that operate under separate
environmental agreements that may not be as stringent as the OEBGD. Some of these
contingencies environments have been active for the better part of a decade and yet do not
require a FGS because of the agreement between the U.S. and the Host Nation.
Summary
This research compared the requirements and criteria of the different active FGS that the
U.S. government has with foreign nations. The purpose was to determine if there were any
relationships between the FGS scores and the location of the country in a model of
environmental performance and government capability. While the model used in this research
did not show a strong relationship with the FGS scores, the comparisons did highlight a number
of issues with the FGS. Specifically, a number of errors spread throughout multiple FGS that
need to be addressed.
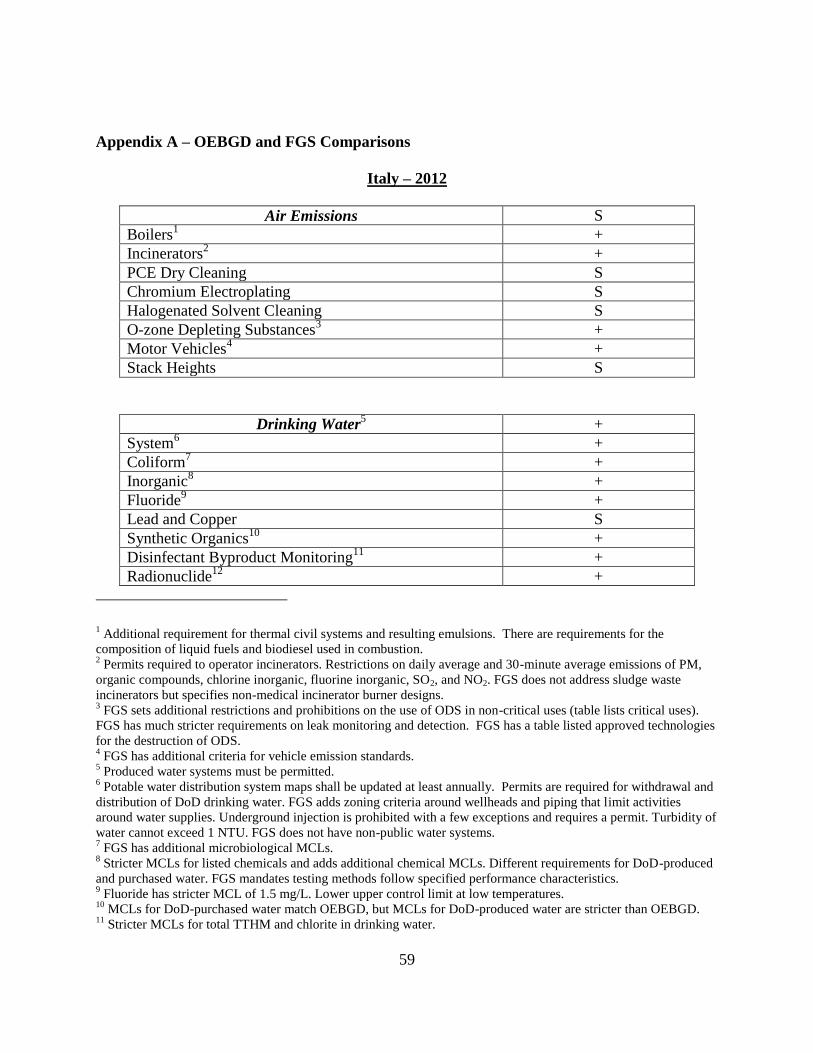
59
Appendix A – OEBGD and FGS Comparisons
Italy – 2012
Air Emissions S
Boilers1 +
Incinerators2 +
PCE Dry Cleaning
S
Chromium Electroplating S
Halogenated Solvent Cleaning S
O-zone Depleting Substances3 +
Motor Vehicles4 +
Stack Heights S
Drinking Water5 +
System6 +
Coliform7 +
Inorganic8 +
Fluoride9 +
Lead and Copper S
Synthetic Organics10
+
Disinfectant Byproduct Monitoring11
+
Radionuclide12
+
1 Additional requirement for thermal civil systems and resulting emulsions. There are requirements for the
composition of liquid fuels and biodiesel used in combustion. 2 Permits required to operator incinerators. Restrictions on daily average and 30-minute average emissions of PM,
organic compounds, chlorine inorganic, fluorine inorganic, SO2, and NO2. FGS does not address sludge waste
incinerators but specifies non-medical incinerator burner designs. 3 FGS sets additional restrictions and prohibitions on the use of ODS in non-critical uses (table lists critical uses).
FGS has much stricter requirements on leak monitoring and detection. FGS has a table listed approved technologies
for the destruction of ODS. 4 FGS has additional criteria for vehicle emission standards.
5 Produced water systems must be permitted.
6 Potable water distribution system maps shall be updated at least annually. Permits are required for withdrawal and
distribution of DoD drinking water. FGS adds zoning criteria around wellheads and piping that limit activities
around water supplies. Underground injection is prohibited with a few exceptions and requires a permit. Turbidity of
water cannot exceed 1 NTU. FGS does not have non-public water systems. 7 FGS has additional microbiological MCLs.
8 Stricter MCLs for listed chemicals and adds additional chemical MCLs. Different requirements for DoD-produced
and purchased water. FGS mandates testing methods follow specified performance characteristics. 9 Fluoride has stricter MCL of 1.5 mg/L. Lower upper control limit at low temperatures.
10 MCLs for DoD-purchased water match OEBGD, but MCLs for DoD-produced water are stricter than OEBGD.
11 Stricter MCLs for total TTHM and chlorite in drinking water.

60
Wastewater13
+
Effluent Limitation direct conventional14
+
Effluent Limitation non-categorical indirect15
+
Effluent Limitation categorical dischargers16
+
Storm water17
+
Septic18
+
Sludge S
Hazardous Materials19
+
Storage and Handling S
Dispensing Areas
S
Shipment
S
Master Listing S
Material Labeling and MSDS S
Hazardous Material Management S
Hazardous Waste20
+
HW Generators S
Accumulation Points S
Storage Areas21
+
Containers22
+
Record Keeping23
+
Contingency Plan S
Tank Systems24
+
Used Oil and Lead Acid Batteries25
+
12 Additional requirements for tritium and total indicative dose.
13 Additional sections of reclaimed wastewater and complaint system.
14 Further restrictions on regional discharges and discharges to sewers, soils, or shallow subsoils.
15 Higher pH of wastewater is required. Additional section on pumped wastewater and using a grinder on organic
food wastes. 16
FGS has discharge standards for pollutants, regardless of the discharge amounts. Further requirements on
monitoring for pollutants. 17
Regional requirements for storm water discharges. 18
All septic systems have to be permitted. 19
An additional section on the use of particular substances. 20
Additional criteria for special and hazardous special waste. 21
Within some exceptions, HWSA (or Temporary WSA) require permits for operation. Additional requirements for
TWSA. 22
Stricter requirement for secondary containment. 23
Records must be kept for at least 5 years. 24
Additional requirement for AST to have a containment system that meets specified volumes.
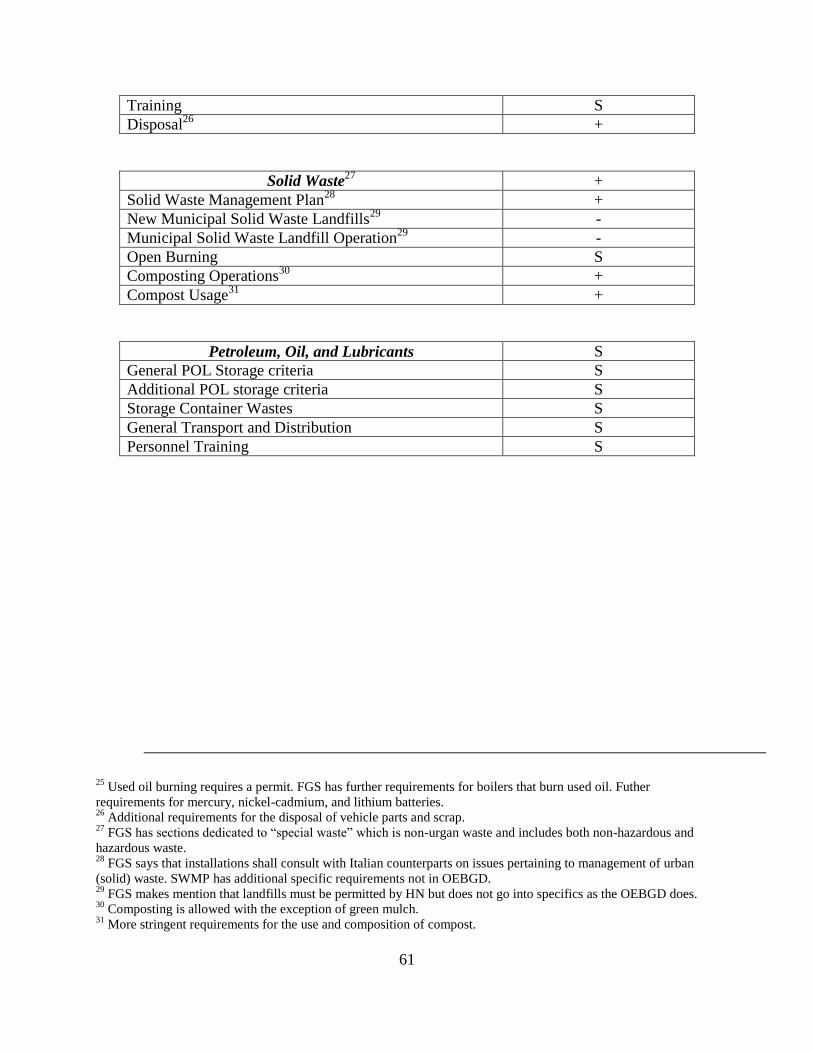
61
Training S
Disposal26
+
Solid Waste27
+
Solid Waste Management Plan28
+
New Municipal Solid Waste Landfills29
-
Municipal Solid Waste Landfill Operation29
-
Open Burning S
Composting Operations30
+
Compost Usage31
+
Petroleum, Oil, and Lubricants S
General POL Storage criteria S
Additional POL storage criteria
S
Storage Container Wastes S
General Transport and Distribution S
Personnel Training
S
25 Used oil burning requires a permit. FGS has further requirements for boilers that burn used oil. Futher
requirements for mercury, nickel-cadmium, and lithium batteries. 26
Additional requirements for the disposal of vehicle parts and scrap. 27
FGS has sections dedicated to “special waste” which is non-urgan waste and includes both non-hazardous and
hazardous waste. 28
FGS says that installations shall consult with Italian counterparts on issues pertaining to management of urban
(solid) waste. SWMP has additional specific requirements not in OEBGD. 29
FGS makes mention that landfills must be permitted by HN but does not go into specifics as the OEBGD does. 30
Composting is allowed with the exception of green mulch. 31
More stringent requirements for the use and composition of compost.

62
Turkey – 2008
Air Emissions S
Boilers S
Incinerators S
PCE Dry Cleaning S
Chromium Electroplating S
Halogenated Solvent Cleaning S
O-zone Depleting Substances S
Motor Vehicles S
Stack Heights S
Drinking Water S
System S
Coliform S
Inorganic S
Fluoride S
Lead and Copper S
Synthetic Organics S
Disinfectant Byproduct Monitoring S
Radionuclide S
Wastewater S
Effluent Limitation conv S
Effluent Limitation non-cate indirect1 S
Effluent Limitation cate dischargers S
Storm Water S
Septic S
Sludge S
Hazardous Materials S
Storage and Handling S
Dispensing Areas S
Shipment S
Master Listing S
Material Safety Data Sheets S
HAZMAT management S
Hazardous Waste2 +
1 Same error as OEBGD.

63
HW Generators S
Accumulation Points S
Storage Areas S
Containers S
Record Keeping S
Contingency Plan S
Tank Systems S
Used Oil and Lead Acid Batteries S
Training S
Disposal S
Solid Waste S
Solid Waste Management Plan S
New Municipal Solid Waste Landfills S
Municipal Solid Waste Landfill Operation S
Open Burning S
Composting Operations S
Compost Usage S
Petroleum, Oil, and Lubricants S
General POL Storage criteria S
Additional POL storage criteria
S
Storage Container Wastes S
General Transport and Distribution S
Personnel Training
S
2 Installations shall develop and use hazwaste minimization plans to reduce the amount of hazardous waste
generated.
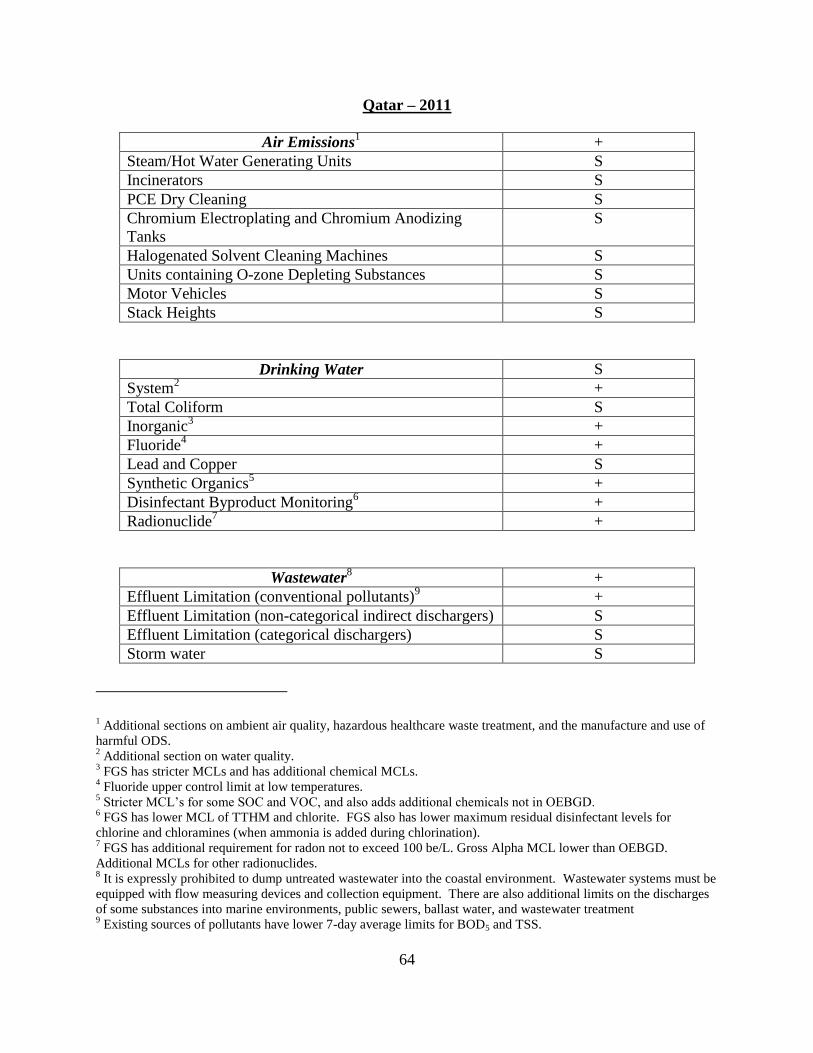
64
Qatar – 2011
Air Emissions1 +
Steam/Hot Water Generating Units S
Incinerators S
PCE Dry Cleaning
S
Chromium Electroplating and Chromium Anodizing
Tanks
S
Halogenated Solvent Cleaning Machines S
Units containing O-zone Depleting Substances S
Motor Vehicles S
Stack Heights S
Drinking Water S
System2 +
Total Coliform S
Inorganic3 +
Fluoride4 +
Lead and Copper S
Synthetic Organics5 +
Disinfectant Byproduct Monitoring6 +
Radionuclide7
+
Wastewater8 +
Effluent Limitation (conventional pollutants)9 +
Effluent Limitation (non-categorical indirect dischargers)
S
Effluent Limitation (categorical dischargers) S
Storm water
S
1 Additional sections on ambient air quality, hazardous healthcare waste treatment, and the manufacture and use of
harmful ODS. 2 Additional section on water quality.
3 FGS has stricter MCLs and has additional chemical MCLs.
4 Fluoride upper control limit at low temperatures.
5 Stricter MCL’s for some SOC and VOC, and also adds additional chemicals not in OEBGD.
6 FGS has lower MCL of TTHM and chlorite. FGS also has lower maximum residual disinfectant levels for
chlorine and chloramines (when ammonia is added during chlorination). 7 FGS has additional requirement for radon not to exceed 100 be/L. Gross Alpha MCL lower than OEBGD.
Additional MCLs for other radionuclides. 8 It is expressly prohibited to dump untreated wastewater into the coastal environment. Wastewater systems must be
equipped with flow measuring devices and collection equipment. There are also additional limits on the discharges
of some substances into marine environments, public sewers, ballast water, and wastewater treatment 9 Existing sources of pollutants have lower 7-day average limits for BOD5 and TSS.

65
Septic S
Sludge S
Hazardous Materials10
+
Storage and Handling11
+
Dispensing Areas
S
Shipment/Transportation12
+
Master Listing S
Material Labeling and MSDS S
Hazardous Material Management S
Hazardous Waste S
HW Generators
S
Accumulation Points S
Storage Areas S
Containers
S
Record Keeping13
+
Contingency Plan S
Tank Systems
S
Used Oil and Lead Acid Batteries
S
Training S
Disposal14
+
Solid Waste15
+
Solid Waste Management Plan16
+
New Municipal Solid Waste Landfills
S
Municipal Solid Waste Landfill Operation
S
Open Burning S
Composting Operations
S
Compost Usage S
10 Additional sections and requirements.
11 FGS has minimum separation distances from the public and other hazardous chemicals according to their hazard
classification. 12
Additional requirements for tankers when transporting hazardous materials by land. 13
Manifests and copies of all transportation documents must be kept for five years. Waste
Analysis/Characterization Records must be kept at least 5 years after the closure of a HWSA. 14
Landfills must be approved by CENTCOM/CCJ4E and must be designed to prevent leakage of wastes to soil
layers, ground water, or surface water, and that no dispersal due to winds would take place. 15
Additional section on wastewater sludge. 16
FGS expressly prohibits dumping wastes in particular areas of concern. Also no dumping of liquids that can
cause pollution in HN waters, trash in transport must be covered.
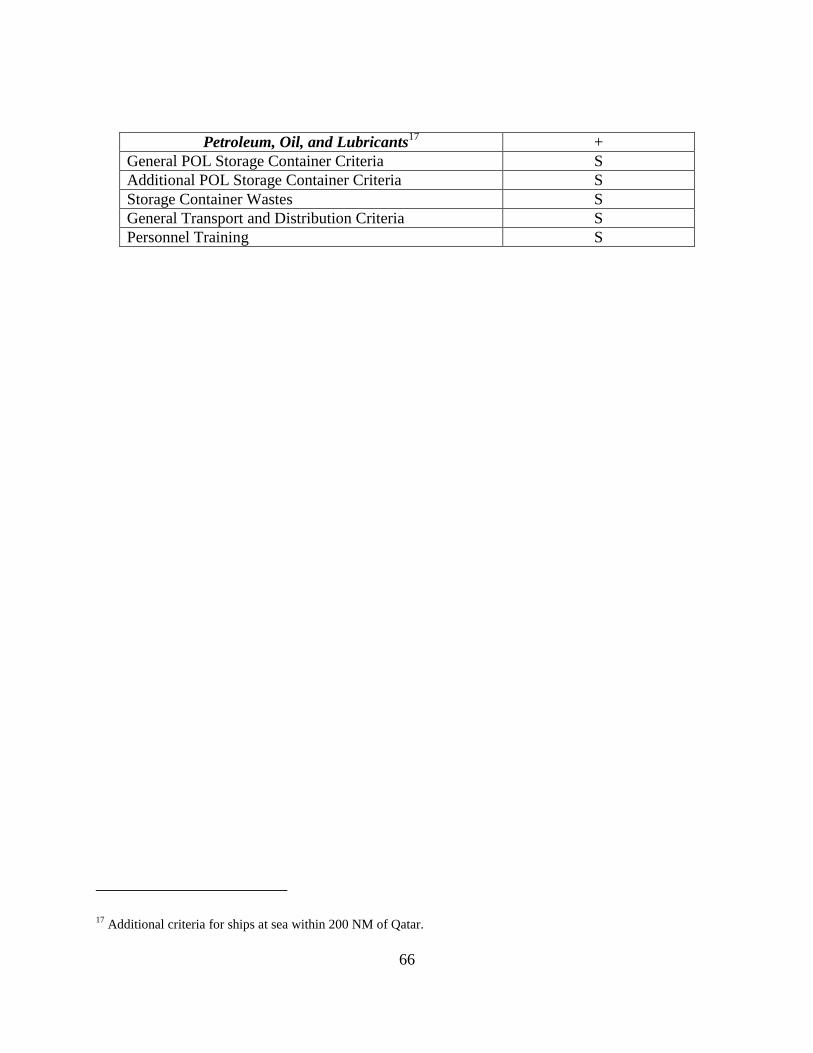
66
Petroleum, Oil, and Lubricants17
+
General POL Storage Container Criteria S
Additional POL Storage Container Criteria
S
Storage Container Wastes S
General Transport and Distribution Criteria S
Personnel Training
S
17 Additional criteria for ships at sea within 200 NM of Qatar.
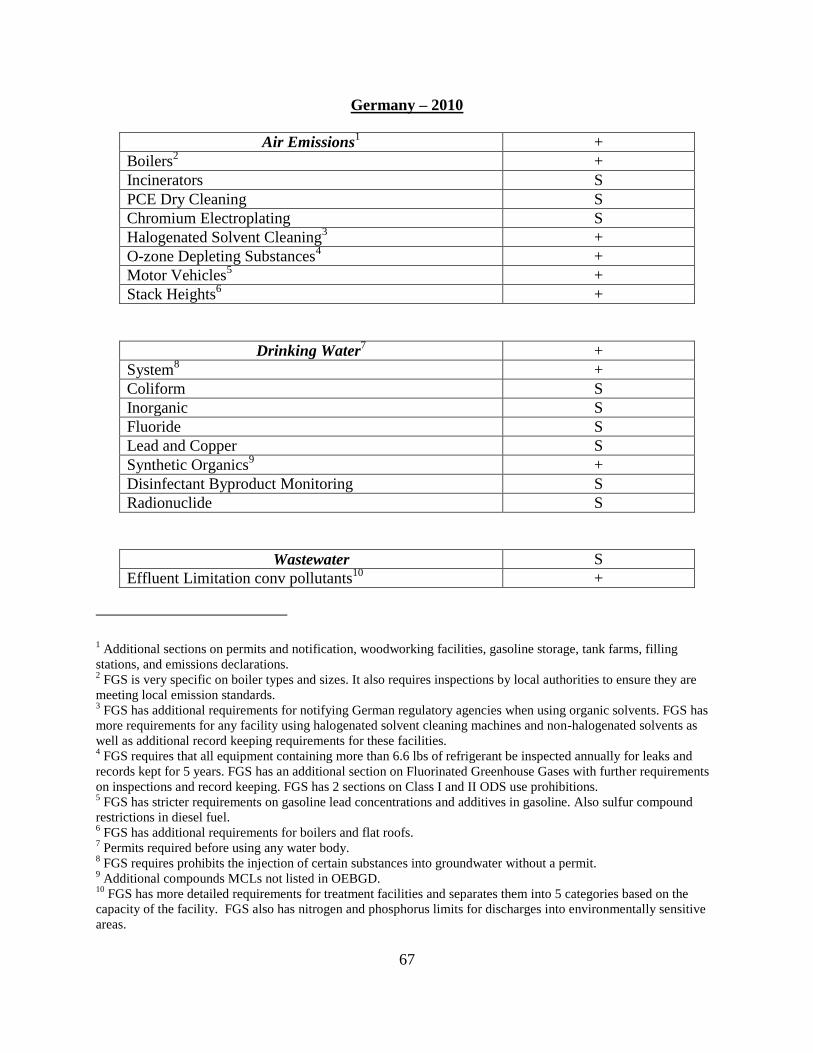
67
Germany – 2010
Air Emissions1 +
Boilers2 +
Incinerators S
PCE Dry Cleaning S
Chromium Electroplating S
Halogenated Solvent Cleaning3 +
O-zone Depleting Substances4 +
Motor Vehicles5 +
Stack Heights6
+
Drinking Water7 +
System8
+
Coliform S
Inorganic S
Fluoride S
Lead and Copper S
Synthetic Organics9 +
Disinfectant Byproduct Monitoring S
Radionuclide S
Wastewater S
Effluent Limitation conv pollutants10
+
1 Additional sections on permits and notification, woodworking facilities, gasoline storage, tank farms, filling
stations, and emissions declarations. 2 FGS is very specific on boiler types and sizes. It also requires inspections by local authorities to ensure they are
meeting local emission standards. 3 FGS has additional requirements for notifying German regulatory agencies when using organic solvents. FGS has
more requirements for any facility using halogenated solvent cleaning machines and non-halogenated solvents as
well as additional record keeping requirements for these facilities. 4 FGS requires that all equipment containing more than 6.6 lbs of refrigerant be inspected annually for leaks and
records kept for 5 years. FGS has an additional section on Fluorinated Greenhouse Gases with further requirements
on inspections and record keeping. FGS has 2 sections on Class I and II ODS use prohibitions. 5 FGS has stricter requirements on gasoline lead concentrations and additives in gasoline. Also sulfur compound
restrictions in diesel fuel. 6 FGS has additional requirements for boilers and flat roofs.
7 Permits required before using any water body.
8 FGS requires prohibits the injection of certain substances into groundwater without a permit.
9 Additional compounds MCLs not listed in OEBGD.
10 FGS has more detailed requirements for treatment facilities and separates them into 5 categories based on the
capacity of the facility. FGS also has nitrogen and phosphorus limits for discharges into environmentally sensitive
areas.
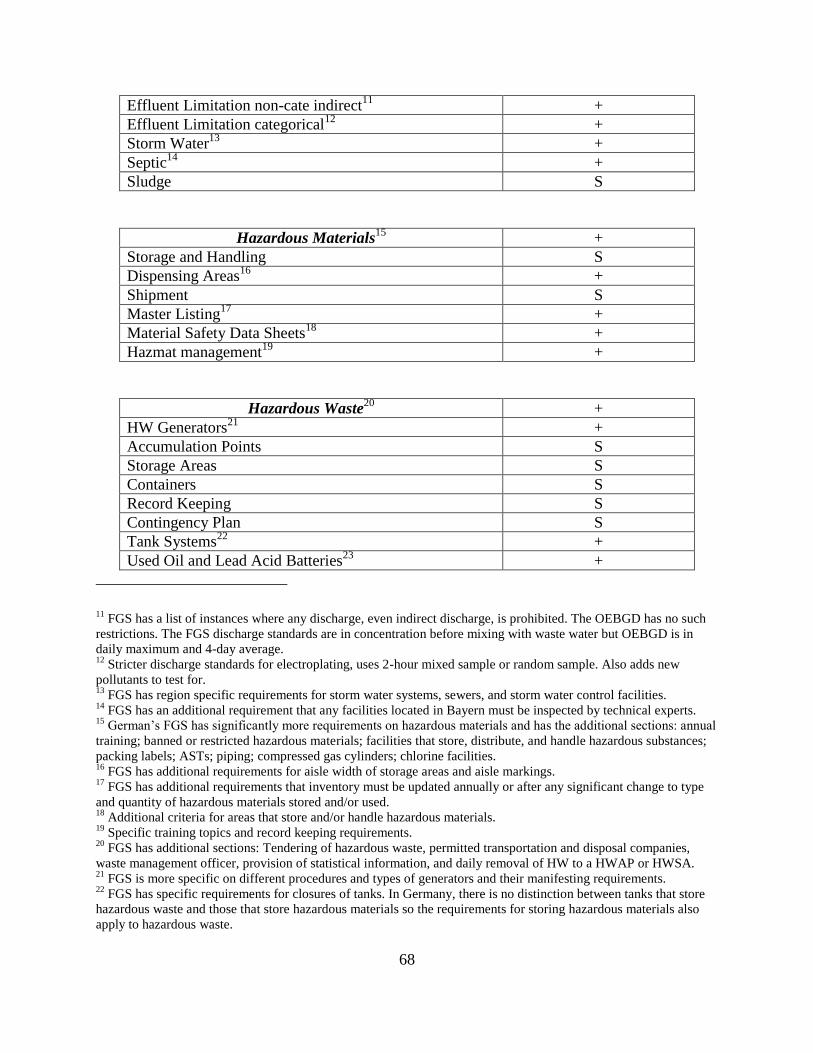
68
Effluent Limitation non-cate indirect11
+
Effluent Limitation categorical12
+
Storm Water13
+
Septic14
+
Sludge S
Hazardous Materials15
+
Storage and Handling
S
Dispensing Areas16
+
Shipment
S
Master Listing17
+
Material Safety Data Sheets18
+
Hazmat management19
+
Hazardous Waste20
+
HW Generators21
+
Accumulation Points S
Storage Areas S
Containers S
Record Keeping S
Contingency Plan S
Tank Systems22
+
Used Oil and Lead Acid Batteries23
+
11 FGS has a list of instances where any discharge, even indirect discharge, is prohibited. The OEBGD has no such
restrictions. The FGS discharge standards are in concentration before mixing with waste water but OEBGD is in
daily maximum and 4-day average. 12
Stricter discharge standards for electroplating, uses 2-hour mixed sample or random sample. Also adds new
pollutants to test for. 13
FGS has region specific requirements for storm water systems, sewers, and storm water control facilities. 14
FGS has an additional requirement that any facilities located in Bayern must be inspected by technical experts. 15
German’s FGS has significantly more requirements on hazardous materials and has the additional sections: annual
training; banned or restricted hazardous materials; facilities that store, distribute, and handle hazardous substances;
packing labels; ASTs; piping; compressed gas cylinders; chlorine facilities. 16
FGS has additional requirements for aisle width of storage areas and aisle markings. 17
FGS has additional requirements that inventory must be updated annually or after any significant change to type
and quantity of hazardous materials stored and/or used. 18
Additional criteria for areas that store and/or handle hazardous materials. 19
Specific training topics and record keeping requirements. 20
FGS has additional sections: Tendering of hazardous waste, permitted transportation and disposal companies,
waste management officer, provision of statistical information, and daily removal of HW to a HWAP or HWSA. 21
FGS is more specific on different procedures and types of generators and their manifesting requirements. 22
FGS has specific requirements for closures of tanks. In Germany, there is no distinction between tanks that store
hazardous waste and those that store hazardous materials so the requirements for storing hazardous materials also
apply to hazardous waste.

69
Training S
Disposal S
Solid Waste24
+
Solid Waste Management Plan25
+
New Municipal Solid Waste Landfills26
+
Municipal Solid Waste Landfill Operation27
+
Open Burning S
Composting Operations28
+
Compost Usage29
+
Petroleum, Oil, and Lubricants30
+
General POL Storage Container Criteria31
+
Additional POL Storage Container Criteria32
+
Storage Container Wastes S
General Transport and Distribution Criteria33
+
Personnel Training
S
23 FGS has more requirements for the uses of used oil.
24 The SW chapter has additional sections: Recordkeeping; Shipment of Waste; Waste Management Criteria;
Reporting Criteria; Disposal of Waste Meat, Animal Carcasses, and Animal Parts; and Solid Waste Incinerators. 25
The FGS requirements for a SWMP is very specific and must detail how the installation plans to deal with waste
in the order of preference of waste avoidance, waste minimization, waste recovery, incineration, and disposal in a
landfill. It also has the additional criteria sections of store and disposal of scrap vehicles, biodegradable waste,
electrical and electronic equipment, and commercial solid waste. 26
New or Expanded landfills must be approved through German authorities and a planning assessment is required
before approval. 27
Additional recurring training is required for all personnel associated with operating landfills. Any gas emitted
from the MSWLF has to be collected and recovered and potential migration of landfill gas towards structures needs
to be measured. 28
FGS requires keeping records of temperature curves, turning times (aerobic), and loading intervals for 5 years. 29
FGS sets limits on the amount of compost used and has lower contaminate concentration levels than OEBGD.
FGS puts restrictions on compost use in certain areas of the country and forested areas. 30
FGS has additional sections on regional filling stations in Hessen. 31
Secondary containment must be at least 10% of total content of all tanks or entire contents of largest single tank.
Drainage areas are not allowed to have drain outlets unless permitted by HN authorities. 32
FGS requires containment at loading/unloading areas, eliminates the clause if it is reasonable expected to cause a
sheen on waters of the HN – this eliminates implied statement about only necessary if there is a chance of sheen
entering waters. 33
FGS has additional requirements for offsite pipelines and POL storage facilities part of the distribution network.
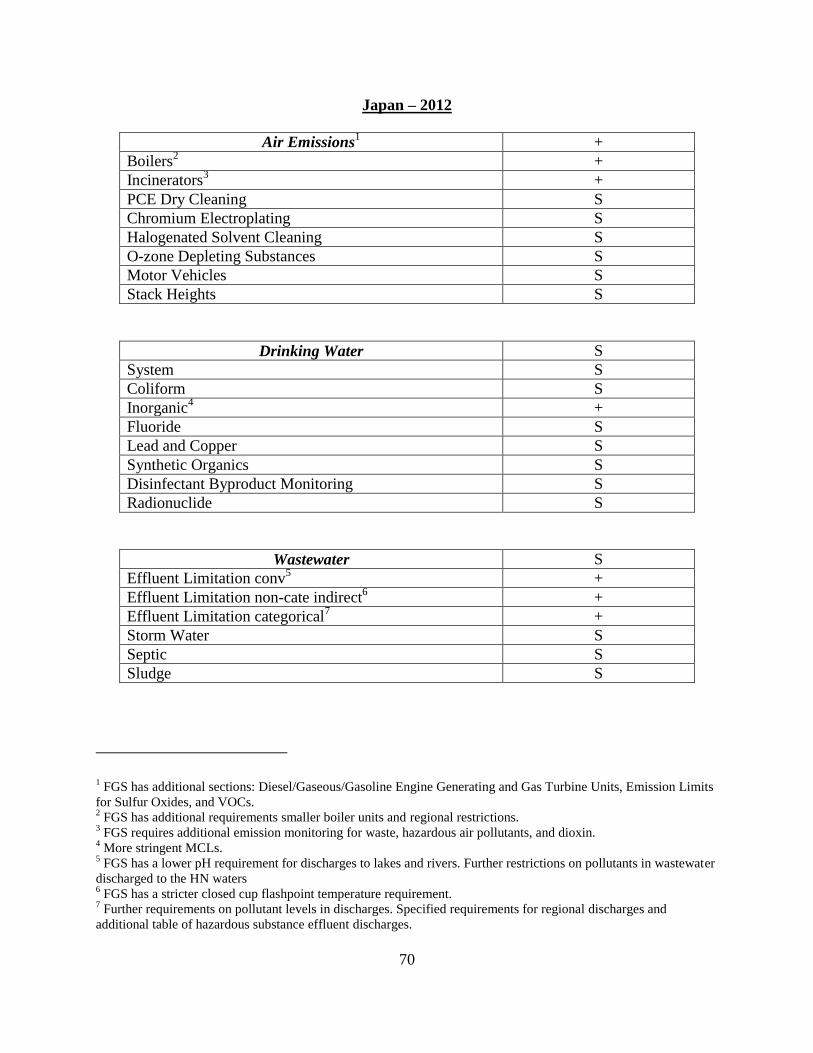
70
Japan – 2012
Air Emissions1 +
Boilers2 +
Incinerators3 +
PCE Dry Cleaning S
Chromium Electroplating S
Halogenated Solvent Cleaning S
O-zone Depleting Substances S
Motor Vehicles S
Stack Heights S
Drinking Water S
System S
Coliform S
Inorganic4 +
Fluoride S
Lead and Copper S
Synthetic Organics S
Disinfectant Byproduct Monitoring S
Radionuclide S
Wastewater S
Effluent Limitation conv5 +
Effluent Limitation non-cate indirect6 +
Effluent Limitation categorical7 +
Storm Water S
Septic S
Sludge S
1 FGS has additional sections: Diesel/Gaseous/Gasoline Engine Generating and Gas Turbine Units, Emission Limits
for Sulfur Oxides, and VOCs. 2 FGS has additional requirements smaller boiler units and regional restrictions.
3 FGS requires additional emission monitoring for waste, hazardous air pollutants, and dioxin.
4 More stringent MCLs.
5 FGS has a lower pH requirement for discharges to lakes and rivers. Further restrictions on pollutants in wastewater
discharged to the HN waters 6 FGS has a stricter closed cup flashpoint temperature requirement.
7 Further requirements on pollutant levels in discharges. Specified requirements for regional discharges and
additional table of hazardous substance effluent discharges.
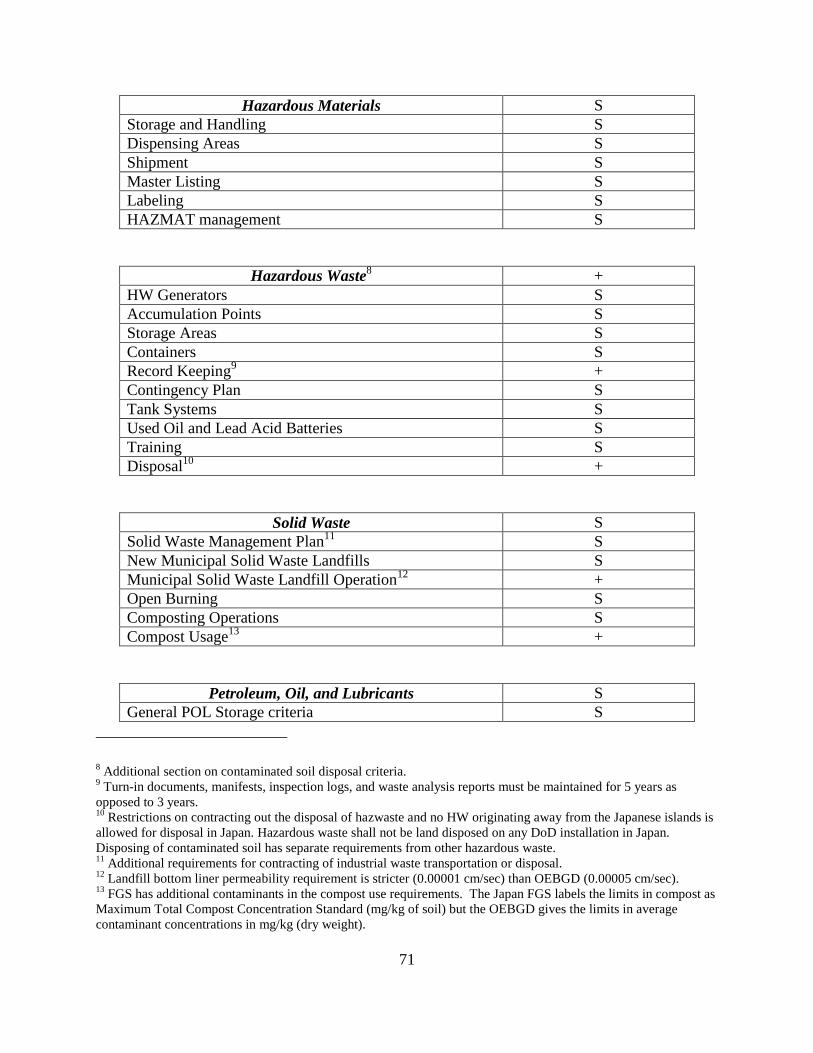
71
Hazardous Materials S
Storage and Handling S
Dispensing Areas S
Shipment S
Master Listing S
Labeling S
HAZMAT management S
Hazardous Waste8 +
HW Generators S
Accumulation Points S
Storage Areas S
Containers S
Record Keeping9 +
Contingency Plan S
Tank Systems S
Used Oil and Lead Acid Batteries S
Training S
Disposal10
+
Solid Waste S
Solid Waste Management Plan11
S
New Municipal Solid Waste Landfills S
Municipal Solid Waste Landfill Operation12
+
Open Burning S
Composting Operations S
Compost Usage13
+
Petroleum, Oil, and Lubricants S
General POL Storage criteria S
8 Additional section on contaminated soil disposal criteria.
9 Turn-in documents, manifests, inspection logs, and waste analysis reports must be maintained for 5 years as
opposed to 3 years. 10
Restrictions on contracting out the disposal of hazwaste and no HW originating away from the Japanese islands is
allowed for disposal in Japan. Hazardous waste shall not be land disposed on any DoD installation in Japan.
Disposing of contaminated soil has separate requirements from other hazardous waste. 11
Additional requirements for contracting of industrial waste transportation or disposal. 12
Landfill bottom liner permeability requirement is stricter (0.00001 cm/sec) than OEBGD (0.00005 cm/sec). 13
FGS has additional contaminants in the compost use requirements. The Japan FGS labels the limits in compost as
Maximum Total Compost Concentration Standard (mg/kg of soil) but the OEBGD gives the limits in average
contaminant concentrations in mg/kg (dry weight).

72
Additional POL storage criteria
S
Storage Container Wastes S
General Transport and Distribution S
Personnel Training
S

73
South Korea – 2012
Air Emissions1 +
Boilers S
Incinerators2
+
PCE Dry Cleaning3
+
Chromium Electroplating S
Halogenated Solvent Cleaning S
O-zone Depleting Substances4
+
Motor Vehicles5 +
Stack Heights S
Drinking Water S
System6 +
Coliform7
-
Inorganic8
+
Fluoride
+
Lead and Copper9
+
Synthetic Organics S
Disinfectant Byproduct Monitoring S
Radionuclide10
+
Wastewater11
+
Effluent Limitation conv12
+
Effluent Limitation non-cate indirect13
+
Effluent Limitation cate dischargers14
+
Storm Water S
1 FGS has additional sections for gas stations and activities that emit air pollutants.
2 FGS has additional requirements for smaller incinerators as well as standards for offensive odors.
3 Also has requires compliance for machines with a rated capacity >= 30 kg.
4 FGS has more chemicals considered ODS.
5 FGS has additional requirements for inspection of vehicles and emission requirements.
6 Requirements specify how groundwater wells will be installed and constructed. Personnel operating DoD water
treatment facilities must be recertified every 3 years. Filtration required if water exceeds 1 NTU. 7 FGS stops listing coliform monitoring frequency populations greater than 50,000.
8 FGS has additional inorganic chemicals listed and has secondary MCLs.
9 FGS requires more monitoring for lead and copper but does not address populations greater than 100,000.
10 Additional MCLs for strontium-90 and tritium.
11 Additional sections on laboratory analysis and domestic garbage disposal units.
12 FGS does not specify what the effluent limitations are (30-day averages or single measurement) but there are
multiple requirements depending on locations and dates. Also limitations on phosphorous and coliform bacteria. 13
Discharges of wastewater cannot have pH above 9.0. 14
Additional industrial wastewater sources identified and more effluent requirements for pollutants.

74
Septic S
Sludge S
Hazardous Materials S
Storage and Handling S
Dispensing Areas S
Shipment S
Master Listing S
Material Safety Data Sheets S
HAZMAT management S
Hazardous Waste S
HW Generators15
+
Accumulation Points
S
Storage Areas
S
Containers S
Record Keeping
S
Contingency Plan S
Tank Systems16
+
Used Oil and Lead Acid Batteries17
+
Training S
Disposal18
+
Solid Waste19
+
Solid Waste Management Plan S
New Municipal Solid Waste Landfills S
Municipal Solid Waste Landfill Operation S
Open Burning S
Composting Operations S
Compost Usage S
15 FGS has additional statement that dry materials must be covered during transport and liquids must be contained to
prevent leakage or discharge. 16
Existing tank systems that don’t have secondary containment must be approved by the Executive Environmental
Agent. 17
Used oil burned for energy recovery cannot exceed 4,000 ppm total halogens 18
Additional section on wastes that are destined for disposal at ROK disposal facilities must be identified according
to criteria laid out in the FGS. ROK facilities also need to show standards for waste synthetic polymer and waste
paint and lacquer. 19
Additional sections on construction waste, prohibition of open dumping, and food waste management.
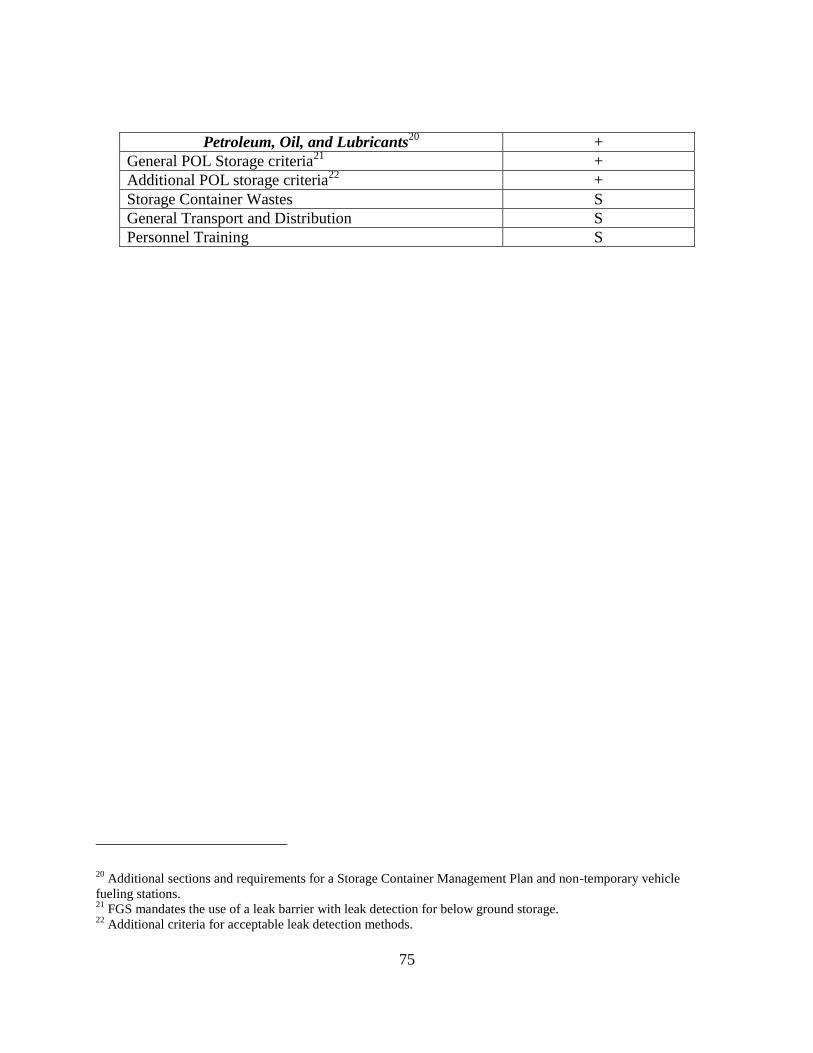
75
Petroleum, Oil, and Lubricants20
+
General POL Storage criteria21
+
Additional POL storage criteria22
+
Storage Container Wastes S
General Transport and Distribution S
Personnel Training
S
20 Additional sections and requirements for a Storage Container Management Plan and non-temporary vehicle
fueling stations. 21
FGS mandates the use of a leak barrier with leak detection for below ground storage. 22
Additional criteria for acceptable leak detection methods.

76
Saudi Arabia – 2010
Air Emissions1 +
Boilers2 +
Incinerators S
PCE Dry Cleaning
S
Chromium Electroplating S
Halogenated Solvent Cleaning S
O-zone Depleting Substances S
Motor Vehicles S
Stack Heights S
Drinking Water3 +
System4 +
Coliform S
Inorganic5 +
Fluoride6 +
Lead and Copper S
Synthetic Organics7 +
Disinfectant Byproduct Monitoring8
+
Radionuclide9
+
Wastewater10
+
Effluent Limitation direct discharge conv11
+
Effluent Limitation non-categorical indirect12
+
Effluent Limits categorical discharges S
Storm water
S
1 FGS sets ambient air quality standards for any operations that emit SO2, particulates, ODS, NO2, CO, H2S, or
fluorides. Additional requirement for emissions from heathcare waste facilities 2 FGS has more stringent requirements for NOx and PM.
3 Additional sections on bottled drinking water.
4 Additional section on water quality.
5 More stringent MCL for listed chemicals and adds MCLs for additional chemicals.
6 Stricter upper control limit for fluoride at low temperatures.
7 Adds additional chemical MCLs and has stricter MCLs for some of the listed organic chemicals and pesticides.
8 Maximum residual disinfectant level of 3.0 mg/L for combined total chlorine and (new requirement) of 0.5 mg/L
for chlorine for at least 30 minutes with a pH level < 5. 9 Stricter MCL for gross alpha.
10 Additional requirements section with further guidance on waste water treatment, dischargers, and ballast water
discharges. 11
Stricter BOD5 and TSS limits. Tables with discharge requirements. 12
No wastewater with pH above 10.0 is allowed to be discharged unless the DWTS is specifically designed to
handle it. Maximum limit of discharge of oil and grease is 120 mg/L. Tables with discharge requirements.
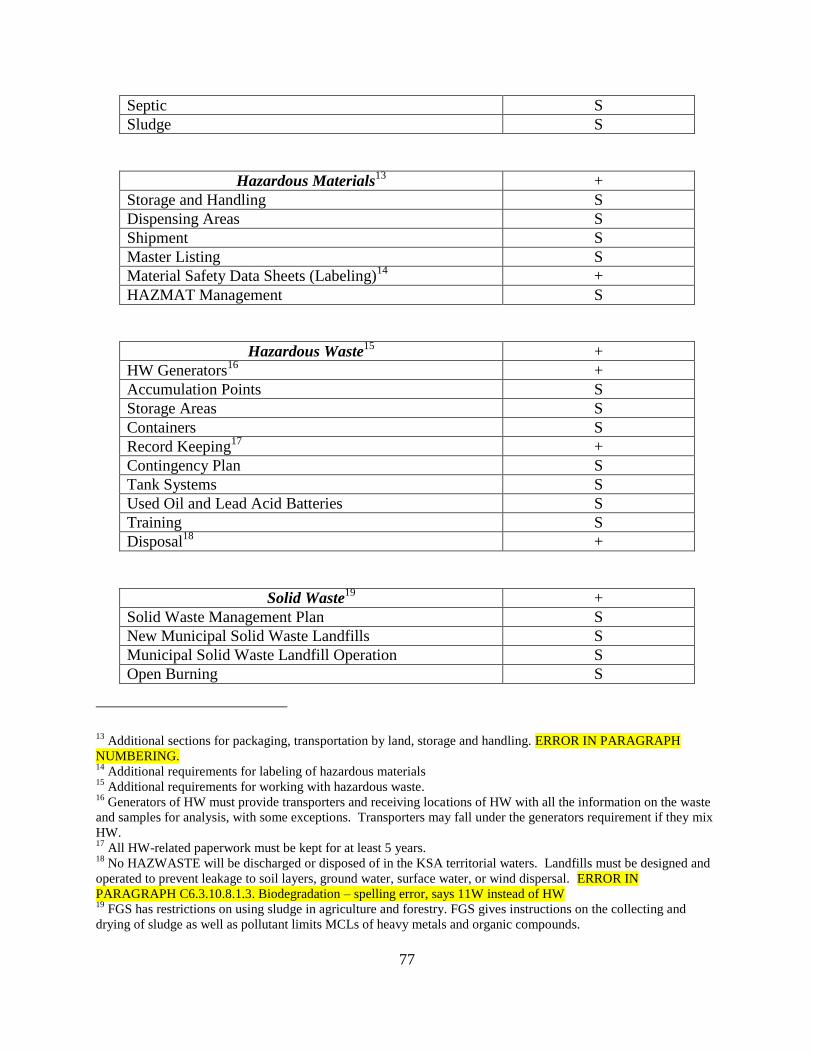
77
Septic S
Sludge S
Hazardous Materials13
+
Storage and Handling
S
Dispensing Areas
S
Shipment
S
Master Listing S
Material Safety Data Sheets (Labeling)14
+
HAZMAT Management S
Hazardous Waste15
+
HW Generators16
+
Accumulation Points S
Storage Areas S
Containers
S
Record Keeping17
+
Contingency Plan S
Tank Systems
S
Used Oil and Lead Acid Batteries
S
Training S
Disposal18
+
Solid Waste19
+
Solid Waste Management Plan S
New Municipal Solid Waste Landfills
S
Municipal Solid Waste Landfill Operation
S
Open Burning S
13 Additional sections for packaging, transportation by land, storage and handling. ERROR IN PARAGRAPH
NUMBERING. 14
Additional requirements for labeling of hazardous materials 15
Additional requirements for working with hazardous waste. 16
Generators of HW must provide transporters and receiving locations of HW with all the information on the waste
and samples for analysis, with some exceptions. Transporters may fall under the generators requirement if they mix
HW. 17
All HW-related paperwork must be kept for at least 5 years. 18
No HAZWASTE will be discharged or disposed of in the KSA territorial waters. Landfills must be designed and
operated to prevent leakage to soil layers, ground water, surface water, or wind dispersal. ERROR IN
PARAGRAPH C6.3.10.8.1.3. Biodegradation – spelling error, says 11W instead of HW 19
FGS has restrictions on using sludge in agriculture and forestry. FGS gives instructions on the collecting and
drying of sludge as well as pollutant limits MCLs of heavy metals and organic compounds.
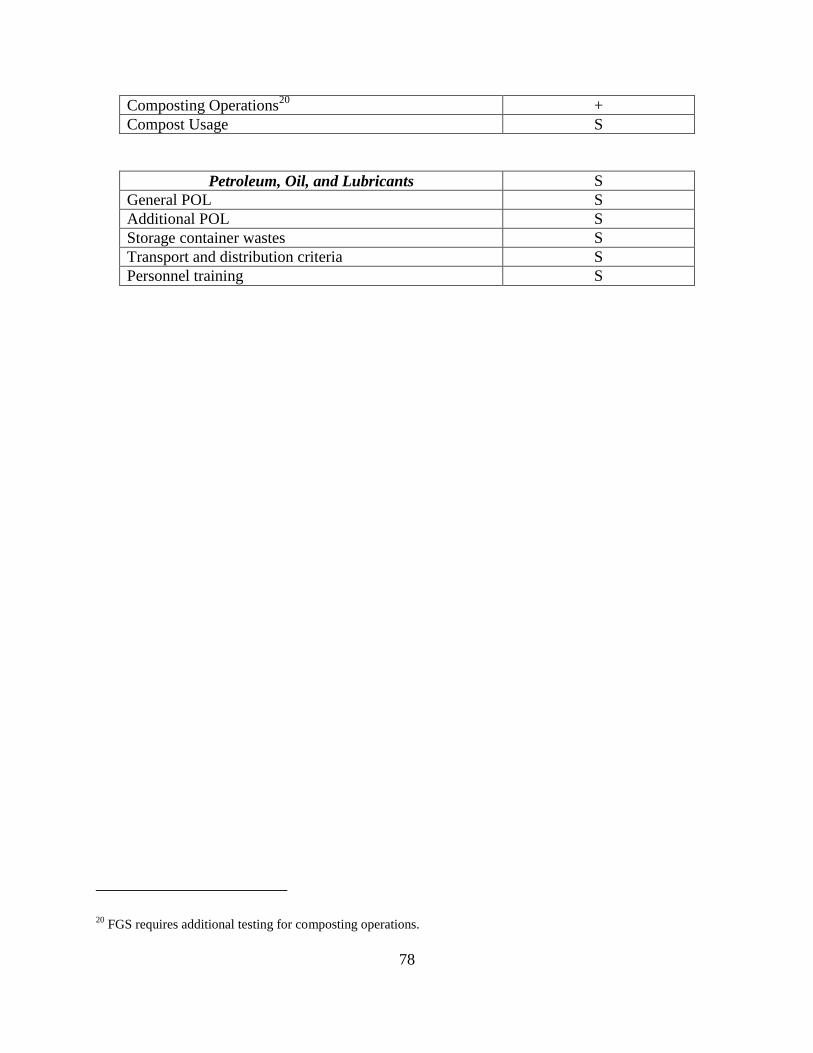
78
Composting Operations20
+
Compost Usage
S
Petroleum, Oil, and Lubricants S
General POL S
Additional POL
S
Storage container wastes S
Transport and distribution criteria S
Personnel training
S
20 FGS requires additional testing for composting operations.

79
Kuwait – 2011
Air Emissions1 +
Boilers S
Incinerators S
PCE Dry Cleaning
S
Chromium Electroplating S
Halogenated Solvent Cleaning S
O-zone Depleting Substances S
Motor Vehicles S
Stack Heights S
Drinking Water S
System S
Coliform S
Inorganic2
+
Fluoride S
Lead and Copper3
+
Synthetic Organics4 +
Disinfectant Byproduct Monitoring
S
Radionuclide
S
Wastewater S
Effluent Limitation conventional pollutants5 +
Effluent Limitation non-categorical indirect6
+
Effluent Limitation categorical dischargers S
Storm water
S
Septic S
Sludge S
1 FGS has additional sections on Cement Production, storage tanks emissions, and industrial emission limits.
2 Stricter MCLs for listed chemicals and adds additional MCLs. The Fluoride section states that the MCL is 4 mg/L
but the inorganic MCL table puts the MCL at 2 mg/L, this is another mistake of the FGS. 3 Stricter action level for lead.
4 FGS has stricter MCLs for a couple organic compounds and adds more not listed in OEBGD. The table has two
mistakes: firstly, the table name is incorrect (It inadvertently repeats the heading for table 5 and secondly, the MCL
for Di(2-ethylhexyl) adipate is missing numbers after the decimal place. 5 Additional criteria for direct discharges to maritime waters.
6 Additional MCLs for chemicals in indirect discharges.

80
Hazardous Materials S
Storage and Handling S
Dispensing Areas
S
Shipment
S
Master Listing S
Labeling S
HAZMAT Management S
Hazardous Waste S
HW Generators7
+
Accumulation Points S
Storage Areas S
Containers
S
Record Keeping8
+
Contingency Plan S
Tank Systems
S
Used Oil and Lead Acid Batteries
S
Training S
Disposal9
+
Solid Waste S
Solid Waste Management Plan10
+
New Municipal Solid Waste Landfills11
+
Municipal Solid Waste Landfill Operation12
+
Open Burning S
Composting Operations
S
Compost Usage
S
7 HW Generators are required to have written management plans and procedures.
8 HW Shippers must keep manifests for at least 5 years – conflicts with other Record Keeping requirements.
9 Land disposal facilities cannot be located any less than 2 kilometers away from the nearest water supply well.
10 Additional criteria for the disposal of batteries in accordance with army policy. Specific requirements for disposal
of steel and poly drums. 11
Minimum 2 kilometer separation between new landfills and water wells. 12
Daily cover soil must be at least 25 cm thick. Final grading of landfill must be no greater than 10 degrees slope.
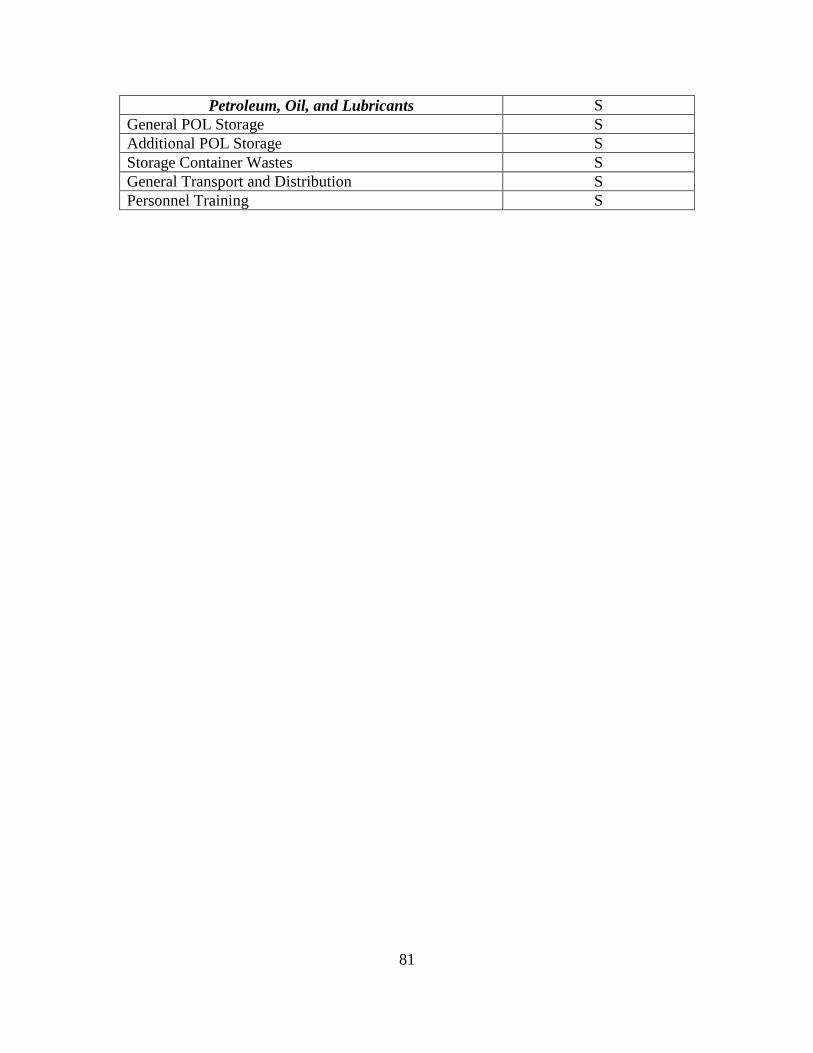
81
Petroleum, Oil, and Lubricants S
General POL Storage S
Additional POL Storage
S
Storage Container Wastes S
General Transport and Distribution S
Personnel Training
S

82
Belgium – 2010
Air Emissions1 +
Boilers S
Incinerators2
-
PCE Dry Cleaning3
+
Chromium Electroplating S
Halogenated Solvent Cleaning4 +
O-zone Depleting Substances5
+
Motor Vehicles6
+
Stack Heights7 +
Drinking Water8 +
System S
Coliform S
Inorganic9
+
Fluoride10
+
Lead and Copper11
+
Synthetic Organics12
+
Disinfectant Byproduct Monitoring13
+
Radionuclide S
Wastewater S
Effluent Limitation conv14
+
Effluent Limitation non-cate indirect15
+
Effluent Limitation cate dischargers16
+
Storm Water S
1 Additional sections for regional criteria, fluorinated greenhouse gases, and installed heating units.
2 FGS does not address emission standards for incinerators, just states that they must be permitted by HN authorities.
3 PCE is not allowed in Belgium.
4 Additional regional criteria for halogenated solvent cleaning machines.
5 Must keep an inventory of all ODS. FGS has a list of prohibited ODS.
6 Additional requirements for vehicles.
7 Regional requirement for stack usage.
8 Additional requirement that installations conduct risk assessments for Legionella and develop control measures.
9 Additional chemicals in FGS and stricter MCLs for certain chemicals.
10 Stricter fluoride levels.
11 Stricter action level for lead
12 Additional organic compounds and stricter MCLs for certain chemicals.
13 Stricter maximum residual disinfectant level of chlorine.
14 Stricter regional requirements for wastewater.
15 Additional restrictions of compounds in wastewater. Corrosivity has to be between 6.5 and 9.0.
16 Additional regional restrictions on categorical dischargers.

83
Septic S
Sludge S
Hazardous Materials17
+
Storage and Handling S
Dispensing Areas18
+
Shipment S
Master Listing19
+
Material Safety Data Sheets S
HAZMAT management S
Hazardous Waste S
HW Generators S
Accumulation Points S
Storage Areas20
-
Containers
S
Record Keeping S
Contingency Plan S
Tank Systems21
+
Used Oil and Lead Acid Batteries22
+
Training S
Disposal23
-
Solid Waste24
+
Solid Waste Management Plan25
+
New Municipal Solid Waste Landfills S
Municipal Solid Waste Landfill Operation S
Open Burning S
17 Additional sections on Flemish region prohibited materials, specific storage conditions, secondary containment,
and storage tank criteria. 18
Additional requirements for dispensing area flooring and regional floor requirements. 19
Inventories in Flemish region will be updated monthly. 20
No mention of testing and maintenance of equipment. No specific mentioning of criteria ignitable, reactive, or
incompatible wastes. 21
Additional regional requirements for assessment of the integrity of existing tanks but there is no mention of design
and installation of new tanks. FGS also has criteria for regional temporary storage of hazwaste. 22
Stricter requirements for the burning of used oil and there is regional requirements for batteries. 23
FGS does not mention specific criteria on landfills and incineration. 24
Additional sections on animal waste, incineration of waste, and composting of yard waste. 25
Additional regional requirements for materials separated for the purpose of recycling. Cannibalization of wrecked
and scrapped vehicles is prohibited. Additional requirements for recycling in the Flemish region.
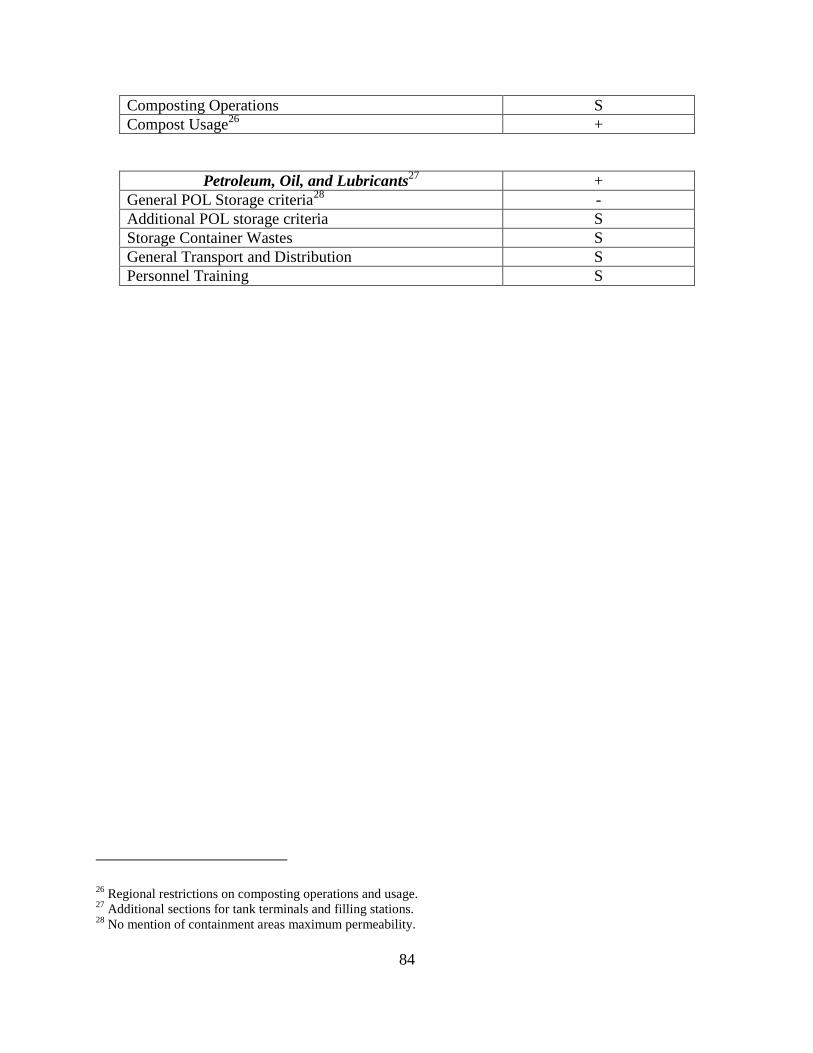
84
Composting Operations
S
Compost Usage26
+
Petroleum, Oil, and Lubricants27
+
General POL Storage criteria28
-
Additional POL storage criteria
S
Storage Container Wastes S
General Transport and Distribution S
Personnel Training
S
26 Regional restrictions on composting operations and usage.
27 Additional sections for tank terminals and filling stations.
28 No mention of containment areas maximum permeability.

85
Oman – 2012
Air Emissions1 +
Boilers S
Incinerators S
PCE Dry Cleaning S
Chromium Electroplating S
Halogenated Solvent Cleaning S
O-zone Depleting Substances S
Motor Vehicles S
Stack Heights S
Drinking Water2 +
System3
+
Coliform4
+
Inorganic5
+
Fluoride6 S
Lead and Copper S
Synthetic Organics7
+
Disinfectant Byproduct Monitoring8
+
Radionuclide9
+
Wastewater10
+
Effluent Limitation conv11
+
Effluent Limitation non-cate indirect12
S
Effluent Limitation cate dischargers S
1 Additional requirements for air emissions, ambient air quality standards, and prohibited substances.
2 Additional sections on quality control for drinking water, organic biological properties, water treatment, water
distributed by tanker vehicles, and sampling and testing. 3 No pollutants shall be discharged to aflaj and their channels, surface watercourses, wadis or places of underground
water recharge. 4 Treated water entering the distribution system must be free of bacteria in any 100 mL sample.
5 Stricter MCLs and more compounds added
6 Fluoride MCL doesn’t match between the text and the table that is referenced. Inorganic chemicals table lists 1.5
mg/L as the MCL but the fluoride section states 4 mg/L is the MCL. 7 Stricter MCLs for some compounds and additional ones added.
8 Stricter MCL for chlorite.
9 Stricter MCL for Gross Alpha. Additional radionuclide concentration criteria
10 FGS has additional sections on drains, traps, domestic wastewater treatment systems, use of wastewater for
irrigation, liquid effluents, sewer discharges, and discharges to the marine environment. 11
FGS doesn’t use averages for BOD5 and TSS, just MCLs. Existing and new sources must both follow the more
stringent requirements. 12
FGS has same mistake as OEBGD (references subparagraphs that don’t exist).
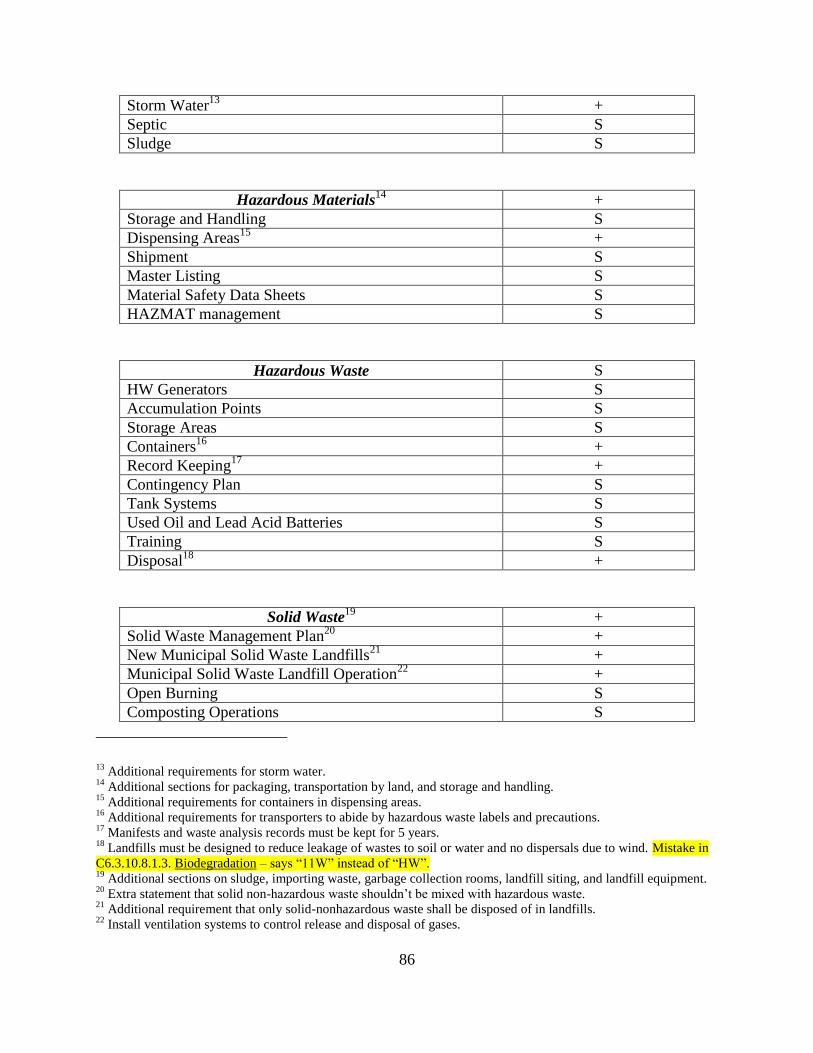
86
Storm Water13
+
Septic S
Sludge S
Hazardous Materials14
+
Storage and Handling
S
Dispensing Areas15
+
Shipment
S
Master Listing S
Material Safety Data Sheets S
HAZMAT management S
Hazardous Waste S
HW Generators S
Accumulation Points S
Storage Areas
S
Containers16
+
Record Keeping17
+
Contingency Plan S
Tank Systems S
Used Oil and Lead Acid Batteries S
Training S
Disposal18
+
Solid Waste19
+
Solid Waste Management Plan20
+
New Municipal Solid Waste Landfills21
+
Municipal Solid Waste Landfill Operation22
+
Open Burning S
Composting Operations S
13 Additional requirements for storm water.
14 Additional sections for packaging, transportation by land, and storage and handling.
15 Additional requirements for containers in dispensing areas.
16 Additional requirements for transporters to abide by hazardous waste labels and precautions.
17 Manifests and waste analysis records must be kept for 5 years.
18 Landfills must be designed to reduce leakage of wastes to soil or water and no dispersals due to wind. Mistake in
C6.3.10.8.1.3. Biodegradation – says “11W” instead of “HW”. 19
Additional sections on sludge, importing waste, garbage collection rooms, landfill siting, and landfill equipment. 20
Extra statement that solid non-hazardous waste shouldn’t be mixed with hazardous waste. 21
Additional requirement that only solid-nonhazardous waste shall be disposed of in landfills. 22
Install ventilation systems to control release and disposal of gases.

87
Compost Usage S
Petroleum, Oil, and Lubricants S
General POL Storage criteria S
Additional POL storage criteria
S
Storage Container Wastes S
General Transport and Distribution S
Personnel Training
S
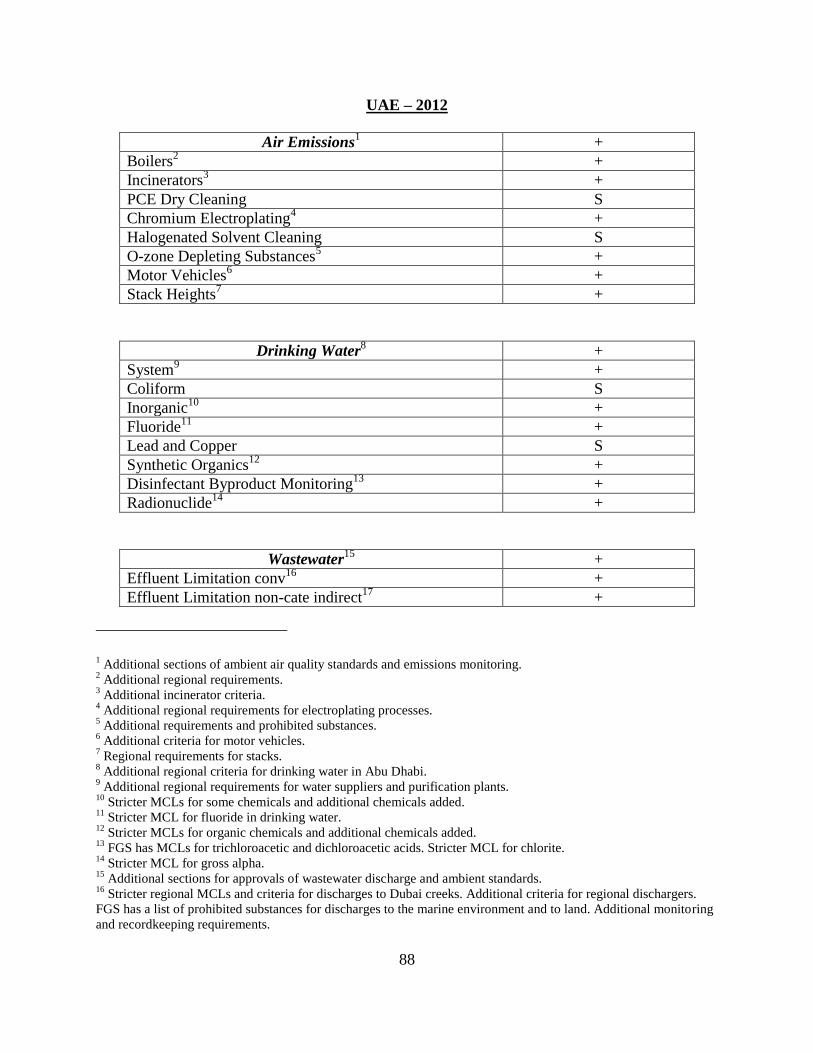
88
UAE – 2012
Air Emissions1 +
Boilers2
+
Incinerators3
+
PCE Dry Cleaning S
Chromium Electroplating4
+
Halogenated Solvent Cleaning
S
O-zone Depleting Substances5
+
Motor Vehicles6
+
Stack Heights7
+
Drinking Water8 +
System9
+
Coliform S
Inorganic10
+
Fluoride11
+
Lead and Copper S
Synthetic Organics12
+
Disinfectant Byproduct Monitoring13
+
Radionuclide14
+
Wastewater15
+
Effluent Limitation conv16
+
Effluent Limitation non-cate indirect17
+
1 Additional sections of ambient air quality standards and emissions monitoring.
2 Additional regional requirements.
3 Additional incinerator criteria.
4 Additional regional requirements for electroplating processes.
5 Additional requirements and prohibited substances.
6 Additional criteria for motor vehicles.
7 Regional requirements for stacks.
8 Additional regional criteria for drinking water in Abu Dhabi.
9 Additional regional requirements for water suppliers and purification plants.
10 Stricter MCLs for some chemicals and additional chemicals added.
11 Stricter MCL for fluoride in drinking water.
12 Stricter MCLs for organic chemicals and additional chemicals added.
13 FGS has MCLs for trichloroacetic and dichloroacetic acids. Stricter MCL for chlorite.
14 Stricter MCL for gross alpha.
15 Additional sections for approvals of wastewater discharge and ambient standards.
16 Stricter regional MCLs and criteria for discharges to Dubai creeks. Additional criteria for regional dischargers.
FGS has a list of prohibited substances for discharges to the marine environment and to land. Additional monitoring
and recordkeeping requirements.

89
Effluent Limitation cate dischargers18
+
Storm Water19
+
Septic S
Sludge20
+
Hazardous Materials21
+
Storage and Handling
S
Dispensing Areas S
Shipment22
+
Master Listing S
Labeling23
+
HAZMAT management24
+
Hazardous Waste25
+
HW Generators26
+
Accumulation Points S
Storage Areas S
Containers27
+
Record Keeping28
+
Contingency Plan29
+
Tank Systems S
Used Oil and Lead Acid Batteries30
+
Training S
Disposal31
+
17 Specific regional criteria for discharges.
18 Additional regional criteria for electroplating discharges.
19 Additional storm water criteria for Jebel Ali.
20 Additional regional criteria for sludge disposal.
21 Additional sections of hazmat approval, secondary containment in Dubai, and hazmat segregation.
22 Additional criteria vehicle transport and regional criteria for Dubai.
23 FGS requires MSDS to identify if a chemical is also a reproductive toxin or target-organ systemic toxin for Abu
Dhabi. Employers in Abu Dhabi must maintain MSDS in an electronic retrieval system or other such format that is
easily accessible. Additional regional labeling criteria. 24
HN employees must also be trained in HN Hazmat requirements. 25
Additional sections on treatment of HW by HW generators, treatment and disposal location requirements, and
HW approval. 26
Additional waste characterization requirements in Dubai and transport requirements. 27
Portable containers of HW will not be kept in common areas. 28
The final destination for any transported waste must be kept on file for at least 3 years. Installation records of HW
shall be kept for at 5 years from the commencement of the handling activity. 29
FGS mandates emergency response plan to mitigate planned impacts during production, handling, transport, and
storage of HW. 30
Used oil in Dubai must be disposed of as HW.
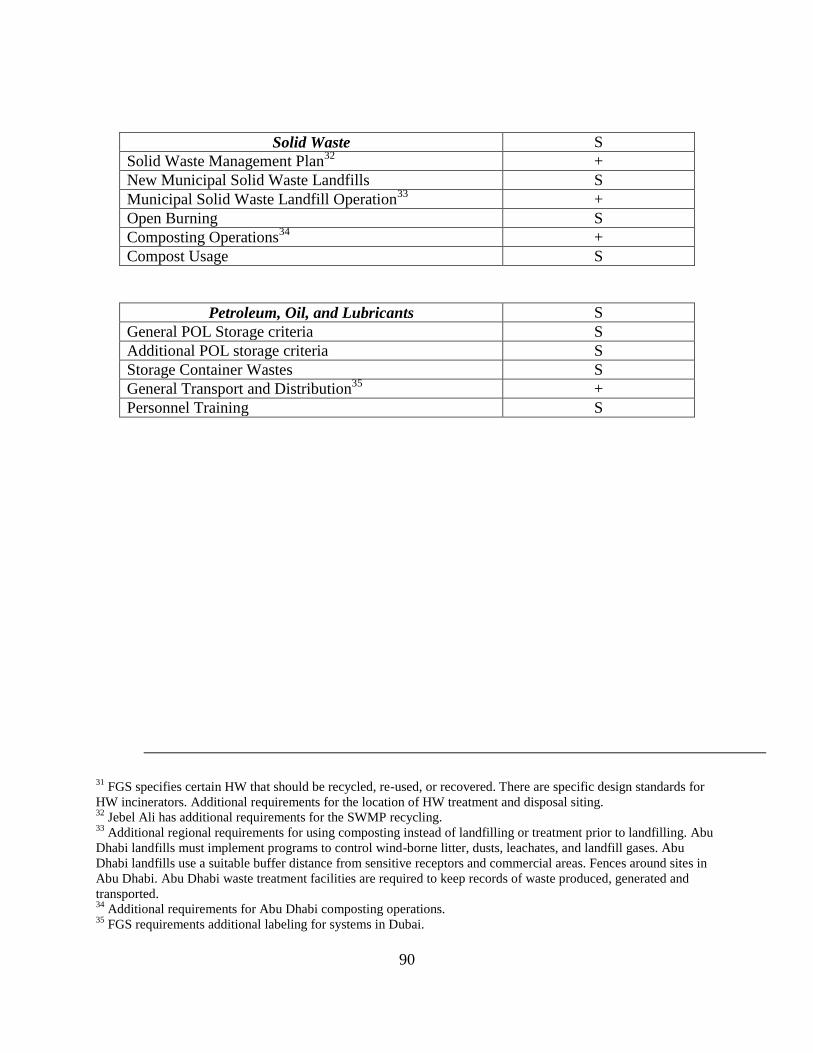
90
Solid Waste S
Solid Waste Management Plan32
+
New Municipal Solid Waste Landfills S
Municipal Solid Waste Landfill Operation33
+
Open Burning S
Composting Operations34
+
Compost Usage S
Petroleum, Oil, and Lubricants S
General POL Storage criteria S
Additional POL storage criteria
S
Storage Container Wastes S
General Transport and Distribution35
+
Personnel Training
S
31 FGS specifies certain HW that should be recycled, re-used, or recovered. There are specific design standards for
HW incinerators. Additional requirements for the location of HW treatment and disposal siting. 32
Jebel Ali has additional requirements for the SWMP recycling. 33
Additional regional requirements for using composting instead of landfilling or treatment prior to landfilling. Abu
Dhabi landfills must implement programs to control wind-borne litter, dusts, leachates, and landfill gases. Abu
Dhabi landfills use a suitable buffer distance from sensitive receptors and commercial areas. Fences around sites in
Abu Dhabi. Abu Dhabi waste treatment facilities are required to keep records of waste produced, generated and
transported. 34
Additional requirements for Abu Dhabi composting operations. 35
FGS requirements additional labeling for systems in Dubai.

91
Netherlands – 2010
Air Emissions1 +
Boilers2 +
Incinerators3 -
PCE Dry Cleaning4 +
Chromium Electroplating S
Halogenated Solvent Cleaning S
O-zone Depleting Substances5 +
Motor Vehicles6 +
Stack Heights S
Drinking Water S
System7 +
Coliform S
Inorganic8 +
Fluoride9 S
Lead and Copper S
Synthetic Organics10
+
Disinfectant Byproduct Monitoring S
Radionuclide S
Wastewater11
+
Effluent Limitation conv S
Effluent Limitation non-cate indirect12
+
1 Additional sections for fluorinated greenhouse gases, application of paints, kitchen facilities, wood-
working facilities, VOC emission limits, and filling stations. (ERROR IN 2.3.9 – REFERENCE
SOURCE NOT FOUND) 2 Additional requirements for new or modified units.
3 Lack of information on incinerators.
4 PCE not allowed in the Netherlands.
5 Additional size of leak monitoring. Additional criteria for HCFC and precautions to prevent leakage.
6 Additional criteria for motor vehicles.
7 Higher positive pressure in water system. Installations need to conduct Legionella risk assessments.
8 Stricter MCLs and new MCLs.
9 (ERROR IN FLUORIDE SECTION, TEXT DOES NOT MATCH REFERENCED TABLE).
10 Stricter MCLs and new MCLs.
11 Additional sections for kitchen wastewater, filling stations, vehicle washing facilities, and dental
facilities. 12
(ERROR IN REFERENCING NONEXISTANT PARAGRAPHS, MISTAKE FROM DELETING
OEBGD MISTAKE). Additional criteria for wastewater that shall not be discharged into a public sewer.

92
Effluent Limitation cate dischargers S
Storm Water S
Septic S
Sludge S
Hazardous Materials13
+
Storage and Handling S
Dispensing Areas14
+
Shipment S
Master Listing S
Material Safety Data Sheets15
+
HAZMAT management S
Hazardous Waste S
HW Generators S
Accumulation Points S
Storage Areas16
+
Containers17
+
Record Keeping S
Contingency Plan S
Tank Systems18
+
Used Oil and Lead Acid Batteries19
+
Training S
Disposal20
-
Solid Waste21
+
Solid Waste Management Plan22
+
13 Additional list with prohibited persistent organic pollutants. Also has very similar section of containers
and AST as with HAZWASTE chapter. 14
Additional requirements for dispensing areas. 15
Additional requirements for maximum allowable concentration and identification of potential mutagens
and teratogens. (ERROR, SPELLED TERATOGENS WRONG – FGS SPELLS IT TERRATOGENS) 16
Additional requirements for compatible storage. 17
Referenced to HAZMAT chapter, additional requirements for secondary containment. 18
All tanks are required to have secondary containment, regardless of age or condition. Cathodic
protection must be inspected with 3 months of installation. 19
All batteries are handled as HW. 20
Land-disposal and incinerators do not have information mandated in OEBGD. 21
Solid waste generators must maintain a register of all wastes disposed and keep the records for 3 years. 22
Additional requirements for solid waste management strategy.

93
New Municipal Solid Waste Landfills S
Municipal Solid Waste Landfill Operation S
Open Burning S
Composting Operations23
+
Compost Usage24
+
Petroleum, Oil, and Lubricants25
+
General POL Storage criteria26
+
Additional POL storage criteria
S
Storage Container Wastes S
General Transport and Distribution S
Personnel Training
S
23 Composting facilities must comply, regardless of how much sludge is processed. Only the enclosed
vessel method is allowed for composting. 24
Additional requirements for composting usage. 25
Additional section for POL Dispensing Facilities. 26
Additional requirements for secondary containment and containment areas.

94
Spain – 2008
Air Emissions1 +
Boilers2 +
Incinerators3 +
PCE Dry Cleaning S
Chromium Electroplating S
Halogenated Solvent Cleaning4 +
O-zone Depleting Substances5 +
Motor Vehicles6 +
Stack Heights7 -
Drinking Water8 +
System9 +
Coliform10
+
Inorganic11
+
Fluoride12
+
Lead and Copper S
Synthetic Organics13
+
Disinfectant Byproduct Monitoring14
-
Radionuclide15
+
1 Installations must seek permits and permission to operate incinerators and thermal boiler units.
2 Additional requirements for design greater than 1,000 MBtu/hr. Additional categories of size emission
limits. 3 Additional criteria for incincerators.
4 1,1,1-trichloroethane is no longer authorized for use.
5 Additional requirements for ODS and more listed in tables.
6 Additional requirements for vehicles.
7 No mention of stack heights.
8 Installations must label all non-potable water taps in buildings and there are additional permits and
requests that must be submitted to Spanish authorities. Also has approved testing methods. 9 Minimum distance between wells. Additional criteria for purchased and DoD-produced water.
Additional criteria for residual disinfectants. Underground injection controlled by Spain authorities.
Additional logbook requirements. Don’t expand upon vulnerability assessments. Additional testing
requirements for all water. NPWS must comply with PWS requirements. Stricter surface water treatment
requirements. 10
Sticter requirements for monitoring. 11
Requirements for purchased and produced water and stricter MCLs. 12
Stricter MCL of fluorine in water. Stricter upper control limits. 13
Stricter MCLs and added MCLs. 14
FGS does not mention any other disinfectants and has a higher MCL than OEBGD. Also has less strict
monitoring requirements for less than 10,000 people.
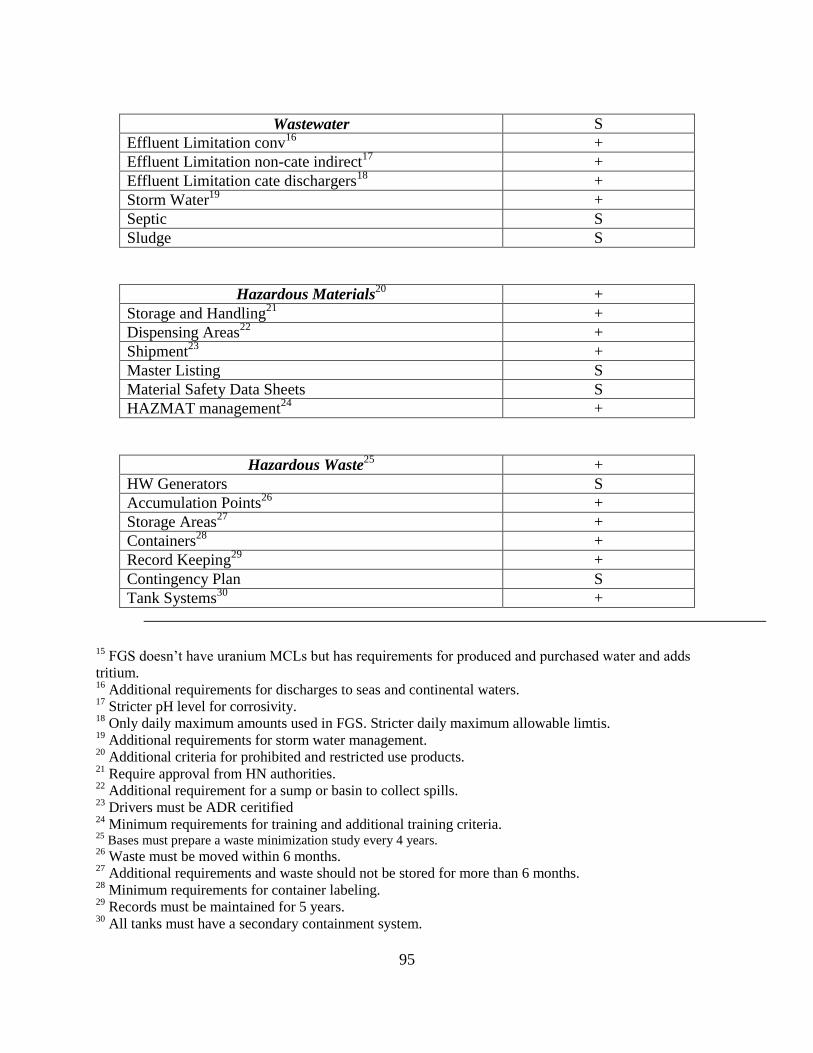
95
Wastewater S
Effluent Limitation conv16
+
Effluent Limitation non-cate indirect17
+
Effluent Limitation cate dischargers18
+
Storm Water19
+
Septic S
Sludge S
Hazardous Materials20
+
Storage and Handling21
+
Dispensing Areas22
+
Shipment23
+
Master Listing S
Material Safety Data Sheets S
HAZMAT management24
+
Hazardous Waste25
+
HW Generators S
Accumulation Points26
+
Storage Areas27
+
Containers28
+
Record Keeping29
+
Contingency Plan S
Tank Systems30
+
15 FGS doesn’t have uranium MCLs but has requirements for produced and purchased water and adds
tritium. 16
Additional requirements for discharges to seas and continental waters. 17
Stricter pH level for corrosivity. 18
Only daily maximum amounts used in FGS. Stricter daily maximum allowable limtis. 19
Additional requirements for storm water management. 20
Additional criteria for prohibited and restricted use products. 21
Require approval from HN authorities. 22
Additional requirement for a sump or basin to collect spills. 23
Drivers must be ADR ceritified 24
Minimum requirements for training and additional training criteria. 25
Bases must prepare a waste minimization study every 4 years. 26
Waste must be moved within 6 months. 27
Additional requirements and waste should not be stored for more than 6 months. 28
Minimum requirements for container labeling. 29
Records must be maintained for 5 years. 30
All tanks must have a secondary containment system.

96
Used Oil and Lead Acid Batteries31
+
Training S
Disposal32
+
Solid Waste33
+
Solid Waste Management Plan34
+
New Municipal Solid Waste Landfills S
Municipal Solid Waste Landfill Operation35
+
Open Burning S
Composting Operations36
+
Compost Usage37
+
Petroleum, Oil, and Lubricants S
General POL Storage criteria38
+
Additional POL storage criteria39
-
Storage Container Wastes S
General Transport and Distribution40
S
Personnel Training41
-
31 Additional requirements for burning used oil.
32 Need HN approval to do on-base HW recovery/recycling. Stricter landfill requirements. Additional
incinerator requirements. Even after treatment, HW cannot be disposed of as solid waste. 33
Installations must report any facilities that perform sludge treatment. 34
(ERROR – DATE OF JULY 2009 IS REPEATED TWICE WITH TWO DIFFERENT STANDARDS).
Requirement for the amount of time non-hazwaste can be stored. 35
It is prohibited to dispose of tires in a MSWLF. Post closure period for MSWLF is at least 30 years. 36
Additional requirements for agricultural purposes. 37
Additional requirements for compost usage. 38
Additional secondary containment and other requirements. 39
No mention. 40
Additional requirements for testing of pipeline facilities but no mention of load/unloading areas. 41
No mention.
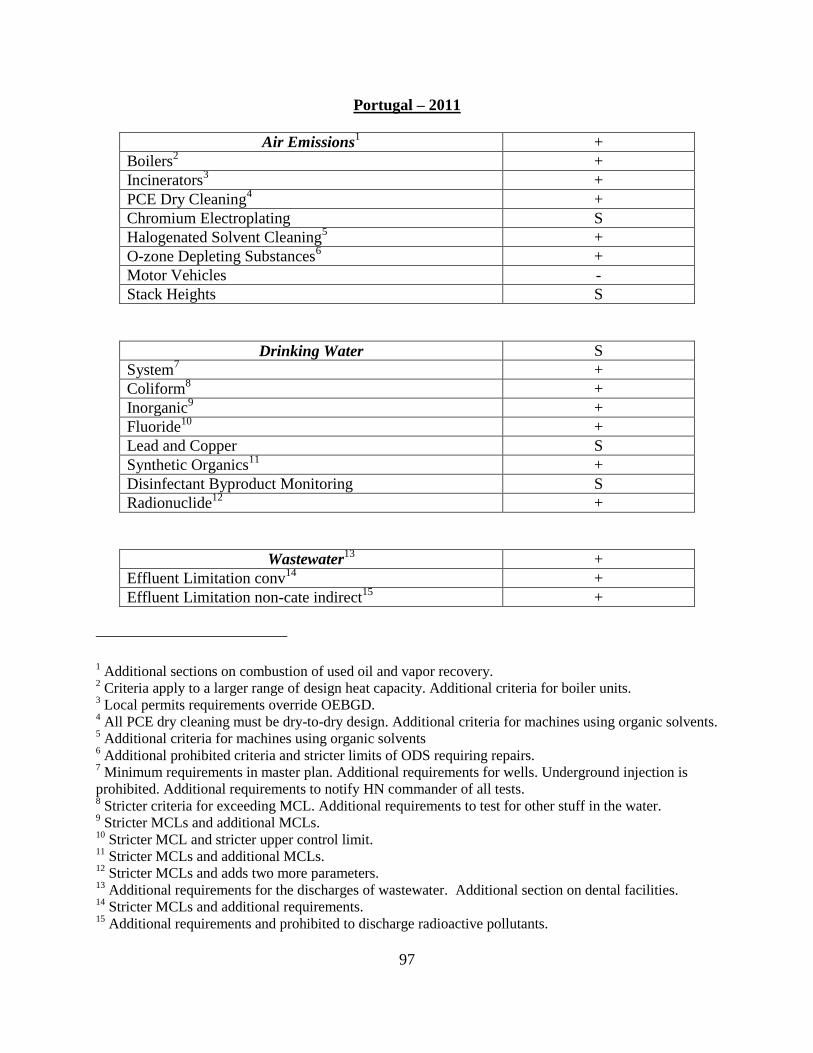
97
Portugal – 2011
Air Emissions1 +
Boilers2 +
Incinerators3 +
PCE Dry Cleaning4 +
Chromium Electroplating S
Halogenated Solvent Cleaning5 +
O-zone Depleting Substances6 +
Motor Vehicles -
Stack Heights S
Drinking Water S
System7 +
Coliform8 +
Inorganic9 +
Fluoride10
+
Lead and Copper S
Synthetic Organics11
+
Disinfectant Byproduct Monitoring S
Radionuclide12
+
Wastewater13
+
Effluent Limitation conv14
+
Effluent Limitation non-cate indirect15
+
1 Additional sections on combustion of used oil and vapor recovery.
2 Criteria apply to a larger range of design heat capacity. Additional criteria for boiler units.
3 Local permits requirements override OEBGD.
4 All PCE dry cleaning must be dry-to-dry design. Additional criteria for machines using organic solvents.
5 Additional criteria for machines using organic solvents
6 Additional prohibited criteria and stricter limits of ODS requiring repairs.
7 Minimum requirements in master plan. Additional requirements for wells. Underground injection is
prohibited. Additional requirements to notify HN commander of all tests. 8 Stricter criteria for exceeding MCL. Additional requirements to test for other stuff in the water.
9 Stricter MCLs and additional MCLs.
10 Stricter MCL and stricter upper control limit.
11 Stricter MCLs and additional MCLs.
12 Stricter MCLs and adds two more parameters.
13 Additional requirements for the discharges of wastewater. Additional section on dental facilities.
14 Stricter MCLs and additional requirements.
15 Additional requirements and prohibited to discharge radioactive pollutants.
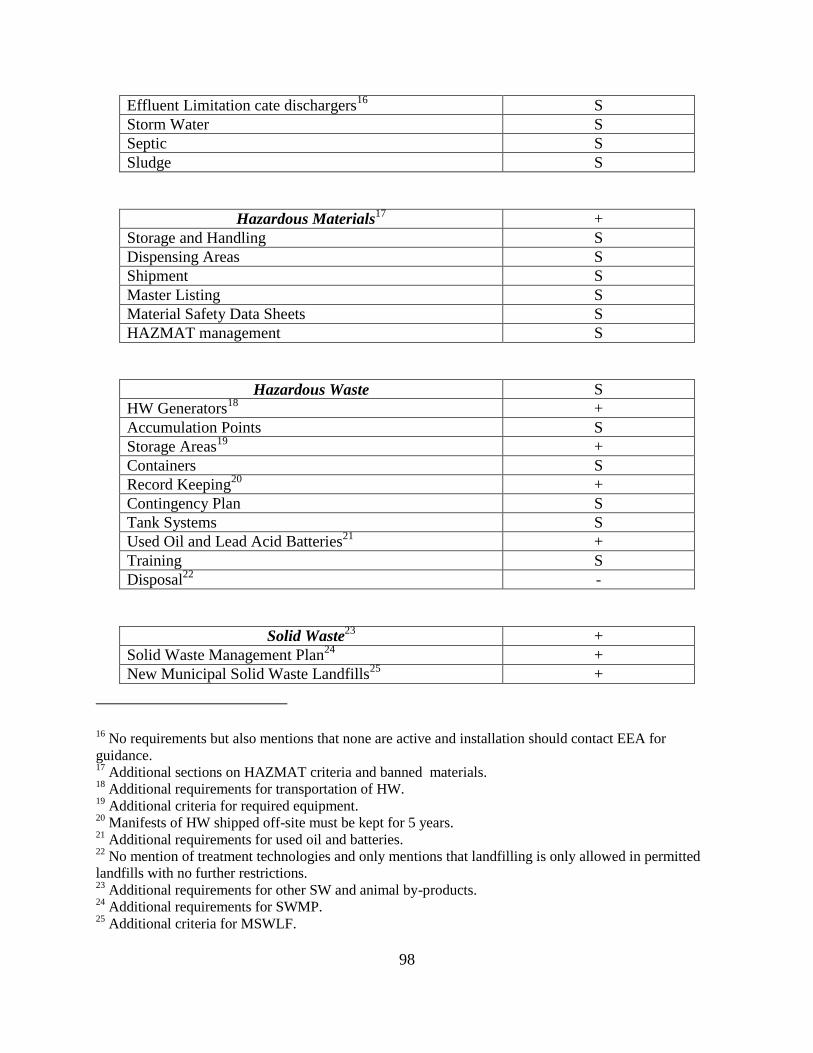
98
Effluent Limitation cate dischargers16
S
Storm Water S
Septic S
Sludge S
Hazardous Materials17
+
Storage and Handling S
Dispensing Areas S
Shipment S
Master Listing S
Material Safety Data Sheets S
HAZMAT management S
Hazardous Waste S
HW Generators18
+
Accumulation Points S
Storage Areas19
+
Containers S
Record Keeping20
+
Contingency Plan S
Tank Systems S
Used Oil and Lead Acid Batteries21
+
Training S
Disposal22
-
Solid Waste23
+
Solid Waste Management Plan24
+
New Municipal Solid Waste Landfills25
+
16 No requirements but also mentions that none are active and installation should contact EEA for
guidance. 17
Additional sections on HAZMAT criteria and banned materials. 18
Additional requirements for transportation of HW. 19
Additional criteria for required equipment. 20
Manifests of HW shipped off-site must be kept for 5 years. 21
Additional requirements for used oil and batteries. 22
No mention of treatment technologies and only mentions that landfilling is only allowed in permitted
landfills with no further restrictions. 23
Additional requirements for other SW and animal by-products. 24
Additional requirements for SWMP. 25
Additional criteria for MSWLF.
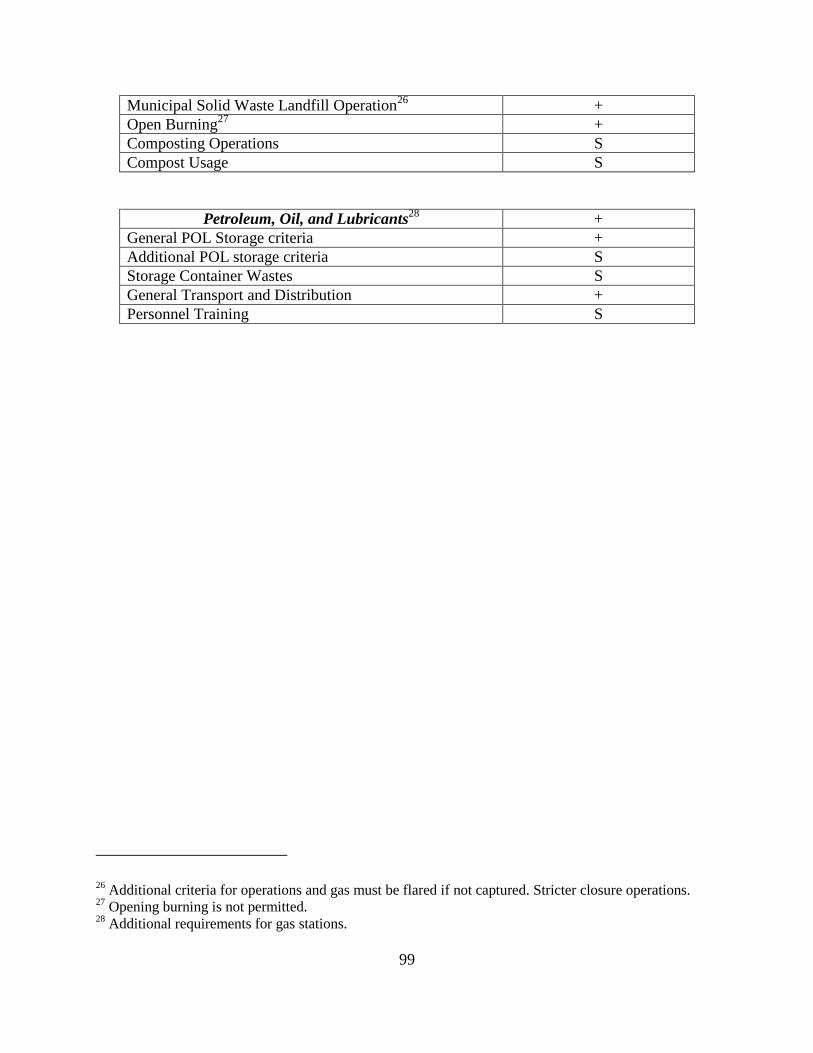
99
Municipal Solid Waste Landfill Operation26
+
Open Burning27
+
Composting Operations S
Compost Usage S
Petroleum, Oil, and Lubricants28
+
General POL Storage criteria +
Additional POL storage criteria
S
Storage Container Wastes S
General Transport and Distribution +
Personnel Training
S
26 Additional criteria for operations and gas must be flared if not captured. Stricter closure operations.
27 Opening burning is not permitted.
28 Additional requirements for gas stations.

100
United Kingdom – 2013
Air Emissions1 +
Boilers2 +
Incinerators3 +
PCE Dry Cleaning4 +
Chromium Electroplating5 +
Halogenated Solvent Cleaning6 +
O-zone Depleting Substances7 +
Motor Vehicles S
Stack Heights S
Drinking Water S
System8 +
Coliform9 +
Inorganic10
+
Fluoride11
+
Lead and Copper12
+
Synthetic Organics13
+
Disinfectant Byproduct Monitoring S
Radionuclide S
1 Additional sections on VOC emissions for facilities exceeding solvent consumption thresholds, fuel
criteria, and vapor-recovery units. 2 Additional criteria that units must not produce black smoke (with exception).
3 Requirement that bases must contact HN to see if there are more stringent permitting requirements.
Criteria for minimum temperature in primary chambers. Additional emission standards for incinerators.
ERROR IN C2.T3 (955 INSTEAD OF 95%). 4 Additional requirements for dry cleaners using VOCs.
5 Requirement that bases with a combined tank capacity greater than 30 m
3 must contact HN to see if there
are more stringent permitting requirements. 6 Requirement that bases must contact HN to see if there are more stringent permitting requirements and
limits for solvent consumption. 7 Section on the prohibited uses of ODS and exceptions. Additional requirements for equipment containing
different sizes of ODS and leak detection. Halon fire suppression systems must be decommissioned. 8 Vulnerability assessments are conducted once every 5 years.
9 Required monitoring of Enterococci.
10 Additional requirements and stricter MCLs and additional MCLs.
11 Lower upper control limit for fluoride. Additional requirements for fluoride in water.
12 Additional requirements and lower action level for lead after 25 Dec 2013.
13 Stricter MCLs and additional MCLs. Additional regional criteria.
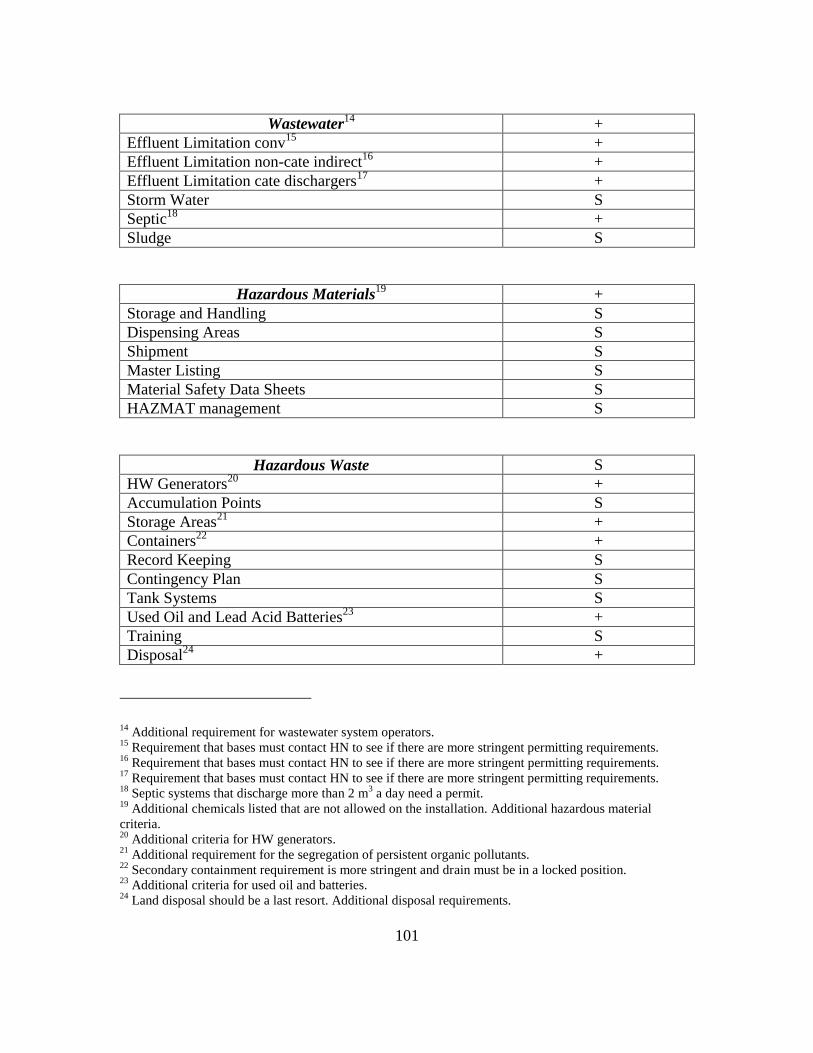
101
Wastewater14
+
Effluent Limitation conv15
+
Effluent Limitation non-cate indirect16
+
Effluent Limitation cate dischargers17
+
Storm Water S
Septic18
+
Sludge S
Hazardous Materials19
+
Storage and Handling S
Dispensing Areas S
Shipment S
Master Listing S
Material Safety Data Sheets S
HAZMAT management S
Hazardous Waste S
HW Generators20
+
Accumulation Points S
Storage Areas21
+
Containers22
+
Record Keeping S
Contingency Plan S
Tank Systems S
Used Oil and Lead Acid Batteries23
+
Training S
Disposal24
+
14 Additional requirement for wastewater system operators.
15 Requirement that bases must contact HN to see if there are more stringent permitting requirements.
16 Requirement that bases must contact HN to see if there are more stringent permitting requirements.
17 Requirement that bases must contact HN to see if there are more stringent permitting requirements.
18 Septic systems that discharge more than 2 m
3 a day need a permit.
19 Additional chemicals listed that are not allowed on the installation. Additional hazardous material
criteria. 20
Additional criteria for HW generators. 21
Additional requirement for the segregation of persistent organic pollutants. 22
Secondary containment requirement is more stringent and drain must be in a locked position. 23
Additional criteria for used oil and batteries. 24
Land disposal should be a last resort. Additional disposal requirements.

102
Solid Waste25
+
Solid Waste Management Plan26
+
New Municipal Solid Waste Landfills27
+
Municipal Solid Waste Landfill Operation28
+
Open Burning S
Composting Operations29
+
Compost Usage30
+
Petroleum, Oil, and Lubricants S
General POL Storage criteria31
+
Additional POL storage criteria
S
Storage Container Wastes S
General Transport and Distribution32
+
Personnel Training
S
25 Additional sections of disposing of solid waste, animal by-products, and end-of-life vehicles.
26 Used cooking oil containers meet the criteria for POL. Installations shall use all means feasible to
separate waste paper, metals, plastics, and glass. Additional criteria for punctured aerosol cans. 27
Additional criteria for new landfills. 28
Additional criteria for landfill operations and control of methane gas. Stricter closure operations. 29
Requirement that bases must contact HN to see if there are more stringent permitting requirements. 30
Requirement that bases must contact HN to see if there are more stringent permitting requirements.
Installations that provide class A compost have additional criteria. 31
Additional general requirements for POL and stricter POL applicability. 32
Additional requirements for transportation and loading/unloading.

103
Bibliography
Baker, P., Murley, J., & Pickenpaugh, J. (2012). A Comparison of DOD Environmental
Standards at US Military Bases in Japan, the Republic of Korea, and Germany.
unpublished.
Bernauer, T., & Boehmelt, T. (2013). Are Economically "Kinder, Gentler Societies" Also
Greener? Environmental Science & Technology.
Commander, Navy Region Europe. (2008). Environmental Final Governing Standards:
Spain.
Commander, Navy Region Europe, Africa, Southwest Asia. (2012). Environmental Final
Governing Standards: Italy.
Emerson, J. W., Hsu, A., Levy, M. A., de Sherbinin, A., Mara, V., Etsy, D. C., et al.
(2012). EPI 2012 Environmental Performance Index and Pilot Trend
Environmental Performance Index. Yale University, Columbia University. New
Haven: Yale Center for Environmental Law and Policy.
Etsy, D. C., Levy, M., Srebotnjak, T., & de Sherbinin, A. (2005). 2005 Environmental
Sustainability Index: Benchmarking National Environmental Stewardship. New
Haven: Yale Center for Environmental Law & Policy.
Headquarters, U.S. Forces Japan. (2012). Japan Environmental Governing Standards.
Headquarters, United States Air Forces Europe. (2008). Final Governing Standards for
the Republic of Turkey.
Headquarters, United States Air Forces Europe. (2011). Final Governing Standards for
Portugal.
Headquarters, United States Air Forces Europe. (2013). Final Governing Standards for
the United Kingdom.
Headquarters, United States Forces Korea. (2012). Environmental Governing Standards.
Hershfield, H. E., Bang, H. M., & Weber, E. U. (2013). National Differences in
Environmental Concern and Performance Are Predicted by Country Age.
Psychological Science.
104
Jha, R., & Murthy, K. B. (2003). A Critique of the Environmental Sustainability Index.
Working Paper, Austrailian National University Division of Economics.
Kaufmann, D., Kraay, A., & Mastruzzi, M. (2010). The Worldwide Governance
Indicators: Methodology and Analytical Issues. The World Bank,
Macroeconomics and Growth Team.
Keeping Score. (2001). Ecologist, 31(3), pp. 44-47.
Kwon, O. Y. (2013). Troubled Two Asian Tigers, Korea and Taiwan: Why Cannot They
Cross over the Threshold of Advanced Economies? International Proceedings of
Economics Development and Research, 65(11).
Langbein, L., & Knack, S. (2010, February). The Worldwide Governance Indicators: Six,
One, or None? Journal of Development Studies, 46(2), 350-370.
Lester, J. P. (1994). A New Federalism? Environmental Policy in the States. In N. Vig, &
M. E. Kraft, Environmental Policy in the 1990s: Toward a New Agenda (2nd ed.,
pp. 51-68). Washington D.C.: Congressional Quarterly Inc.
Lio, M., & Liu, M.-C. (2008, December). Governance and agricultural productivity: A
cross-national analysis. Food Policy, 33(6), 504-512.
Morse, S., & Fraser, E. D. (2005, September). Making 'dirty' nations look clean? The
nation state and the problem of selecting and weighting indices as tools for
measuring process towards sustainability. Geoforum, 36(5), 625-640.
Obama, B. H. (2011, November 17). Remarks by President Obama to the Australian
Parliament. Retrieved February 23, 2014, from WhiteHouse.gov:
http://www.whitehouse.gov/the-press-office/2011/11/17/remarks-president-
obama-australian-parliament
Office of the Under Secretary of Defense for Acquisition, Technology, and Logistics.
(2007). Overseas Environmental Baseline Guidance Document.
Panetta, L. E. (2012). Secretary of Defense Speech at the Shangri-La Security Dialogue.
Retrieved February 1, 2014, from Defense.gov:
http://www.defense.gov/utility/printitem.aspx?print=http://www.defense.gov/spee
ches/speech.aspx?speechid=1681

105
Ragasa, C., Sun, Y., Bryan, E., Abate, C., Alemu, A., & Keita, M. N. (2013).
Organizational and Institutional Issues in Climate Change Adaptation and Risk
Management: Insights from Practitioners' Survey in Bangaladesh, Ethiopa,
Kenya, and Mali. Development Strategy and Governance Division. International
Food Policy Research Institute.
Smith, J. M. (1997, June). Environmental Federalism and U.S. Military Installations: A
Framework for Compliance. Colorado: Institute for National Security Studies,
U.S. Air Force Academy.
The World Bank Group. (2013). Interactive Data Access. Retrieved from Worldwide
Governance Indicators:
http://info.worldbank.org/governance/wgi/index.aspx#reports
Thomas, M. A. (2010). What Do the Worldwide Governance Indicators Measure?
European Journal of Development Research, 22, 31-54.
U.S. Air Forces Central. (2010). Kingdom of Saudi Arabia Final Governing Standards.
U.S. Air Forces Central. (2011). State of Qatar Final Governing Standards.
U.S. Air Forces Central. (2012). Sultanate of Oman Final Governing Standards.
U.S. Navy Central Command. (2012). United Arab Emirates Final Governing Standards.
United Nations. (2000). United Nations Millennium Declaration. Resolution, United
Nations.
United States Army Central Command. (2011). Kuwait Environmental Final Governing
Standard.
United States Army: Installation Management Command - Europe. (2010a).
Environmental Final Governing Standards: Belgium.
United States Army: Installation Management Command - Europe. (2010b).
Environmental Final Governing Standards: Germany.
United States Army: Installation Management Command - Europe. (2010c).
Environmental Final Governing Standards: Netherlands.
106
Vachon, S. (2012, December). Technological Capacity and Environmental Performance:
A Research Note Using Country Level Data. Journal of Operations and Supply
Chain Management, 21-28.
Yale University. (2012). 2012 & Trend EPI: Country Profiles. Retrieved from
Environmental Performance Index: http://epi.yale.edu/epi2012/countryprofiles
REPORT DOCUMENTATION PAGE Form Approved OMB No. 074-0188
The public reporting burden for this collection of information is estimated to average 1 hour per response, including the time for reviewing instructions, searching existing data sources, gathering and maintaining the data needed, and completing and reviewing the collection of information. Send comments regarding this burden estimate or any other aspect of the collection of information, including suggestions for reducing this burden to Department of Defense, Washington Headquarters Services, Directorate for Information Operations and Reports (0704-0188), 1215 Jefferson Davis Highway, Suite 1204, Arlington, VA 22202-4302. Respondents should be aware that notwithstanding any other provision of law, no person shall be subject to any penalty for failing to comply with a collection of information if it does not display a currently valid OMB control number.
PLEASE DO NOT RETURN YOUR FORM TO THE ABOVE ADDRESS.
1. REPORT DATE (DD-MM-YYYY)
28-03-2014 2. REPORT TYPE
Master’s Thesis 3. DATES COVERED (From – To)
Aug 2012 – Mar 2014
4. TITLE AND SUBTITLE
A MODEL TO GUIDE DEVELOPMENT OF
ENVIRONMENTAL FINAL GOVERNING STANDARDS
FOR OVERSEAS UNITED STATES DEPARTMENT OF
DEFENSE INSTALLATIONS
5a. CONTRACT NUMBER
5b. GRANT NUMBER
5c. PROGRAM ELEMENT NUMBER
6. AUTHOR(S)
Marshall, R. Sean, Captain, USAF
5d. PROJECT NUMBER
5e. TASK NUMBER
5f. WORK UNIT NUMBER
7. PERFORMING ORGANIZATION NAMES(S) AND ADDRESS(S)
Air Force Institute of Technology
Graduate School of Engineering and Management (AFIT/ENV)
2950 Hobson Way, Building 640
WPAFB OH 45433-8865
8. PERFORMING ORGANIZATION REPORT NUMBER
AFIT-ENV-14-M-37
9. SPONSORING/MONITORING AGENCY NAME(S) AND ADDRESS(ES)
Intentionally Left Blank
10. SPONSOR/MONITOR’S ACRONYM(S)
11. SPONSOR/MONITOR’S REPORT NUMBER(S)
12. DISTRIBUTION/AVAILABILITY STATEMENT
Distribution Statement A. Approved for Public Release; Distribution Unlimited
13. SUPPLEMENTARY NOTES
This material is declared a work of the U.S. Government and is not subject to copyright protection in the United States.
14. ABSTRACT
The Overseas Environmental Baseline Guidance Document (OEBGD) establishes the baseline environmental
standards for United States (U.S.) forces operating overseas and is the template for the development of Environmental Final
Governing Standards (FGS). FGS are required at any long-term U.S. installation and set the standard of environmental
compliance for U.S. forces in each individual country. The purpose of this research is to analyze the FGS of different
countries and compare their requirements to the OEBGD requirements. The individual FGS were scored according to if
sections were more stringent, less stringent or the same as the OEBGD. The countries analyzed were then plotted in a model
of environmental performance and governance called the Lester Model. The Lester Model categorizes the countries according
to their environmental performance and governance scores. While the results did not indicate that a country’s position in the
Lester Model has a strong relationship with the overall strictness of the FGS, the analysis did identify a number of mistakes in
the FGS. The mistakes found ranged from spelling errors to formatting mistakes to inconsistent references. 15. SUBJECT TERMS
Final Governing Standards, Overseas Environmental Baseline Guidance Document, Environmental Performance Index,
World Governance Indicators, Lester Model 16. SECURITY CLASSIFICATION OF: 17. LIMITATION OF
ABSTRACT
UU
18. NUMBER OF PAGES
118
19a. NAME OF RESPONSIBLE PERSON
Willie Harper, PhD, AFIT/ENV a. REPORT
U
b. ABSTRACT
U
c. THIS PAGE
U
19b. TELEPHONE NUMBER (Include area code)
(937) 255-3636, x 4528 ([email protected])
Standard Form 298 (Rev. 8-98) Prescribed by ANSI Std. Z39-18