A Model for the Prediction of Harmful Algae Blooms in the ... · A Model for the Prediction of...
24
1 A Model for the Prediction of Harmful Algae Blooms in the Vietnamese Upwelling Area Joachim W Dippner 1 , Nguyen Ngoc Lam 2 , Doan Nhu Hai 2 , Ajit Subramaniam 3 1 Leibniz Institute for Baltic Sea Research Warnemünde, FR Germany 2 Institute of Oceanography, Nha Trang, Vietnam 3 Lamont Doherty Earth Observatory at Columbia University, USA Submitted to Harmful Algae Revised Version 15.4.2011 Corresponding author: Joachim W Dippner Leibniz-Institute for Baltic Sea Research Warnemünde Seestr. 15 D-18119 Rostock FR Germany Tel: +49-381-5197-229 Email: [email protected]
-
Upload
truongthuan -
Category
Documents
-
view
214 -
download
0
Transcript of A Model for the Prediction of Harmful Algae Blooms in the ... · A Model for the Prediction of...
1
A Model for the Prediction of Harmful Algae Blooms in the Vietnamese Upwelling Area
Joachim W Dippner1, Nguyen Ngoc Lam2, Doan Nhu Hai2, Ajit Subramaniam3 1 Leibniz Institute for Baltic Sea Research Warnemünde, FR Germany 2 Institute of Oceanography, Nha Trang, Vietnam 3 Lamont Doherty Earth Observatory at Columbia University, USA Submitted to Harmful Algae Revised Version 15.4.2011 Corresponding author: Joachim W Dippner Leibniz-Institute for Baltic Sea Research Warnemünde Seestr. 15 D-18119 Rostock FR Germany Tel: +49-381-5197-229 Email: [email protected]

2
Abstract
Satellite pictures and in-situ observations indicate strong phytoplankton blooms
including harmful algae blooms (HABs) during southwest (SW) summer monsoon in
the Vietnamese upwelling area. In this period, nutrients are provided by coastal
upwelling and by the very high river runoff from the Mekong River. During SW
monsoon, in general two circulation patterns exist which allow the prediction of
advection and diffusion of HAB patches. A Lagrangian HAB model that is driven by
a circulation model and applied to HABs in Vietnamese waters is presented.
Advection which is the most complicated part in modelling transport of passive
substances is validated with a Lagrangian sediment trap experiment. The model
produces realistic results compared to in-situ observations and satellite images and
might be used for real time forecast in the future.
1) Introduction
Harmful Algae Blooms (HABs) can cause massive fish kills, contamination of sea
food with toxins and ecological damage through the development of anoxia (Heisler
et al. 2008). The HAB problem is significantly growing worldwide and poses a major
threat to public health, ecosystem health, and to fisheries and economic development
(Anderson 2007). The frequency, spatial extent, and economic impact of HABs have
all expanded in recent decades, in parallel with, and sometimes a result of, the world’s
increasing exploitation on the coastal zone for shelter, food, recreation, and
commerce, which results in increasing eutrophication (Anderson et al. 2002, 2008,
Allen et al. 2008).
Half a billion people live along the coast of the South China Sea (SCS) today and
exploit its fisheries and other natural resources. In the last two decades, mass
mortality of fishes and other impacts on the marine ecosystem caused by HABs have
been documented (Qi et al. 2004, Wang et al. 2008). In summer 1983, Pyrodinium
bahamens bloomed in Magued Bay and the Samar Sea (Philippines), poisoning 700
people, killing 70 people, and causing economic losses up to US $ 500,000 (Maclean
1989). In November 1997, HABs off Raoping (Guangdong Province, China) led to an
estimated economic loss of more than US $ 8 million (Qi et al. 2004). Gymnodinium
mikimotoi blooms in the mouth of the Pearl River (Guangdong Province) and in Hong

3
Kong caused economic losses estimated at over US $ 45 million during March and
April 1998 (Qian et al., 2000). In 2002, a Prorocentrum minimum bloom in the
northern Philippines led to economic losses of US $ 120,000 (Azanza et al., 2005). In
July 2002, about 90% of animal and plant species in tidal reefs of Phan Ri Bay (Fig.
1), Southern Vietnam, were eliminated by a bloom of Phaeocystis globosa. Loss was
estimated to be over US $ 650,000. These examples indicate that it is of major
economic importance to model and predict HABs (GEOHAB 2003). In this paper a
model for the South Vietnamese coast is presented and the concept, development, and
application of this model are described in the following sections.
2) Material and Methods
2.1) Observations
The growing HAB problem caused an increase in monitoring stations and routine
sampling frequency in all adjacent countries of the SCS (Wang et al. 2008). In-situ
observations of HABs indicate appearances that occur through the whole year in the
vicinity of Pearl River (Guangdong Province), in the northern Philippines, and in
Brunei, whereas HABs in front of the South Vietnamese coast appear in Binh Thuan
Province and Ninh Thuan Province (Fig. 1) only during the SW monsoon (Wang et al.
2008). Observations from 1993–2007 also indicate a significant change in the
dominant species forming HABs: Trichodesmium erythraeum was the dominant
species from 1993–1999 in Binh Thuan Province while Phaeocystis globosa
dominated the blooms from 2002 – 2007 (Liu et al. 2009).
Blooms of Phaeocystis globosa, in coastal waters of Binh Thuan Province, Southern
Vietnam (Fig. 1), have been recorded in 2002, 2005, 2006 and 2007 and in 2008
(Doan-Nhu et al. 2010). These events have been associated with upwelling
phenomenon during the SW monsoon. During these blooms, low diversities of both
phytoplankton and zooplankton were reported (Doan-Nhu et al. 2003). During the
blooms in 2005, some in-situ data have been recorded, but, unfortunately no field data
exist during the bloom in 2006. A more extensive investigation in time and space has
been carried out 2007–2008 and the results indicate the development of the bloom
with change in plankton communities and nutrient stoichiometry (Doan-Nhu et al.
2010).
4
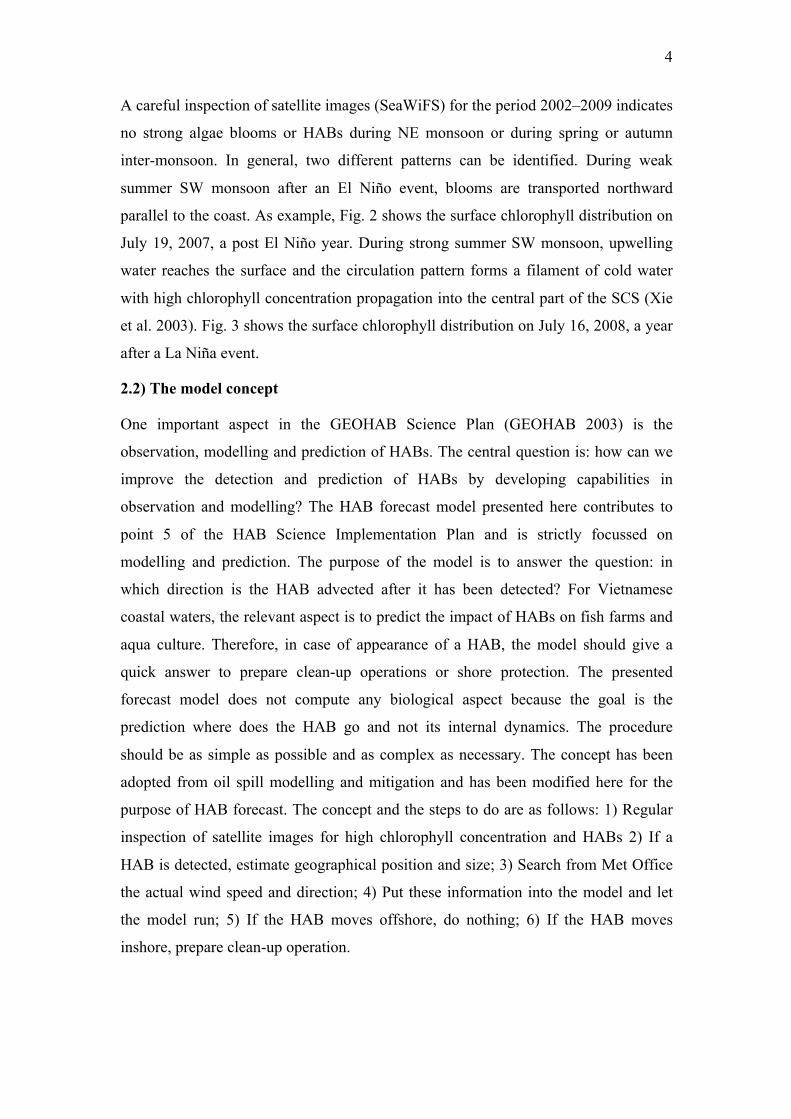
A careful inspection of satellite images (SeaWiFS) for the period 2002–2009 indicates
no strong algae blooms or HABs during NE monsoon or during spring or autumn
inter-monsoon. In general, two different patterns can be identified. During weak
summer SW monsoon after an El Niño event, blooms are transported northward
parallel to the coast. As example, Fig. 2 shows the surface chlorophyll distribution on
July 19, 2007, a post El Niño year. During strong summer SW monsoon, upwelling
water reaches the surface and the circulation pattern forms a filament of cold water
with high chlorophyll concentration propagation into the central part of the SCS (Xie
et al. 2003). Fig. 3 shows the surface chlorophyll distribution on July 16, 2008, a year
after a La Niña event.
2.2) The model concept
One important aspect in the GEOHAB Science Plan (GEOHAB 2003) is the
observation, modelling and prediction of HABs. The central question is: how can we
improve the detection and prediction of HABs by developing capabilities in
observation and modelling? The HAB forecast model presented here contributes to
point 5 of the HAB Science Implementation Plan and is strictly focussed on
modelling and prediction. The purpose of the model is to answer the question: in
which direction is the HAB advected after it has been detected? For Vietnamese
coastal waters, the relevant aspect is to predict the impact of HABs on fish farms and
aqua culture. Therefore, in case of appearance of a HAB, the model should give a
quick answer to prepare clean-up operations or shore protection. The presented
forecast model does not compute any biological aspect because the goal is the
prediction where does the HAB go and not its internal dynamics. The procedure
should be as simple as possible and as complex as necessary. The concept has been
adopted from oil spill modelling and mitigation and has been modified here for the
purpose of HAB forecast. The concept and the steps to do are as follows: 1) Regular
inspection of satellite images for high chlorophyll concentration and HABs 2) If a
HAB is detected, estimate geographical position and size; 3) Search from Met Office
the actual wind speed and direction; 4) Put these information into the model and let
the model run; 5) If the HAB moves offshore, do nothing; 6) If the HAB moves
inshore, prepare clean-up operation.

5
2.3) The model
The numerical model consists of a circulation model and a HAB model. The
circulation model is based on the HAMburg Shelf Ocean Model (HAMSOM)
(Backhaus 1985). HAMSOM is a three-dimensional, baroclinic, primitive equation
model with a free surface computed in an Arakawa C-grid (Arakawa and Lamb 1977).
The temporal resolution is 300 seconds, the horizontal resolution 4 N.m. To validate
the model results, hydrographic measurements of different cruise in the framework of
the German–Vietnamese Cooperation were used (Dippner et al. 2007a). Two different
circulation fields are constructed with HAMSOM (Hein 2008): one for weak SW
summer monsoon (Fig. 4) which appears after an ENSO event (Dippner et al. 2007a)
and one for strong SW summer monsoon (Fig. 5) occurring under normal conditions
or during La Niña years. Depending on the Southern Oscillation Index
(http://www.cgd.ucar.edu/cas/catalog/climind/soi.html), the seasonal baroclinic
surface circulation field for the advection of HABs is computed as a linear
combination of the two velocity fields.
These velocity fields drive the Lagrangian HAB model which simulates the transport
and diffusion by particle tracking. The transport equation for the Lagrangian tracer is:
[ ])1(**015.0)1(*),,(*),,(),,( iiLii WPtyxUttyxXttyxX !µ ++"+#+=#+!!!!!
(1)
where Xi is the two-dimensional Lagrangian coordinate of the i-th tracer, UL is the
surface velocity obtained from HAMSOM transformed onto Lagrangian coordinates,
P is a band width of turbulent fluctuation, W is the wind speed, and µi and λi are a
random numbers uniformly distributed between zero and unity. The boundary
condition is a reflecting boundary condition at the coast. If a Lagrangian tracer is
leaving the model through the open boundary, it is not considered any longer in the
computation. The equations are solved numerically with a fourth-order Runge-Kutta
method (Press et al. 1992) which has a higher accuracy than a classical Euler forward
scheme especially in the case of meandering flow fields, eddies or filaments. To
ensure a sufficient accuracy in the model, 5000 Lagrangian tracers are considered for
the HAB simulation and the drifter simulation. Details of the numerical procedure can
be found in Dippner (2005).
Turbulent mixing is assumed to be isotropic, but time dependent and is simulated with
Monte Carlo technique. The coordinate Xi of the tracer is subject of random

6
displacement. The turbulent fluctuation is assumed to be proportional to the age ! of
the individual tracer: 65.0!"P . This approach is equivalent to the 7/3 power law of
diffusion of Okubo (1971). A detailed description of this technique is given in
Dippner (2005). The surface HAB is assumed to be transported with 1.5% of the
actual wind speed. Gust is simulated as an anisotropic stochastic process in wind
direction. The approach is similar to classical oil spill modelling except that the wind
acts directly on surface with 1.5% instead of the usually 3% used in oil spill models
(Dippner 2005). The reason for the reduced direct wind action is that strong HABs
accumulate in the surface layer often with a thickness of ~10 cm. In contrast, oil
slicks slide on the surface and, therefore, they are more subject of direct wind action
which is considered with the 3% approach.
In central Vietnam, tides are diurnal, whereas in the vicinity of the entrance of River
Mekong tides are semidiurnal. Observations (Anonymous 2004, DHI 1998) and
model results (Hein 2008) indicate that tidal residuals in the SCS are weak and, in
addition, tidal ellipses are oriented parallel to the coast. That means no pronounced
onshore transport due to tides exists. Therefore, to save computer time, explicit
modelling of tides is not considered and tidal currents are parameterized via eddy
diffusivity.

7
3) Results
3.1) Model validation
In the frame work of the Joint Vietnamese – German Cooperation in marine sciences
a cruise took place in July 2003 with the Vietnamese research vessel MV Nghien Cuu
Bien (Dippner et al. 2007a). Among others, a Lagrangian drifter with a sediment trap
was deployed. The ship followed the drifter for 37 hours. The positions of the drifter
are marked with crosses (Fig. 6). These observations allow a validation of the model
with respect to the quality of advection. The start point of the model is the start point
of the drifter. A set of 5000 traces is released and the starting point of each tracer is
perturbed randomly ± 50 m around the start point. The model is integrated forwards in
time for 37 hours and every hour the centre of mass of 5000 tracers is computed and
plotted with dots. The distance of the final coordinate of the drifter to the model run is
9 km after 37 hours.
3.2) Model application
Two model applications are presented starting both close to Phan Ri Bay (Fig. 1)
where often strong blooms are visible on satellite images. The first simulation starts at
11°N and 108.5°E assuming weak monsoon circulation and a local wind of 2 Bft from
southwest. Figure 7 displays the position and extension of the patch after six days. A
second simulation is presented with the same initial position assuming strong SW
monsoon circulation and a local wind of 4 Bft. from southwest. Fig. 8 also displays
the position and extension of the patch after six days.
4) Discussion
The Vietnamese upwelling area has a pronounced seasonality due to the changes from
SW summer monsoon during summer to NE winter monsoon during winter (Dippner
et al. 2007a). Beside the monsoon activity, an inter-annual variability driven by the El
Niño–Southern Oscillation (ENSO) is influencing the dynamics of the South China
Sea with a time lag of few months (Dippner et al. 2007b). After an ENSO event, the
northern position of the Inter-Tropical Convergence Zone (ITCZ) is at ~ 9°N whereas
under normal conditions, the position of ITCZ in SCS is at ~ 21°N (Loick-Wilde et al.
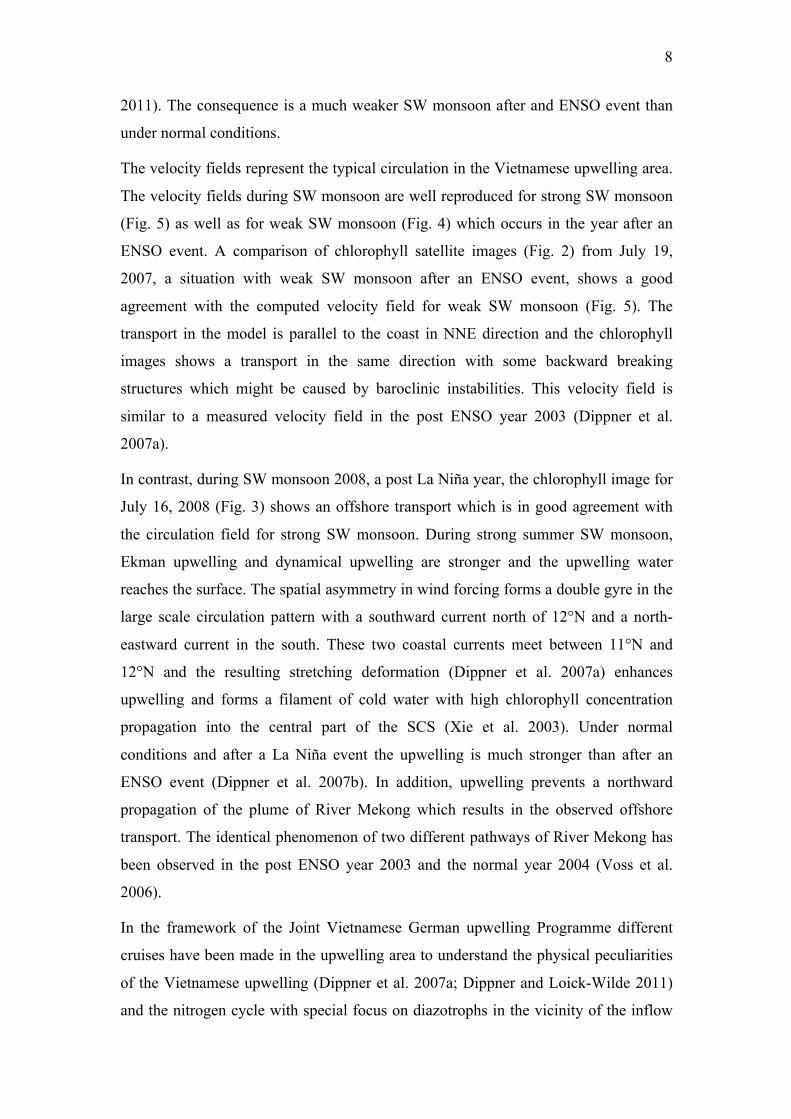
8
2011). The consequence is a much weaker SW monsoon after and ENSO event than
under normal conditions.
The velocity fields represent the typical circulation in the Vietnamese upwelling area.
The velocity fields during SW monsoon are well reproduced for strong SW monsoon
(Fig. 5) as well as for weak SW monsoon (Fig. 4) which occurs in the year after an
ENSO event. A comparison of chlorophyll satellite images (Fig. 2) from July 19,
2007, a situation with weak SW monsoon after an ENSO event, shows a good
agreement with the computed velocity field for weak SW monsoon (Fig. 5). The
transport in the model is parallel to the coast in NNE direction and the chlorophyll
images shows a transport in the same direction with some backward breaking
structures which might be caused by baroclinic instabilities. This velocity field is
similar to a measured velocity field in the post ENSO year 2003 (Dippner et al.
2007a).
In contrast, during SW monsoon 2008, a post La Niña year, the chlorophyll image for
July 16, 2008 (Fig. 3) shows an offshore transport which is in good agreement with
the circulation field for strong SW monsoon. During strong summer SW monsoon,
Ekman upwelling and dynamical upwelling are stronger and the upwelling water
reaches the surface. The spatial asymmetry in wind forcing forms a double gyre in the
large scale circulation pattern with a southward current north of 12°N and a north-
eastward current in the south. These two coastal currents meet between 11°N and
12°N and the resulting stretching deformation (Dippner et al. 2007a) enhances
upwelling and forms a filament of cold water with high chlorophyll concentration
propagation into the central part of the SCS (Xie et al. 2003). Under normal
conditions and after a La Niña event the upwelling is much stronger than after an
ENSO event (Dippner et al. 2007b). In addition, upwelling prevents a northward
propagation of the plume of River Mekong which results in the observed offshore
transport. The identical phenomenon of two different pathways of River Mekong has
been observed in the post ENSO year 2003 and the normal year 2004 (Voss et al.
2006).
In the framework of the Joint Vietnamese German upwelling Programme different
cruises have been made in the upwelling area to understand the physical peculiarities
of the Vietnamese upwelling (Dippner et al. 2007a; Dippner and Loick-Wilde 2011)
and the nitrogen cycle with special focus on diazotrophs in the vicinity of the inflow

9
of River Mekong (Voss et al. 2006; Bombar et al. 2010). Among others on a fixed
station grid phytoplankton species have been collected; details are given in Loick-
Wilde et al. (2011). During SW monsoon the dominant phytoplankton species is
Thecate dinoflagellates of 10 to 20 µm size at the surface (Loick-Wilde et al. 2011).
Figures 9 and 10 show the horizontal distribution of Thecate dinoflagellates at the sea
surface for two cruises during SW monsoon in July 2003 and in July 2004. These in-
situ data might be compared with the model results. Similar to the different pathways
of river Mekong (Voss et al. 2006), different patterns of Thecate dinoflagellates exist
which display the summer circulation although the observations on this two cruises do
not cover the whole area. In July 2003, the transport is parallel to the coast with some
meandering similar to the satellite image and the model result (Fig. 9). In July 2004, a
strong bloom occurred along the coast of Binh Thuan Province and an offshore
transport due to the circulation field (Fig. 10). A survey on an eddy resolving grid
covers 2-3 week depending on weather conditions. Therefore, the observed
distribution cannot be considered as synoptically. Nevertheless, qualitatively the
model results are in good agreement with the in-situ observations as well as with
satellite images.
A test of the quality of advection shows a difference of the final coordinate of the
drifter to the computed position in the model run of 9 km after 37 hours. This
difference is acceptable because it is in the order of tidal excursion. Tidal currents are
not explicitly modelled because the major axis of tidal ellipses are oriented parallel to
the coast which results in no pronounced onshore component of the velocity field. In
general, it is problematically to compare the track of a drifter with a sediment trap
which is influenced by deeper currents with wind driven near surface drift. However,
during the drifter experiment we had calm or shifting winds and in this case the wind
drift is of minor importance. In addition, as shown in Dippner et al. (2007a), the
observed velocities in the upwelling area are rather homogeneous in the upper 30 m
which allows such a comparison.
The fact that strong phytoplankton blooms and HABs are transported offshore (Fig. 8)
is of major advantage for the Vietnamese coast especially their aquaculture, fish farms
and beaches. In contrast, during a weak monsoon, the circulation field (Fig. 4)
transports the HABs along the coast. Under those circumstances, the small bays might

10
be infected by the patch with all possible economic damages mentioned in the
introduction.
5) Conclusions
HABs mainly occur on the coast of southern Vietnam in summer during SW monsoon
when River Mekong has the highest discharge which is up to 45,000 m3/s and 31,000
m3/s in the climatic mean (Nguyen 1990). During SW monsoon nutrients are available
due to the coastal upwelling and the high runoff of River Mekong. The fact that two
pronounced circulation pattern exist during SW monsoon allows to predict HAB
development. The model simulation predicts very well the drift and spreading of
HABs during weak and strong SW monsoons compared to satellite images. Therefore,
the model might be used to consult local Vietnamese authorities concerning the
protection of recreational areas at the shore or fish farms and aquacultures. Further
planned model improvements will be the implementation of an algorithm modelling
the appearance of pronounced land-sea breeze systems in the Vietnamese upwelling
area.
6) Acknowledgement
The German-Vietnamese cooperation has been financed by the German Research
Foundation (DFG/Bo-768), the Federal Ministry for Economic Cooperation and
Development (BMZ) and the Vietnamese Ministry of Science and Technology
(MOST), and by the Vietnamese Government to the National project KC-09-
03/06_10 which is greatly acknowledged. The velocity fields have been provided by
Hartmut Hein (Center for Marine and Atmospheric Science, Hamburg).
11
7) References Allen, J.I., Smyth, T.J., Siddorn, J.R., Holt, M., 2008. How well can we forecast high biomass algal bloom events in a eutrophic coastal sea? Harmful Algae, 8, 70-76. Anderson, D.M., 2007. The Ecology and Oceanography of Harmful Algal Blooms: Multidisciplinary Approaches to Research and Management. IOC Technical Series 74, UNESCO 2007. IOC/2007/TS/74
Anderson, D.M., Glibert, P.M., Burkholder, J.M., 2002. Harmful Algae Blooms and Eutrophication: Nutrient Sources, Composition, and Consequences. Estuaries, 25(4b), 705-726. Anderson, D.M., Burkholder, J.M., Cochlan, W.P., Glibert, P.M., Gobler, C.J., Heil, C.A., Kudela, R.M., Parsons, M.L., Rensel, J.E.J., Townsend, D.W., Trainer, V.L., Vargo, G.A., 2008. Harmful algal blooms and eutrophication: Examining linkages from selected coastal regions of the United States. Harmful Algae, 8(1), 39-53. doi:10.1016/j.hal.2008.08.017.
Anonymous, 2004. Admiralty Tide Tables Volume 3: Indian Ocean and South China Sea (including tidal stream tables). United Kingdom Hydrographic Office, 357pp.
Arakawa, A., Lamb, V.R., 1977. Computational design of the basic dynamical processes of the UCLA general circulation model. Methods Computat. Phys. 17, 173-265. Azanza, R.V., Fukuyo, Y., Yap, L.G., Takayama, H., 2005. Prorocentrum minimum bloom and ist possible link to a massive fish kill in Bolinao, Pangasinan, Northern Philippines. Harmful Algae News, 29, 13-14.
Backhaus, J.O., 1985. A three-dimensional model for the simulation of shelf sea dynamics. Dtsch. Hydrogr. Z. 38 (4), 165-187.
Bombar, D., Dippner, J.W., Doan, H.N., Ngoc, L.N., Liskow, I., Loick-Wilde, N., Voss M., 2010. Sources of new nitrogen in the Vietnamese upwelling region of the South China Sea. J. Geophys. Res., 115, C06018, doi:10.1029/2008JC005154. DHI, 1989. Handbook of the Indic and Pacific Ocean. 3rd Edition, Deutsches Hydrographisches Institut, Hamburg, 533pp. Dippner, J.W., 2005. Mathematical modelling of the transport of pollution in the water. In: Mathematical Models, ed J.A. Filar, in: Encyclopedia of Life Support System (EOLSS) developed under the auspices of the UNESCO, EOLSS Publisher, Oxford UK. Dippner, J.W., Loick-Wilde, N., 2011. A redefinition of water masses in the Vietnamese upwelling area. J. Mar. Syst., 84, 42-47. Dippner, J.W., Nguyen Kim Vinh, Hein, H., Ohde, T., Loick, N., 2007a. Monsoon-induced upwelling off the Vietnamese coast. Ocean Dynamics, 57:46-62. DOI 10.1007/s10236-006-0091-0
Dippner, J.W., Long B.H., Vinh, N.K., Pohlmann, T., 2007b. The Vietnamese upwelling in the light of climate variability. Proceedings of the Bien Dong 2007 Conference, 573-590. Doan-Nhu, H., Nguyen-Ngoc, L., Nguyen, C., Ho-Van, T., Nguyen-Thi, M.A., 2003. Plankton assemblages during the late bloom of Haptophyte Algae in Binh Thuan

12
province, Southern central Vietnam, in July 2002. Collection of Marine Research Works, XIII: 105–118
Doan-Nhu, H., D.N., Hguyen-Ngoc, L., N.N., Dippner, J.W., 2010. Development of phaeocystis globosa blooms in the upwelling water of the South Central Coast of Viet Nam. J. Mar. Syst., doi:10/1016/j.jmarsys.2010.04.015 GEOHAB, 2003. Global Ecology and Oceanography of Harmful Algae Blooms, Implementation Plan. P Gentien, G. Pitcher, A. Cemballa, P. Glibert (Eds) SCOR and IOC, Baltimore and Paris, 36 pp.
Hein, H., 2008. Vietnam upwelling – analysis of the upwelling and related processes in the coastal area off South Vietnam. Ph.D. Thesis, University Hamburg, 163pp.
Heisler, J., Glibert, P.M., Burkholder, J.M., Anderson, D.M., Cochlan, W., Dennison, W.C., Dortch, Q., Gobler, C.J., Heil, C.A., Humphries, E., Lewitus, A., Magnien, R., Marshall, H.G., Sellner, K., Stockwell, D.A., Stoecker, D.K., Suddleson, M., 2008. Eutrophication and harmful algal blooms: A scientific consensus. Harmful Algae, 8, 3-13. doi:10.1016/j.hal.2008.08.006. Loick-Wilde, N., Bombar, D., Hai, D.N., The, H.V., Lam, N.N., Voss, M., Dippner, J.W., 2011. Phytoplankton abundance and distribution in the Vietnamese upwelling area during SW monsoon under normal conditions and after an El Niño event. Progr. Oceanogr., submitted. Liu, C.L., Tang, D.L., Wang, S.F., Nguyen-Ngoc L., 2009. Variations in the dominant algal bloom-forming species in the western South China Sea from 1993 to 2007. African J. Mar. Sci., 31(3):373-380.
Maclean, J.L., 1989. Indo-Pacific red tide, 1985-1988. Marine Pollution Bulletin, 20, 304-310.
Nguyen, V.C., 1990. Estuary dynamics of rivers of Vietnam. Thesis, Moscow State University, Russia, 379 pp (in Russian)
Okubo, A., 1971. Oceanic diffusion diagrams. Deep Sea Research, 18:789-802. Press, W.H., Teukolsky, S.A., Vetterling, W.T., Flannery, B.P., 1992. Numerical Recipes in FORTRAN. The Art of Scientific Computing. 2nd Edition, Cambridge University Press, 963pp.
Qi, Y.Z., Chen, J.F., Wang, Z.H., Xu, N., Wang, Y., Shen, P.P., 2004. Some observations on harmful algal bloom (HAB) events along the coast of Guangdong, southern China in 1998. Hydrobiologia, 512, 209-214. Qian, H.L., Liang, S., Qi, Y.Z., 2000. Study of the characteristics and the causes of formation on the red tide in coastal water of Guangdong. Ecologic Science, 19:8-16. (in Chinese, with English abstract)
Voss, M., Bombar, D., Loick, N., Dippner J.W., 2006. Riverine influence on nitrogen fixation in the upwelling region off Vietnam, South China Sea. Geophys. Res. Lett., 33, L07604, doi:10:1029/2005GL025569. Wang, S.F., Tang, D.L., He, F.L., Fukuyo, Y., Azanza R.V., 2008. Occurrence of harmful algal blooms (HABs) associated with ocean environments in the South China Sea. Hydrobiologia, 596:79-93. DOI 10.1007/s10750-007-9059-4.

13
Xie, S.P., Xie, Q., Wang, D., Liu, W.T., 2003. Summer upwelling in the South China sea and ist role in regional climate variations. J. Geophys. Res., 108, C8, 3261, doi:10.1029/2003JC001867.

14
List of Figures Fig. 1: Area of investigation in the western SCS, showing the Khanh Hoa Province (KHP), Ninh Thuan Province (NTP), Binh Thuan Province (BTP), Ca Na Bay (1), Phan Ri Bay (2), Phan Thiet Bay (3), and Ham Tan Bay(4).
Fig. 2: Surface chlorophyll concentration on July 19, 2007 Fig. 3: Surface chlorophyll concentration on July 16, 2008
Fig. 4: Surface current field for weak SW monsoon. The scaled arrow represents 1 m/s.
Fig. 5: Surface current field for strong SW monsoon. The scaled arrow represents 0.8 m/s.
Fig. 6: Comparison between model run (dots) and Lagrangian drifter (crosses) deployed in July 2003
Fig. 7: Simulated patch after six days for weak SW monsoon and 2 Bft. SW winds. Cross marks the starting point.
Fig. 8: Simulated patch after six days for normal SW monsoon and 4 Bft. SW winds. Cross marks the starting point.
Fig. 9: Distribution of Thecate dinoflagellates of 10 to 20 µm size at the surface observed on a station grid during the Vietnamese German upwelling cruise VG-3 from 9.-28. July 2003. Contour Interval (CI) = 0.1 µg C /L. Crosses mark the stations. Fig. 10: Distribution of Thecate dinoflagellates of 10 to 20 µm size at the surface observed on a station grid during the Vietnamese German upwelling cruise VG-7 from 8.-26. July 2004. CI = 0.1 µg C /L. Crosses mark the stations.

107 108 109 110 11110
11
12
13
KHP
NTP
BTP
12
34
South China Sea
Vietnam
Fig. 1

Fig.2

Fig. 3
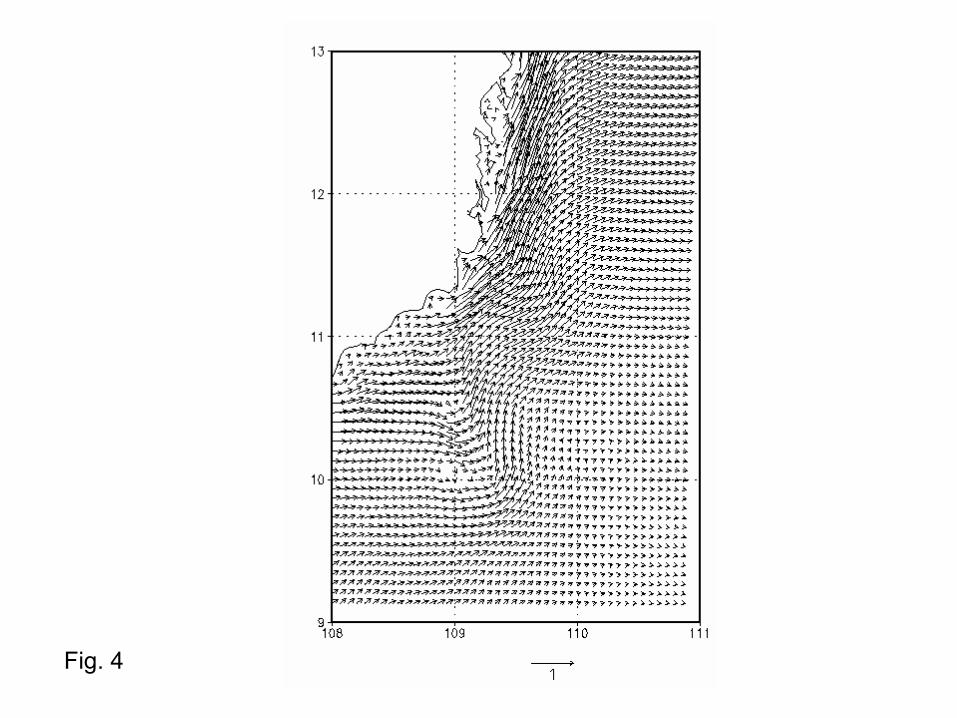
Fig. 4

Fig. 5

107 108 109 110 11110
11
12
13
Fig. 6

107 108 109 110 11110
11
12
13
Fig. 7

107 108 109 110 11110
11
12
13
Fig. 8

Fig. 9

Fig. 10