
Sinhagad Road – A profitable option for real estate investment
A model for choosing the most profitable
investment in a production station: A case study
En modell för att välja den mest lönsamma investeringen i en
produktionsstation: En fallstudie
Författare:Niklas Gustafsson
Tobias Fagerström
Handledare företag:
Ola Wagner, Xylem Water Solutions AB
Karl-Erik Andersson, Xylem Water Solutions AB
Handledare, LNU:Anders Ingwald
Martin Jakobsson Examinator, LNU:Basim Al-Najjar Termin: VT13 15 hp
Ämne/kurskod: 2SE09E
I
Summary English
Decisions has in recent years become more challenging, today the environment is changing in
an exponentially increasing pace. This is not the only challenge with modern decision making,
there are also: multiple criteria, intangibles, risk/uncertainty, long term implications,
interdisciplinary input, pooled decision making, value judgment and unintended
consequences. The purpose of the study is to create a model that provides a structured way of
comparing and evaluate different alternatives for a decision making process, regarding
profitability in a production station. The developed decision support model has its roots in the
Plan-Do-Check-Act (PDCA) improvement cycle, where the planning phase has been
modified. The planning phase of the model consists of seven steps that identify the process
and perform a cost-break-down structure of the cost related to the process. This enables
weights to be created and compared to each other and finally against other investment
alternatives. This facilitates a structured approach, which minimizes some of the risks that can
be involved in decision making and is further decreased by discovering uncertainties. The
decision making model have been tested on two different production processes in a
manufacturing company that is considering improvement investments.
Sammanfattning Svenska
Beslut har under de senaste åren blivit mer utmanande, idag förändras konkurrensklimatet i en
exponentiellt ökande takt. Det är inte den enda utmaningen med modern beslutsfattande, det
finns också flera andra faktorer så som: immateriella tillgångar, risk/osäkerhet, långsiktiga
konsekvenser, tvärvetenskaplig input, samlat beslutsfattande, värderingsomdöme och
oavsiktliga konsekvenser. Syftet med studien är att skapa en modell som ger ett strukturerat
sätt att jämföra och utvärdera olika alternativ för beslutsprocessen angående lönsamheten i en
produktionsprocess. Den utvecklade beslutsstödsmodellen har sina rötter i PDCA (Plan-Do-
Check-Act) förbättringscykel, där planeringsfasen har förändrats. Planeringsfasen i modellen
består av sju olika steg som identifierar processen och utföra en kostnadsnedbrytningsstruktur
av kostnaderna som har ett samband med processen. Detta möjliggör skapandet av vikter som
skall jämföras med varandra och slutligen mot andra investeringsalternativ.
Beslutsstödsmodellen underlättar ett strukturerat arbetssätt, vilket minimerar några av de
eventuella risker som kan vara involverande i beslutsfattandet, detta genom att upptäcka
osäkerheter. Beslutsstödsmodellen har testats på två olika produktionsprocesser som ingår i
ett producerande företag som överväger förbättringsinvesteringar.

II
Acknowledgment
We would like to send our gratitude to all the employees at Xylem Water Solution AB that
have been involved in this bachelor thesis. We would especially like to thank Ola Wagner
(Production manager) and Karl-Erik Andersson (Production manager), our two tutors at the
case company.
We would also like to thank Anders Ingwald and Martin Jacobsson, our two tutors at
Linnaeus University for their commitment and involvement. Your feedback and guidance has
been invaluable for the outcome of this thesis.
The support from Basim Al-Najjar, Mirka Kans and Matias Taye Hailemariam has been
invaluable with their feedback and constructive recommendations.
Thank you all!
Växjö, May 2013
Niklas Gustafsson Tobias Fagerström
III
Key Definitions
In Key Definitions the most commonly used terms are defined to clarify their application in
this thesis.
Grinding machine – A machine that sharpens and finishing surfaces from particles of
materials by abrasion (BusinessDictionary, 2013)
Lathe machine – A machine used to shape metal, wood, etc. The stock is rotating on a
horizontal axis and a cutting tool cuts away material on the piece (BusinessDictionary, 2013)
CNC – A computer controlled lathe machine (BusinessDictionary, 2013)
Production cell – Grouping of related operations according to the production flow
(BusinessDictionary, 2013)
Quality – “The quality of a product is its ability to satisfy, and preferably exceed, the needs
and expectations of a customer” (Bergman & Klefsjö, 2010)
Maintenance – The combination of all technical and administrative actions, including
supervision actions, intended to retain an item in, or restore it to, a state in which it can
perform a required function (British Standard Institution, 1993)
Logistics– “Logistics is the process of strategically managing the procurement, movement and
storage of materials, parts and finished inventory (and the related information flows) through
the organization” (Christopher, 2011)
Scrap – Items or material is carded as being incapable of being rectified or salvage within a
particular manufacturing process (British Standard Institution, 1993)
Fixture – Is a sling that is used for machines that uses tools, for example a CNC machine
(Andersson, 1990)
Throughput time – “The time required for a product to proceed from concept to launch, order
to delivery, or raw materials into the hands of the customer. This includes both processing
and queue time.” (Bizworx, 2013)
IV
Abbreviations
This includes all the abbreviations used in this thesis, in order of appearance.
LCC Life Cycle Costing
AHP Analytic Hierarchy Process
CNC Computer Numerical Control
BSP Business Source Premier
DBR Drum-Buffer-Rope
SADT System Analysis and Design Technique
IDEF Icam Definition for Function Modelling
ICAM Integrated Computer Aided Manufacturing Program
PDCA Plan-Do-Check-Act
PDSA Plan-Do-Study-Act
CBS Cost Breakdown Structure
TPS Toyota Production System
JIT Just In Time
MCDM Multi-Criteria-Decision-Making
MADM Multiple Attribute Decision Making
TOPSIS Technique for Order Preference by Similarity to Ideal Solution
V
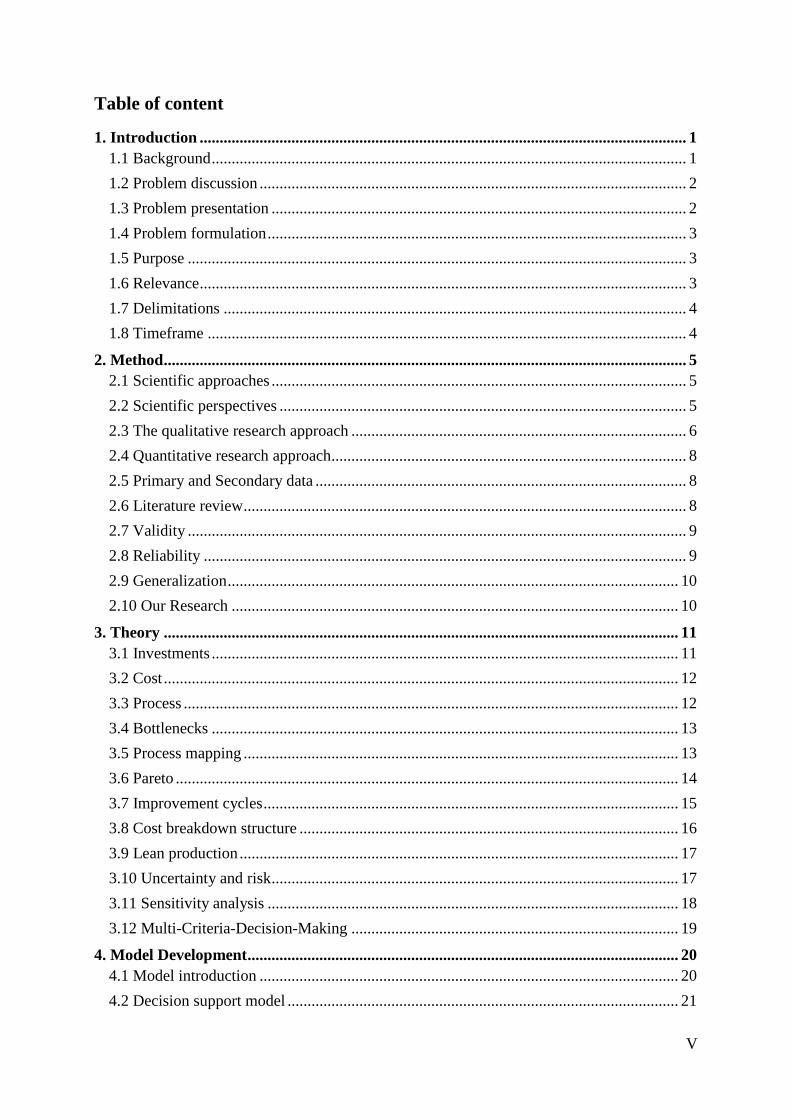
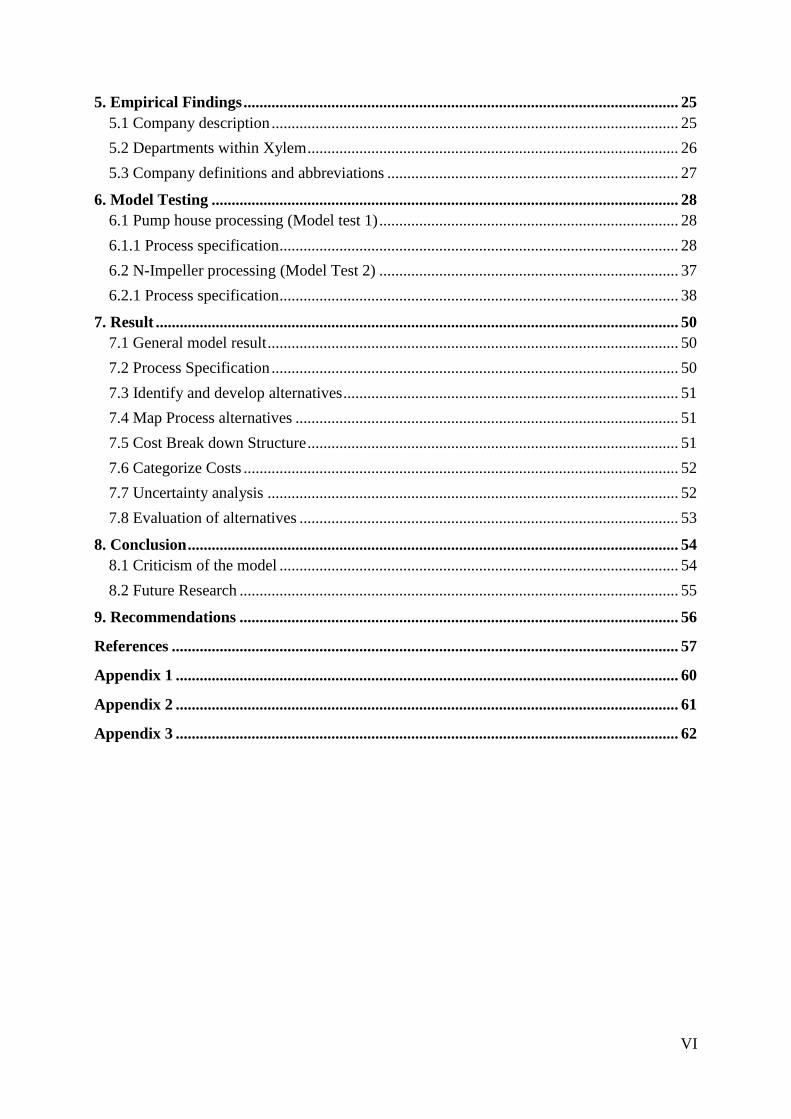
Table of content
1. Introduction .......................................................................................................................... 1
1.1 Background ....................................................................................................................... 1
1.2 Problem discussion ........................................................................................................... 2
1.3 Problem presentation ........................................................................................................ 2
1.4 Problem formulation ......................................................................................................... 3
1.5 Purpose ............................................................................................................................. 3
1.6 Relevance .......................................................................................................................... 3
1.7 Delimitations .................................................................................................................... 4
1.8 Timeframe ........................................................................................................................ 4
2. Method ................................................................................................................................... 5
2.1 Scientific approaches ........................................................................................................ 5
2.2 Scientific perspectives ...................................................................................................... 5
2.3 The qualitative research approach .................................................................................... 6
2.4 Quantitative research approach......................................................................................... 8
2.5 Primary and Secondary data ............................................................................................. 8
2.6 Literature review ............................................................................................................... 8
2.7 Validity ............................................................................................................................. 9
2.8 Reliability ......................................................................................................................... 9
2.9 Generalization ................................................................................................................. 10
2.10 Our Research ................................................................................................................ 10
3. Theory ................................................................................................................................. 11
3.1 Investments ..................................................................................................................... 11
3.2 Cost ................................................................................................................................. 12
3.3 Process ............................................................................................................................ 12
3.4 Bottlenecks ..................................................................................................................... 13
3.5 Process mapping ............................................................................................................. 13
3.6 Pareto .............................................................................................................................. 14
3.7 Improvement cycles ........................................................................................................ 15
3.8 Cost breakdown structure ............................................................................................... 16
3.9 Lean production .............................................................................................................. 17
3.10 Uncertainty and risk ...................................................................................................... 17
3.11 Sensitivity analysis ....................................................................................................... 18
3.12 Multi-Criteria-Decision-Making .................................................................................. 19
4. Model Development ............................................................................................................ 20
4.1 Model introduction ......................................................................................................... 20
4.2 Decision support model .................................................................................................. 21
VI
5. Empirical Findings ............................................................................................................. 25
5.1 Company description ...................................................................................................... 25
5.2 Departments within Xylem ............................................................................................. 26
5.3 Company definitions and abbreviations ......................................................................... 27
6. Model Testing ..................................................................................................................... 28
6.1 Pump house processing (Model test 1) ........................................................................... 28
6.1.1 Process specification .................................................................................................... 28
6.2 N-Impeller processing (Model Test 2) ........................................................................... 37
6.2.1 Process specification .................................................................................................... 38
7. Result ................................................................................................................................... 50
7.1 General model result ....................................................................................................... 50
7.2 Process Specification ...................................................................................................... 50
7.3 Identify and develop alternatives .................................................................................... 51
7.4 Map Process alternatives ................................................................................................ 51
7.5 Cost Break down Structure ............................................................................................. 51
7.6 Categorize Costs ............................................................................................................. 52
7.7 Uncertainty analysis ....................................................................................................... 52
7.8 Evaluation of alternatives ............................................................................................... 53
8. Conclusion ........................................................................................................................... 54
8.1 Criticism of the model .................................................................................................... 54
8.2 Future Research .............................................................................................................. 55
9. Recommendations .............................................................................................................. 56
References ............................................................................................................................... 57
Appendix 1 .............................................................................................................................. 60
Appendix 2 .............................................................................................................................. 61
Appendix 3 .............................................................................................................................. 62
VII
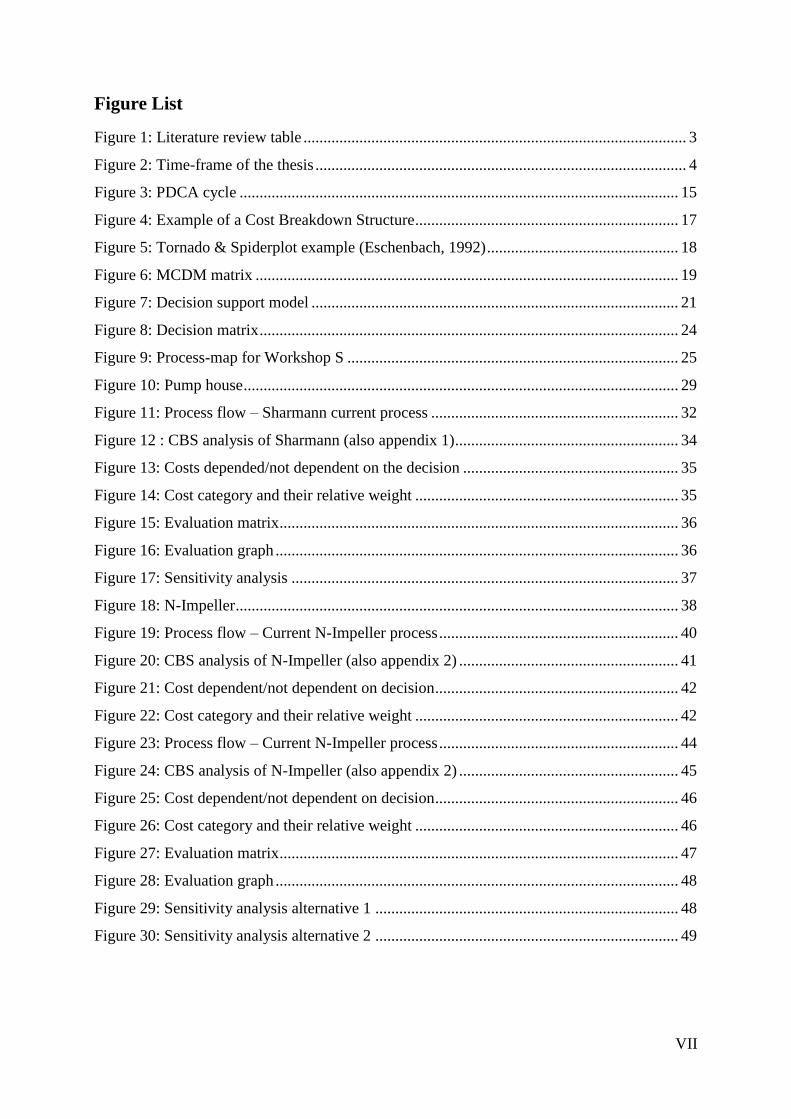
Figure List
Figure 1: Literature review table ................................................................................................ 3
Figure 2: Time-frame of the thesis ............................................................................................. 4
Figure 3: PDCA cycle .............................................................................................................. 15
Figure 4: Example of a Cost Breakdown Structure .................................................................. 17
Figure 5: Tornado & Spiderplot example (Eschenbach, 1992) ................................................ 18
Figure 6: MCDM matrix .......................................................................................................... 19
Figure 7: Decision support model ............................................................................................ 21
Figure 8: Decision matrix ......................................................................................................... 24
Figure 9: Process-map for Workshop S ................................................................................... 25
Figure 10: Pump house ............................................................................................................. 29
Figure 11: Process flow – Sharmann current process .............................................................. 32
Figure 12 : CBS analysis of Sharmann (also appendix 1) ........................................................ 34
Figure 13: Costs depended/not dependent on the decision ...................................................... 35
Figure 14: Cost category and their relative weight .................................................................. 35
Figure 15: Evaluation matrix .................................................................................................... 36
Figure 16: Evaluation graph ..................................................................................................... 36
Figure 17: Sensitivity analysis ................................................................................................. 37
Figure 18: N-Impeller ............................................................................................................... 38
Figure 19: Process flow – Current N-Impeller process ............................................................ 40
Figure 20: CBS analysis of N-Impeller (also appendix 2) ....................................................... 41
Figure 21: Cost dependent/not dependent on decision ............................................................. 42
Figure 22: Cost category and their relative weight .................................................................. 42
Figure 23: Process flow – Current N-Impeller process ............................................................ 44
Figure 24: CBS analysis of N-Impeller (also appendix 2) ....................................................... 45
Figure 25: Cost dependent/not dependent on decision ............................................................. 46
Figure 26: Cost category and their relative weight .................................................................. 46
Figure 27: Evaluation matrix .................................................................................................... 47
Figure 28: Evaluation graph ..................................................................................................... 48
Figure 29: Sensitivity analysis alternative 1 ............................................................................ 48
Figure 30: Sensitivity analysis alternative 2 ............................................................................ 49
1
1. Introduction
This chapter will introduce the reader to the problem by the use of the background and the
problem discussion. The focus of the problem has also been delimited and the purpose of the
thesis is also described.
1.1 Background
In today´s market there is a need to be competitive to survive and generate profit. Profitability
is the difference between revenue and expense, which means that the profitability could be
increased by either increasing the revenue or decreasing the expense. Defining profitability in
this way has its limitations, because profitability will in reality also be affected by the timing
of the income and expense (Rantanen, 1995). This requires organizations to form strategies to
eliminate unnecessary cost and utilize all available resources (Cottyn, et al., 2011). According
to Porter´s generic competitive strategy there are two major strategies to take into
consideration, low cost and differentiation to increase competitiveness. To lower the cost
there has to be a focus on productivity and/or on a narrow market or region. The
differentiation strategy is to produce a product or service that is considered unique by the
customer, enabling the company to charge a higher price. The optimal competitive advantage
is to be a cost leader with a superior product. To become cost leader, there needs to be a focus
on reducing costs; this could be done on various levels within the organization (Kreitner, 2009
). A way to reduce the cost is by focusing on the processes and optimizing the flow within the
process. A process consists of a network of activities, which could be: a value creating
activity, supporting activity or a non-value adding activity (Bergman & Klefsjö, 2010).
Lower cost can be achieved by improving a verity of areas within an organization such as
logistics, maintenance, quality and production. Improvements are needed to be able to keep
up and stay competitive in an ever changing environment. The majority of tasks performed by
an organization can be considered as a process or part of one. A process is a “network of
activity’s that repeat over time” (Bergman & Klefsjö, 2010, p. 470)and should perform its
activities while consuming as little resources as possible. This puts the focus on the recursive
elements of a process, which is the common interpretation referenced within the industrial
sector. This should not be confused with detentions within social science, which puts the
emphasis on the progress (e.g. human relationships) and what makes it unique (Bergman &
Klefsjö, 2010).
Focusing on different types of processes and utilize the organizational resources to as high
degree as possible is called operation management. Operation management can be defined
“as the process whereby resources, flowing within a defined system, are combined and
transformed by a controlled manner to add value in accordance with policies communicated
by management.” (Anil Kumar & Suresh, 2009). Within production companies there are costs
that might be considered unnecessary, these costs need to be eliminated or minimized. This
could be done by taking a decision of an improvement action of the manufacturing process
such as: reduce quality losses or increase maintenance effectiveness (Cottyn, et al., 2011).
2
1.2 Problem discussion
Decisions has in recent years become more challenging, today the environment is changing in
an exponentially increasing pace. This is not the only challenge with modern decision making,
there are also: multiple criteria, intangibles, risk/uncertainty, long term implications,
interdisciplinary input, pooled decision making, value judgment and unintended consequences
(Kreitner, 2009 ). A decision can be defined as “a moment, in an ongoing process of
evaluating alternatives for meeting an objective, at which expectations about a particular
course of action impel a decision maker to select that course of action most likely to result in
attaining the objective” (Harrison, 1996, p. 46).The general method of decision making is
according to Harrison (1996), consisting of six different steps, which starts off by (1) setting-
up objectives. (2)Search for alternatives based on the objectives. (3) Alternatives are then
evaluated and compared. (4) One of the alternatives is chosen based on the evaluation. (5)This
alternative is then implemented into the operational reality of the organization. (6)Finally the
decision is controlled by a follow-up, to see to what degree the objectives (set in step one),
was fulfilled.
According to step three of the decision making model above, the alternatives needs to be
evaluated and compared. This can be done by the use of a variety of decision support models,
such as: Analytic Hierarchy Process (AHP), pay-back, break-even or Life Cycle Costing
(LCC); providing a diversity of detail levels and dimensions. AHP is a model for pairwise
comparison between different alternatives, mostly used in cases where economic impact is
hard to quantify (Thomas & Saaty, 2006). The payback method is one of the simplest methods
for comparing alternatives and it calculates the number of periods (example years) it takes to
return the initial investment cost (Pike & Neale, 2006). Break-even is a model used to
determine the breaking point of when an investment starts to generate profit (e.g. Production;
considering the fixed cost and variable cost / unit) (Kreitner, 2009 ). LCC tries to determine
the entire cost of an investment during its lifetime (time of ownership); this is done by
considering all costs and is therefore the most profound method of the mentioned models.
(Johansson, 2010)Making an uneducated decision could have a negative impact on an
organization, both financially and technically; as there are several different risks involved in
any decision (Kreitner, 2009 ).
1.3 Problem presentation
To facilitate the decision making process in evaluating different alternatives, a thorough
analysis needs to be done. Because investments limits future options during a long time, well
developed tools and methods are necessary for making an investment decision (Nilsson &
Persson, 1993). This analysis has to take different aspects into consideration, one of which is
the cost. Within modern production industries most activities can be included in processes; it
is therefore important to create a model for cost breakdown for the different process elements.
This has to be related to their respective areas such as: storage, productivity, quality,
maintenance and stoppage-time (Al-Najjar, 2007). By using this to create weights, they can be
used as a decision support for future: investments, efficiency projects or maintenance
activities.
3
1.4 Problem formulation
How to select the most profitable investment in a production station?
1.5 Purpose
The purpose of this thesis is to develop a model to evaluate different investment alternatives
in a production station and select the most profitable, by decreasing cost.
1.6 Relevance
This research will create a model that facilitate the decision making process of an industrial
company, to increase the profit. This thesis will test the developed model in a case company,
with regards to the cost criteria of a production station.
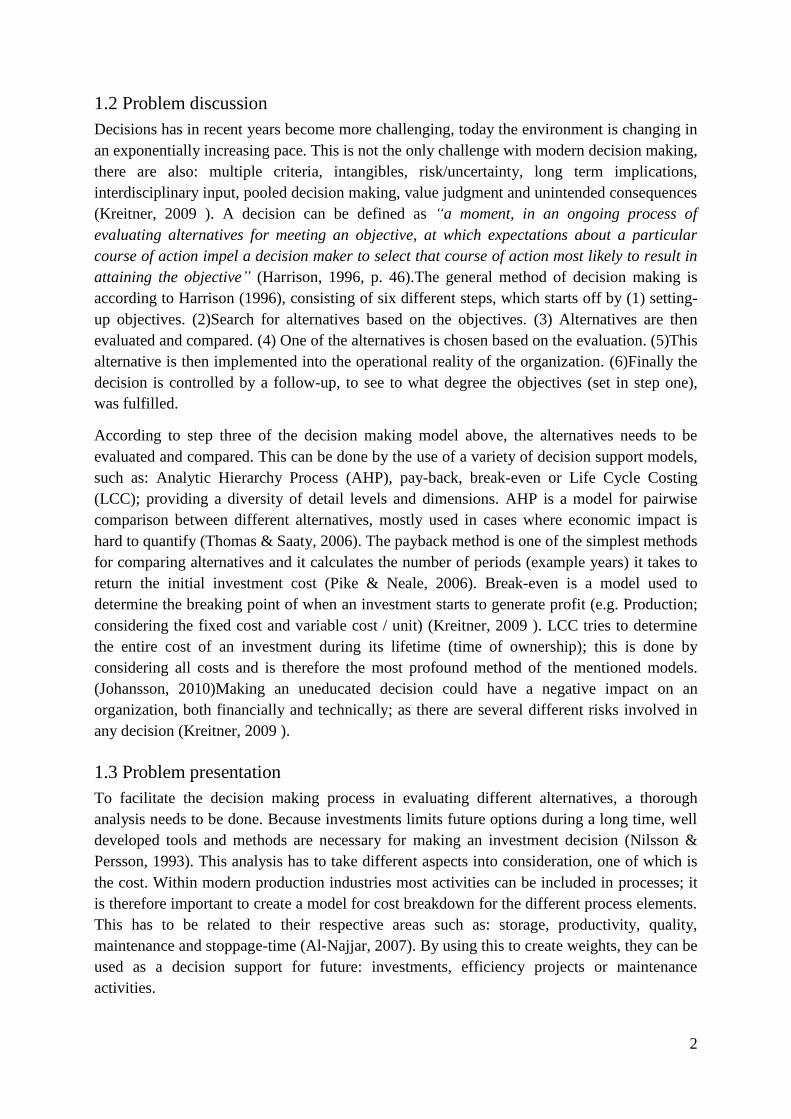
A literature review was performed to ensure the relevance and validity of the developed
model (seen in Figure 1).
Figure 1: Literature review table
The two following search engines Business Source Premier (BSP) and One Search were used
to perform the literature review. The first keyword that were used (investment models)
created several hits and to reduce the amount of articles a second keyword was used to filter
the search (production machines). The literature search only looked at published articles from
2008 to 2013. The authors have also filtered the research by only looking at peer reviewed
and full text versions; this is to ensure a high validity of the article and enable the authors to
review the entire article. There were 18 articles still remaining after this filtration had been
applied. Careful review of the articles resulted in a conclusion that only one article was
directly relevant to the research topic, which was written by Rao (2008) and uses Multiple
Attribute Decision Making (MADM) to evaluate decision alternatives. One of the articles
discovered was not directly relevant and was written by Silva & Morabito (2009), which was
excluded because it is focusing on performance and capacity as decision support indicators.
This literature review shows that the area that the authors are researching has been explored
before, but not with the same focus and approach as the authors.
4
1.7 Delimitations
The timeframe of this study limit the authors to only test the model on two processes and only
one alternative will be analyzed on test 1.
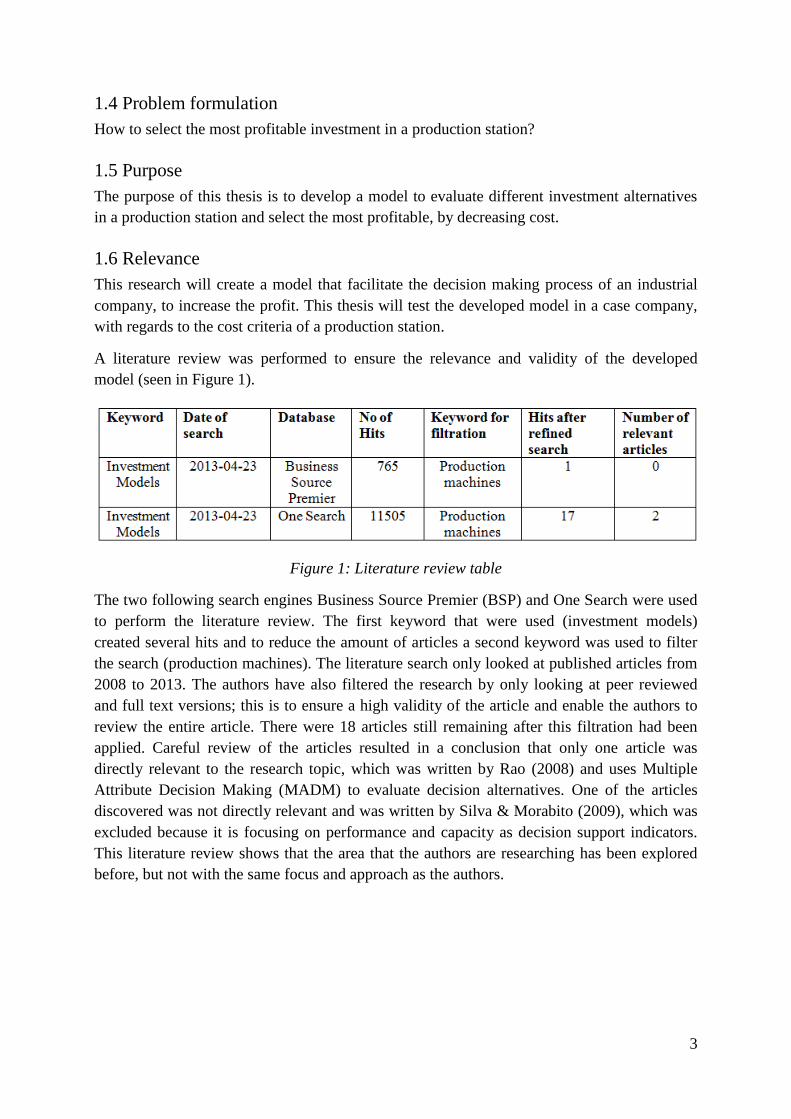
1.8 Timeframe
This is the timeframe used for this thesis and is presented in a Gant chart below (Figure 2):
Figure 2: Time-frame of the thesis
5
2. Method
The methodology used to solve the problem is defined and explained within this chapter; with
regards to validity, reliability and generalization.
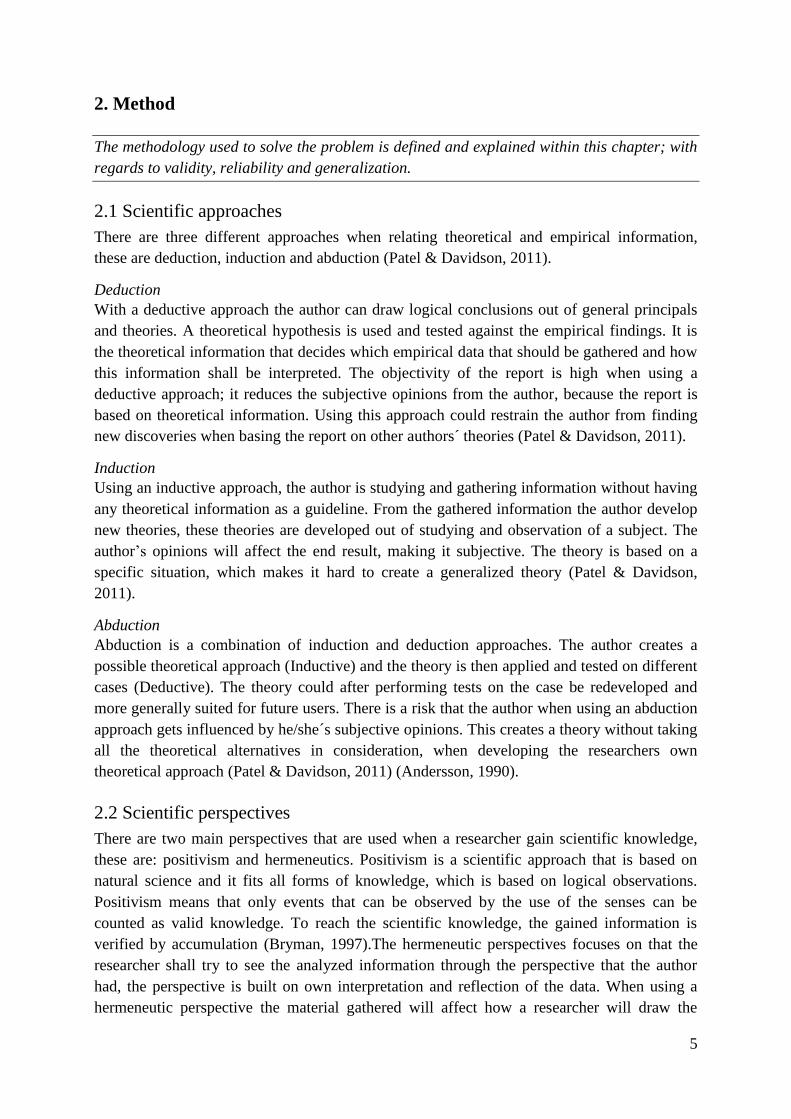
2.1 Scientific approaches
There are three different approaches when relating theoretical and empirical information,
these are deduction, induction and abduction (Patel & Davidson, 2011).
Deduction
With a deductive approach the author can draw logical conclusions out of general principals
and theories. A theoretical hypothesis is used and tested against the empirical findings. It is
the theoretical information that decides which empirical data that should be gathered and how
this information shall be interpreted. The objectivity of the report is high when using a
deductive approach; it reduces the subjective opinions from the author, because the report is
based on theoretical information. Using this approach could restrain the author from finding
new discoveries when basing the report on other authors´ theories (Patel & Davidson, 2011).
Induction
Using an inductive approach, the author is studying and gathering information without having
any theoretical information as a guideline. From the gathered information the author develop
new theories, these theories are developed out of studying and observation of a subject. The
author’s opinions will affect the end result, making it subjective. The theory is based on a
specific situation, which makes it hard to create a generalized theory (Patel & Davidson,
2011).
Abduction
Abduction is a combination of induction and deduction approaches. The author creates a
possible theoretical approach (Inductive) and the theory is then applied and tested on different
cases (Deductive). The theory could after performing tests on the case be redeveloped and
more generally suited for future users. There is a risk that the author when using an abduction
approach gets influenced by he/she´s subjective opinions. This creates a theory without taking
all the theoretical alternatives in consideration, when developing the researchers own
theoretical approach (Patel & Davidson, 2011) (Andersson, 1990).
2.2 Scientific perspectives
There are two main perspectives that are used when a researcher gain scientific knowledge,
these are: positivism and hermeneutics. Positivism is a scientific approach that is based on
natural science and it fits all forms of knowledge, which is based on logical observations.
Positivism means that only events that can be observed by the use of the senses can be
counted as valid knowledge. To reach the scientific knowledge, the gained information is
verified by accumulation (Bryman, 1997).The hermeneutic perspectives focuses on that the
researcher shall try to see the analyzed information through the perspective that the author
had, the perspective is built on own interpretation and reflection of the data. When using a
hermeneutic perspective the material gathered will affect how a researcher will draw the
6
conclusions, therefore it is important to gather a lot of data about the chosen topic (Bryman &
Nilsson, 2011).
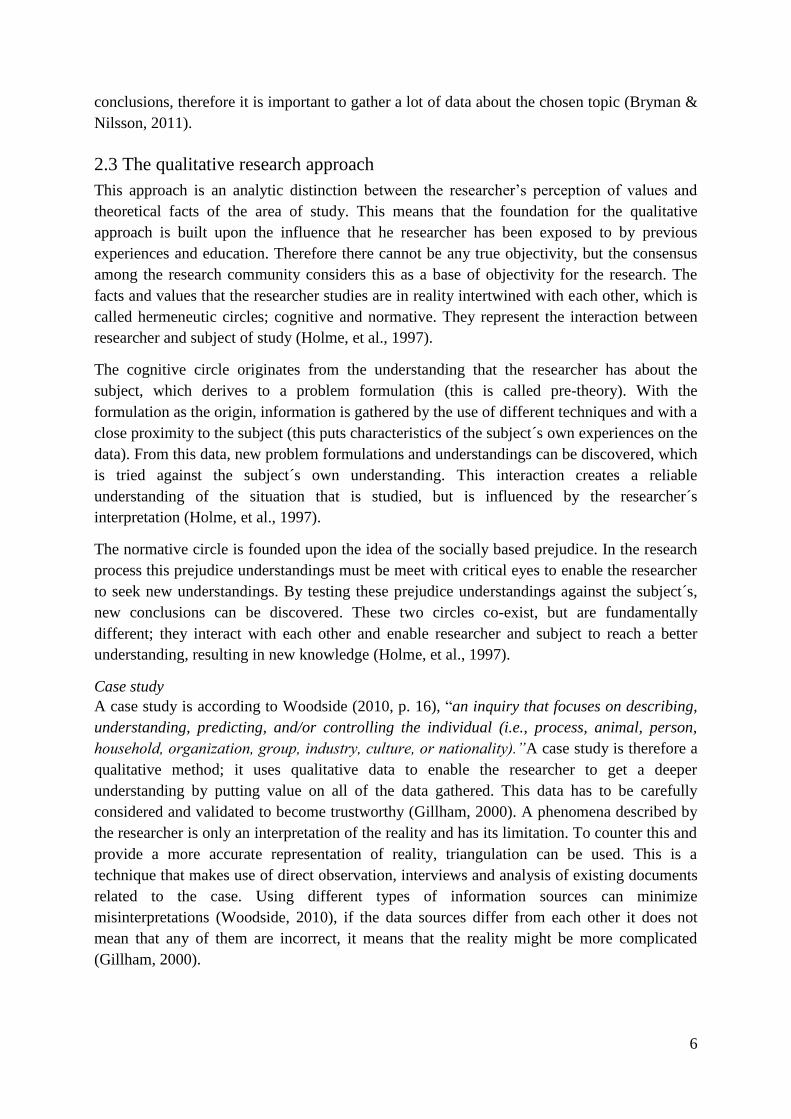
2.3 The qualitative research approach
This approach is an analytic distinction between the researcher’s perception of values and
theoretical facts of the area of study. This means that the foundation for the qualitative
approach is built upon the influence that he researcher has been exposed to by previous
experiences and education. Therefore there cannot be any true objectivity, but the consensus
among the research community considers this as a base of objectivity for the research. The
facts and values that the researcher studies are in reality intertwined with each other, which is
called hermeneutic circles; cognitive and normative. They represent the interaction between
researcher and subject of study (Holme, et al., 1997).
The cognitive circle originates from the understanding that the researcher has about the
subject, which derives to a problem formulation (this is called pre-theory). With the
formulation as the origin, information is gathered by the use of different techniques and with a
close proximity to the subject (this puts characteristics of the subject´s own experiences on the
data). From this data, new problem formulations and understandings can be discovered, which
is tried against the subject´s own understanding. This interaction creates a reliable
understanding of the situation that is studied, but is influenced by the researcher´s
interpretation (Holme, et al., 1997).
The normative circle is founded upon the idea of the socially based prejudice. In the research
process this prejudice understandings must be meet with critical eyes to enable the researcher
to seek new understandings. By testing these prejudice understandings against the subject´s,
new conclusions can be discovered. These two circles co-exist, but are fundamentally
different; they interact with each other and enable researcher and subject to reach a better
understanding, resulting in new knowledge (Holme, et al., 1997).
Case study
A case study is according to Woodside (2010, p. 16), “an inquiry that focuses on describing,
understanding, predicting, and/or controlling the individual (i.e., process, animal, person,
household, organization, group, industry, culture, or nationality).”A case study is therefore a
qualitative method; it uses qualitative data to enable the researcher to get a deeper
understanding by putting value on all of the data gathered. This data has to be carefully
considered and validated to become trustworthy (Gillham, 2000). A phenomena described by
the researcher is only an interpretation of the reality and has its limitation. To counter this and
provide a more accurate representation of reality, triangulation can be used. This is a
technique that makes use of direct observation, interviews and analysis of existing documents
related to the case. Using different types of information sources can minimize
misinterpretations (Woodside, 2010), if the data sources differ from each other it does not
mean that any of them are incorrect, it means that the reality might be more complicated
(Gillham, 2000).
7
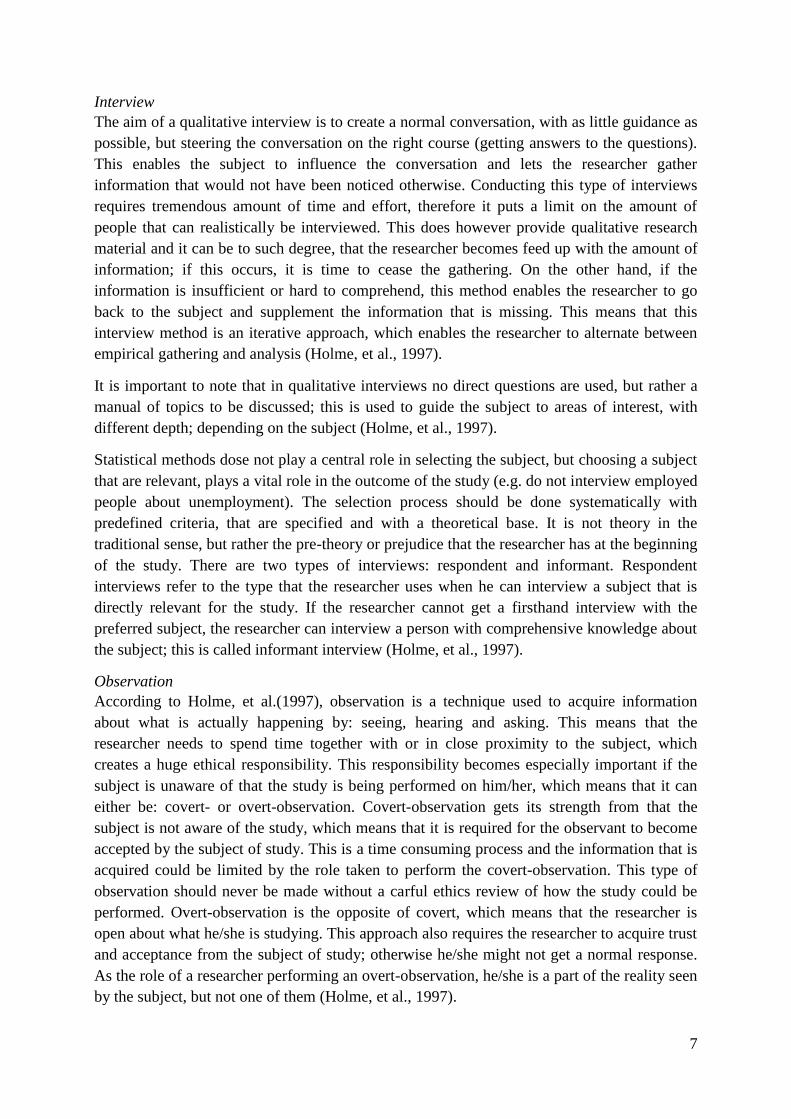
Interview
The aim of a qualitative interview is to create a normal conversation, with as little guidance as
possible, but steering the conversation on the right course (getting answers to the questions).
This enables the subject to influence the conversation and lets the researcher gather
information that would not have been noticed otherwise. Conducting this type of interviews
requires tremendous amount of time and effort, therefore it puts a limit on the amount of
people that can realistically be interviewed. This does however provide qualitative research
material and it can be to such degree, that the researcher becomes feed up with the amount of
information; if this occurs, it is time to cease the gathering. On the other hand, if the
information is insufficient or hard to comprehend, this method enables the researcher to go
back to the subject and supplement the information that is missing. This means that this
interview method is an iterative approach, which enables the researcher to alternate between
empirical gathering and analysis (Holme, et al., 1997).
It is important to note that in qualitative interviews no direct questions are used, but rather a
manual of topics to be discussed; this is used to guide the subject to areas of interest, with
different depth; depending on the subject (Holme, et al., 1997).
Statistical methods dose not play a central role in selecting the subject, but choosing a subject
that are relevant, plays a vital role in the outcome of the study (e.g. do not interview employed
people about unemployment). The selection process should be done systematically with
predefined criteria, that are specified and with a theoretical base. It is not theory in the
traditional sense, but rather the pre-theory or prejudice that the researcher has at the beginning
of the study. There are two types of interviews: respondent and informant. Respondent
interviews refer to the type that the researcher uses when he can interview a subject that is
directly relevant for the study. If the researcher cannot get a firsthand interview with the
preferred subject, the researcher can interview a person with comprehensive knowledge about
the subject; this is called informant interview (Holme, et al., 1997).
Observation
According to Holme, et al.(1997), observation is a technique used to acquire information
about what is actually happening by: seeing, hearing and asking. This means that the
researcher needs to spend time together with or in close proximity to the subject, which
creates a huge ethical responsibility. This responsibility becomes especially important if the
subject is unaware of that the study is being performed on him/her, which means that it can
either be: covert- or overt-observation. Covert-observation gets its strength from that the
subject is not aware of the study, which means that it is required for the observant to become
accepted by the subject of study. This is a time consuming process and the information that is
acquired could be limited by the role taken to perform the covert-observation. This type of
observation should never be made without a carful ethics review of how the study could be
performed. Overt-observation is the opposite of covert, which means that the researcher is
open about what he/she is studying. This approach also requires the researcher to acquire trust
and acceptance from the subject of study; otherwise he/she might not get a normal response.
As the role of a researcher performing an overt-observation, he/she is a part of the reality seen
by the subject, but not one of them (Holme, et al., 1997).
8
The researcher will be influenced by the subject and influence them as well, regardless of a
covert- or overt-observation. By just observing the subject the researcher is changing the
condition of the subject, which means that the researcher can only try to limit this change.
There is no clear method for doing so, there is however two different approaches with
different implications: passive and active participation. Passive participation can change the
activity of the subject, either by increasing or decreasing the working pace. But active
participation means that the researcher needs to take on a role that is appropriate for the
subject, which can be correct or not. If it is successful it can create the best possibility for the
research. Either way it is important to use behavior and clothing that the subject feels familiar
with, to minimize the researcher’s impact (Holme, et al., 1997).
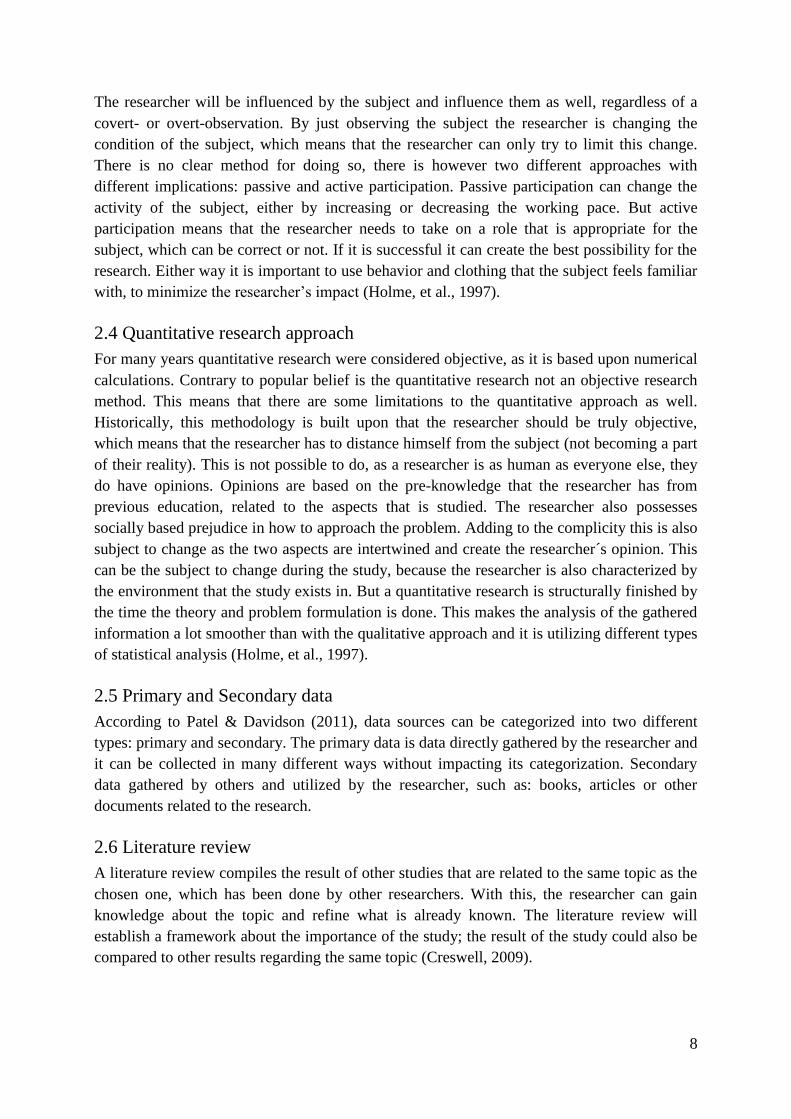
2.4 Quantitative research approach
For many years quantitative research were considered objective, as it is based upon numerical
calculations. Contrary to popular belief is the quantitative research not an objective research
method. This means that there are some limitations to the quantitative approach as well.
Historically, this methodology is built upon that the researcher should be truly objective,
which means that the researcher has to distance himself from the subject (not becoming a part
of their reality). This is not possible to do, as a researcher is as human as everyone else, they
do have opinions. Opinions are based on the pre-knowledge that the researcher has from
previous education, related to the aspects that is studied. The researcher also possesses
socially based prejudice in how to approach the problem. Adding to the complicity this is also
subject to change as the two aspects are intertwined and create the researcher´s opinion. This
can be the subject to change during the study, because the researcher is also characterized by
the environment that the study exists in. But a quantitative research is structurally finished by
the time the theory and problem formulation is done. This makes the analysis of the gathered
information a lot smoother than with the qualitative approach and it is utilizing different types
of statistical analysis (Holme, et al., 1997).
2.5 Primary and Secondary data
According to Patel & Davidson (2011), data sources can be categorized into two different
types: primary and secondary. The primary data is data directly gathered by the researcher and
it can be collected in many different ways without impacting its categorization. Secondary
data gathered by others and utilized by the researcher, such as: books, articles or other
documents related to the research.
2.6 Literature review
A literature review compiles the result of other studies that are related to the same topic as the
chosen one, which has been done by other researchers. With this, the researcher can gain
knowledge about the topic and refine what is already known. The literature review will
establish a framework about the importance of the study; the result of the study could also be
compared to other results regarding the same topic (Creswell, 2009).
9
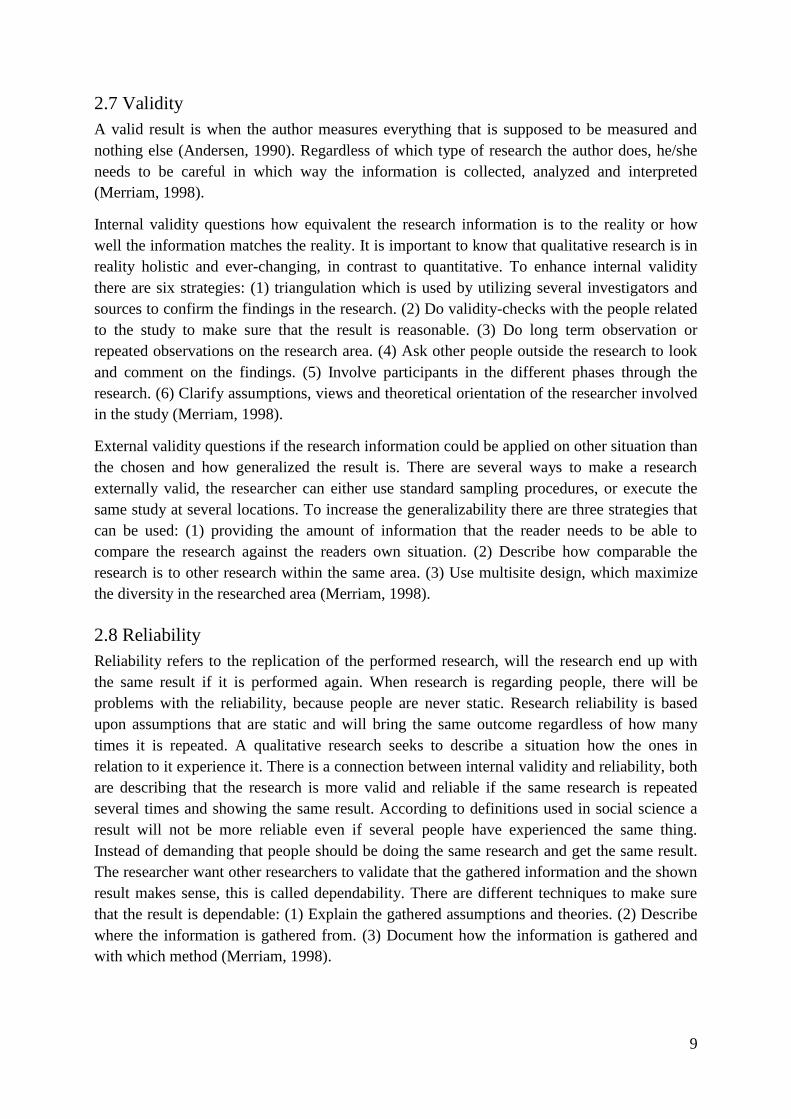
2.7 Validity
A valid result is when the author measures everything that is supposed to be measured and
nothing else (Andersen, 1990). Regardless of which type of research the author does, he/she
needs to be careful in which way the information is collected, analyzed and interpreted
(Merriam, 1998).
Internal validity questions how equivalent the research information is to the reality or how
well the information matches the reality. It is important to know that qualitative research is in
reality holistic and ever-changing, in contrast to quantitative. To enhance internal validity
there are six strategies: (1) triangulation which is used by utilizing several investigators and
sources to confirm the findings in the research. (2) Do validity-checks with the people related
to the study to make sure that the result is reasonable. (3) Do long term observation or
repeated observations on the research area. (4) Ask other people outside the research to look
and comment on the findings. (5) Involve participants in the different phases through the
research. (6) Clarify assumptions, views and theoretical orientation of the researcher involved
in the study (Merriam, 1998).
External validity questions if the research information could be applied on other situation than
the chosen and how generalized the result is. There are several ways to make a research
externally valid, the researcher can either use standard sampling procedures, or execute the
same study at several locations. To increase the generalizability there are three strategies that
can be used: (1) providing the amount of information that the reader needs to be able to
compare the research against the readers own situation. (2) Describe how comparable the
research is to other research within the same area. (3) Use multisite design, which maximize
the diversity in the researched area (Merriam, 1998).
2.8 Reliability
Reliability refers to the replication of the performed research, will the research end up with
the same result if it is performed again. When research is regarding people, there will be
problems with the reliability, because people are never static. Research reliability is based
upon assumptions that are static and will bring the same outcome regardless of how many
times it is repeated. A qualitative research seeks to describe a situation how the ones in
relation to it experience it. There is a connection between internal validity and reliability, both
are describing that the research is more valid and reliable if the same research is repeated
several times and showing the same result. According to definitions used in social science a
result will not be more reliable even if several people have experienced the same thing.
Instead of demanding that people should be doing the same research and get the same result.
The researcher want other researchers to validate that the gathered information and the shown
result makes sense, this is called dependability. There are different techniques to make sure
that the result is dependable: (1) Explain the gathered assumptions and theories. (2) Describe
where the information is gathered from. (3) Document how the information is gathered and
with which method (Merriam, 1998).
10
2.9 Generalization
If the findings can be applied in other situations than the one it is based on, it is called
generalization and it is addressing the same question as external validity. Controlling factors
that could affect the outcome more than acceptable can have an effect on the generalization. If
so, the findings could only be generalized to other highly controlled situations. Performing a
qualitative research can affect the generalization of the report because the generalization is
based out of only a few people’s assumptions within a population. A qualitative research tries
to understand a specific situation and not what is generally true for the chosen situation.
Applying huge generalized data into small individual samples are highly questioned and are
hardly useful. Either the researcher do a limitation that the research is not generalized, or they
try to strength the external validity by sampling procedures. Another way is by using many
cases to the same situation (Merriam, 1998).
2.10 Our Research
In this report the research will be based on an abduction approach, which enables the
researchers to create a theoretical framework as a base for the study. Using this approach
takes the positive aspects of both inductive and deductive, which allows the framework to be
altered and adapted towards the empirical findings. This process of adapting the framework
will increase the usefulness for a broader user-base. This could be done by what is described
in the qualitative research as the cognitive circle, where the researcher starts by defining a
problem and is then influenced by the subjects of study. To test the theoretical framework the
researchers will conduct a case study, which will enable them to be influenced and to be able
to change and create a more general result. The case study will involve two processes which
will increase the reliability of the study. To counter some of the problems of doing empirical
based research, there is a strategy to increase validity called triangulation that is also defined
within a case study research. This method uses interviews, observations and existing data to
increase the approximation to reality. As this research will be based on a case study it is in
between positivism and hermeneutics. The researchers will use qualitative interviews, which
provides a deeper understanding than a quantitative, which therefore requires more time and
puts a limit on the amount of people that can realistically be interviewed. The researchers
have chosen to perform overt-observations because of the additional ethical implications of
covert-observations, and it will be done by passive participation. Those observations will
provide the researcher with primary data and part of this will be complemented by secondary
data; such as books, articles and other specific information regarding the subject. To further
increase the validity of the report, the six internal strategies will be used for example, the
research will be reviewed several times throughout the different phases.
11
3. Theory
In the theory chapter the theoretical information is defined and explained, which will be used
to motivate and develop the chosen approach for the model.
3.1 Investments
Investment is a concept used at several economical levels; it is used both in private
economics, company economics and socioeconomics. For these three an investment means
that something is purchased for durable usage. In a company, an investment is expected to
generate or increase a future income and is therefore often intended to be used during a long
period time. An investment decision can be divided into two categories; one is the utilization
of existing resources, the other one concern changes in the resource structure. A decision
regarding an investment means choosing between doing an investment or not, then choosing
between different alternatives. There are different classifications for investments in companies
(Nilsson & Persson, 1993):
Capacity investments – Investments with purpose to increase the production capacity.
New investments – Investments with purpose to increase the capacity for new
products.
Quality improved investments – Investments with purpose to increase the quality in
the production.
Replacement investments – Equipment gets old and wears out, which is shown by:
longer shutdowns, increased maintenance etc.
An investment shall solve problems at the company, such as problems regarding: capacity,
efficiency and environment. Choosing an investment means that some problems are solved by
the investment and others remain, which might develop opportunities that should be
approached. The planning of an investment starts by a formal planning on a strategic level in
the company, where guidelines concerning areas such as: the market, market areas,
technology and products. The strategic planning is then used on the resource planning level
where the investment planning and project proposal are submitted. The investment decision
process consists of several steps: (1) Problem and goals are identified. (2) Alternatives are
identified, presented and compare to each other. (3) Gather information about costs,
installation, equipment, service, etc., to enable an alternative selection. (4) Evaluation of
consequences, both technical and economic aspects is taken into consideration. (5)Choosing
an alternative with help of the previous steps. Before choosing the alternative, consultation
with concerned employees and managers are performed (Nilsson & Persson, 1993).
12
3.2 Cost
There are a lot of different types of cost and they can be categorized in verity of different
ways; they are also diverse in their level of impact, occurrence and magnitude. The most
common categorization of cost is fixed, variable and incremental cost (Sullivan, et al., 2012).
Fixed cost – This cost do not change depending on production level, within a given
capacity range. Example of this cost is: administrate cost, interest cost and licensing
fees.
Variable cost–Is cost that changes with production volume or activity level. This could
for example be material cost that increases the total cost, but stay the same per
produced unit.
Incremental cost – Is the additional cost that comes from increasing the output level;
this cost is most commonly associated with decisions regarding minimal output
increase´s that will significantly increase the cost.
Another common categorization is standard cost, direct cost and indirect cost; where direct
cost can be directly related to an entity and indirect cost cannot. Standard cost is used for
planning (future manufacturing costs) and are estimated costs for producing a product or
service (Sullivan, et al., 2012).
3.3 Process
According to Bergman & Klefsjö (2010, pp. 470), a process can be defined as “a network of
activities that are repeating over time and with the purpose of creating value for an internal
or external customer”. This focuses on the recursive elements of a process, which is the
interpretation of a process, used by the industrial sector. This should not be confused with the
use of the word process within social science, which puts the emphasis on the progress (e.g.
human relationships) and what makes it unique (Bergman & Klefsjö, 2010).
A process has a beginning and an end, a customer and a supplier; this definition of a process
could be complex and hard to grasp. It is therefore useful to group them into different types of
categories, which can be done in different ways; one is to categorize them by where their
interface is located:
Individual processes – Completed by one individual
Functional processes – Is an organizational process connected to a unit, department or
function
Core processes – This process runs through a number of different departments and
functions with the sole purpose of creating revenue for the organization
Another way of distinguish processes are by what type of task they perform:
Main process – Exists to satisfy external customer needs by refining products that the
company supply
Support process – Provides resources that is needed for the function of the main
process, which means that it only has internal customers
13
Management process – Is used to make strategic decisions based on the company’s
goals and to facilitate improvements to other processes
The main purpose of a process is to yield it´s owner the attended result, while minimizing the
resource consumption; this requires careful planning and good leadership. To minimize the
resource consumption, priorities should shift towards continues improvements instead of
“firefighting” (temporary solutions to critical problems). Working towards improving the
process requires a systematic approach, which starts with understanding the process to find
the most profitable areas for improvement. This is usually done by mapping the current
process and visually displaying it with the use of a flowchart (Bergman & Klefsjö, 2010).
3.4 Bottlenecks
A bottleneck is created when a resource has lower capacity than the real needs. A bottleneck
is showing an unbalance in one of the process elements, which is appearing when the capacity
in one operation in a series of operations is lower than the others (Petersson, et al., 2009). The
bottleneck affects the outputs of the process, which determine the total output of the process.
Increasing the input will not increase the output, rather the opposite. There is a big chance that
it will clog the system and increase the work-in-progress as focusing on bottlenecks is to
increase resource utilization (Russell & Taylor, 2011). A bottleneck can be minimized by new
equipment investments or by improving the existing equipment. One thing to notice is that if a
bottleneck is reduced in a process, another bottleneck often pops up in the same process but in
another element (Stevenson, 2009).
Drum-Buffer-Rope (DBR) is a concept that schedules the bottleneck and supports the
schedule with production from non-bottleneck operations. The drum is the actual bottleneck
in the process, setting the output limit for the process. Buffer is the inventory placed before
the bottleneck to keep it continuously running. The rope is the signal that tells the upstream
activities when they shall start the production. The batch sizes for the bottleneck activity shall
be large because it will reduce the setup time and not in small batches. In the other activities
the batches could be small because the setup time for those will not affect the process (Russell
& Taylor, 2011).
3.5 Process mapping
Process mapping is a method for effectively describe and visualize a process and its inner
workings (workflows etc.), which is used in businesses to get a better understanding of their
processes. It is important to only show details critical for the target audience, because too
much information defeats the purpose of providing a visual aid. To create a process map,
empirical data has to be gathered and it can be visualized in several ways (Paradiso &
Cruickshank, 2007).
14
Value-stream Mapping
A value stream is according to Chen, et al. (2010), all information and material needed to
manufacture a specific product. To visualize and map this information a value-stream map
can be used to describe the current or future state of the value stream. Value-stream mapping
can according to Rother, et al. (2001), be used to identify waste activities, which can be useful
to facilitate the decision making process.
Flow chart
A flow chart describes a process and its elements over time and includes the connection
between the different elements (Bergman & Klefsjö, 2010). It is a tool that creates an
understandable representation of reality, it is easier to understand a diagram than an
equivalent text explanation (Meyer, et al., 2007). This is done by illustrating the process-
elements with the use of boxes and arrows showing their connection to each other (Bergman
& Klefsjö, 2010).
System Analysis and Design Technique
This method was developed by SofTech and is a visualization method providing a more
detailed view then the traditional flow chart. It visualizes the different elements of a system or
process by boxes and arrows and with the addition of arrows displaying the control (above the
box) and the mechanics (under the box) required for implementing the elements function
(Colter, 1984).
Icam DEFinitions for function modeling
Icam DEFinitions for function modeling (IDEF0) is derived from System Analysis and
Design Technique (SADT) by the US Air force’s Integrated Computer Aided Manufacturing
Program (ICAM) during the 1980. An IDEF0 is a series of related diagrams, which are
organized in hieratic order, from top-down level activity diagram. It provides an analytic
approach proficient in its graphically display capabilities of complex functional relationships.
It differentiates between organization and function, which makes ideal for identifying process
functionality (what is happening) and not process organizational structure (who is performing
the action). The IDEF0 is simplistic in its shape and form and it uses only boxes and arrows;
the boxes represent the elements/activities and arrows are their interface (input, output,
control and mechanics) (Ang, et al., 1997).
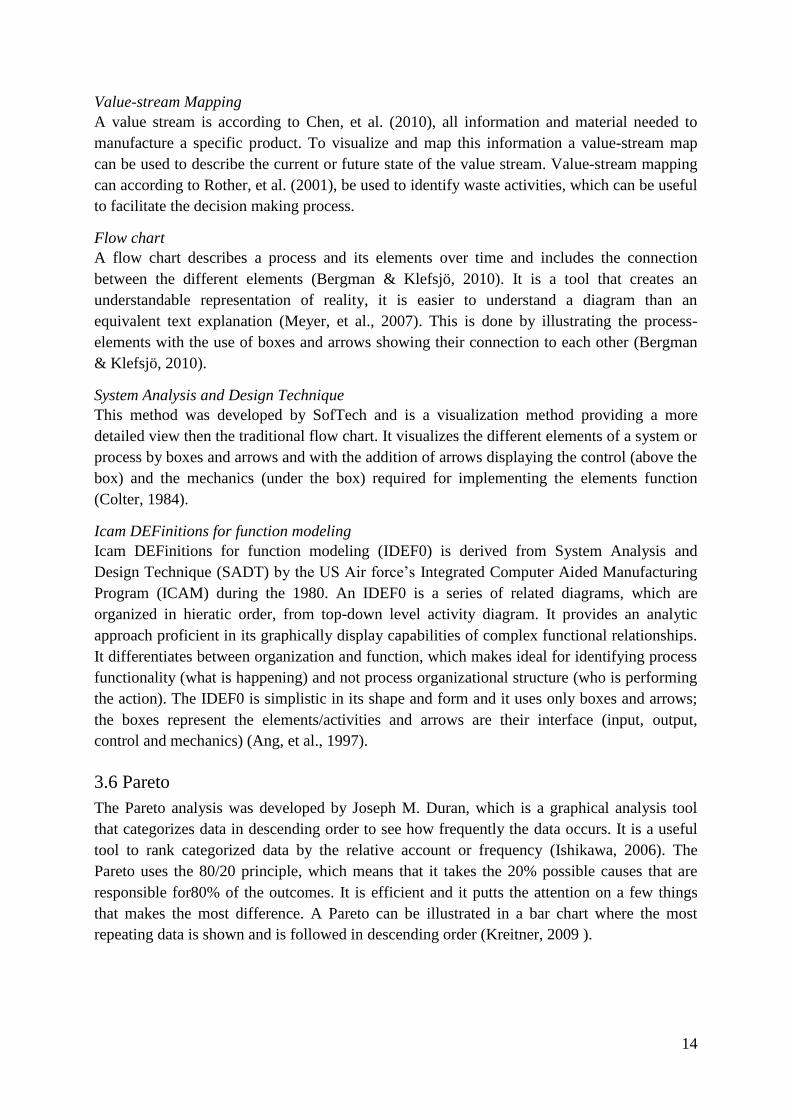
3.6 Pareto
The Pareto analysis was developed by Joseph M. Duran, which is a graphical analysis tool
that categorizes data in descending order to see how frequently the data occurs. It is a useful
tool to rank categorized data by the relative account or frequency (Ishikawa, 2006). The
Pareto uses the 80/20 principle, which means that it takes the 20% possible causes that are
responsible for80% of the outcomes. It is efficient and it putts the attention on a few things
that makes the most difference. A Pareto can be illustrated in a bar chart where the most
repeating data is shown and is followed in descending order (Kreitner, 2009 ).
15
3.7 Improvement cycles
Because nothing is perfect, there is always a need for improvements, both large and small. By
the use of an improvement tool, these improvements can easily be handled. For a company it
is good to have a standardized way of handling improvements. There are several different
tools that can be use, they are not that different form each other and look similar (Bicheno, et
al., 2013).
Plan-Do-Check-Act
The Plan-Do-Check-Act (PDCA) is a problem-solving and continuous improvement model,
which is a methodology developed by W. Edward Deming for product quality improvements.
Deming based the PDCA model on the Shewhart cycle, which is a six step statistical process
control method for quality improvement. The PDCA have recently been changed to Plan-Do-
Study-Act (PDSA), it still has the same purpose and meaning. It was changed because
Deming thought that the word Check could be misunderstood and interpreted as “to hold
back”, but many continues improvement authors still use the original PDCA concept name.
When applying a PDCA the goal is to improve the processes, the processes are not dependent
upon the overall management, to achieve the set up goals (Manuele, 2008). It is important to
work with the PDCA continuously, to follow up and to discover new problems in the process
(Bergman & Klefsjö, 2012).
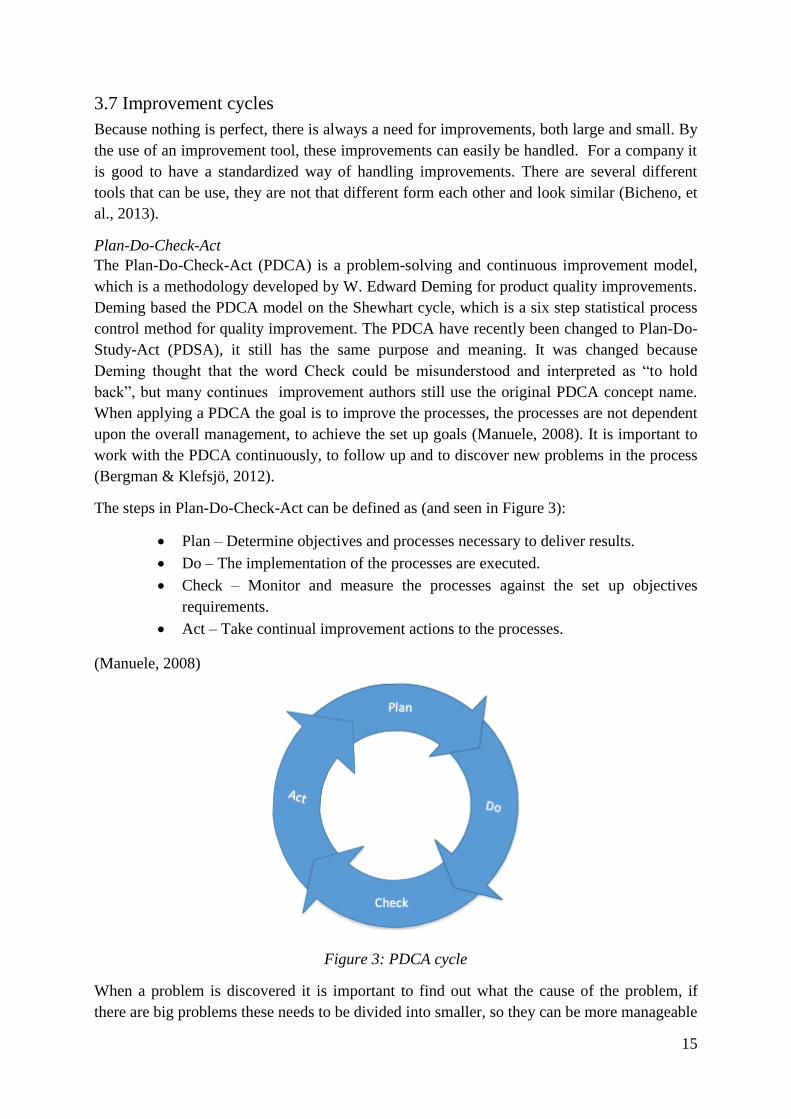
The steps in Plan-Do-Check-Act can be defined as (and seen in Figure 3):
Plan – Determine objectives and processes necessary to deliver results.
Do – The implementation of the processes are executed.
Check – Monitor and measure the processes against the set up objectives
requirements.
Act – Take continual improvement actions to the processes.
(Manuele, 2008)
Figure 3: PDCA cycle
When a problem is discovered it is important to find out what the cause of the problem, if
there are big problems these needs to be divided into smaller, so they can be more manageable
16
(Plan). When a cause is identified, proposed actions are taken (Do). After the action taken, the
action needs to be checked to see if they lead to improvements (Check). To avoid future
problems, it is important to gain knowledge about the improvement work taken (Act)
(Bergman & Klefsjö, 2012).
Investigate-Design-Execute-Adjust
Investigate-Design-Execute-Adjust (IDEA) is a version of PDCA and is used within
innovation and design. In the investigate phase: customer problems, purpose and needs are
identified. Within the design phase the new solutions is presented. In the execute phase the
presented solution are tested and some adjustments to the solutions can be made to make it fit
the set standards and demands (Bicheno, et al., 2013).
Define-Measure-Analyze-Improve-Control
Define-Measure-Analyze-Improve-Control (DMAIC) is another version of PDCA and uses in
the Six Sigma method. The first step of this improvement cycle is to define the problem,
where it is important to choose what to focus on; because of time limitations a Pareto tool
could be useful to do the selections. In the second step it decides what shall be measured and
what goals the improvements shall have. Included in the analyze step is identification of
variation and faults and what have caused them. In the improvement phase corrections are
done, and allowed deviations are determined and also implementations are made. The final
step is control, where follow ups are made to see how the improvements are reaching the set
goals (Bicheno, et al., 2013).
8D
8D-cyceln is an improvement method using eight steps: use one team, describe the problem,
isolate the symptoms, identify the root cause, choose actions that can solve the problem,
implement the improvement actions, prevent the problem from occurring again and when
done it is celebrated (Bicheno, et al., 2013).
3.8 Cost breakdown structure
Cost breakdown structure includes a top-down/bottom-up structure and is used to identify all
relevant costs, which are related to a: specific product, system, project etc. All costs are
presented in numerous categories that are combined to provide the total cost (Banchard,
2004). It could have different appearances depending on what the user wants to include and
there are several requirements that needs to be fulfilled: it shall be easy to use, update and
develop. It also needs to be sufficiently comprehensive, so that all costs are included. There
shall be a clear cost definitions and it needs to be flexible so it can be adapted to other systems
and it shall be comparable to other CBS´s. This will let the decision maker create different
option analyzes. A CBS is often involved in a number of other types of breakdowns as well
(Smit, 2012).
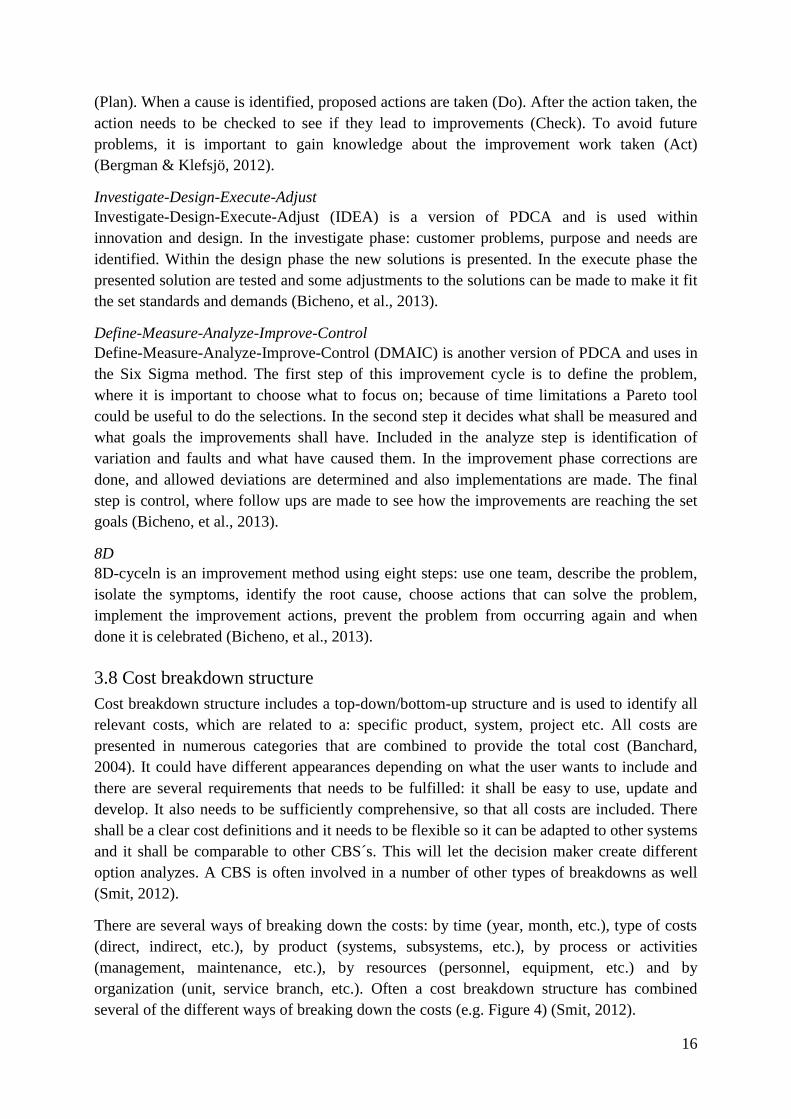
There are several ways of breaking down the costs: by time (year, month, etc.), type of costs
(direct, indirect, etc.), by product (systems, subsystems, etc.), by process or activities
(management, maintenance, etc.), by resources (personnel, equipment, etc.) and by
organization (unit, service branch, etc.). Often a cost breakdown structure has combined
several of the different ways of breaking down the costs (e.g. Figure 4) (Smit, 2012).
17
Figure 4: Example of a Cost Breakdown Structure
3.9 Lean production
This is a well know approach for offensive quality improvement within the industrial sector
and originates from Toyota and their Toyota production system (TPS). The interest for
applying lean has been increasing during the past years in other sectors than those with the
main focus on production. The main principle of lean is its focus on reducing waste and non-
value adding activities, with a continuing aim to satisfy customers. Non-value adding
activates are those that do not create any value for its customer, which is an ongoing process,
which aims for perfection. Reducing waste and at the same time increasing customer
satisfaction, is according to lean done by changing the production towards Just In Time (JIT).
JIT changes the traditional production process from producing a pre-determined amount of a
specific product towards producing the amount that the customer requests (Bergman &
Klefsjö, 2010).This is also what is known as Push and Pull strategies within Supply chain
management (Kreitner, 2009 ). There is an equal importance to understand the value creation
as it is to understand where the waste comes from. Waste can be different things depending on
what type of organization that the lean philosophy has been applied, Bergman & Klefsjö
(2010) gives some examples: overproduction, waiting, transport, faulty processes, storage,
rework (correcting faulty production) and problems within the working environment and
safety.
3.10 Uncertainty and risk
The main difference between uncertainty and risk is that uncertainty cannot be quantified.
Risk on the other hand can be quantified, which makes the risk the probability of a deviation
from an expected result to occur (Sullivan, et al., 2009). A wide area of disciplines, including
but not limited to: finance, business management and politics; needs to considered risk of
uncertainty (Power, 2007). But according to Sullivan, et al.(2009), there is only three major
factors to consider in engineering economics, those are:
18
Inaccuracy in the estimated cash-flow
Nature of the economics of the chosen business area; some fluctuate more the others
Physical plant and equipment
Those has to be considered during the decision making process, but it can be hard to
determine the exact risk as it includes several unknown factors (uncertainty). Considering this
in regard to profitability a company has to according to Al-Najjar (2008), utilize their valuable
and rare resources effectively and efficiently. To facilitate the utilization there is a need for
high quality data mapping of the situation in regards to different aspects such as: technical,
environmental, financial and managerial. To calculate the estimated risk of this data there are
several different mathematical models that can be applied, such as: probability trees, discrete
random variables and continuous random variables. If this data cannot be quantified, this
should be considered as an uncertainty (Sullivan, et al., 2009).
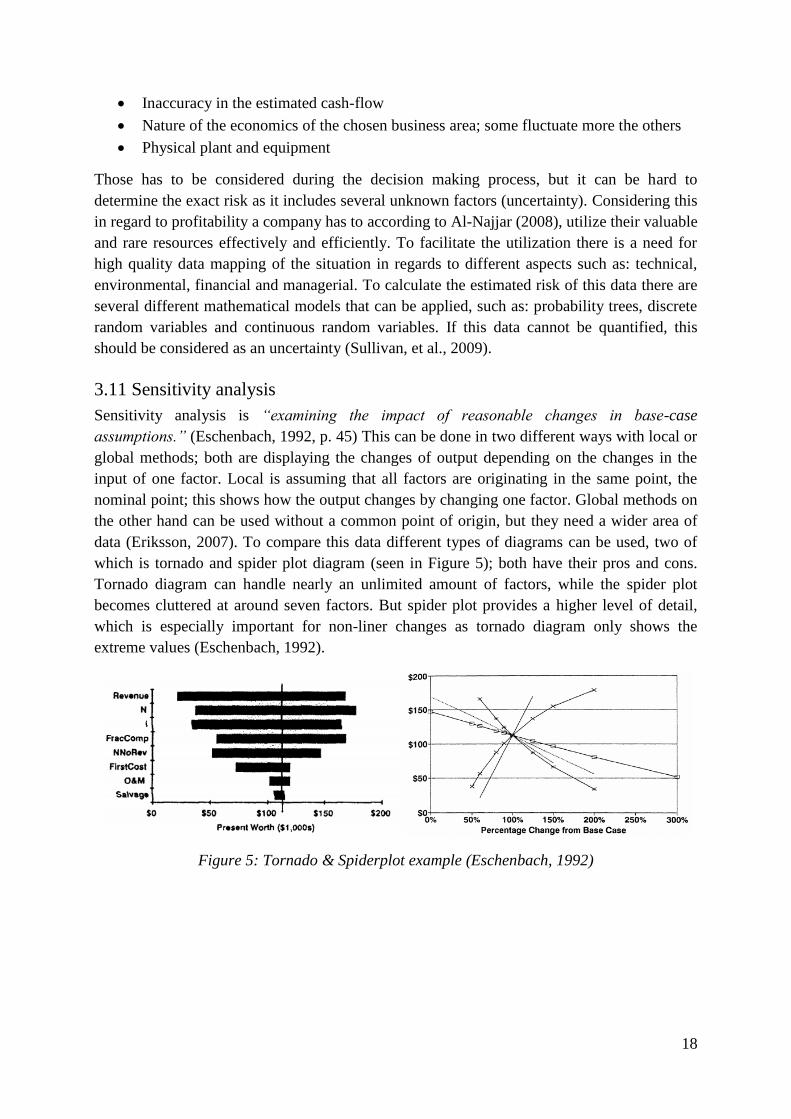
3.11 Sensitivity analysis
Sensitivity analysis is “examining the impact of reasonable changes in base-case
assumptions.” (Eschenbach, 1992, p. 45) This can be done in two different ways with local or
global methods; both are displaying the changes of output depending on the changes in the
input of one factor. Local is assuming that all factors are originating in the same point, the
nominal point; this shows how the output changes by changing one factor. Global methods on
the other hand can be used without a common point of origin, but they need a wider area of
data (Eriksson, 2007). To compare this data different types of diagrams can be used, two of
which is tornado and spider plot diagram (seen in Figure 5); both have their pros and cons.
Tornado diagram can handle nearly an unlimited amount of factors, while the spider plot
becomes cluttered at around seven factors. But spider plot provides a higher level of detail,
which is especially important for non-liner changes as tornado diagram only shows the
extreme values (Eschenbach, 1992).
Figure 5: Tornado & Spiderplot example (Eschenbach, 1992)
19
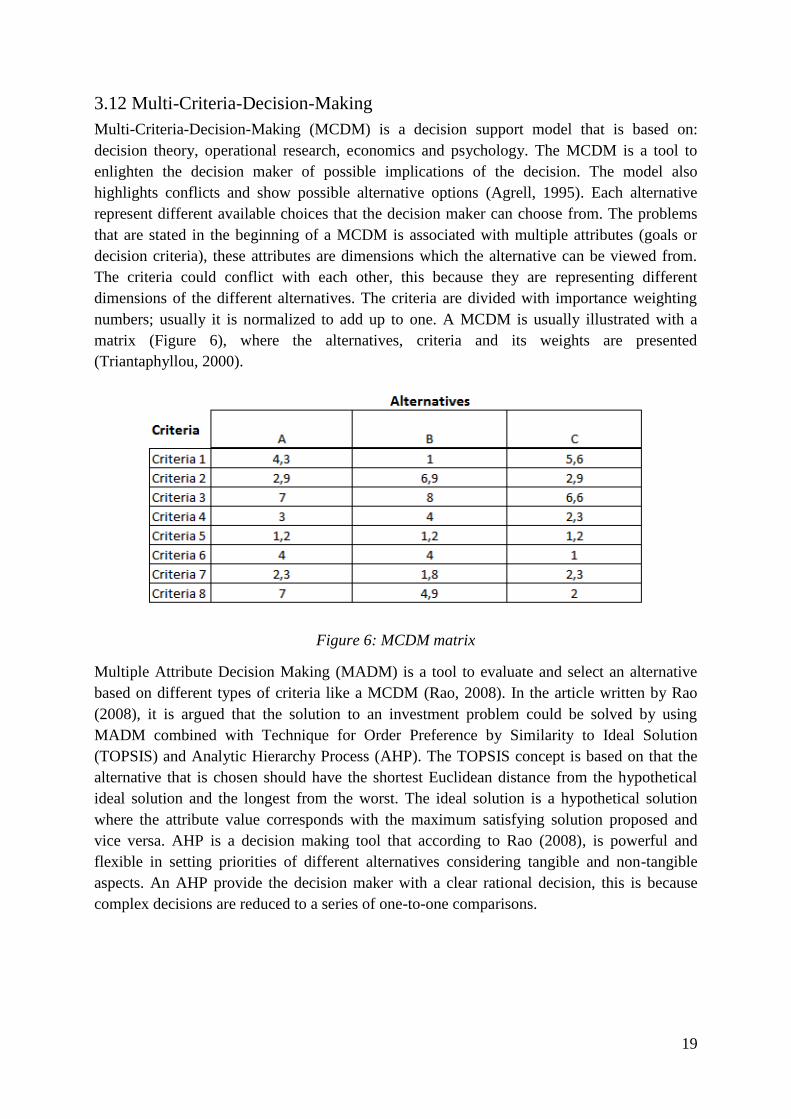
3.12 Multi-Criteria-Decision-Making
Multi-Criteria-Decision-Making (MCDM) is a decision support model that is based on:
decision theory, operational research, economics and psychology. The MCDM is a tool to
enlighten the decision maker of possible implications of the decision. The model also
highlights conflicts and show possible alternative options (Agrell, 1995). Each alternative
represent different available choices that the decision maker can choose from. The problems
that are stated in the beginning of a MCDM is associated with multiple attributes (goals or
decision criteria), these attributes are dimensions which the alternative can be viewed from.
The criteria could conflict with each other, this because they are representing different
dimensions of the different alternatives. The criteria are divided with importance weighting
numbers; usually it is normalized to add up to one. A MCDM is usually illustrated with a
matrix (Figure 6), where the alternatives, criteria and its weights are presented
(Triantaphyllou, 2000).
Figure 6: MCDM matrix
Multiple Attribute Decision Making (MADM) is a tool to evaluate and select an alternative
based on different types of criteria like a MCDM (Rao, 2008). In the article written by Rao
(2008), it is argued that the solution to an investment problem could be solved by using
MADM combined with Technique for Order Preference by Similarity to Ideal Solution
(TOPSIS) and Analytic Hierarchy Process (AHP). The TOPSIS concept is based on that the
alternative that is chosen should have the shortest Euclidean distance from the hypothetical
ideal solution and the longest from the worst. The ideal solution is a hypothetical solution
where the attribute value corresponds with the maximum satisfying solution proposed and
vice versa. AHP is a decision making tool that according to Rao (2008), is powerful and
flexible in setting priorities of different alternatives considering tangible and non-tangible
aspects. An AHP provide the decision maker with a clear rational decision, this is because
complex decisions are reduced to a series of one-to-one comparisons.
20
4. Model Development
In this chapter the model is developed according to the theoretical framework. This includes
an introduction, motivation for the chosen approach, model development and a model
description.
4.1 Model introduction
Projects require careful planning to become successful, as the most common cause for failure
is inaccurate preparations. This is especially important for an investment project because of
the main goal of an investment is to become profitable.
The developed model has its roots in the PDCA improvement model, which is a model for
continuous improvement.
Plan – Determine objectives and processes necessary to deliver results.
Do – The implementation of the processes are executed.
Check – Monitor and measure the processes against the set up objectives
requirements.
Act – Take continual improvement actions to the processes.
The PDCA model is wide and can be interpreted by the user in many ways. The developed
model in this thesis has made modifications to the planning phase, to make it useful for
evaluating investment possibilities. Do-Check-Act will remain the same as in the origin
PDCA model. The planning phase will consist of seven steps; process specification, identify
and develop alternatives, map process, CBS, categorize costs, uncertainty analysis and
evaluation of alternatives. One of these alternatives will be chosen and implemented during
the Do phase of the PDCA-model. Improving a process requires a systematic approach
according to section 3.3 (Process) to enable the user to identify the most profitable area to
improve, which is facilitated by the model and the clearly defined steps. Depending on the
process scope, performing the entire model can take considerable amount of time, as
evaluating the implementation during the Check phase, can require data of many years.
In the article by Rao (2008), the author has created a tool to select the most profitable
investment with the use of AHP and TOPSIS. The AHP creates a comparison between the
different alternatives considering tangibles and intangibles, but by using TOPSIS the author
only compares the alternatives towards the optimal solution. By doing so he narrows’ his
alternatives and might miss out on other solutions that consider other aspects not covered with
the original optimal solution. It also tries to quantify the intangibles and use these values in
the evaluation matrix of the MCDM. The developed model on the other hand compares the
alternatives regardless of their implementation and do not try to quantify the intangibles but
rather realize that they exist and show them as uncertainties. Those uncertainties needs to be
taken in to consideration during the decision making process. MCDM has some problems that
are for example: conflicts between the different criteria, because the criteria can represent
different dimensions of alternatives (f.eg. cost and profit). Another problem is that criteria can
be associated with different units of measure (f.eg. cost and miles) (Parlos, 2000).
21
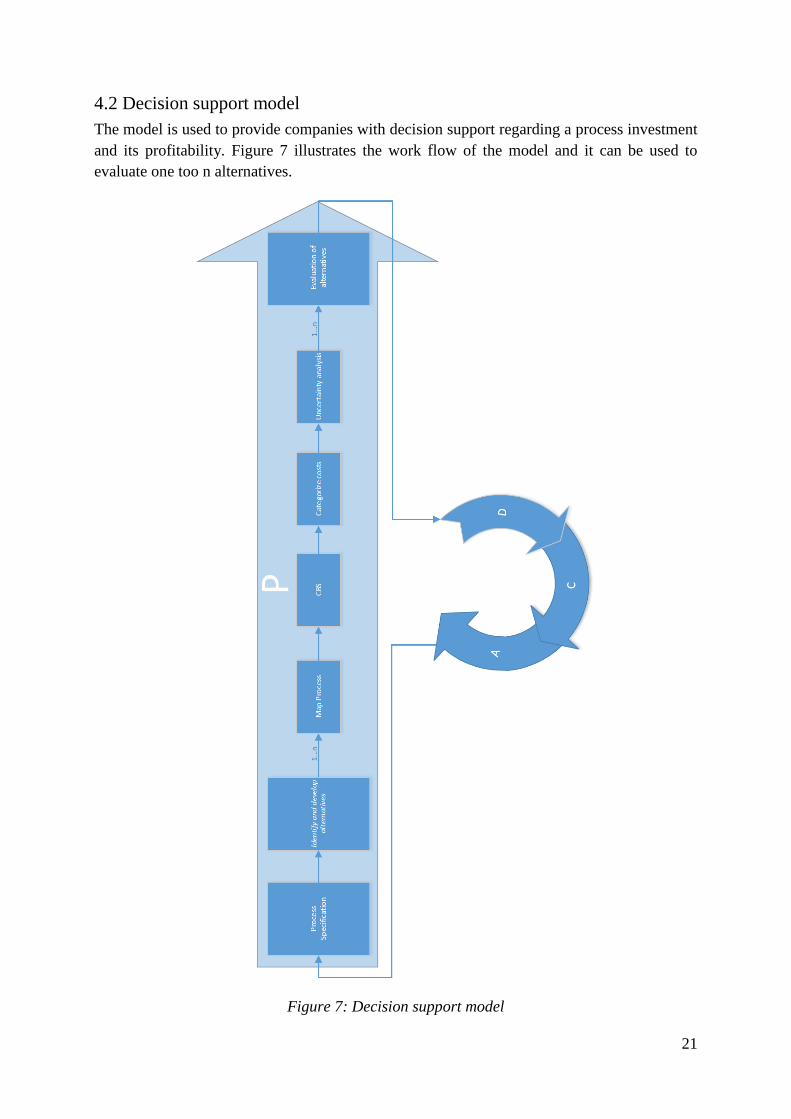
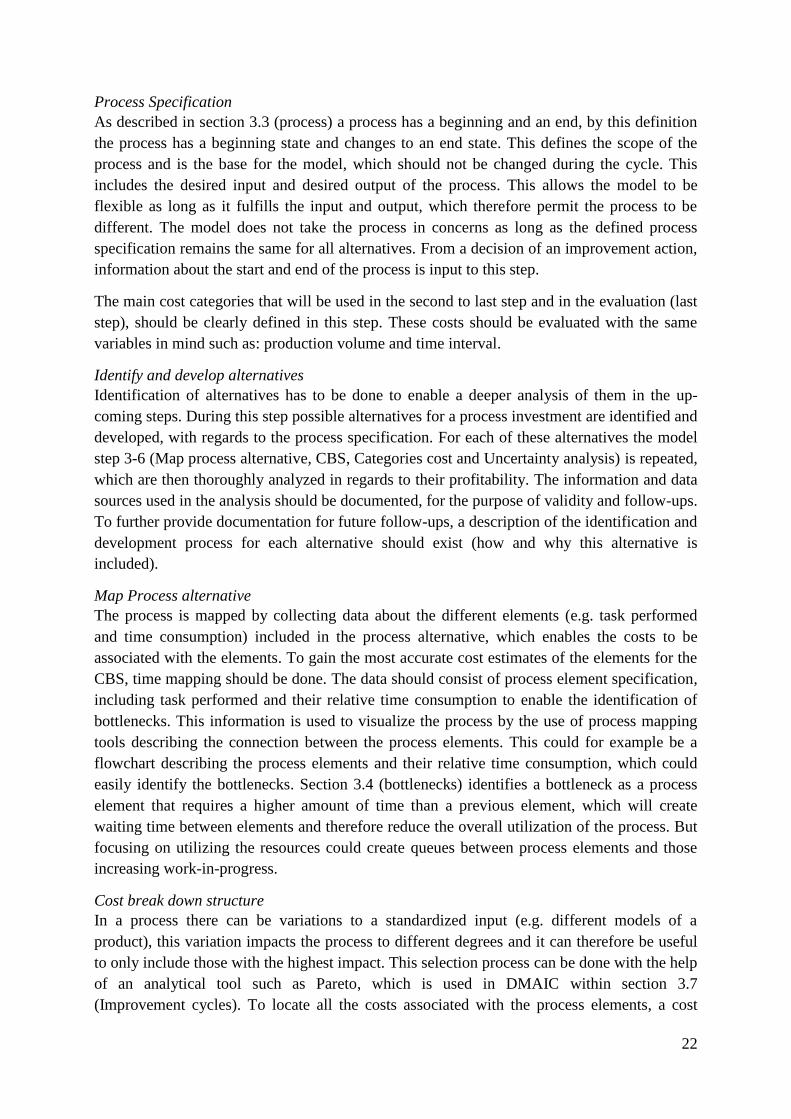
4.2 Decision support model
The model is used to provide companies with decision support regarding a process investment
and its profitability. Figure 7 illustrates the work flow of the model and it can be used to
evaluate one too n alternatives.
Figure 7: Decision support model
22
Process Specification
As described in section 3.3 (process) a process has a beginning and an end, by this definition
the process has a beginning state and changes to an end state. This defines the scope of the
process and is the base for the model, which should not be changed during the cycle. This
includes the desired input and desired output of the process. This allows the model to be
flexible as long as it fulfills the input and output, which therefore permit the process to be
different. The model does not take the process in concerns as long as the defined process
specification remains the same for all alternatives. From a decision of an improvement action,
information about the start and end of the process is input to this step.
The main cost categories that will be used in the second to last step and in the evaluation (last
step), should be clearly defined in this step. These costs should be evaluated with the same
variables in mind such as: production volume and time interval.
Identify and develop alternatives
Identification of alternatives has to be done to enable a deeper analysis of them in the up-
coming steps. During this step possible alternatives for a process investment are identified and
developed, with regards to the process specification. For each of these alternatives the model
step 3-6 (Map process alternative, CBS, Categories cost and Uncertainty analysis) is repeated,
which are then thoroughly analyzed in regards to their profitability. The information and data
sources used in the analysis should be documented, for the purpose of validity and follow-ups.
To further provide documentation for future follow-ups, a description of the identification and
development process for each alternative should exist (how and why this alternative is
included).
Map Process alternative
The process is mapped by collecting data about the different elements (e.g. task performed
and time consumption) included in the process alternative, which enables the costs to be
associated with the elements. To gain the most accurate cost estimates of the elements for the
CBS, time mapping should be done. The data should consist of process element specification,
including task performed and their relative time consumption to enable the identification of
bottlenecks. This information is used to visualize the process by the use of process mapping
tools describing the connection between the process elements. This could for example be a
flowchart describing the process elements and their relative time consumption, which could
easily identify the bottlenecks. Section 3.4 (bottlenecks) identifies a bottleneck as a process
element that requires a higher amount of time than a previous element, which will create
waiting time between elements and therefore reduce the overall utilization of the process. But
focusing on utilizing the resources could create queues between process elements and those
increasing work-in-progress.
Cost break down structure
In a process there can be variations to a standardized input (e.g. different models of a
product), this variation impacts the process to different degrees and it can therefore be useful
to only include those with the highest impact. This selection process can be done with the help
of an analytical tool such as Pareto, which is used in DMAIC within section 3.7
(Improvement cycles). To locate all the costs associated with the process elements, a cost
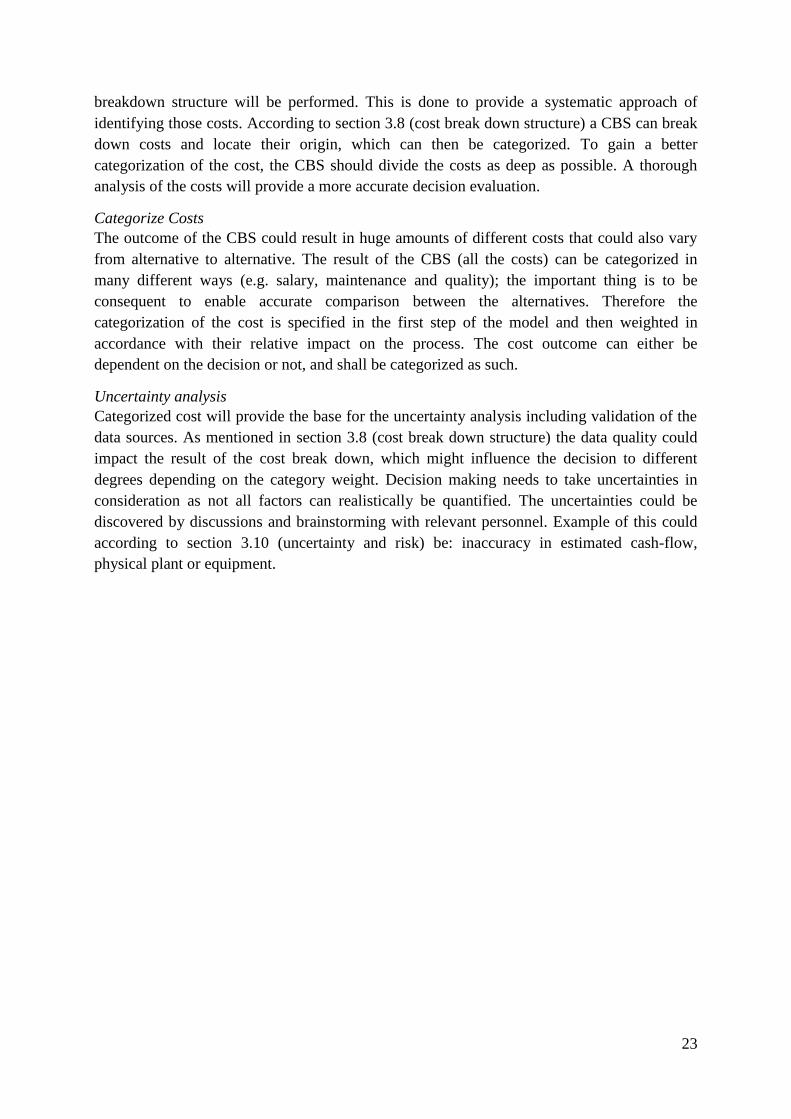
23
breakdown structure will be performed. This is done to provide a systematic approach of
identifying those costs. According to section 3.8 (cost break down structure) a CBS can break
down costs and locate their origin, which can then be categorized. To gain a better
categorization of the cost, the CBS should divide the costs as deep as possible. A thorough
analysis of the costs will provide a more accurate decision evaluation.
Categorize Costs
The outcome of the CBS could result in huge amounts of different costs that could also vary
from alternative to alternative. The result of the CBS (all the costs) can be categorized in
many different ways (e.g. salary, maintenance and quality); the important thing is to be
consequent to enable accurate comparison between the alternatives. Therefore the
categorization of the cost is specified in the first step of the model and then weighted in
accordance with their relative impact on the process. The cost outcome can either be
dependent on the decision or not, and shall be categorized as such.
Uncertainty analysis
Categorized cost will provide the base for the uncertainty analysis including validation of the
data sources. As mentioned in section 3.8 (cost break down structure) the data quality could
impact the result of the cost break down, which might influence the decision to different
degrees depending on the category weight. Decision making needs to take uncertainties in
consideration as not all factors can realistically be quantified. The uncertainties could be
discovered by discussions and brainstorming with relevant personnel. Example of this could
according to section 3.10 (uncertainty and risk) be: inaccuracy in estimated cash-flow,
physical plant or equipment.
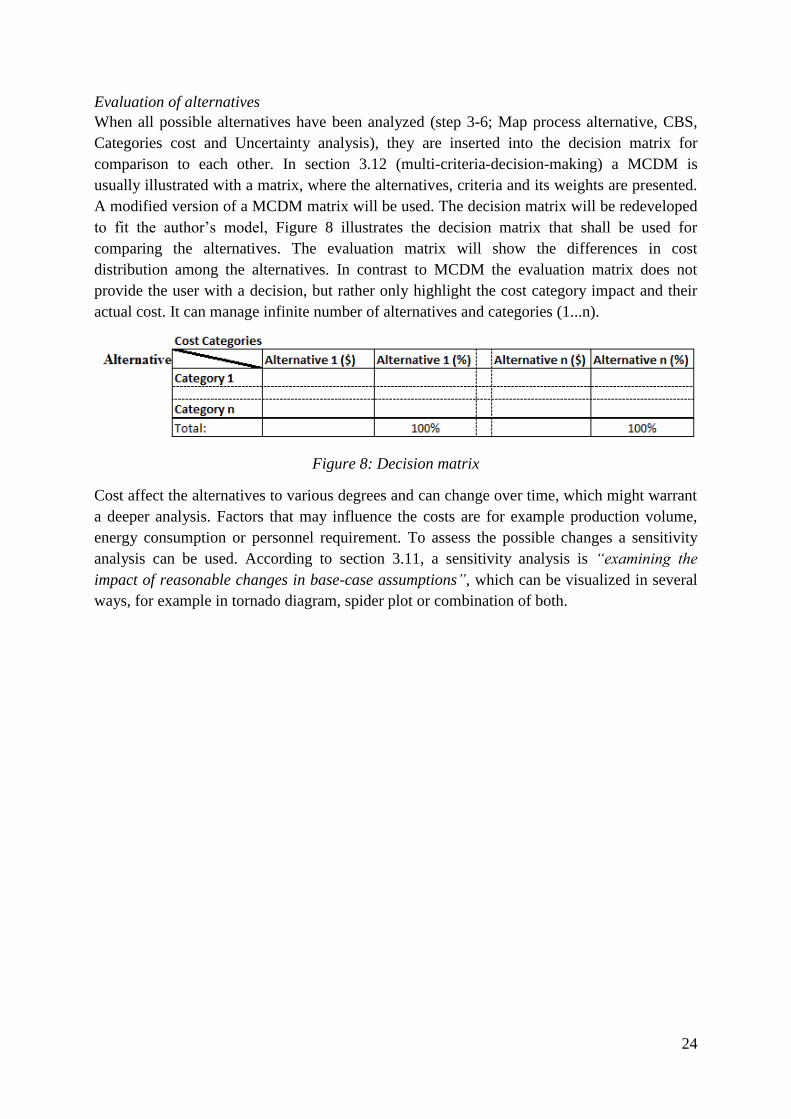
24
Evaluation of alternatives
When all possible alternatives have been analyzed (step 3-6; Map process alternative, CBS,
Categories cost and Uncertainty analysis), they are inserted into the decision matrix for
comparison to each other. In section 3.12 (multi-criteria-decision-making) a MCDM is
usually illustrated with a matrix, where the alternatives, criteria and its weights are presented.
A modified version of a MCDM matrix will be used. The decision matrix will be redeveloped
to fit the author’s model, Figure 8 illustrates the decision matrix that shall be used for
comparing the alternatives. The evaluation matrix will show the differences in cost
distribution among the alternatives. In contrast to MCDM the evaluation matrix does not
provide the user with a decision, but rather only highlight the cost category impact and their
actual cost. It can manage infinite number of alternatives and categories (1...n).
Figure 8: Decision matrix
Cost affect the alternatives to various degrees and can change over time, which might warrant
a deeper analysis. Factors that may influence the costs are for example production volume,
energy consumption or personnel requirement. To assess the possible changes a sensitivity
analysis can be used. According to section 3.11, a sensitivity analysis is “examining the
impact of reasonable changes in base-case assumptions”, which can be visualized in several
ways, for example in tornado diagram, spider plot or combination of both.
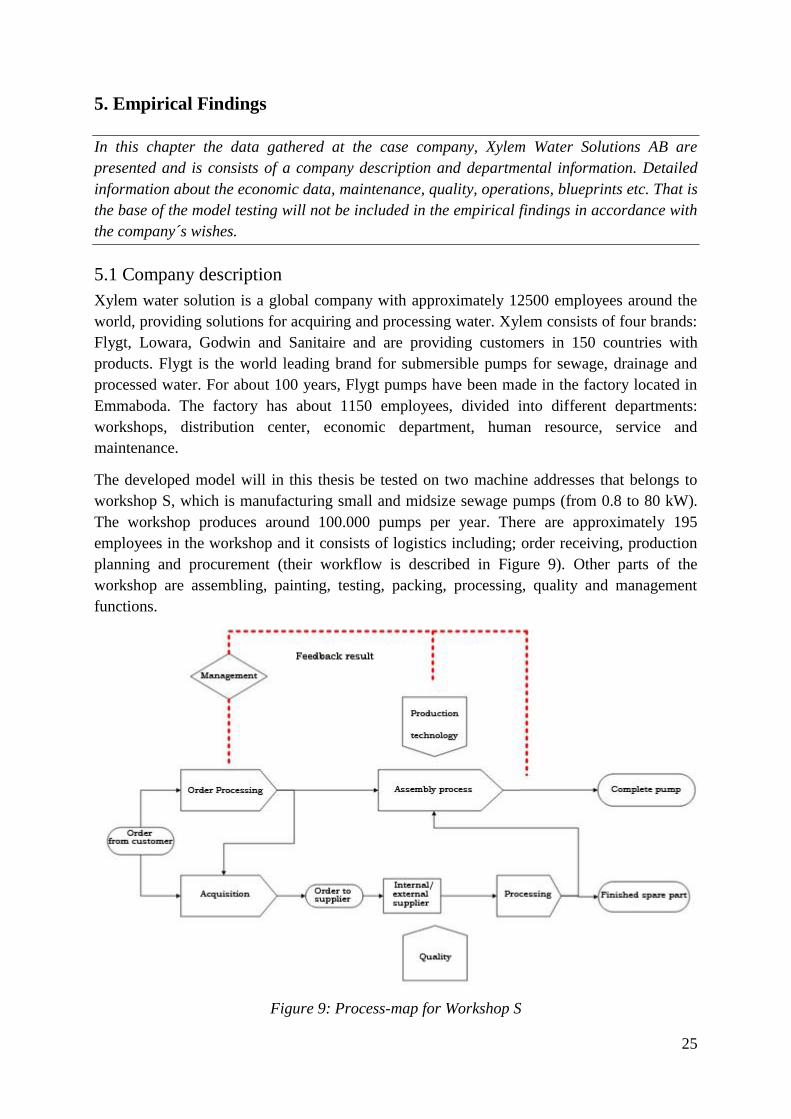
25
5. Empirical Findings
In this chapter the data gathered at the case company, Xylem Water Solutions AB are
presented and is consists of a company description and departmental information. Detailed
information about the economic data, maintenance, quality, operations, blueprints etc. That is
the base of the model testing will not be included in the empirical findings in accordance with
the company´s wishes.
5.1 Company description
Xylem water solution is a global company with approximately 12500 employees around the
world, providing solutions for acquiring and processing water. Xylem consists of four brands:
Flygt, Lowara, Godwin and Sanitaire and are providing customers in 150 countries with
products. Flygt is the world leading brand for submersible pumps for sewage, drainage and
processed water. For about 100 years, Flygt pumps have been made in the factory located in
Emmaboda. The factory has about 1150 employees, divided into different departments:
workshops, distribution center, economic department, human resource, service and
maintenance.
The developed model will in this thesis be tested on two machine addresses that belongs to
workshop S, which is manufacturing small and midsize sewage pumps (from 0.8 to 80 kW).
The workshop produces around 100.000 pumps per year. There are approximately 195
employees in the workshop and it consists of logistics including; order receiving, production
planning and procurement (their workflow is described in Figure 9). Other parts of the
workshop are assembling, painting, testing, packing, processing, quality and management
functions.
Figure 9: Process-map for Workshop S
26
In the process map shown above the whole chain from receiving an order to a complete pump
is illustrated. Before the assembly step, there are articles that need to be processed to the right
dimensions, surface, holes, etc. This is done in the processing department, the machine
addresses belongs to the section within the workshop S that does the processing of raw
material to the assembly lines making the pumps. The chosen processes are processing pump
housing and impellers. The total area where the processing machines stationed to provide the
assembly lines with processed goods are 7680 m².
5.2 Departments within Xylem
Most of the costs on Xylem Water Solutions are divided on the departmental level; the costs
are divided into fixed cost and variable cost. The costs are stated in a spreadsheet containing
article related cost and volume.
Xylem is working with maintenance trough their maintenance system, Maximo. The
maintenance is performed by the maintenance/service department; this department is taking
care of the maintenance on the whole factory. When a fault occurs on the machines or if
preventive maintenance shall be executed, it is registered to Maximo. All maintenance work is
planned and logged in the maintenance system, both by the operators, service personnel and
the managers. The system keeps data about related: costs, total time on maintenance, amount
of personnel etc. On workshop S they are working with corrective, preventive and not urgent
corrective maintenance. How the maintenance affect the process depends on which process it
concerns.
There is a high focus on the quality aspects at Xylem, there are a quality department working
to ensure high quality on products and working environment. Each process has quality
standards that need to be fulfilled before the article can pass to the next process towards a
complete pump. When a quality error is detected the error shall be registered so that quality
follow-ups can be done. Depending on what kind of fault there is it can be linked to different
departments at the company (e.g. pores in the casting belong to the foundry and fault created
by the machine belongs to the workshop). This is a way to see which department shall end up
with the cost and which articles there are problems with. There are errors that can be fixed by
the operators of the machine, depending on what fault there is it can be processed one more
time, this will reduce the scrap cost but still be a surcharge because it has to be processed once
more. In worst case the article needs to be scraped right away which result in a scrap cost.
The raw material to the processing department is either bought from suppliers or from Xylems
own foundry located in the Emmaboda plant. For the chosen processes they have both raw
material from suppliers and the own foundry. Scraped material that origins from the own
foundry returns and is being used as raw material to the foundry and its process. If it has been
purchased it is returned to the supplier. All purchases are made by the purchasing apartment
that is responsible for all purchases to the whole factory, both raw material but also tools
needed to the machines and other consumables needed.
27
Within logistics there are three main costs, administration, transportation and freight costs.
Transportation cost refers to the internal transportation within the factory and the freight cost
refers to the costs that appear when buying goods from suppliers and when shipping their
products to the customers.
There is also depreciation on both machines and tools, which needs to be taken into a count.
Salaries have to be considered for operators and other employees that support the process
such as purchasers, planners, technicians and managers.
5.3 Company definitions and abbreviations
The following key definitions are defined by the authors after discussions with employees of
the case study.
Levante table – Where the material is stored when entering the process.
Intermediate storage – Any storage that is used for holding material between steps in a
process.
Finished storage – Is a storage where the processed article is stored either at the assembly or
as a spare part.
Indicator station – Is where the articles are correctly aligned.
TOF 2 Depreciation tools.
TOF 4 Other production related costs (Facility cost, transports, etc.)
UU Non urgent corrective maintenance
AU Corrective maintenance
FU Preventive maintenance
JO On-call work
LBVD Construction
TK Supervisory control
UA Improvements/reconstruction
28
6. Model Testing
In the Model Testing chapter the developed model is applied on two processes within Xylem
Water solution´s Emmaboda facility.
6.1 Pump house processing (Model test 1)
The authors have chosen to apply the developed model on a production process within Xylem
Water Solutions AB. The processed has been identified together with representatives of the
company and is in need of further investigation. This process is centered around a CNC
machine (Sharmann), processing pump housing at workshop S within their Emmaboda
facility. Sharman did produce about 6000 items in 2012 and processes above 100 different
variants of pump house models. The space area required for Sharman is 379.2 m² and the raw
material used as input for the process is both casted in their own foundry located on the plant
grounds, and also acquired from suppliers depending on the model.
Implementation of a new pump house model to the Sharmann process occurs when a new
pump model is introduced to the market. This is a whole project itself and takes in general a
year to complete. In this year, the changes at workshop S processing are executed to handle
the new pump house model. At the processing department it takes about 12 weeks, this
because the new fixture takes this time to be finished. The cost for a new fixture is 100 000
Swedish crowns and a tool-kit that is needed cost between 7000 and 8000 Swedish crowns. It
takes about a week for the production technician to do a preparation where the cutting tools,
measuring tools, CNC program, operation descriptions and operations register are prepared.
When the fixture and the preparation are done, running-in time, reference samples, follow-ups
and improving, packing instructions and a time study, this takes about two weeks to do; this is
done with the ordinary production.
6.1.1 Process specification
The process begins by accepting input in the form of an unprocessed pump house casting, and
shall output a finished pump house with the following values added according to the
blueprint: creation of holes, threads, turning of openings, mounting of valve hatch, add rust
protection painting, tagging serial- and model-number and packaging of finished batches. The
cost shall be considered during a year of normal processing.
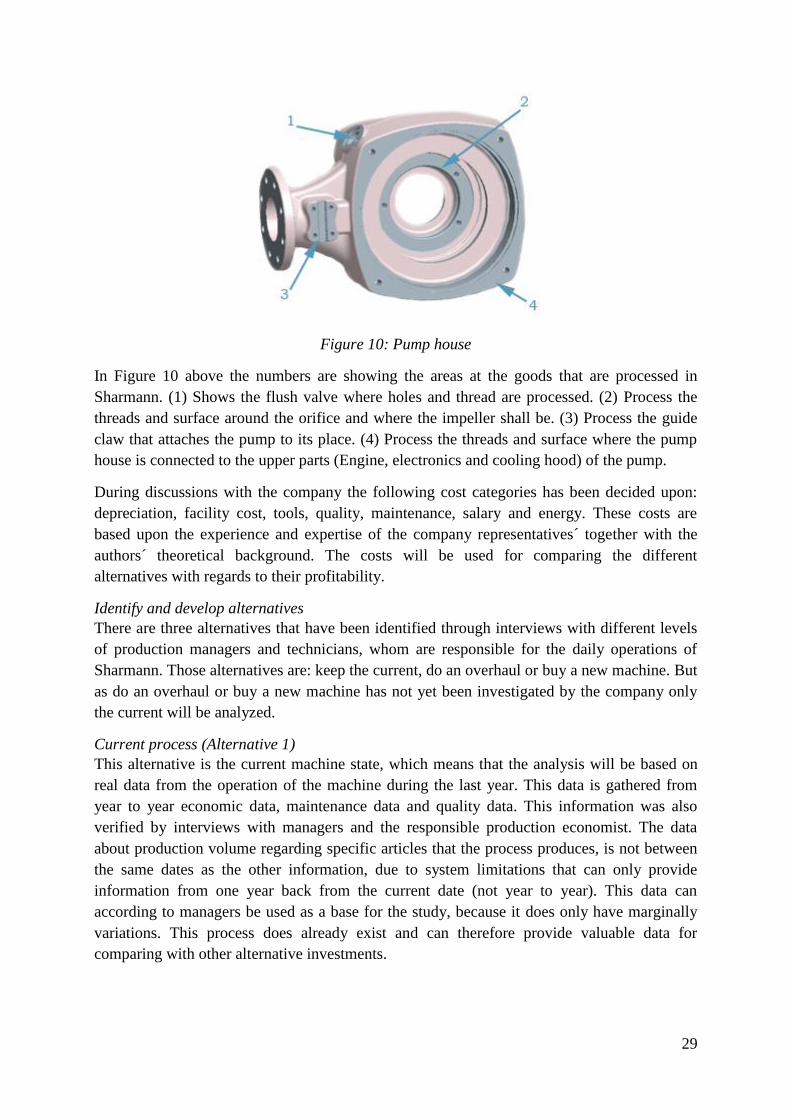
29
Figure 10: Pump house
In Figure 10 above the numbers are showing the areas at the goods that are processed in
Sharmann. (1) Shows the flush valve where holes and thread are processed. (2) Process the
threads and surface around the orifice and where the impeller shall be. (3) Process the guide
claw that attaches the pump to its place. (4) Process the threads and surface where the pump
house is connected to the upper parts (Engine, electronics and cooling hood) of the pump.
During discussions with the company the following cost categories has been decided upon:
depreciation, facility cost, tools, quality, maintenance, salary and energy. These costs are
based upon the experience and expertise of the company representatives´ together with the
authors´ theoretical background. The costs will be used for comparing the different
alternatives with regards to their profitability.
Identify and develop alternatives
There are three alternatives that have been identified through interviews with different levels
of production managers and technicians, whom are responsible for the daily operations of
Sharmann. Those alternatives are: keep the current, do an overhaul or buy a new machine. But
as do an overhaul or buy a new machine has not yet been investigated by the company only
the current will be analyzed.
Current process (Alternative 1)
This alternative is the current machine state, which means that the analysis will be based on
real data from the operation of the machine during the last year. This data is gathered from
year to year economic data, maintenance data and quality data. This information was also
verified by interviews with managers and the responsible production economist. The data
about production volume regarding specific articles that the process produces, is not between
the same dates as the other information, due to system limitations that can only provide
information from one year back from the current date (not year to year). This data can
according to managers be used as a base for the study, because it does only have marginally
variations. This process does already exist and can therefore provide valuable data for
comparing with other alternative investments.
30
Map process
The process has been identified through interviews, both with the operators and the technical
engineer responsible for Sharmann. Also observations from the authors have helped to map
the process. Time measurements have not been done because of time limitations (a batch
could take up to 5-6 hours to complete).The process is divided into 13 steps described below:
1. The process starts with the operator; he/she gets an un-processed pump-housing from the
“intermediate storage” and transports it by a truck.
2. The operator delivers the goods to a “levante table” which is a lift table that the operator
uses to prepare and store finished pump-housing.
3. From the in pallet the piece is moved to the mount to fixture (Topside of the piece) stage by
the use of a traverse. The piece is mounted to a fixture (appendix 3), which is dependent on
the model of the pump-housing. The smaller pumps are mounted two by two, meaning one
backside and one topside which are then to be processed at the same time. The larger pumps
are mounted separately one by one.
4. After the mounting is completed, the operator sends the piece into the queue and selects
what process-program should be run on the piece.
5. Sharmann (CNC) then takes the next piece in the queue and then starts processing it.
Sharman operates by predetermined program that has been entered for that specific piece.
6. After completed run, the operator performs a quality check. If there is something wrong, the
operator determines if it can be corrected. If it can, it is entered into the queue again with a
special program to correct the mistake. Some quality defects cannot be corrected by the CNC
and is therefore corrected in another workshop. If it cannot be corrected the piece is sent to be
scraped.
7. Because only one side can be processed at a time, the piece needs to be mounted to the
other side, mount to fixture (Downside of the piece).
8-10 is doing the same procedure as 4-6.
11. If the piece is quality approved it is moved to intermediate storage.
12. In this step finalization of the article is performed and depending on model, it can vary. It
can include adding rust protecting paint, tagging, mount valve hutch and packaging (this is
performed while in intermediate storage).
13. When the article is moved to Finished storage it could be either as a spare part or to the
assembling.

31
The process is visualized by utilizing the flowchart concept showing the connection between
the elements of the process described above. A flowchart is used to illustrate the current
process (Figure 11) because it provides a simple and graphical representation of the process
flow and its connections. The blue color represents the first side of the article through the
machine and the orange the other side through the machine. If the piece don’t clear the quality
check and cannot be fixed it is sent to be scraped (shown as a red box). But if it clears all the
checks it is moved to finished storage (shown as a green box).
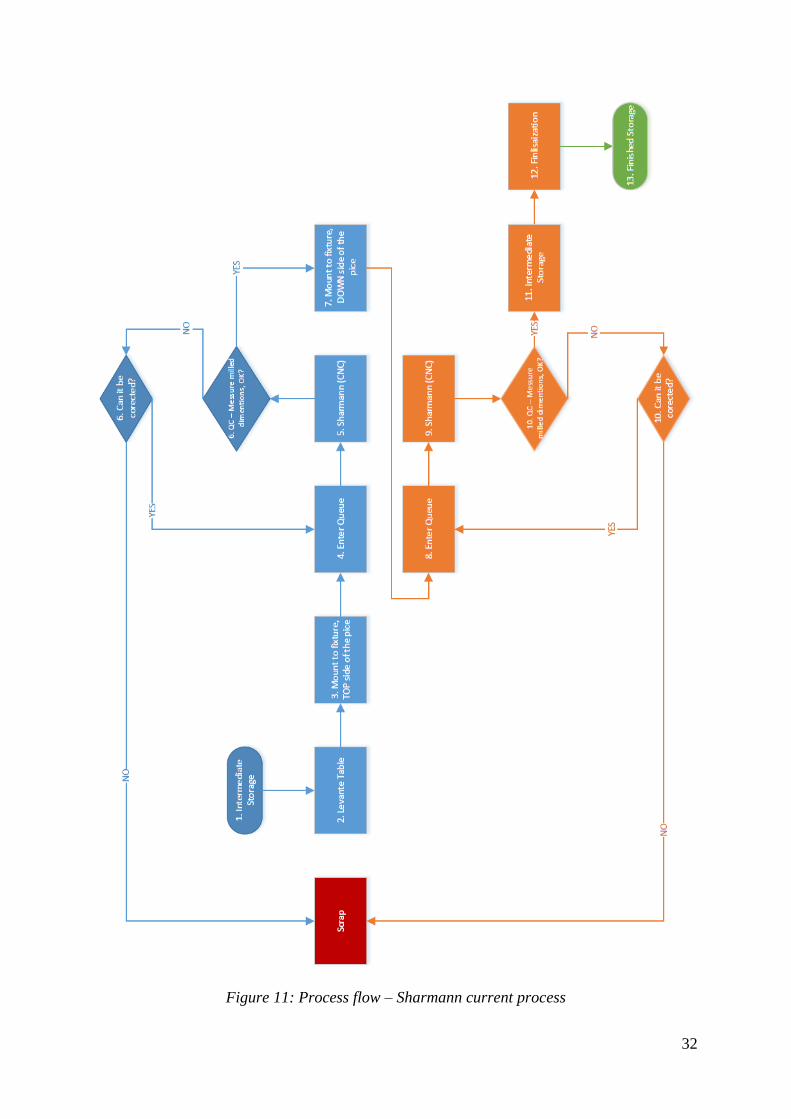
32
Figure 11: Process flow – Sharmann current process
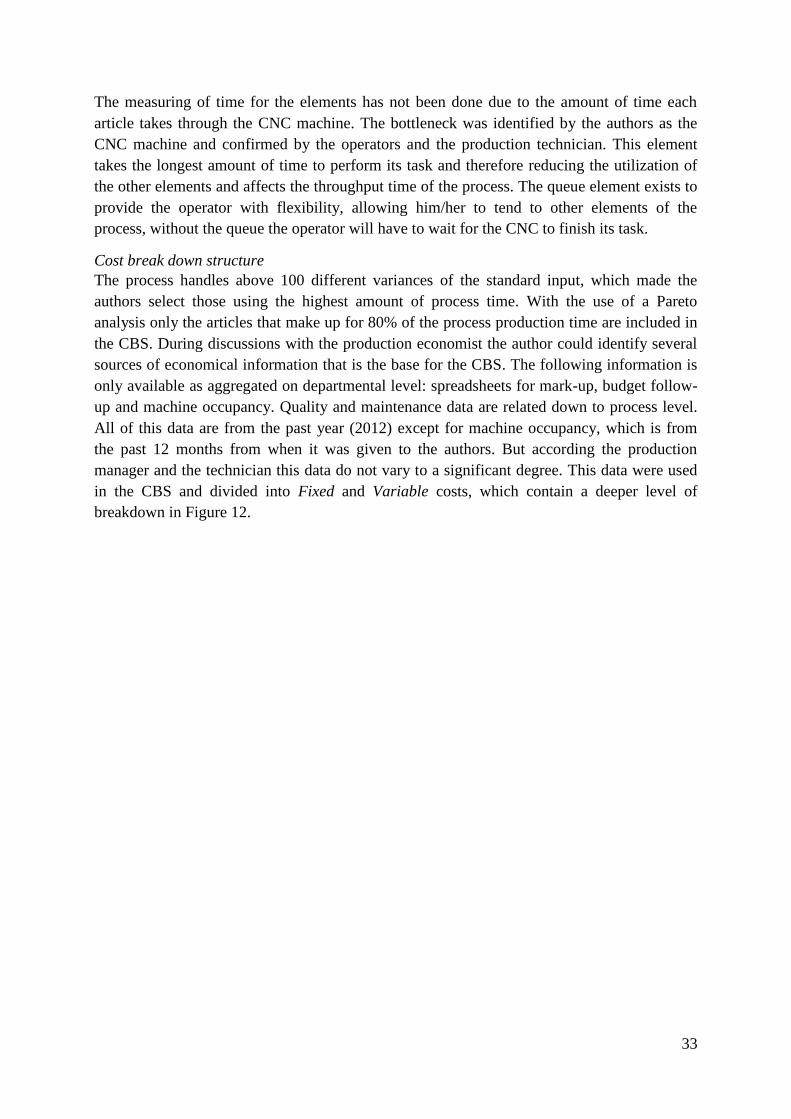
33
The measuring of time for the elements has not been done due to the amount of time each
article takes through the CNC machine. The bottleneck was identified by the authors as the
CNC machine and confirmed by the operators and the production technician. This element
takes the longest amount of time to perform its task and therefore reducing the utilization of
the other elements and affects the throughput time of the process. The queue element exists to
provide the operator with flexibility, allowing him/her to tend to other elements of the
process, without the queue the operator will have to wait for the CNC to finish its task.
Cost break down structure
The process handles above 100 different variances of the standard input, which made the
authors select those using the highest amount of process time. With the use of a Pareto
analysis only the articles that make up for 80% of the process production time are included in
the CBS. During discussions with the production economist the author could identify several
sources of economical information that is the base for the CBS. The following information is
only available as aggregated on departmental level: spreadsheets for mark-up, budget follow-
up and machine occupancy. Quality and maintenance data are related down to process level.
All of this data are from the past year (2012) except for machine occupancy, which is from
the past 12 months from when it was given to the authors. But according the production
manager and the technician this data do not vary to a significant degree. This data were used
in the CBS and divided into Fixed and Variable costs, which contain a deeper level of
breakdown in Figure 12.
34
Figure 12 : CBS analysis of Sharmann (also appendix 1)
Categorize Costs
The CBS identified costs that are dependent on the decision or not, which means that the costs
are not directly associated with the decision (see Figure 13). There are also costs that has been
categorized as non-dependent because they will only be marginally impacted by changes to
the inner workings of the process and its elements. An example of such a cost is factory
management, which will most probably not be changed because of changes to a
manufacturing process. Because the aggregation level of TOF 4 it has not been fairly
distributed and the authors therefore uses the exact facility cost instead (the facility cost is
higher than the aggregated TOF 4).
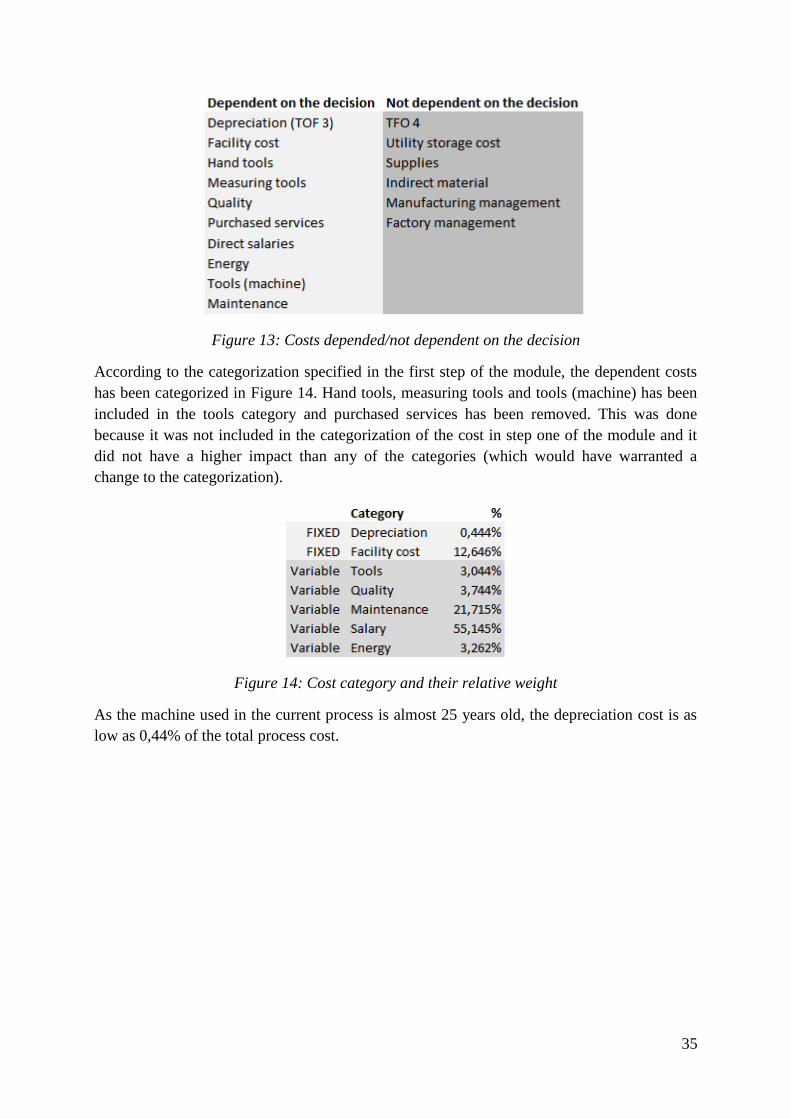
35
Figure 13: Costs depended/not dependent on the decision
According to the categorization specified in the first step of the module, the dependent costs
has been categorized in Figure 14. Hand tools, measuring tools and tools (machine) has been
included in the tools category and purchased services has been removed. This was done
because it was not included in the categorization of the cost in step one of the module and it
did not have a higher impact than any of the categories (which would have warranted a
change to the categorization).
Figure 14: Cost category and their relative weight
As the machine used in the current process is almost 25 years old, the depreciation cost is as
low as 0,44% of the total process cost.
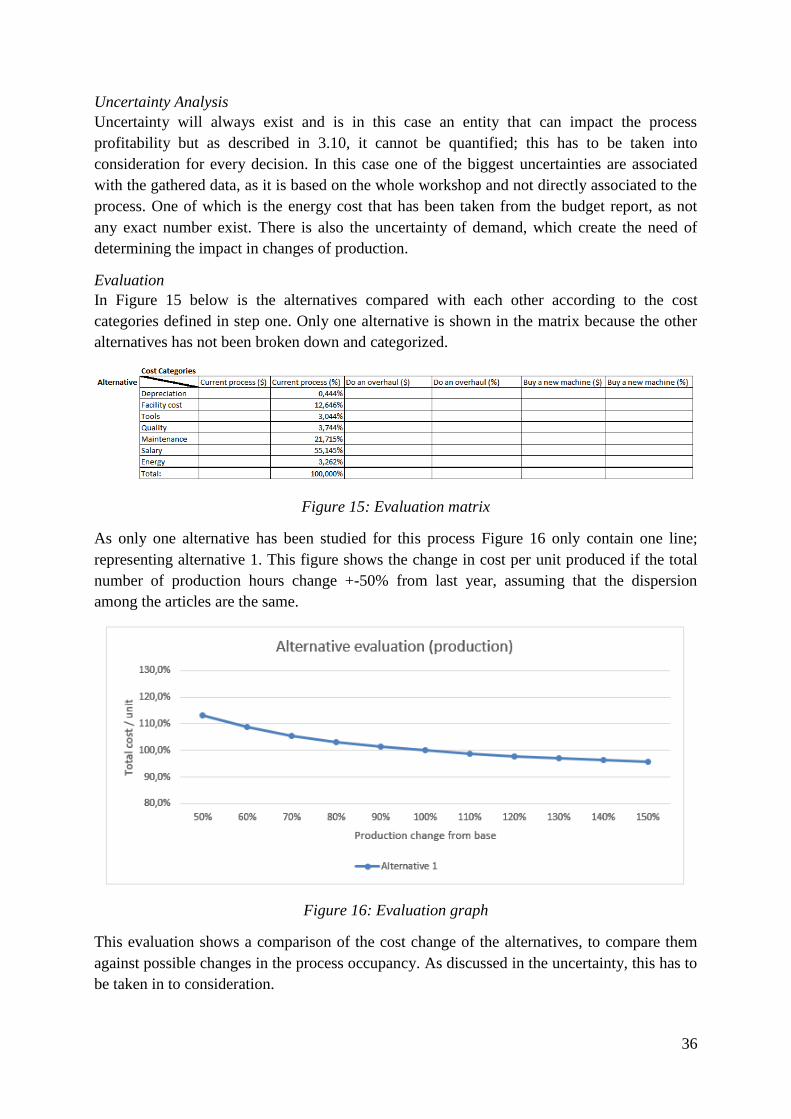
36
Uncertainty Analysis
Uncertainty will always exist and is in this case an entity that can impact the process
profitability but as described in 3.10, it cannot be quantified; this has to be taken into
consideration for every decision. In this case one of the biggest uncertainties are associated
with the gathered data, as it is based on the whole workshop and not directly associated to the
process. One of which is the energy cost that has been taken from the budget report, as not
any exact number exist. There is also the uncertainty of demand, which create the need of
determining the impact in changes of production.
Evaluation
In Figure 15 below is the alternatives compared with each other according to the cost
categories defined in step one. Only one alternative is shown in the matrix because the other
alternatives has not been broken down and categorized.
Figure 15: Evaluation matrix
As only one alternative has been studied for this process Figure 16 only contain one line;
representing alternative 1. This figure shows the change in cost per unit produced if the total
number of production hours change +-50% from last year, assuming that the dispersion
among the articles are the same.
Figure 16: Evaluation graph
This evaluation shows a comparison of the cost change of the alternatives, to compare them
against possible changes in the process occupancy. As discussed in the uncertainty, this has to
be taken in to consideration.
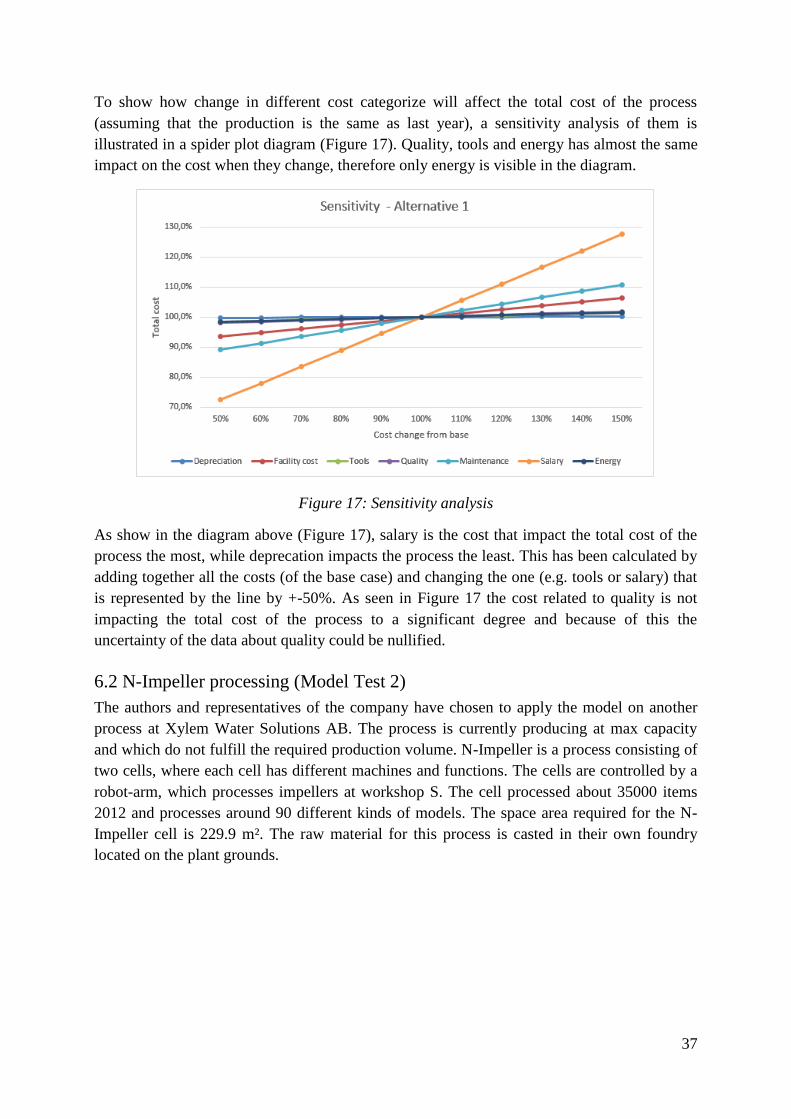
37
To show how change in different cost categorize will affect the total cost of the process
(assuming that the production is the same as last year), a sensitivity analysis of them is
illustrated in a spider plot diagram (Figure 17). Quality, tools and energy has almost the same
impact on the cost when they change, therefore only energy is visible in the diagram.
Figure 17: Sensitivity analysis
As show in the diagram above (Figure 17), salary is the cost that impact the total cost of the
process the most, while deprecation impacts the process the least. This has been calculated by
adding together all the costs (of the base case) and changing the one (e.g. tools or salary) that
is represented by the line by +-50%. As seen in Figure 17 the cost related to quality is not
impacting the total cost of the process to a significant degree and because of this the
uncertainty of the data about quality could be nullified.
6.2 N-Impeller processing (Model Test 2)
The authors and representatives of the company have chosen to apply the model on another
process at Xylem Water Solutions AB. The process is currently producing at max capacity
and which do not fulfill the required production volume. N-Impeller is a process consisting of
two cells, where each cell has different machines and functions. The cells are controlled by a
robot-arm, which processes impellers at workshop S. The cell processed about 35000 items
2012 and processes around 90 different kinds of models. The space area required for the N-
Impeller cell is 229.9 m². The raw material for this process is casted in their own foundry
located on the plant grounds.
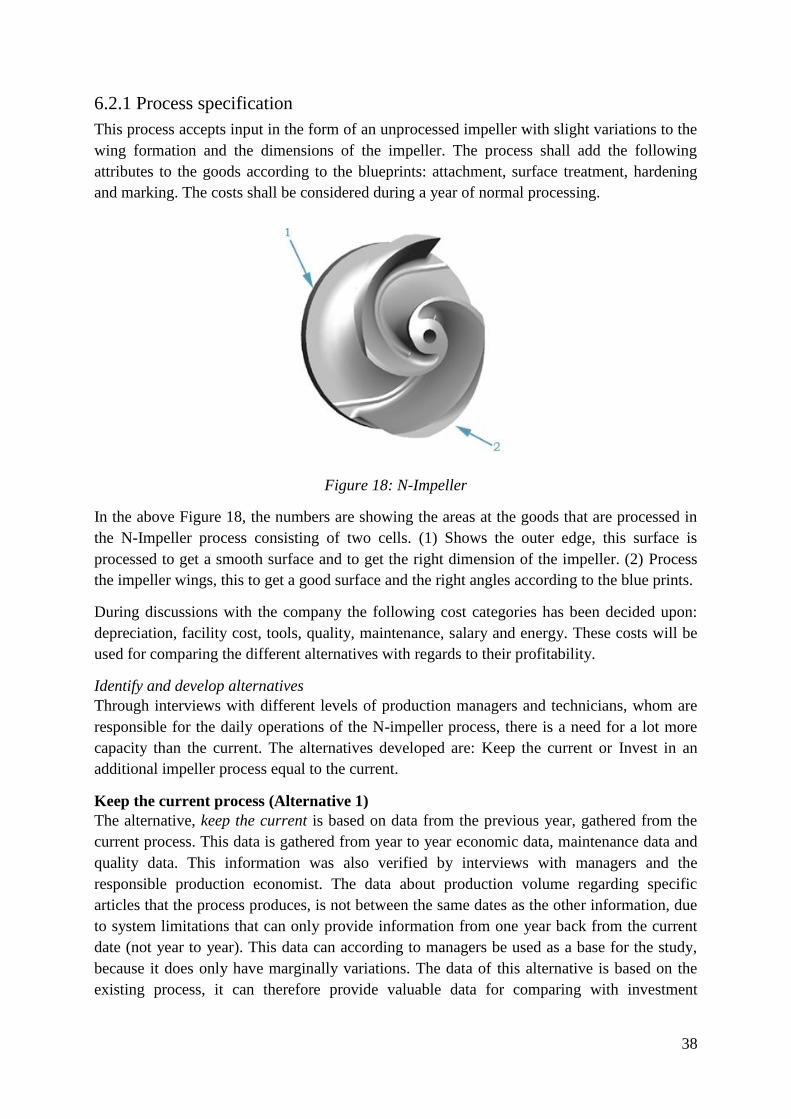
38
6.2.1 Process specification
This process accepts input in the form of an unprocessed impeller with slight variations to the
wing formation and the dimensions of the impeller. The process shall add the following
attributes to the goods according to the blueprints: attachment, surface treatment, hardening
and marking. The costs shall be considered during a year of normal processing.
Figure 18: N-Impeller
In the above Figure 18, the numbers are showing the areas at the goods that are processed in
the N-Impeller process consisting of two cells. (1) Shows the outer edge, this surface is
processed to get a smooth surface and to get the right dimension of the impeller. (2) Process
the impeller wings, this to get a good surface and the right angles according to the blue prints.
During discussions with the company the following cost categories has been decided upon:
depreciation, facility cost, tools, quality, maintenance, salary and energy. These costs will be
used for comparing the different alternatives with regards to their profitability.
Identify and develop alternatives
Through interviews with different levels of production managers and technicians, whom are
responsible for the daily operations of the N-impeller process, there is a need for a lot more
capacity than the current. The alternatives developed are: Keep the current or Invest in an
additional impeller process equal to the current.
Keep the current process (Alternative 1)
The alternative, keep the current is based on data from the previous year, gathered from the
current process. This data is gathered from year to year economic data, maintenance data and
quality data. This information was also verified by interviews with managers and the
responsible production economist. The data about production volume regarding specific
articles that the process produces, is not between the same dates as the other information, due
to system limitations that can only provide information from one year back from the current
date (not year to year). This data can according to managers be used as a base for the study,
because it does only have marginally variations. The data of this alternative is based on the
existing process, it can therefore provide valuable data for comparing with investment

39
possibilities. Keeping the process as it is, is not an option presented by the company but rather
a comparison alternative to show how the model works.
Map process
The process is visualized by utilizing the flowchart concept showing the connection between
the elements of the process. A flowchart is used to illustrate the current process (Figure 19)
because it provides a simple and graphical representation of the process flow and its
connections. The blue boxes represent the elements that the article moves through within the
process. The empty yellow and brown box represents cell 1 and 2 respectively. If the piece
don’t clear the quality check and cannot be fixed it is sent to be scraped (shown as a red box).
But if it clears all the checks it is moved to finished storage (shown as a green box).
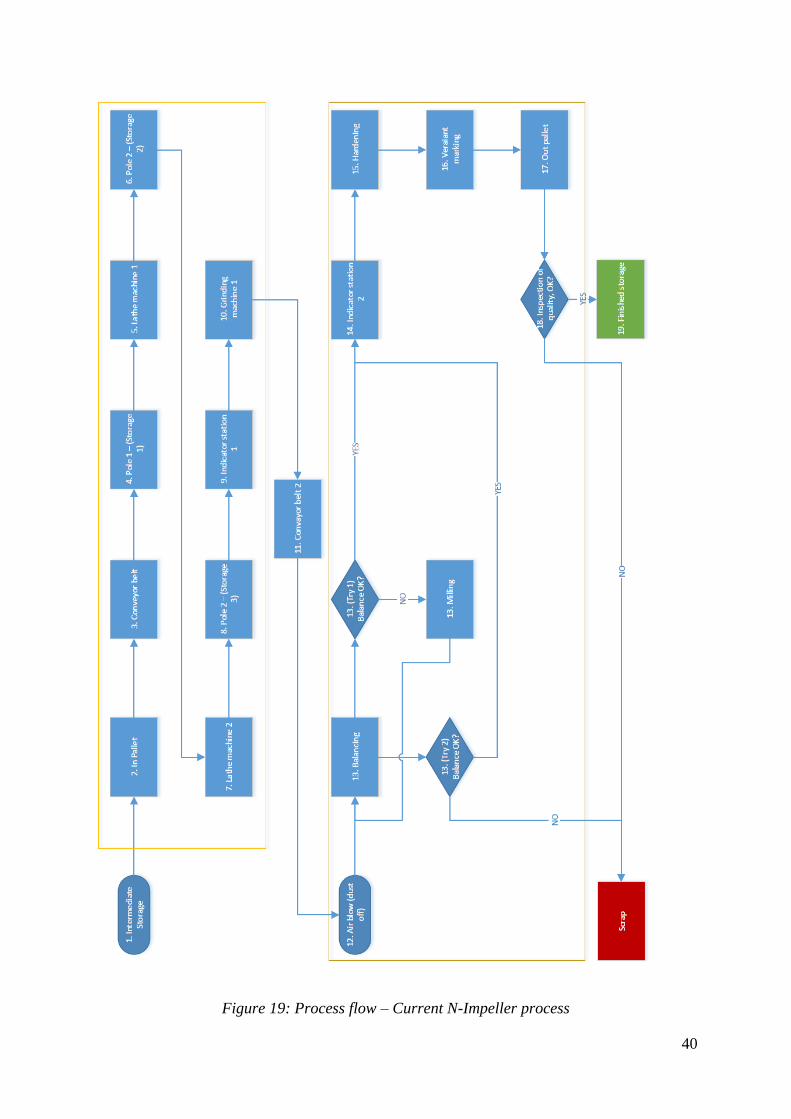
40
Figure 19: Process flow – Current N-Impeller process
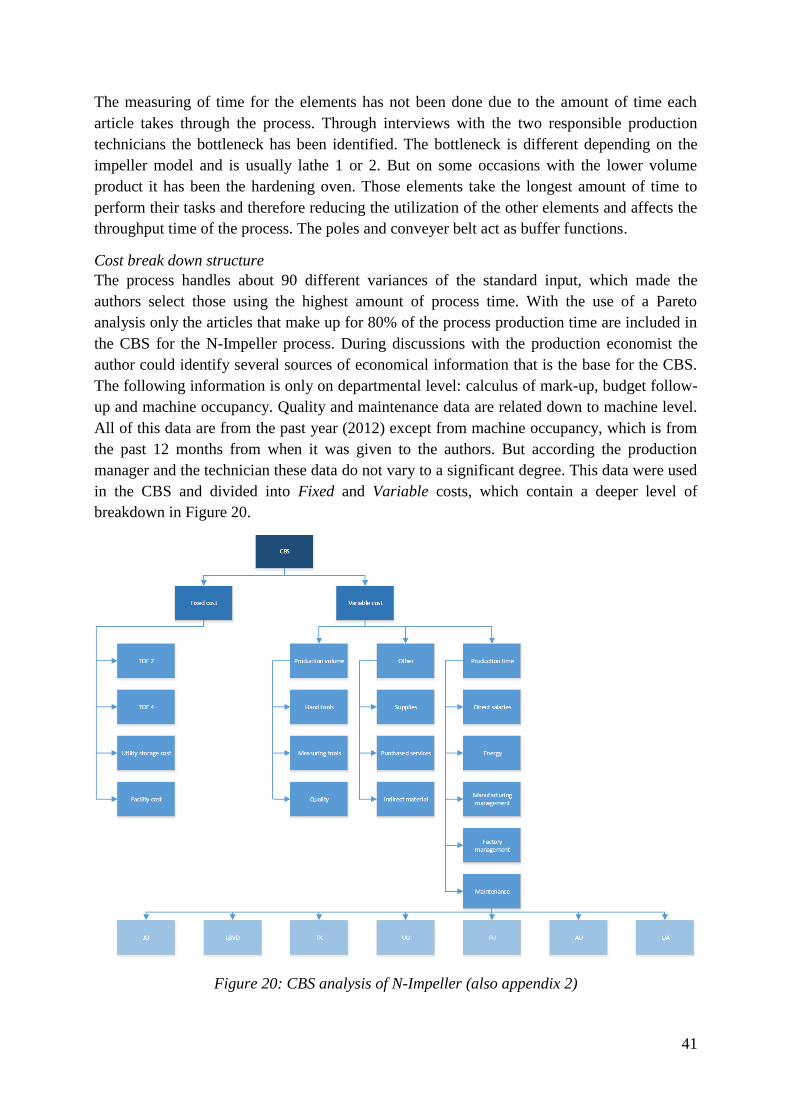
41
The measuring of time for the elements has not been done due to the amount of time each
article takes through the process. Through interviews with the two responsible production
technicians the bottleneck has been identified. The bottleneck is different depending on the
impeller model and is usually lathe 1 or 2. But on some occasions with the lower volume
product it has been the hardening oven. Those elements take the longest amount of time to
perform their tasks and therefore reducing the utilization of the other elements and affects the
throughput time of the process. The poles and conveyer belt act as buffer functions.
Cost break down structure
The process handles about 90 different variances of the standard input, which made the
authors select those using the highest amount of process time. With the use of a Pareto
analysis only the articles that make up for 80% of the process production time are included in
the CBS for the N-Impeller process. During discussions with the production economist the
author could identify several sources of economical information that is the base for the CBS.
The following information is only on departmental level: calculus of mark-up, budget follow-
up and machine occupancy. Quality and maintenance data are related down to machine level.
All of this data are from the past year (2012) except from machine occupancy, which is from
the past 12 months from when it was given to the authors. But according the production
manager and the technician these data do not vary to a significant degree. This data were used
in the CBS and divided into Fixed and Variable costs, which contain a deeper level of
breakdown in Figure 20.
Figure 20: CBS analysis of N-Impeller (also appendix 2)
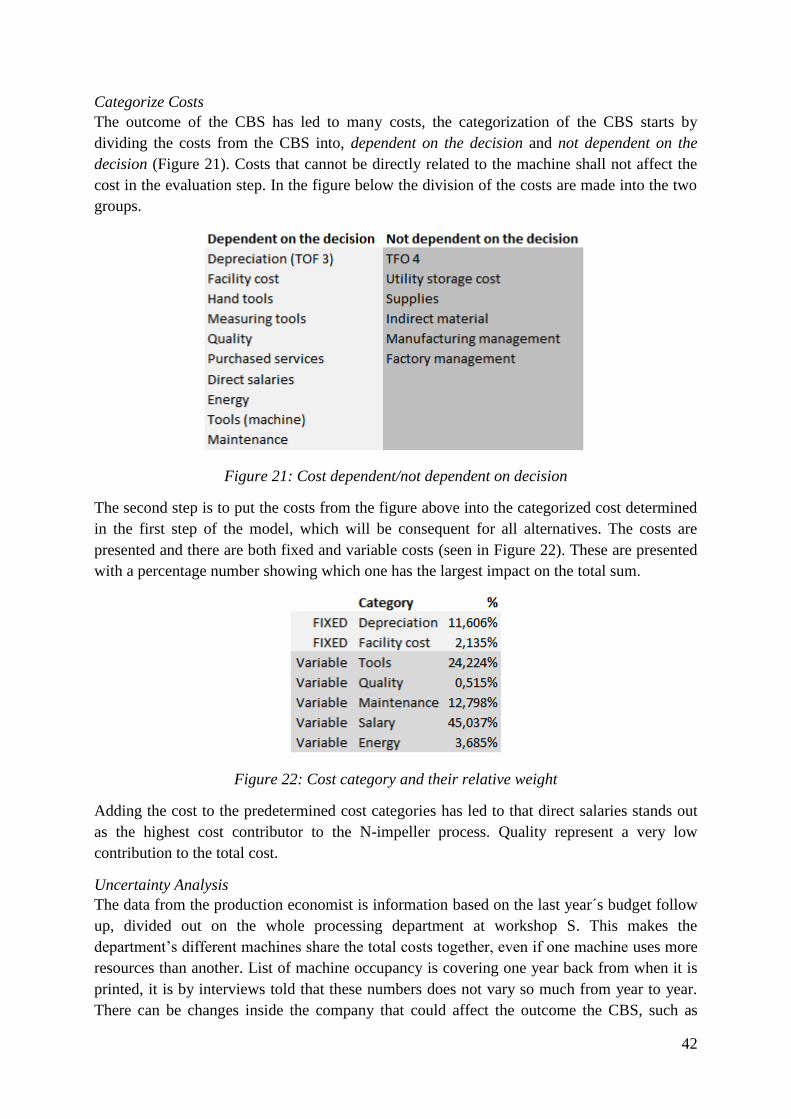
42
Categorize Costs
The outcome of the CBS has led to many costs, the categorization of the CBS starts by
dividing the costs from the CBS into, dependent on the decision and not dependent on the
decision (Figure 21). Costs that cannot be directly related to the machine shall not affect the
cost in the evaluation step. In the figure below the division of the costs are made into the two
groups.
Figure 21: Cost dependent/not dependent on decision
The second step is to put the costs from the figure above into the categorized cost determined
in the first step of the model, which will be consequent for all alternatives. The costs are
presented and there are both fixed and variable costs (seen in Figure 22). These are presented
with a percentage number showing which one has the largest impact on the total sum.
Figure 22: Cost category and their relative weight
Adding the cost to the predetermined cost categories has led to that direct salaries stands out
as the highest cost contributor to the N-impeller process. Quality represent a very low
contribution to the total cost.
Uncertainty Analysis
The data from the production economist is information based on the last year´s budget follow
up, divided out on the whole processing department at workshop S. This makes the
department’s different machines share the total costs together, even if one machine uses more
resources than another. List of machine occupancy is covering one year back from when it is
printed, it is by interviews told that these numbers does not vary so much from year to year.
There can be changes inside the company that could affect the outcome the CBS, such as
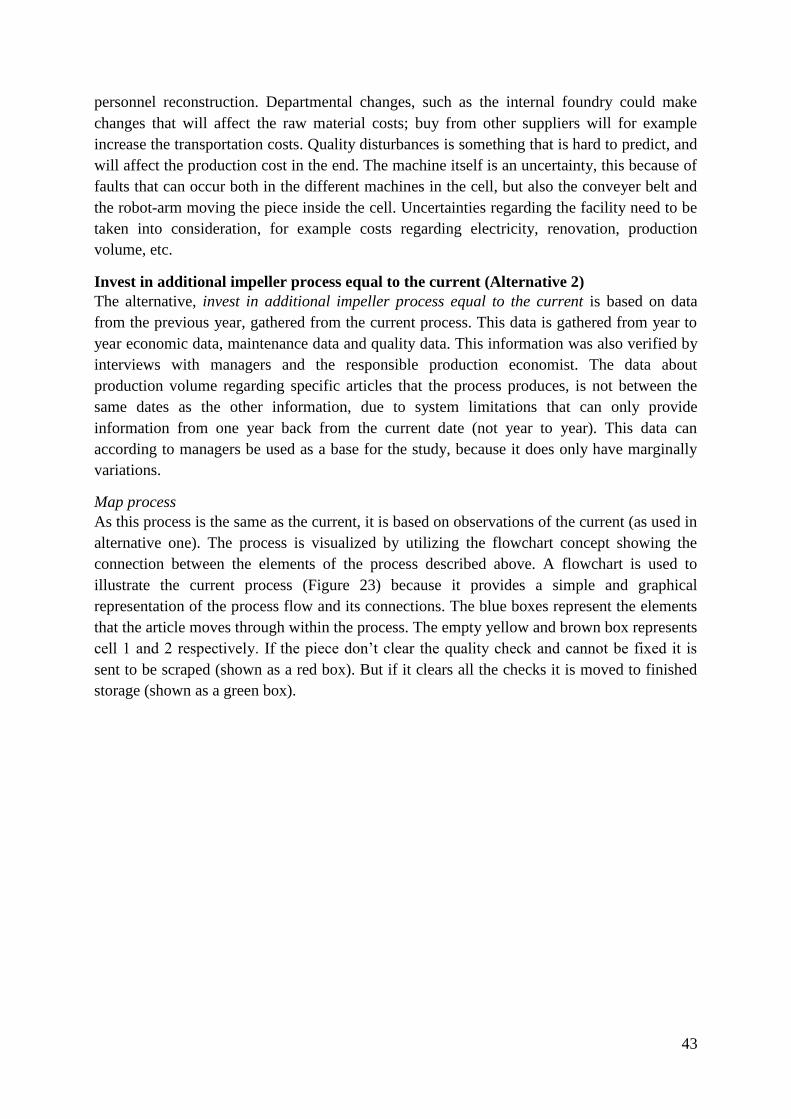
43
personnel reconstruction. Departmental changes, such as the internal foundry could make
changes that will affect the raw material costs; buy from other suppliers will for example
increase the transportation costs. Quality disturbances is something that is hard to predict, and
will affect the production cost in the end. The machine itself is an uncertainty, this because of
faults that can occur both in the different machines in the cell, but also the conveyer belt and
the robot-arm moving the piece inside the cell. Uncertainties regarding the facility need to be
taken into consideration, for example costs regarding electricity, renovation, production
volume, etc.
Invest in additional impeller process equal to the current (Alternative 2)
The alternative, invest in additional impeller process equal to the current is based on data
from the previous year, gathered from the current process. This data is gathered from year to
year economic data, maintenance data and quality data. This information was also verified by
interviews with managers and the responsible production economist. The data about
production volume regarding specific articles that the process produces, is not between the
same dates as the other information, due to system limitations that can only provide
information from one year back from the current date (not year to year). This data can
according to managers be used as a base for the study, because it does only have marginally
variations.
Map process
As this process is the same as the current, it is based on observations of the current (as used in
alternative one). The process is visualized by utilizing the flowchart concept showing the
connection between the elements of the process described above. A flowchart is used to
illustrate the current process (Figure 23) because it provides a simple and graphical
representation of the process flow and its connections. The blue boxes represent the elements
that the article moves through within the process. The empty yellow and brown box represents
cell 1 and 2 respectively. If the piece don’t clear the quality check and cannot be fixed it is
sent to be scraped (shown as a red box). But if it clears all the checks it is moved to finished
storage (shown as a green box).

44
Figure 23: Process flow – Current N-Impeller process
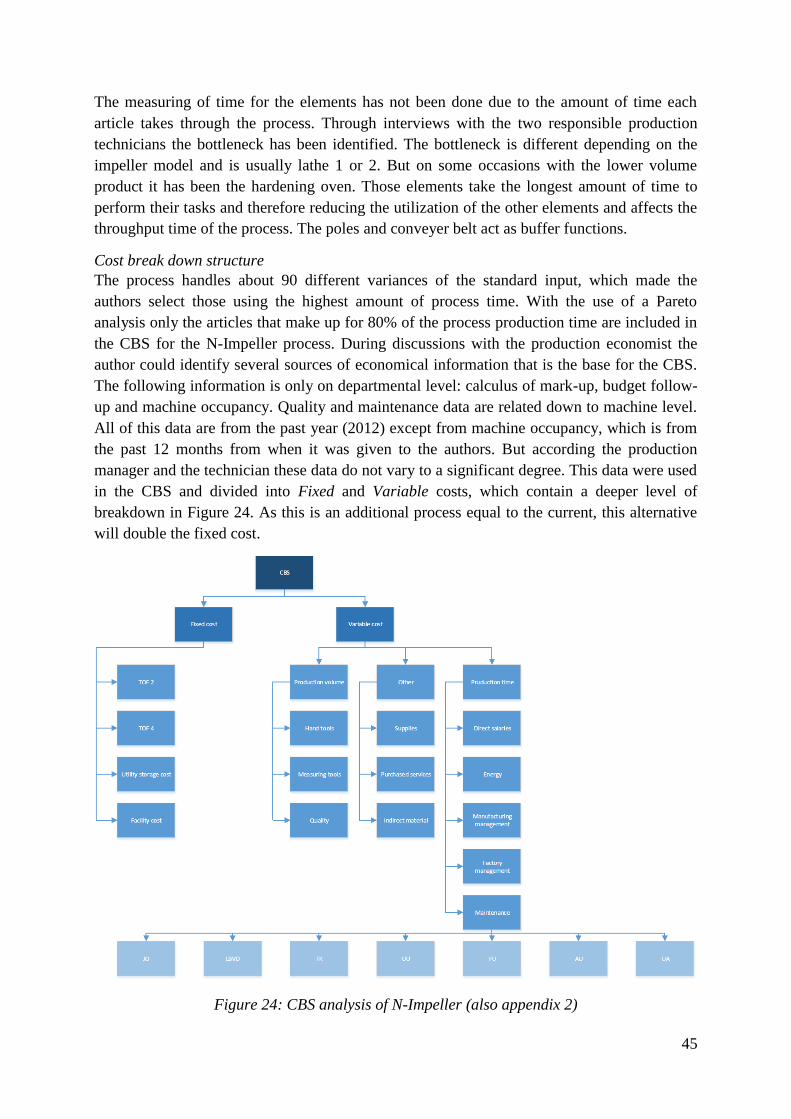
45
The measuring of time for the elements has not been done due to the amount of time each
article takes through the process. Through interviews with the two responsible production
technicians the bottleneck has been identified. The bottleneck is different depending on the
impeller model and is usually lathe 1 or 2. But on some occasions with the lower volume
product it has been the hardening oven. Those elements take the longest amount of time to
perform their tasks and therefore reducing the utilization of the other elements and affects the
throughput time of the process. The poles and conveyer belt act as buffer functions.
Cost break down structure
The process handles about 90 different variances of the standard input, which made the
authors select those using the highest amount of process time. With the use of a Pareto
analysis only the articles that make up for 80% of the process production time are included in
the CBS for the N-Impeller process. During discussions with the production economist the
author could identify several sources of economical information that is the base for the CBS.
The following information is only on departmental level: calculus of mark-up, budget follow-
up and machine occupancy. Quality and maintenance data are related down to machine level.
All of this data are from the past year (2012) except from machine occupancy, which is from
the past 12 months from when it was given to the authors. But according the production
manager and the technician these data do not vary to a significant degree. This data were used
in the CBS and divided into Fixed and Variable costs, which contain a deeper level of
breakdown in Figure 24. As this is an additional process equal to the current, this alternative
will double the fixed cost.
Figure 24: CBS analysis of N-Impeller (also appendix 2)
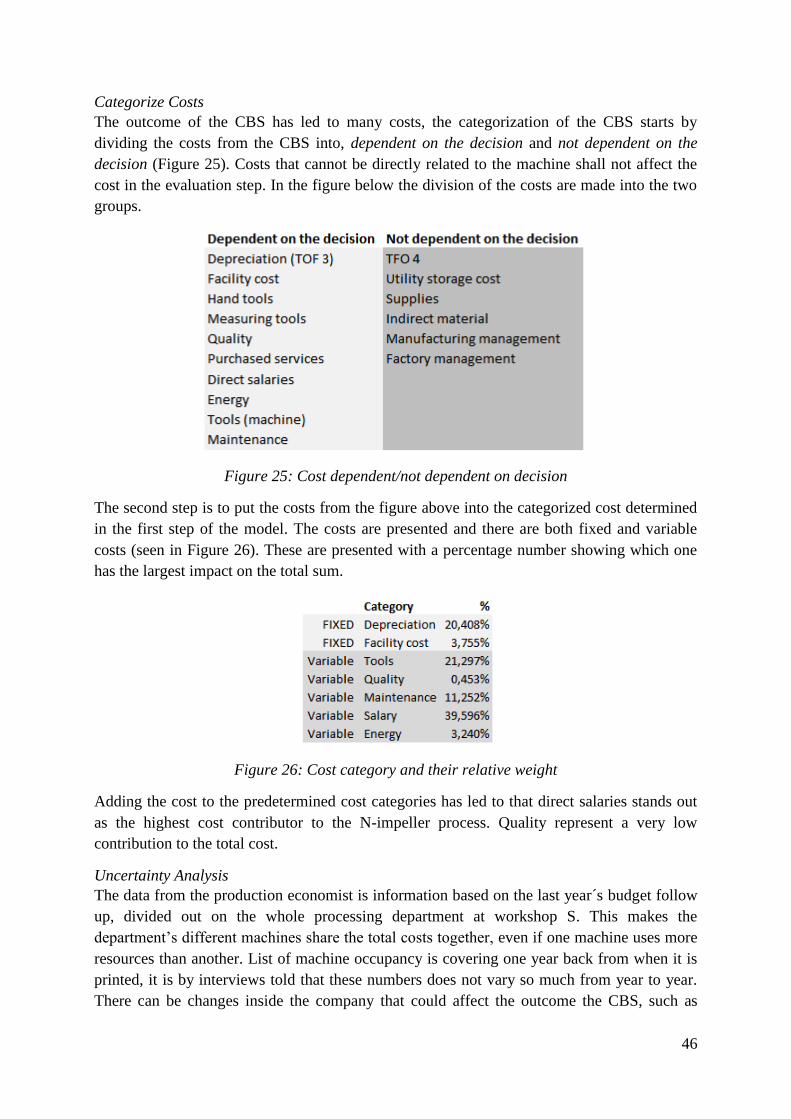
46
Categorize Costs
The outcome of the CBS has led to many costs, the categorization of the CBS starts by
dividing the costs from the CBS into, dependent on the decision and not dependent on the
decision (Figure 25). Costs that cannot be directly related to the machine shall not affect the
cost in the evaluation step. In the figure below the division of the costs are made into the two
groups.
Figure 25: Cost dependent/not dependent on decision
The second step is to put the costs from the figure above into the categorized cost determined
in the first step of the model. The costs are presented and there are both fixed and variable
costs (seen in Figure 26). These are presented with a percentage number showing which one
has the largest impact on the total sum.
Figure 26: Cost category and their relative weight
Adding the cost to the predetermined cost categories has led to that direct salaries stands out
as the highest cost contributor to the N-impeller process. Quality represent a very low
contribution to the total cost.
Uncertainty Analysis
The data from the production economist is information based on the last year´s budget follow
up, divided out on the whole processing department at workshop S. This makes the
department’s different machines share the total costs together, even if one machine uses more
resources than another. List of machine occupancy is covering one year back from when it is
printed, it is by interviews told that these numbers does not vary so much from year to year.
There can be changes inside the company that could affect the outcome the CBS, such as
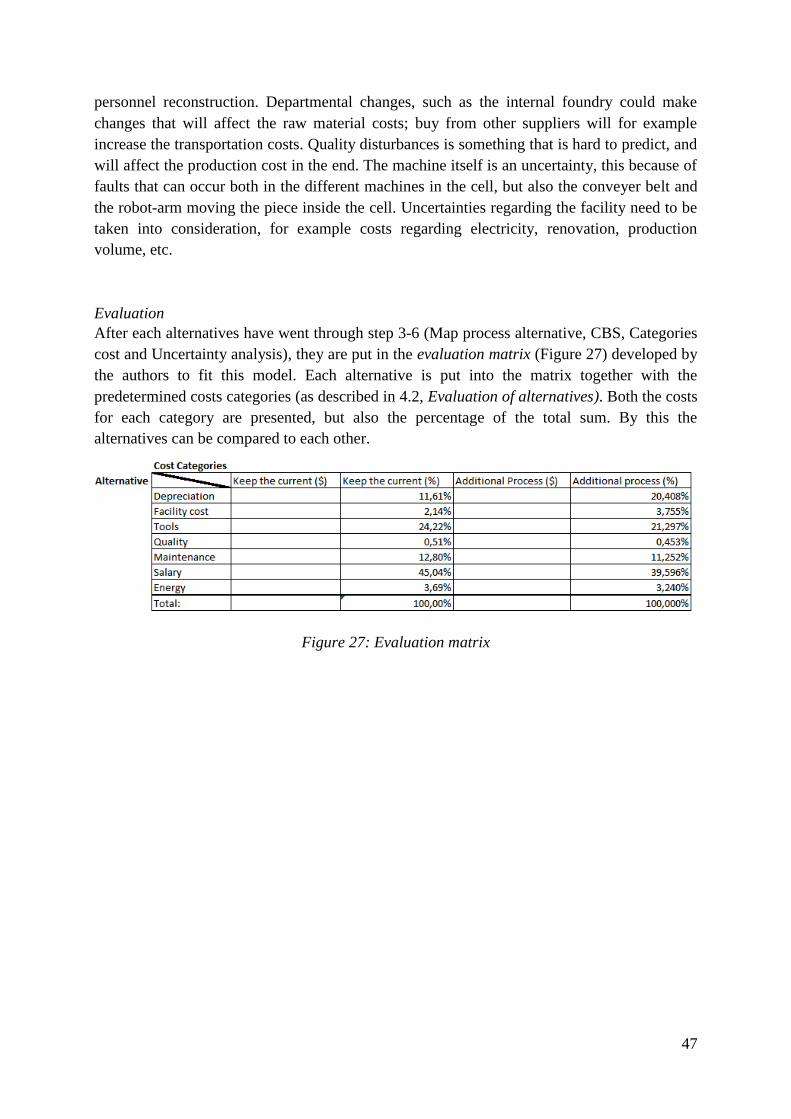
47
personnel reconstruction. Departmental changes, such as the internal foundry could make
changes that will affect the raw material costs; buy from other suppliers will for example
increase the transportation costs. Quality disturbances is something that is hard to predict, and
will affect the production cost in the end. The machine itself is an uncertainty, this because of
faults that can occur both in the different machines in the cell, but also the conveyer belt and
the robot-arm moving the piece inside the cell. Uncertainties regarding the facility need to be
taken into consideration, for example costs regarding electricity, renovation, production
volume, etc.
Evaluation
After each alternatives have went through step 3-6 (Map process alternative, CBS, Categories
cost and Uncertainty analysis), they are put in the evaluation matrix (Figure 27) developed by
the authors to fit this model. Each alternative is put into the matrix together with the
predetermined costs categories (as described in 4.2, Evaluation of alternatives). Both the costs
for each category are presented, but also the percentage of the total sum. By this the
alternatives can be compared to each other.
Figure 27: Evaluation matrix
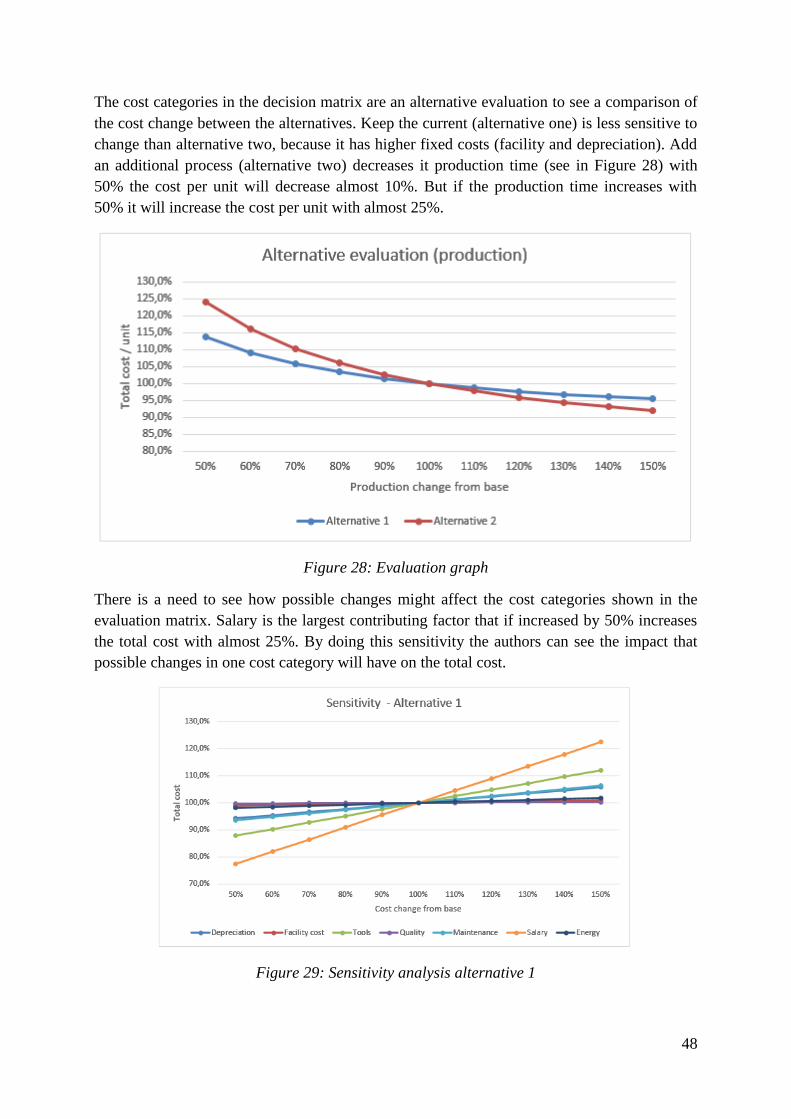
48
The cost categories in the decision matrix are an alternative evaluation to see a comparison of
the cost change between the alternatives. Keep the current (alternative one) is less sensitive to
change than alternative two, because it has higher fixed costs (facility and depreciation). Add
an additional process (alternative two) decreases it production time (see in Figure 28) with
50% the cost per unit will decrease almost 10%. But if the production time increases with
50% it will increase the cost per unit with almost 25%.
Figure 28: Evaluation graph
There is a need to see how possible changes might affect the cost categories shown in the
evaluation matrix. Salary is the largest contributing factor that if increased by 50% increases
the total cost with almost 25%. By doing this sensitivity the authors can see the impact that
possible changes in one cost category will have on the total cost.
Figure 29: Sensitivity analysis alternative 1
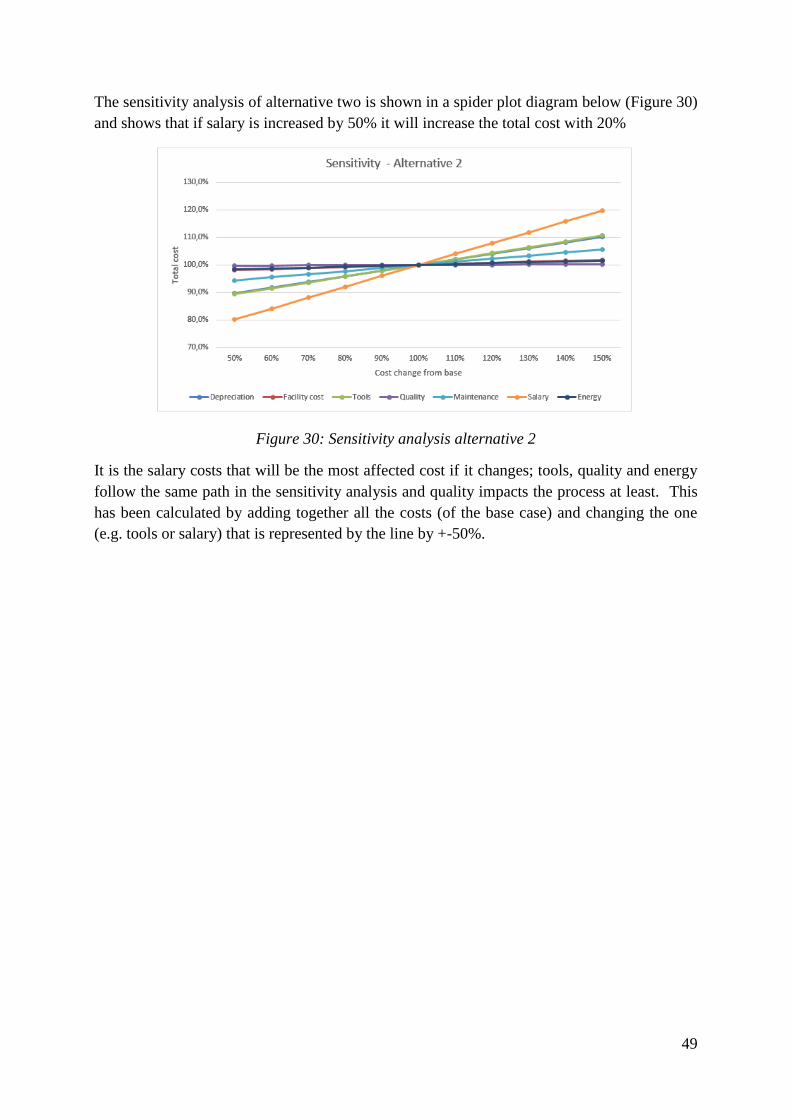
49
The sensitivity analysis of alternative two is shown in a spider plot diagram below (Figure 30)
and shows that if salary is increased by 50% it will increase the total cost with 20%
Figure 30: Sensitivity analysis alternative 2
It is the salary costs that will be the most affected cost if it changes; tools, quality and energy
follow the same path in the sensitivity analysis and quality impacts the process at least. This
has been calculated by adding together all the costs (of the base case) and changing the one
(e.g. tools or salary) that is represented by the line by +-50%.
50
7. Result
In this chapter the result of the model testing and on the developed model is presented.
Performing model testing on two different processes increases the validity of the developed
model because of more data about the model can be gathered. But as it is performed at the
same company some limitations to the findings should be considered.
7.1 General model result
The decision support model takes the current situation as a possible solution to the investment
proposal, something that the literature review showed that other articles don’t. Because when
evaluating the alternatives in the last step of the model, it is possible that the current situation
is the best option. An evaluation graph shows possible changes that might impact the cost per
unit, such as production. The factors to consider in this evaluation originate from the
uncertainty analysis, which has enabled the user to discover uncertainties affecting the
outcome of the decision. The impact of the uncertainties can vary in degree and frequency
depending on alternative. To pinpoint the cost that has the largest impact on an alternative a
sensitivity analysis is performed on the cost categories. These categories have been defined in
step one and includes the costs from the CBS that is dependent on the decision. To identify
the cost that is included in the CBS, a process map has been created to facilitate a structured
approach. This systematic and structured approach minimizes some of the risks involved in a
decision making process, such as: long term implications and intangibles. This enables
comparing and evaluation of different alternatives in regards to their profitability, which also
facilitates follow-up and comparison between the chosen alternative and its practical
implementation.
7.2 Process Specification
Pump house processing (Model test 1)
The process and its objective have been identified as a manufacturing process, which is
processing of a casted pump house. To enable easy comparability between diverse alternatives
the authors has together with the company come up with seven cost categories that will most
likely be the largest contributing factors to the total cost. The cost categories’ are:
depreciation, facility cost, tools, quality, maintenance, salary and energy.
N-Impeller processing (Model test 2)
Xylem Water Solutions AB has a process that processing impellers to the assembly lines in
the factory. The input is raw material from the foundry; the process shall perform a series of
operations according to the blueprints: attachment, surface treatment, hardening and marking.
The output of the process is a finished N-impeller according to the standards and blueprints.
The cost categorize has been determined to be: depreciation, facility cost, tools, quality,
maintenance, salary and energy.
51
7.3 Identify and develop alternatives
Pump house processing (Model test 1)
Three alternative has been identified during this step of module test 1, one of which is the
current process. The other two are: do an overhaul or buy a new machine, but these two will
not be included because of time limitations. As the chosen alternative is a process already in
existents, data about the performance and cost will be more accurate then estimates on new
implementations.
N-Impeller processing (Model test 2)
Possible alternatives for the N-Impeller process are: keep the current or invest in an additional
impeller process equal to the current. To increase the reliability of the data the data from the
current process is used in both alternatives. In alternative two (additional process) the fixed
costs has been doubled (depreciation and facility cost). This is because the variable cost will
be the same in both processes as they are equal.
7.4 Map Process alternatives
Pump house processing (Model test 1)
A process map was created, which include 13 elements and visualized by the use of a
flowchart for the current process of the pump house processing (Figure 11). The data about
this alternative was gathered by the authors of this report and verified by the operator and
production technician responsible for the process. This process map was used to identify the
bottleneck of the process, which is the CNC-machine; this machine reduces the utilization of
the other elements of the process.
N-Impeller processing (Model test 2)
In Figure 19 a created process map of the N-Impeller process is shown by the use of a
flowchart. The bottleneck is identified from the process map to usually be lathe 1 or 2. When
small batch sizes are run, the hardening oven can be the process element that takes the longest
time and create a bottleneck. A single bottleneck can’t be defined because of the different
models of impellers and the batch sizes. This will be the same in both alternatives as they are
the same.
7.5 Cost Break down Structure
Pump house processing (Model test 1)
Alternative one of model test do currently handle over hundred variations of the standard
input (pump houses in different sizes). This made the authors chose to utilize Pareto analysis
to only include the variations that made up for 80% of the production time. The data about the
process is in relation to the included variations and was gathered with two different levels of
detail: departmental and process level. As seen in Figure 12 maintenance information contains
the deepest level of detail and as such, is more reliable. The quality data was provided with
the same amount of detail as maintenance the data.
N-Impeller processing (Model Test 2)
With the use of a Pareto analysis only the variations that stand for 80% of the production time
are included in model test two. As in model test one, the data about the process is in relation
52
to the impeller variations and was gathered with two different levels of detail: departmental
and process level. The maintenance and quality data was on process level, shown in the CBS
(Figure 20) these two has a deeper break-down. Both alternative are based on the same data.
7.6 Categorize Costs
Pump house processing (Model test 1)
The CBS identified 16 different costs (and three additional in maintenance), these costs are
either dependent on the decision or not. Six costs could be determined to not be dependent on
the decision during discussions with representatives of the company and applying theoretical
knowledge of the authors. The remaining costs are related to the process and most of them
where aggregated to the same level of detail as the cost categories (defined in step one); with
the exception of hand tools, measuring tools and tools (machine), which were grouped into
the tools category. Salary was the category with the largest impact (weight of 55.15%), it is
more than the double that of maintenance (21.72%), which is second and four times the
facility cost (12.65%). The deprecation has the lowest impact of all the cost categories, which
is because of that the current process (alternative 1) is almost 25 years old.
N-Impeller processing (Model test 2)
The information is on departmental level and both the processes are included under the same
department, 16 costs are the same. But because maintenance data is existing on process level,
there are some differences from model test one, there is seven additional in the maintenance
cost. The not dependent on process costs are the same as in model test one, this is because the
discussions was done with the technician of the department.
Salary in alternative one has an impact of 45.04% and is the highest cost related to the
process. The second highest category impacting the process is tools with an impact of 24.22%
and deprecation has 11.61%. The quality stands for only 0.51% of the cost impact to the
process. Alternative two salary has an impact of 39.6% on the process, which makes it the
largest contributor. The second highest category impacting the process is tools with an impact
of 21.3% and depreciation has 20.41%. The quality stands for only 0.45% of the cost impact
to the process.
7.7 Uncertainty analysis
Pump house processing (Model test 1)
One of the uncertainty of alternative one is the energy cost category, which data has been
taken from the budget report on the departmental level. This could mean that the data is not
exact for this machine it could be higher or lower, as it is not measured. There is also the
uncertainty of demand, which create the need of determine the impact of possible changes to
the production.
N-Impeller processing (Model test 2)
As the data and the process are the same the uncertainties will be equal but with different
degree of impact. There is a high chance that the precision of the break down costs not is 100
percentage accurate, which is because the economic data is aggregated on the departmental
level of the processing department. Maintenance and quality will bring a more accurate break
53
down, this is because of Xylem uses a maintenance system and a quality logging system.
Those systems are logging all maintenance activities and the quality faults to as high degree
as possible. An uncertainty regarding the facility cost and external changes, such as demand;
has to be taken into consideration.
7.8 Evaluation of alternatives
Pump house processing (Model test 1)
The evaluation matrix (Figure 15) and the change in production graph (Figure 16) only show
the current situation (alternative one), as the others has not been evaluated. The graph shows
that a decrease of 50% of the production time would increase the cost / unit with almost 15%.
If the production time is increased by 50% it decreases the cost per unit with 5%. The
sensitivity analysis of the different cost categories of the current process (alternative one),
shows that if the salary cost is decreased by 50% the total cost of production (at the current
level) will decrease by 30%. But changes in the energy cost will only marginally impact the
overall cost.
N-Impeller processing (Model Test 2)
Keep the current (alternative one) and invest in additional impeller process (alternative two)
and their cost categories are put into the decision matrix (only the percentage impacts are put
in the matrix, as by the company’s whishes). A graph is showing an evaluation of each
alternative, and how the total cost changes if the production is increased or decreased. In
Figure 28 it can be seen that if production is increased by 50% for alternative one the cost per
unit decreases by 4%. If the production in alternative two (invest in additional impeller
process) is decreased by 50% there is a cost increase per unit of almost 25%. An increase in
production would yield a cost per unit decrease of 8%. In Figure 30 it can be seen that salary
is the most sensitivity cost category, as it will impact the total cost of the process to the
highest degree if any changes in the production volume will change. Figure 28 displays that
alternative two is more sensitive to changes in production than alternative one. But in the
sensitivity analysis it can be seen that changes in salary has less of an impact on alternative
two than on alternative one.
54
8. Conclusion
The conclusions that has been drawn in accordance with the problem formulation and is
presented in this chapter, it also includes further research that might be needed and criticism
of the model.
The problem formulation of this thesis is the following, How to select the most profitable
investment in a production process, in regard to a production machine?
The developed model will by breaking down all costs down to process element level give a
clear and structured base to compare between different investments alternatives in a company.
The model can be applied on several different types of processes within a company. This
enables the user to support a decision with a structured approach with regards to the
profitability of different alternatives.
The flexibility of the model allows the decision support to be as good as the quality of the
data available for the process alternative. The model uses uncertainty to describe intangibles
that may affect the total cost of the process, which is used because intangibles are hard to
quantify. As the world is changing in an increasingly higher rate; the possibility of
uncertainties impact on the cost increases. It is therefore vital to consider them during the
decision making process. An evaluation graph is used to see and compare the different
alternatives with regards to for example how changes in production impacts the cost per unit
produced. A sensitivity analysis is performed in the last step to show the possible impact of a
change in a costs category.
The model facilitates decision making in regards to profitability by creating weights for the
cost categories. The structure of the model provides the company with the capability of
sufficient follow-ups data, which can be used for evaluating the accuracy for the decision
support.
8.1 Criticism of the model
The model requires a tremendous amount of data and with high quality, to ensure precision
and correct comparison between alternatives. As the data quality determines the outcome of
the model, this could limit the use of the model on processes where data is hard to come by.
Even if this is the case it could be worthwhile to compile this data as an investment decision
could have a large impact during a long time. Due to lack of time, the thesis has only covered
one alternative for each test, which has resulted in that the remaining parts of the PDCA-
cycle, Do, Check and Act has not been implemented. Therefore the input to the planning
phase from the Act phase could not be verified, which reduces the reliability of the model.

55
8.2 Future Research
Validate the whole model; all alternatives have to be analyzed and compared to enable
the other steps of the PDCA to be completed. To further increase the validity of the
model, tests on several other companies and processes types could be done. To utilize
the model´s full capabilities additional time is required to perform measurements and
show the full result of the model.
Develop a supporting model for information and data gathering to decrease the
uncertainty aspects.
56
9. Recommendations
This chapter includes the recommendations to the case company, based on the result of the
model test.
As the CNC machine in model test one (pump house processing) is the bottleneck it reduces
the utilization of the other elements of the process. Some of this elements are performed
manually and as the salary cost shown in (Figure 17) is the cost with the most potential impact
on the process, further investigation and actions is recommended. This could be to reduce the
manual interaction of the process, such as reducing staffing level; by automation of manual
parts of the process or by modifying working routines.
The economic data provided by the company is developed for the purpose of budgeting,
another form of data could provide more details for investigating investment possibilities.
This could be done by relating costs to machine addresses instead of departmental level,
which in its current state might cause unfair distribution among the machine addresses.
In model test two (N-impeller process) two alternatives has been compared and if the demand
is determine to be more likely to increase rather than decrease, the authors recommend to
further investigate alternative two (invest in an additional impeller process). This means that
the next step of the model (Do) is performed.
57
References
Agrell, P. J., 1995. Interactive Multi-Criteria Decision Making In Production Economic.
Linköping: Production-Economic Research.
Al-Najjar, B., 2007. The Lack of Maintenance and not Maintenance which Costs: A Model to
Describe and Quantify the Impact of Vibration-based Maintenance on Company's Business.
International Journal of Production Economics, 107(1), pp. 260-273.
Al-Najjar, B., 2008. A maintenance Model for Identification, Quantification and Elimination
of Losses in Companies Profitability: Application Examples, Växjö: s.n.
Andersen, H., 1990. Vetenskapsteori och metodlära, en introduktion. Fredriksberg:
Samfundslitteratur.
Andersson, R., 1990. Stora CNC-ordboken med sökregister från engelska och tyska. Malmö :
Team offset.
Ang, C., Luo, M., Khoo, L. & Gay, R. n., 1997. A knowledge-based approach to the
generation of IDEFO models. International Journal Of Production Research, 35(5), pp. 1385-
1412.
Anil Kumar, S. & Suresh, N., 2009. Operations Management. New Delhi: New Age
International (P) Ltd.
Banchard, B. S., 2004. Logistics engineering and management. United States of America:
Pearson Education.
Bergman, B. & Klefsjö, B., 2010. Kvalitet från behov till användning. Lund: Studentlitteratur
AB.
Bergman, B. & Klefsjö, B., 2012. Kvalitet från behov till användning. Lund: Studentlitteratur
AB.
Bicheno, J., Anhede, P., Hillberg, J. & Lindberg Howard, M., 2013. Ny Verktygslåda För
Lean. Göteborg: Revere AB.
Bizworx, 2013. [Online]
Available at: http://bizworx.org/resources/lean-terms/
[Accessed 5 May 2013].
British Standard Institution, 1993. Terms used in Terotechnology, s.l.: BSI.
Bryman, A., 1997. Kvantitet Och Kvalitet I Samhällsvetenskaplig Forskning. Lund:
Studentlitteratur.
Bryman, A. & Nilsson, B., 2011. Samhällsvetenskapliga Metoder. Malmö: Liber.
BusinessDictionary, 2013. [Online]
Available at: http://www.businessdictionary.com
[Accessed 24 May 2013].
58
Chen, J., Li, Y. & Shady, B., 2010. From value stream mapping toward a lean/sigma
continuous improvement process: an industrial case study. International Journal Of
Production Research, 48, , pp. , 48(4), pp. 1069-1086.
Christopher, M., 2011. Logistics and supply chain management. 4 ed. s.l.:Financial Times
Prentice Hall.
Colter, M., 1984. A Comparative Examination of Systems Analysis Techniques. MIS
Quarterly, 8(1), pp. 51-66.
Cottyn, J., Van Landeghem, H., Stockman, K. & Derammelaere, 2011. A method to align a
manufacturing execution system with Lean objectives. International Journal of Production
Research, 49(14), pp. 4397-4413.
Creswell, J., 2009. Research Design: Qualitative, Quantitative, And Mixed Methods
Approaches. California: ThousandOaks .
Eriksson, O., 2007. Sensitivity And Uncertainty Analysis Methods : With Applications To A
Road Traffic Emission Model, Linköping: Linköpings universitet.
Eschenbach, T., 1992. Spiderplots versus Tornado Diagrams for Sensitivity Analysis.
Interfaces, 22(6), pp. 40-46.
Gillham, B., 2000. Case Study Research Methods. New York : Continuum.
Harrison, F. E., 1996. A Process perspective on strategic decision making. Management
Decision, 34(1), pp. 46-53.
Holme, I., Solvang, B. & Nilsson, B., 1997. Forskningsmetodik : Om Kvalitativa Och
Kvantitativa Metoder. Lund: Studentlitteratur.
Ishikawa, K., 2006. Guide To Quality Control. Tokyo: Asian productivity organization.
Kreitner, R., 2009 . Principles of management. s.l.:Wadsworth Publishing Co Inc..
Manuele, F. A., 2008. Advanced Safety Management Focusing On Z10 And Serious Injury
Prevention. Hoboken: Wiley-Interscience.
Merriam, S. B., 1998. Qualitative research and case study applications in education. San
Francisco: Jossey-Bass publisher .
Meyer, U., Creux, S. & Weber Marin, A., 2007. Process Oriented Analysis : Design And
Optimization Of Industrial Production Systems. Boca Raton: CRC/Taylor & Francis.
Nilsson, S. & Persson, I., 1993. Investeringsbedömning. Malmö: Liber-Hermod.
Paradiso, J. & Cruickshank, J., 2007. PROCESS MAPPING for SOX and Beyond. Strategic
Finance, 88(9), pp. 31-35.
Parlos, M. P., 2000. MULTI-CRITERIA DECISION MAKING METHODS: A
COMPARATIVE STUDY. Netherland: Kluwer academic publishers.
Patel, R. & Davidson, B., 2011. Forskningsmetodikens Grunder. 4 ed. Lund: Studentlitteratur.
59
Petersson, P. et al., 2009. Lean, gör avvikelser till framgång!. Bromma: Part Media.
Pike, R. & Neale, B., 2006. Corporate Finance And Investment : Decisions & Strategies.
Harlow: Prentice Hall.
Power, M., 2007. Organized Uncertainty: Designing A World Of Risk Management. New
York: Oxford University Pres.
Rantanen, H., 1995. The effects of productivity on profitability: A case study at firm level
using an activity-based costing approach, Finland: Lappeenranta University of technology.
Rao, R., 2008. Evaluating flexible manufacturing systems using a combined multiple attribute
decision making method. International Journal Of Production Research, 46(7).
Rother, M., Shook, J. & Helling, J., 2001. Lära Sig Se : Att Kartlägga Och Förbättra
Värdeflöden För Att Skapa Mervärden Och Eliminera Slöseri : En Handbok För Praktisk
Tillämpning Av Metoder Och Verktyg För Lean Produktion. Stockholm: Graphium Norstedt.
Russell, R. B. & Taylor, B. W., 2011. Operations management. John Wiley & Sons: Alaska.
Silva, C. & Morabito, R., 2009. Performance evaluation and capacity planning in a
metallurgical job-shop system using open queueing network models. International Journal Of
Production Research, 47(23), pp. 6589-6609.
Smit, M. C., 2012. A North Atlantic Treaty Organization Framework for life cycle costing.
International Journal of Computer Integrated Manufacturing, Volume 25, pp. 444-45.
Stevenson, W. J., 2009. Operations Management. Boston: McGraw-Hill.
Sullivan, W., Wicks, E. & Koelling, C., 2009. Engineering Economy. Harlow :
Pearson/Prentice Hall/Pearson Education International.
Sullivan, W., Wicks, E. & Koelling, C., 2012. Engineering Economy. Harlow: Pearson.
Thomas, L. & Saaty, T. L. S., 2006. Fundamentals of decision making and priority theory
with the analytic hierarchy process. Pittsburgh: RWS, cop.
Triantaphyllou, E., 2000. Multi-Criteria Decision Making Methods: A Comparative Study.
Dordrecht: Kluwer Academic Publishers.
Woodside, A., 2010. Case Study Research: Theory, Methods, Practice. Bingley: Emerald
Group Pub. Ltd..
60
Appendix 1
61
Appendix 2

62
Appendix 3

63

Faculty of Technology
SE-391 82 Kalmar | SE-351 95 Växjö
Phone +46 (0)772-28 80 00
Lnu.se/fakulteten-for-teknik