A mixed integer model of the capacitated facility location...
8
A mixed integer model of the capacitated facility location problem for solid waste management at the northern region of Veracruz, Mexico María del Rosario Pérez-Salazar, Nicolás Francisco Mateo-Díaz, Rogelio García Rodríguez, Lidilia Cruz Rivero, Carlos Eusebio Mar Orozco Instituto Tecnológico Superior de Tantoyuca [email protected], [email protected],[email protected], [email protected], [email protected] Isidro Marco Antonio Cristóbal-Vázquez Instituto Politécnico Nacional, UPIICSA [email protected] Abstract Mexico is the third world consumer of Polyethylene Terephthalate (PET), only behind the United States and China. PET is commonly used in plastic containers such as beverage bottles and foods packaging. It can be argued that the main problem regarding pollution generated by PET waste lies on the lack of an appropriate solid waste management. The decision regarding facility location is the central issue in solid waste management. A mixed integer linear programming model of the capacitated facility location problem (FLP) is proposed; given the quantities of PET generated at the northern region of Veracruz, Mexico, by considering five cities and each as a single generation source, a collection center has to be selected among a set of pre-identified locations in the town of Tempoal, Veracruz; in order to serve a set of demands points in the re-use market so that the overall cost of the system is minimized. To gain a more realistic-based decision, demands are assumed to be uncertain, and a genetic algorithm is designed for the optimization model. Keywords: Solid waste management; PET collection center; green logistics; MILP model. 1. Decisions on the location of facilities of a solid waste system Decisions regarding the location of facilities can be considered as a strategic issue with an inherent risk for almost every company. The problem of locating facilities establishes alternatives in order to evaluate the conditions for proper management of transportation and inventory levels, all this considering the company's ability to manufacture and market its products. The capacitated facility location problem (CFLP) is a well-known variant of the FLP, and has been studied by several authors. According to the list referred, we can find multiple examples in scientific literature regarding CFLP; discrete [24] and continuous [4], multi-facility [6, 30], multi-echelon [13, 28], single source [3, 23] and multi- source [1], multi-commodity [24], and dynamic [9, 27]. The modeling process that requires the facility location decisions has to consider the fluctuation and inherent stochastic nature of the parameters involved in the problem analysis [12, 24]. Costs, demands, travel times, supplies, and other inputs to classical facility location models may be highly uncertain; these input data are based on forecast that results in taking into account uncertain parameters whose values are governed by
Transcript of A mixed integer model of the capacitated facility location...
A mixed integer model of the capacitated facility location problem
for solid waste management at the northern region of Veracruz,
Mexico
María del Rosario Pérez-Salazar, Nicolás Francisco Mateo-Díaz, Rogelio García Rodríguez, Lidilia Cruz
Rivero, Carlos Eusebio Mar Orozco
Instituto Tecnológico Superior de Tantoyuca
[email protected], [email protected],[email protected],
[email protected], [email protected]
Isidro Marco Antonio Cristóbal-Vázquez
Instituto Politécnico Nacional, UPIICSA
Abstract
Mexico is the third world consumer of Polyethylene Terephthalate (PET), only behind the United States
and China. PET is commonly used in plastic containers such as beverage bottles and foods packaging. It
can be argued that the main problem regarding pollution generated by PET waste lies on the lack of an
appropriate solid waste management. The decision regarding facility location is the central issue in solid
waste management. A mixed integer linear programming model of the capacitated facility location
problem (FLP) is proposed; given the quantities of PET generated at the northern region of Veracruz,
Mexico, by considering five cities and each as a single generation source, a collection center has to be
selected among a set of pre-identified locations in the town of Tempoal, Veracruz; in order to serve a set
of demands points in the re-use market so that the overall cost of the system is minimized. To gain a more
realistic-based decision, demands are assumed to be uncertain, and a genetic algorithm is designed for the
optimization model.
Keywords: Solid waste management; PET collection center; green logistics; MILP model.
1. Decisions on the location of facilities of a solid waste system
Decisions regarding the location of facilities can be considered as a strategic issue with an inherent risk
for almost every company. The problem of locating facilities establishes alternatives in order to evaluate
the conditions for proper management of transportation and inventory levels, all this considering the
company's ability to manufacture and market its products.
The capacitated facility location problem (CFLP) is a well-known variant of the FLP, and has been
studied by several authors. According to the list referred, we can find multiple examples in scientific
literature regarding CFLP; discrete [24] and continuous [4], multi-facility [6, 30], multi-echelon [13, 28],
single source [3, 23] and multi- source [1], multi-commodity [24], and dynamic [9, 27]. The modeling
process that requires the facility location decisions has to consider the fluctuation and inherent stochastic
nature of the parameters involved in the problem analysis [12, 24]. Costs, demands, travel times, supplies,
and other inputs to classical facility location models may be highly uncertain; these input data are based
on forecast that results in taking into account uncertain parameters whose values are governed by
roger
Typewritten Text
R. Z. Ríos-Mercado et al. (Eds.): Recent Advances in Theory, Methods, and Practice of Operations Research, pp. 113-120, UANL - Casa Universitaria del Libro, Monterrey, Mexico, October 2014.

probability distributions that are known by the decision maker, and, hence, are likely to be more realistic.
Otherwise, if input data is assumed to be known with certainty, deterministic models are considered [24,
25]. The random parameters can be either continuous, in which case they are generally assumed to be
statistically independent of one another, or described by discrete scenarios, each with a fixed probability
[17, 20, 24, 29, 31].
There are different methods to find the optimal solution to the problem regarding the location of facilities
within network design, such as multi-criteria programming, branch and bound algorithm, dynamic
programming, among others, mixed integer linear programming (MIP) being one of the most popular
method used in commercial location models [2]. Linear programming based techniques have been applied
successfully to uncapacitated to obtain constant factor approximation algorithms for these problems;
however, linear programming based techniques have not been successful when dealing with capacitated
FLP. Continuing with this analysis of the type of solution methodology that has been used for solving the
FLP, many variants of this problem have been studied extensively from the perspective of approximation
algorithms, one of the most recently proposed is heuristics [1, 4, 8, 22, 28].
A waste is something that has no value of use. Solid waste (SW), commonly known as trash or garbage
consists of everyday items such as product packaging, grass clippings, furniture, clothing, bottles, food
scraps, newspapers, appliances, paint and batteries [10]. A solid waste collection system is concerned
with the collection of waste from sources, routing to trucks within the region, the frequency of collection,
crew size, truck sizes, number of operating trucks, transportation of collected waste to a transfer station,
an intermediate processing facility or a landfill and a host of other problems [14]. Within solid waste
management (SWM) we can identify some key activities such as the selection of the number and
locations of transfer stations, intermediate processing facilities, landfill sites, their capacities, capacity
expansion strategies and routing of the waste across point sources (district or counties within the region)
and routing of the waste through the facilities to ultimate disposal on a macroscopic level. Regarding
these two routing choices, we recognize two perspectives in SWM, regional and by district [14]. Limited
suitable land area and resources, growing public opposition, and deterioration of environmental
conditions are invariably the main constraints for the proper functioning of an SWM. In this context,
SWM has often been viewed from the narrow perspective of counties or districts rather than a regional
perspective [18]. Some applications and examples have been observed in literature [10].
The phases of SWM can be divided into four distinct phases [12]: pre-collection, collection,
transportation and treatment. The pre-collection is the proper storage, handling, sorting and presentation
of waste suitable for collection and transfer conditions. This phase is essential for the accurate functioning
of the following stages. Collection and transportation stages are often the most costly and hence require
careful planning. 50 to 70 % of the transport and disposal of solid waste was spent on collection phase
[19]. Waste are compacted and transported directly to the points of treatment or transfer plants.
Treatment includes disposal operations or use of the materials contained in the waste.
One of the main issues in SWM involves facility capacity location, where a related optimization analysis
will typically require the use of integer variables to carry on the decision process about locating a
particular facility development or expansion options to be used. Thus, MIP techniques are useful for this
purpose [15]. Uncertainty is an important issue to discuss in SWM, primarily in waste generation and
economic criteria. Waste generation is a function of population distribution and growth, and per capita
waste generation rates, while economic estimates are a function of the technology used, economies of
scale, land availability, and local labor and equipment prices. Deterministic and stochastic mathematical
programming models have been applied for SWM [18]. Some of the approaches concerning deterministic

models are linear programming, MIP, dynamic programming, and multi - objective programming; in
contrast, techniques used for stochastic models involve probability, fuzzy and grey system theory [5].
2. Model formulation
Model formulation for the multiple-source, capacitated facility location problem is described as follow:
given a number of sources that generate quantities of SW, a collection center has to be selected among a
set of locations, in order to serve a set of demand points. The objective is to locate the collection center
that minimizes the fixed and variable cost of handle and transport products through the selected network.
The index, parameters and variables of this model are shown in table 1, table 2 and table 3.
Table 1. Model sets
Set Description
Sources
Collection Center
Customer
Table 2. Model parameters
Parameters Description
Amount of solid waste supplied by the source Demand of the customer
Minimum annual capacity for the collection center
Maximum annual capacity for the collection center
Fixed part of the annual operating cost for the collection center
Variable unit cost of activity for the collection center
Cost of processing and transporting a unit of solid waste from the source
through the collection center to the customer
Table 3. Model variables
Index Description
Amount of units of solid waste from the source through the collection
center to the customer
Variable equal to 1 if the collection center j serves the customer k, and 0
otherwise
Variable equal to 1 if the collection center j is open, and 0 otherwise
The mathematical formulation is as follows:
∑
∑[ ∑
]
∑
∑
∑
∑
{ }
The objective function (1) aims to minimize fixed costs and variable costs. The supply constraint states
that available supply cannot be exceeded (2), and the demand of all demands points (3) must be satisfied.
Regarding operability of the collection center, each customer must be served only by one collection center
(4). Also, for each collection center there should be a minimal activity in order to begin operation and a
maximum activity as well, set by the established capacity (5).
3. Situation description
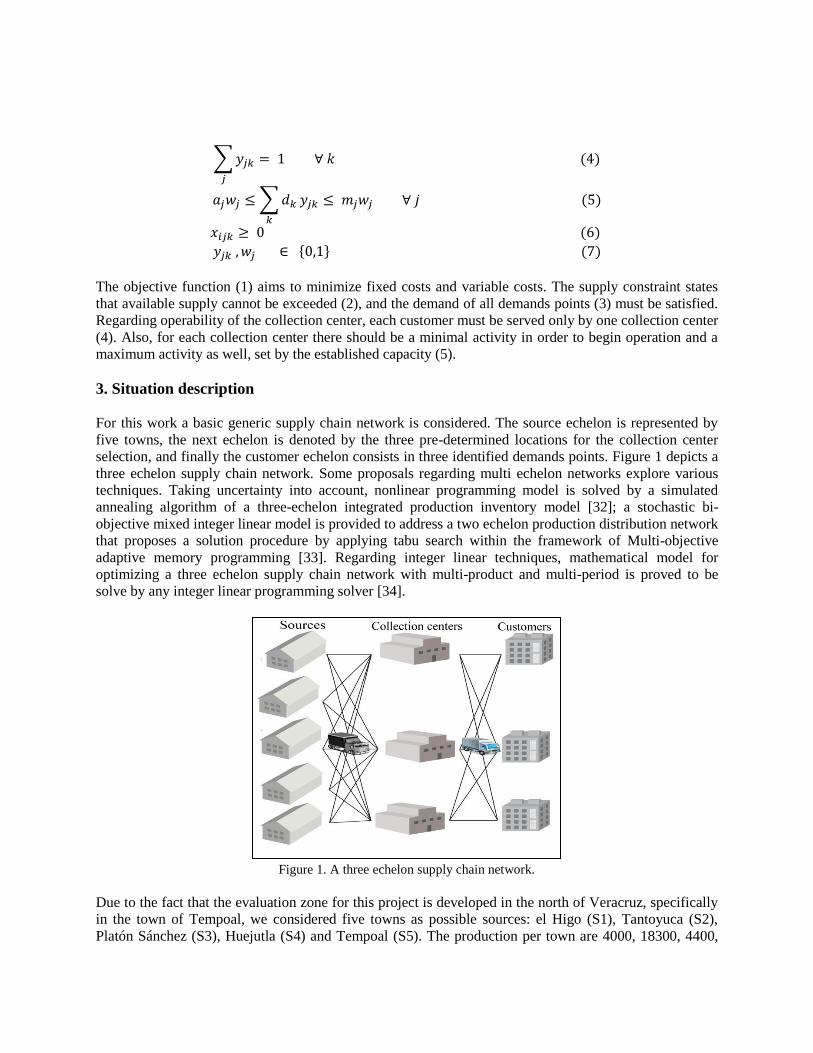
For this work a basic generic supply chain network is considered. The source echelon is represented by
five towns, the next echelon is denoted by the three pre-determined locations for the collection center
selection, and finally the customer echelon consists in three identified demands points. Figure 1 depicts a
three echelon supply chain network. Some proposals regarding multi echelon networks explore various
techniques. Taking uncertainty into account, nonlinear programming model is solved by a simulated
annealing algorithm of a three-echelon integrated production inventory model [32]; a stochastic bi-
objective mixed integer linear model is provided to address a two echelon production distribution network
that proposes a solution procedure by applying tabu search within the framework of Multi-objective
adaptive memory programming [33]. Regarding integer linear techniques, mathematical model for
optimizing a three echelon supply chain network with multi-product and multi-period is proved to be
solve by any integer linear programming solver [34].
Figure 1. A three echelon supply chain network.
Due to the fact that the evaluation zone for this project is developed in the north of Veracruz, specifically
in the town of Tempoal, we considered five towns as possible sources: el Higo (S1), Tantoyuca (S2),
Platón Sánchez (S3), Huejutla (S4) and Tempoal (S5). The production per town are 4000, 18300, 4400,

32920 and 7700 tons per year, respectively. From this amounts only the 2% of each town correspond to
PET and other plastics [4]; hence the amounts to be considered as parameter the "Amount of solid waste
supplied by each source ", for this case are 80, 366, 88, 658, 154 tons per year, respectively. This amounts
increase 13% per year [3], thus the increase was calculated over a period of 5 years.
Three potential customers for the re-use of PET were established taking into account the volume of
purchase (demand), the cost of transportation, cost of processing, storage capacity and fixed costs. For
this case a customer located in the city of Tampico (C1) other in Madero city (C2), and the third in
Altamira city (C3) in the state of Tamaulipas where selected. The demand data were collected through a
field study in which random customers were taken in the state of Tamaulipas, specifically in the towns of
Tampico and Altamira. The data obtained were analyzed and it was observed that the three sets of data
follow a normal distribution. According to ECOCE, a private non-profit, created and sponsored by the
Mexican food and beverage industry, PET collection in Mexico has increased since 2006 with an average
of 13.5%; information about average growth regarding PET collection for C1, C2 and C3 was collected
by analyzing records for companies registered by the local government in a five year period, from 2008 to
2012. This analysis showed that the average growth for C1 is 13.99%, for C2 is 13.72% and finally for C3
is 14.27.
4. Genetic algorithm principles
Genetic algorithms (GAs) are mathematical optimization techniques that simulate a natural evolution
process. GAs are one of the artificial intelligence exhaustive searching techniques; they are stochastic
algorithms whose search methods model some natural phenomena: genetic inheritance and Darwin strife
for survival [27]. In reference to multi-objective optimization, GAs search procedure consists of
maintaining a population of potential solutions while conducting a parallel investigation for non-
dominated solutions [22]. Considering network strategy design which contemplates the logistic chain
network problem formulated by a MIP model , GAs have been applied as an alternative procedure for
generating optimal or near-optimal solutions to location problems [7, 16, 26].
The GA implemented in this study uses quite common genetic operators. The proposed GA procedure
implies the following steps: 1) encoding of solutions, 2) initial population creation, 3) fitness evaluation,
4) selection procedure, 5) crossover, and 6) mutation. The encoded solution is an array of values that
describes one solution of the problem. The first value represents the location selected for the collection
center. The subsequent values indicate the amount of units of SW from sources to customer.
Table 4. Solution representation
CC S1
C1
S1
C2
S1
C3
S2
C1
S2
C2
S2
C3
S3
C1
S3
C2
S3
C3
S4
C1
S4
C2
S4
C3
S5
C1
S5
C2
S5
C3
1 10 12 50 100 12 14 29 80 2 54 13 1 90 1 34
Table 4 shows one solution of the GA. The solution indicates that the best location for the collection
center is A1. Moreover, the solution indicates that the amount of units of SW from source 1 to customer 1
is 100. It can be noted that transporting units of SW from S1 to C2 is more suitable, rather than transport
units from S3 to C3. Each instance of the problem consist of a file with all the information described in
section 4, such as number of sources, number of customers and corresponding demand; and in reference
to the collection center locations information like initial investment of build for construction, annual
operating cost, minimum and maximum capacity. Each file represent one year of the 5 year planning
horizon. Initially, instances are considered without uncertainty. The demand of customers is known and

don’t change over time. Each instance of the problem was executed 30 times with the GA and the
solutions were compared with the results obtained by GAMS (General Algebraic Modeling System).
GAMS is a high-level software tool for modeling and solving optimization problems and mathematical
programming. The comparative process was used to tune the GA. Population size and percentage of
mutation was set to 100 and 1%. The selection process was carried out by tournament. The runtime in all
cases was less than 1.5 seconds and is noted that runtime was not relevant in finding the best solution.
The second group of instances includes uncertainty regarding customer demand, represented by a normal
distribution. In order to obtain the parameters of the probability distribution, goodness of fit tests were
executed.
5. Results
Table 5 shows the execution results along with the number set of the collection center selected to be open.
GAMS results indicate to open the collection center in A1, while the GA proposed to open the collection
center in A2. The average cost for each instance is presented. Analyzing the outcome it can be noted that
in all 5 instances of the problem the GA gives better results than GAMS decreasing up to 30% in the
overall cost, thus validating the GA. Then, 30 iterations of the GA were executed for every year
considered in the planning horizon, taking into account the uncertainty representing the variation of the 3
demand points modeled by normal probability distribution (see table 6) along with the number set of the
collection center selected to be open and the average cost.
Table 5. GA validation results
Instance
number
GAMS Genetic algorithm
Difference
(%) Collection
center
selection
Cost ($) Collection
center
selection
Costo ($)
1 1 1,252,976.00 2 897,597.00 28.36
2 1 1,432,087.00 2 1,019,647.00 28.79
3 1 1,623,722.00 2 1,149,455.00 29.20
4 1 1,829,795.00 2 1,287,834.00 29.61
5 1 2,051,309.00 2 1,435,040.00 30.04
Table 6. GA results considering random demand
Year
Normal distribution parameters of customer
demand
Collection
center
selection
Average cost
($)
Customer 1 Customer 2 Customer 3
µ 𝜎 µ 𝜎 µ 𝜎
1 611 49 315 23 250 23 2 835,925.00
2 267 21 365 18 278 18 2 672,782.00
3 841 55 401 27 318 20 2 1,064,062.00
4 919 65 462 25 375 28 2 1,180,820.00

5 1049 96 514 21 424 32 2 1,319,197.00
The mathematical model is optimized through genetic algorithm presented in this section. The
optimization is performed subject to random demand to determine which collection center to open and the
corresponding calculations of cost.
6. Conclusions
Within Mexican environmental context, a priority issue regards creating solid waste treatment facilities
due to the considerable increase in waste in recent years. There are several techniques regarding decisions
on the location of facilities of a solid waste system. The overall objective of the work presented in this
paper was to develop a facility location problem to assist decision makers on the selection of a collection
center among three pre-identified locations given by the local government. We identify as a three
echelon, multi-source, capacitated facility location problem due to consideration of transferring
PET waste generation in five towns at the northern region of Veracruz through the selected collection
center to meet three demand points in the re-use market, all this considering the overall cost of the
network. The facility location problem is modeled using mixed integer programming technique. The
mathematical model is optimized through genetic algorithm. The optimization is performed subject to
random demand to determine which collection center to open and the corresponding calculations of cost.
References
1. P. Avella, & M. Boccia, 2009. A cutting plane algorithm for the capacitated facility location problem
Computational Optimization and Applications, 43(1), 39-65, 2009.
2. R. H Ballou. Logística: administración de la cadena de suministro. Pearson Educación, 2004.
3. G. Cabrera, E. Cabrera, R. Soto, L. Rubio, B. Crawford, & F. Paredes. A Hybrid Approach Using an
Artificial Bee Algorithm with Mixed Integer Programming Applied to a Large-Scale Capacitated
Facility Location Problem”. Mathematical Problems in Engineering, 2012.
4. H. J. Carlo, F. Aldarondo, P.M. Saavedra, & S.N. Torres. Capacitated Continuous Facility Location
Problem With Unknown Number of Facilities. Engineering Management Journal, 24(3), 2012.
5. G. Chi. Integrated planning of a solid waste management system in the City of Regina. Doctoral
dissertation, University of Regina. 1997
6. F. A. Chudak & D.P. Williamson. Improved approximation algorithms for capacitated facility location
problems. In Integer programming and combinatorial optimization, pp. 99-113, Springer Berlin
Heidelberg, 1999.
7. E. S. Correa, M.T.A Steiner, A.A. Freitas, & C. Carnieri. A genetic algorithm for solving a capacitated
p-median problem. Numerical Algorithms,35(2-4), 373-388, 2004
8. J. Dias, M. E. Captivo & J. Clímaco. Dynamic Location Problems with Discrete Expansion and
Reduction Sizes of Available Capacities. Investigação Operacional, 27(2), 107-130, 2007.
9. J. Dias, M. E. Captivo & J. Clímaco, J. Capacitated dynamic location problems with opening, closure
and reopening of facilities. IMA Journal of Management Mathematics, 17(4), 317-348, 2006.
10. E. Erkut, A. Karagiannidis, G. Perkoulidis, & S. A.Tjandra. A multicriteria facility location model for
municipal solid waste management in North Greece. European Journal of Operational Research,
187(3), 1402-1421, 2008.
11. R. Z. Farahani, M. SteadieSeifi, & N. Asgari. Multiple criteria facility location problems: A survey.
Applied Mathematical Modelling, 34(7), 1689-1709, 2010.
12. F. J. A. García, & E. C. Tena. 2006. Gestión de residuos sólidos urbanos: análisis económico y
políticas públicas. Cuadernos económicos de ICE, (71), 71-91, 2006.
13. B. Gendron & F. Semet. Formulations and relaxations for a multi-echelon capacitated location–
distribution problem. Computers & Operations Research, 36(5), 1335-1355, 2009.

14. H. W. Gottinger1988. A computational model for solid waste management with application. European
Journal of Operational Research, 35(3), 350-364, 1998.
15. Huang, G. G. H., Huaicheng, G., & Guangming, Z., 1997. “A mixed integer linear programming
approach for municipal solid waste management”. JOURNAL OF ENVIRONMENTAL SCIENCES
CHINA-ENGLISH EDITION-, 9, 431-445.
16. J. Kratica, D. Tošic, V. Filipović, & I. Ljubić. Solving the simple plant location problem by genetic
algorithm. RAIRO-Operations Research, 35(01), 127-142, 2001.
17. O. Listeş, & R. Dekker. A stochastic approach to a case study for product recovery network design.
European Journal of Operational Research, 160(1), 268-287, 2005.
18. M.A. Najm, M. El-Fadel, G. Ayoub, M. El-Taha, & F. Al-Awar. An optimization model for regional
integrated solid waste management I. Model formulation. Waste management & research, 20(1), 37-
45, 2002.
19. B. Noche, F. A. Rhoma, T. Chinakupt, & M. Jawale. Optimization model for solid waste management
system network design case study. In Computer and Automation Engineering (ICCAE) The 2nd
International Conference on Vol. 5, pp. 230-236, IEEE, February, 2010.
20. M.A. Shafia, R. Rahmaniani, A. Rezai, & M. Rahmaniani. Robust Optimization Model for the
Capacitated Facility Location and Transportation Network Design Problem. International Conference
on Industrial Engineering and Operations Management Istanbul, 2012.
21. S. Shepherd, & A. Sumalee. A genetic algorithm based approach to optimal toll level and location
problems. Networks and Spatial Economics, 4(2), 161-179, 2004.
22. C. M. Silva, & E. C. Biscaia. Genetic algorithm development for multi-objetive optimization of Batch
Free radical polymerization reactors. Computers & Chemical Engineering, 27, pp 1329,1344, 2003.
23. F. J. F Silva, & D. S de la Figuera. A capacitated facility location problem with constrained
backlogging probabilities. International journal of production research, 45(21), 5117-5134, 2007
24. L. V. Snyder. Facility location under uncertainty: a review. IIE Transactions, 38(7), 547-564, 2006.
25. L. V. Snyder, M. S. Daskin & C. P. Teo. The stochastic location model with risk pooling. European
Journal of Operational Research, 179(3), 1221-1238, 2007.
26. A. Syarif, Y. Yun, & M. Gen. Study on multi-stage logistic chain network: a spanning tree-based
genetic algorithm approach. Computers & Industrial Engineering, 43(1), 299-314, 2002.
27. J.E. Torres-Soto,& H. Üster. Dynamic-demand capacitated facility location problems with and without
relocation. International Journal of Production Research, 49(13), 3979-4005, 2011.
28. S. Tragantalerngsak, J. Holt, & M. Rönnqvist. An exact method for the two-echelon, single-source,
capacitated facility location problem. European Journal of Operational Research, 123(3), 473-489,
2000.
29. M. R.Wagner, J. Bhadury, & S. Peng. Risk management in uncapacitated facility location models with
random demands. Computers & Operations Research, 36(4), 1002-1011, 2009.
30. L.Y. Wu, X. S. Zhang & J. L. Zhang, Capacitated facility location problem with general setup cost.
Computers & Operations Research, 33(5), 1226-1241, 2006.
31. J. Zhou, & B. Liu, 2003. New stochastic models for capacitated location-allocation problem.
Computers & industrial engineering, 45(1), 111-125, 2003.
32. Varyani, A., Jalilvand-Nejad, A., & Fattahi, P. (2014). Determining the optimum production quantity
in three-echelon production system with stochastic demand. The International Journal of Advanced
Manufacturing Technology, 72(1-4), 119-133.
33. Cardona-Valdés, Y., Álvarez, A., & Pacheco, J. (2014). Metaheuristic procedure for a bi-objective
supply chain design problem with uncertainty. Transportation Research Part B: Methodological, 60,
66-84.
34. Cárdenas-Barrón, L. E., & Treviño-Garza, G. (2014). An optimal solution to a three echelon supply
chain network with multi-product and multi-period. Applied Mathematical Modelling, 38(5), 1911-
1918.