A MID INFRARED STUDY OF LOW-LUMINOSITY AGNS WITH WISE · A MID INFRARED STUDY OF LOW-LUMINOSITY...
16
Revista Mexicana de Astronom´ ıa y Astrof´ ısica, 50, 255–270 (2014) A MID INFRARED STUDY OF LOW-LUMINOSITY AGNS WITH WISE R. Coziol, 1 J. P. Torres-Papaqui, 1 I. Plauchu-Frayn, 2 H. Andernach, 1 D. M. Neri-Larios, 3 R. A. Ortega-Minakata, 1 and J. M. Islas-Islas 1 Received 2014 January 26; accepted 2014 May 16 RESUMEN Utilizando datos en el infrarrojo medio (MIR) del Wide-field Infrared Survey Explorer (WISE), mostramos que las galaxias AGNs de baja luminosidad (LLAGNs) presentan colores en el infrarrojo medio (MIR) significamente diferentes de los de las estrellas post-rama asint´ otica gigante (PAGBs). Esto se debe a una diferencia en la distribuci´ on de energ´ ıa espectral (SED), pues los LLAGNs muestran una componente plana debida a un AGN. Congruentemente con esta interpretaci´on, mostramos que en un diagrama color-color los LINERs y las Seyfert 2s siguen una ley de potencia con colores espec´ ıficos que permiten distinguir unas de las otras, y de las galaxias con formaci´ on estelar, en base a sus diferentes niveles de formaci´ on reciente de estrellas. Basado en estos resultados, presentamos un nuevo diagrama de diagn´ostico en el MIR que confirma la clasificaci´ on obtenida en el ´ optico a partirde diagramas de diagn´ostico est´ andar, e identifican claramente los LINERs y LLAGNs como verdareros AGNs. ABSTRACT Using data from the Wide-field Infrared Survey Explorer (WISE) we show that the mid infrared (MIR) colors of low-luminosity AGNs (LLAGNs) are significanlty different from those of post-asymptotic giant branch stars (PAGBs). This is due to a difference in the spectral energy distribution (SEDs), the LLAGNs showing a flat component due to an AGN. Consistent with this interpretation we show that in a MIR color-color diagram the LINERs and the Seyfert 2s follow a power law with specific colors that allow to distinguish them from each other, and from star forming galaxies, according to their present level of star formation. Based on this result we present a new diagnostic diagram in the MIR that confirms the classification obtained in the optical using standard diagnostic diagrams, clearly identifying LINERs and LLAGNs as genuine AGNs. Key Words: galaxies: active — infrared: galaxies 1. INTRODUCTION Studies of clusters and compact groups (Phillips et al. 1986; Coziol et al. 1998; Miller et al. 2003; Mart´ ınez et al. 2008, 2010) have revealed that many narrow emission-line galaxies (NELGs) cannot be classified us- ing standard diagnostic diagrams (Baldwin, Phillips, & Terlevich 1981; Veilleux & Osterbrock 1987), be- cause the most important emission lines, Hβ and [OIII]λ5007, are either too weak or not observed. This is rather common, affecting about 20% of the early- type galaxies in compact groups, but reaching 60% in clusters (Phillips et al. 1986; Coziol et al. 1998; Miller et al. 2003; Mart´ ınez et al. 2008). After subtracting a stellar population template from their spectra, Coziol et al. (1998) have demon- 1 Departamento de Astronom´ ıa, Universidad de Guanajuato, Guanajuato, Mexico. 2 Instituto de Astronom´ ıa, Universidad Nacional Aut´ onoma de M´ exico, Ensenada, B.C., Mexico. 3 School of Physics, The University of Melbourne, Australia. strated that these unclassified NELGs have spectral characteristics typical of low luminosity AGNs: the emission lines have small equivalent widths (EWs), consistent with low emission luminosities, and the ra- tios [NII]λ6584/Hα are high, which is a defining trait of AGNs (Baldwin, Phillips, & Terlevich 1981; Veilleux & Osterbrock 1987; Osterbrock 1989). Subsequently, Mart´ ınez et al. (2008) confirmed that even after cor- recting for dust extinction the median value of the Hα luminosity in these galaxies is only 7.1 × 10 39 erg s −1 , which qualify them as low-luminosity AGNs (LLAGNs; Ho, Filippenko, & Sargent 1997; Zhang, Dultzin- Hacyan, & Wang 2007; Mart´ ınez et al. 2008, 2010). The most straightforward interpretation for LLAGNs is that they are some sort of evolved AGNs or “dying quasars”, where matter at the center of the galaxies is falling on the exhausted accretion disk of a super-massive black hole (BH), reviving its activity (Coziol et al. 1998; Richstone et al. 1998; Miller 255
-
Upload
vuongkhuong -
Category
Documents
-
view
215 -
download
0
Transcript of A MID INFRARED STUDY OF LOW-LUMINOSITY AGNS WITH WISE · A MID INFRARED STUDY OF LOW-LUMINOSITY...

Revista Mexicana de Astronomıa y Astrofısica, 50, 255–270 (2014)
A MID INFRARED STUDY OF LOW-LUMINOSITY AGNS WITH WISE
R. Coziol,1 J. P. Torres-Papaqui,1 I. Plauchu-Frayn,2 H. Andernach,1 D. M. Neri-Larios,3
R. A. Ortega-Minakata,1 and J. M. Islas-Islas1
Received 2014 January 26; accepted 2014 May 16
RESUMEN
Utilizando datos en el infrarrojo medio (MIR) del Wide-field Infrared SurveyExplorer (WISE), mostramos que las galaxias AGNs de baja luminosidad (LLAGNs)presentan colores en el infrarrojo medio (MIR) significamente diferentes de los de lasestrellas post-rama asintotica gigante (PAGBs). Esto se debe a una diferencia en ladistribucion de energıa espectral (SED), pues los LLAGNs muestran una componenteplana debida a un AGN. Congruentemente con esta interpretacion, mostramos queen un diagrama color-color los LINERs y las Seyfert 2s siguen una ley de potenciacon colores especıficos que permiten distinguir unas de las otras, y de las galaxias conformacion estelar, en base a sus diferentes niveles de formacion reciente de estrellas.Basado en estos resultados, presentamos un nuevo diagrama de diagnostico en el MIRque confirma la clasificacion obtenida en el optico a partir de diagramas de diagnosticoestandar, e identifican claramente los LINERs y LLAGNs como verdareros AGNs.
ABSTRACT
Using data from the Wide-field Infrared Survey Explorer (WISE) we show thatthe mid infrared (MIR) colors of low-luminosity AGNs (LLAGNs) are significanltydifferent from those of post-asymptotic giant branch stars (PAGBs). This is due toa difference in the spectral energy distribution (SEDs), the LLAGNs showing a flatcomponent due to an AGN. Consistent with this interpretation we show that in a MIRcolor-color diagram the LINERs and the Seyfert 2s follow a power law with specificcolors that allow to distinguish them from each other, and from star forming galaxies,according to their present level of star formation. Based on this result we present anew diagnostic diagram in the MIR that confirms the classification obtained in theoptical using standard diagnostic diagrams, clearly identifying LINERs and LLAGNsas genuine AGNs.
Key Words: galaxies: active — infrared: galaxies
1. INTRODUCTION
Studies of clusters and compact groups (Phillips etal. 1986; Coziol et al. 1998; Miller et al. 2003; Martınezet al. 2008, 2010) have revealed that many narrowemission-line galaxies (NELGs) cannot be classified us-ing standard diagnostic diagrams (Baldwin, Phillips,& Terlevich 1981; Veilleux & Osterbrock 1987), be-cause the most important emission lines, Hβ and[OIII]λ5007, are either too weak or not observed. Thisis rather common, affecting about 20% of the early-type galaxies in compact groups, but reaching 60% inclusters (Phillips et al. 1986; Coziol et al. 1998; Milleret al. 2003; Martınez et al. 2008).
After subtracting a stellar population templatefrom their spectra, Coziol et al. (1998) have demon-
1Departamento de Astronomıa, Universidad de Guanajuato,
Guanajuato, Mexico.2Instituto de Astronomıa, Universidad Nacional Autonoma
de Mexico, Ensenada, B.C., Mexico.3School of Physics, The University of Melbourne, Australia.
strated that these unclassified NELGs have spectralcharacteristics typical of low luminosity AGNs: theemission lines have small equivalent widths (EWs),consistent with low emission luminosities, and the ra-tios [NII]λ6584/Hα are high, which is a defining traitof AGNs (Baldwin, Phillips, & Terlevich 1981; Veilleux& Osterbrock 1987; Osterbrock 1989). Subsequently,Martınez et al. (2008) confirmed that even after cor-recting for dust extinction the median value of the Hαluminosity in these galaxies is only 7.1 × 1039 erg s−1,which qualify them as low-luminosity AGNs (LLAGNs;Ho, Filippenko, & Sargent 1997; Zhang, Dultzin-Hacyan, & Wang 2007; Martınez et al. 2008, 2010).
The most straightforward interpretation forLLAGNs is that they are some sort of evolved AGNsor “dying quasars”, where matter at the center of thegalaxies is falling on the exhausted accretion disk ofa super-massive black hole (BH), reviving its activity(Coziol et al. 1998; Richstone et al. 1998; Miller
255
256 COZIOL ET AL.
et al. 2003; Gavignaud et al. 2008). However, analternative interpretation, put forward by Stasinskaet al. (2008) and Cid Fernandes et al. (2010, 2011),suggests these galaxies are “retired galaxies”, falselyidentified as AGNs, in which the gas is ionized bypost-asymptotic giant branch stars (PAGBs; Binetteet al. 1994, hereafter the PAGB hypothesis). Duringthe last few years, the PAGB hypothesis has won inpopularity and was even proposed (e.g. Eracleous,Hwang, & Flohic 2010; Singh et al. 2013) to explainthe LINERs, the prototype LLAGN that forms about30% of all the early-type spiral galaxies observed inthe field (Heckman 1980; Kauffmann 2009).
However, the PAGB hypothesis is somewhat am-biguous. The whole evolution from the AGB to thewhite dwarf phase cannot last more than 10000 years(Volk & Kwok 1989). This is a transient phenomenonthat does not fit well with the ubiquity of the LLAGNs.It is not clear either to what phase of the post AGB evo-lution the PAGB hypothesis is alluding. By definition,an AGB is a red giant star that does not produce ion-izing photons. When this star collapses, transforminginto a white dwarf, the central star, for a brief period,becomes extremely hot, its effective temperature reach-ing up to 105 K (McCook & Sion 1999; Eisenstein et al.2006). Sometime during this transformation, the staremits ultraviolet photons that are responsible for ion-izing the gas of the envelope recently ejected from theAGB. This phase corresponds to that of the planetarynebula (PN). After that, the effective surface temper-ature of the central star falls down rapidly to about104 K, which is not hot enough to ionize the gas. Theexpanding gas cloud thus becomes invisible, ending thePN phase (Kwok 2000). The star is now a white dwarf.
Strictly speaking, therefore, a PAGB is a pre-planetary nebula (pre-PN, see definition in Davies etal. 2005, Suarez et al. 2006, Kitsikis 2007), which de-scribes the stage when the temperature of the evolvingAGB is still rising, and that lasts only a few thousandyears (Volk & Kwok 1989). Sometime during this briefphase the UV photons from the hot white dwarf wouldbe able to escape from the expanding gas and dust en-velope of the AGB and ionize the interstellar gas over akpc region. The exact mechanism by which this is pos-sible remains, however, largely unexplained (Binetteet al. 1994). In spite of this problem, Taniguchi etal. (2000) claimed that it is not the pre-PN stars thationize the gas in a galaxy, but the central hot whitedwarfs of the PNs themselves. However, this wouldimply that the gas nebulae are generally optically thin,which means that all the PNs are density-bound. Thisis an oversimplification of the PN theory (see the basicexplanations in Osterbrock & Ferland 2006). More-over, this complicates the PAGB hypothesis, becauseone needs then to establish what fraction of the ion-izing photons are escaping the nebulae. Consequently,
the fluxes of UV photons required to ionize the gasmight not be sufficient to explain a typical LLAGN.This is unless we have a very high number of PNs atall times, which is highly improbable considering theshort lifetime of this phenomenon.
Nevertheless Stasinska et al. (2008), have claimedthat both PAGBs (it is not clear if the authors referto pre-PNs, PNs or both) and white dwarfs are re-sponsible for producing the photons that can ionizethe gas in LLAGNs over kpc regions. The ad hoc ad-dition of white dwarfs to the PAGB hypothesis is in-teresting. White dwarfs can be present in great num-bers in very old galaxies, which is the case of mostLLAGNs (Torres-Papaqui et al. 2013), and they canlive for a very long time. However, strictly speaking,we would call this model the “hot white dwarfs hypoth-esis”, because only white dwarfs with an effective tem-peratures above 18000 K can produce ionizing photons(Bianchi et al. 2011). Again, this restriction might sig-nificantly reduce the available flux of ionizing photonsin a LLAGN, considering that the majority of whitedwarfs are cold, having a surface temperature well be-low 18000 K (McCook & Sion 1999; Eisenstein et al.2006; Bianchi et al. 2011).
Taking into account the three possible “post AGB”phases as described above, there is one clear and im-mediate consequence of the PAGB hypothesis, whichis that one would need a very high number of “hotPAGBs” to ionize the amount of gas observed in atypical LLAGN. In Binette et al. (1994, see theirTable 1), the 15 galaxies for which the PAGB hy-pothesis was proposed have a mean Hα luminosity of1039.6 erg s−1 (converting their cosmology to the one weused). In Martınez et al. (2008) an average luminosityof 1039.8 erg s−1 is reported for the LLAGNs (about 100galaxies) in compact groups. In comparison, the 43922LLAGN candidates in our present sample have an Hαluminosity that varies between 1041 and 1039 erg s−1.Adopting 1040 erg s−1 for the mean Hα luminosity andusing the equation QH ∼ 7.3 × 10¹¹Lα photon s−1 forthe relation between the flux of ionizing photons, QH ,and the Hα luminosity, Lα (Pottasch 1965; Kennicuttet al. 1994; Madau et al. 1998), we deduce that a flux of1051.9 photon s−1 is needed to explain the ionized gas ina typical LLAGN. In Figure 1 of Binette et al. (1994)the normalized flux of ionizing photons produced bythe PAGBs after about 13 Gyrs is predicted to be 1041
photon s−1 M−1
⊙ , which gives a mass of stars equal to1051.9/1041 = 1010.9M⊙. Since the central star of aPAGB is a hot white dwarf with a mass ∼1M⊙, thisimplies that of the order 1011 hot PAGBs are neededto ionize the gas in a typical LLAGN. Note that oneobtains exactly the same number of white dwarfs us-ing the model of Stasinska et al. (2008). Therefore,between 1012 and 1010 hot white dwarfs would be re-
MIR STUDY OF LOW-LUMINOSITY AGNS 257
quired by the PAGB hypothesis to explain the ionizedgas in the LLAGN candidates forming our sample.
The fact that we need such a high number of whitedwarfs is easy to understand. According to Coziol,Barth & Demers (1995) the equivalent of 105 O and Bstars would be needed to ionize the gas in an averageLLAGN (note that the same number of O and B starsis predicted after 107 yrs by the model of Binette et al.1994). Because the number of ionizing photons emittedby a star is directly proportional to its surface area,which for a typical white dwarf is only 10−6 times thatof a normal O star, then of the order of 105/10−6 =1011 white dwarfs are thus required.
Obviously, like the massive stars in the SFGs, sucha high number of hot white dwarfs in the LLAGNs mustleave their trace elsewhere than in the optical spectra.In particular, it should be possible to test directly thePAGB hypothesis for the LLAGNs in the mid infrared(MIR; e.g. Pastoriza et al. 2000). The MIR emissionis due to dust, which in a galaxy is either heated bystars or an AGN (Wright et al. 2010; Jarrett et al.2011; Mateos et al. 2013; Assef et al. 2013). Since thesetwo sources have different spectral energy distributions(SEDs), stars being similar to black bodies and AGNemitting energy through a power-law (Alonso-Herreroet al. 2006), the light re-emitted by dust should thushave different SEDs. Consequently, a high number ofhot PAGBs in a LLAGN must produce characteristiccolors in the MIR that should be clearly distinguishedfrom those produced by an AGN.
In their study, Pastoriza et al. (2000) observed thatsome early-type galaxies with weak emission lines havea “blue” SED in the optical and infrared. They conse-quently suspected that either an AGN or PAGBs pro-duced these blue SEDs. However, based on their MIRdata they were unable to distinguish between a blackbody and a power law. Nonetheless, these authors con-cluded in favor of the PAGB hypothesis because theydid not observe an excess of infrared emission, whichthey assumed must be a characteristic of any AGNs inthe MIR. However, the sample in Pastoriza et al. (2000)was too small (only 28 galaxies) to establish what arethe “normal” MIR characteristics of NELGs with dif-ferent activity types, and these authors did not com-pare the MIR emission of their galaxies with the actualMIR emission produced by PAGB stars. These short-comings can be rectified today thanks to data from theSloan Digital Sky Survey (York et al. 2000) and theWide-field Infrared Survey Explorer (WISE; Wright etal. 2010).
2. SELECTION OF THE SAMPLES
2.1. The “standard” NELGs and the LLAGN
candidates
To establish what are the normal characteristics ofgalaxies with different activity types in the MIR, wehave assembled a large sample of “standard” NELGs,
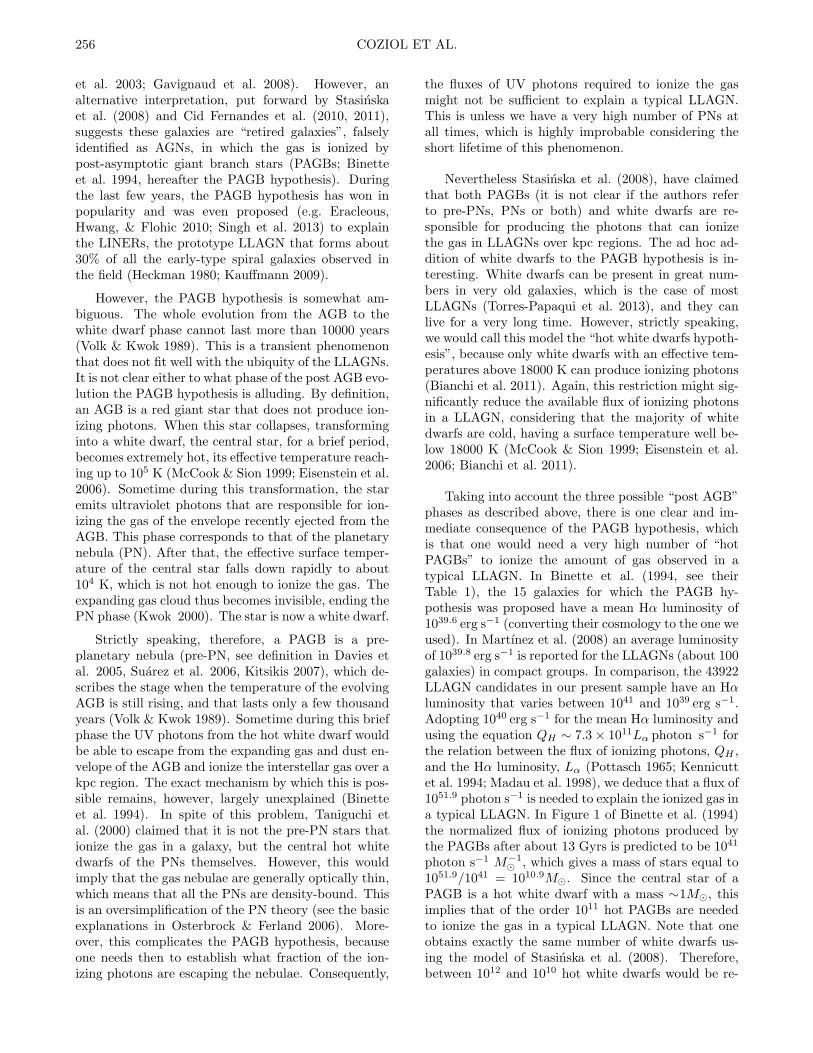
Fig. 1. The BPT-VO diagnostic diagram for the SDSS stan-dard NELGs. The separation between SFGs and TOs wassuggested by Kauffmann et al. (2003) and the separationbetween AGNs and TOs by Kewley et al. (2001). The sep-aration between the LINERs and Sy2s was established inTorres-Papaqui et al. (2012a).
and searched for corresponding data in WISE. The“standard” NELGs are defined as NELGs that can beclassified using standard diagnostic diagrams. Thesestandard NELGs were thoroughly studied by Torres-Papaqui et al. (2012a). In Figure 1 we show one stan-dard diagnostic diagram (hereafter, the BPT-VO dia-gram; Baldwin, Phillips, & Terlevich 1981; Veilleux &Osterbrock 1987), that we used to separate the stan-dard NELGs into star forming galaxies (SFGs), transi-tion type objects (TOs), Seyfert 2 (Sy2s) and LINERs.To distinguish between LINERs and Sy2s we followedthe method described by Kewley et al. (2006). Thedistinction between the two activity types is basedon differences in the [OI]λ6300 and [SII]λλ6717, 6730emission-line intensities (Torres-Papaqui et al. 2012a).
The NELGs for our study were selected from themain spectral catalog of the Sloan Digital Sky Sur-vey Data Release 7 (SDSS DR7) (Abazajian et al.2009), which represents the completion of the SDSSproject, a series of three interlocking imaging and spec-troscopic surveys, carried out over an eight-year periodwith a dedicated 2.5 m telescope located at ApachePoint Observatory in Southern New Mexico. The SDSSDR7 catalog includes the spectra of 9.3× 10⁵ galaxies,1.2 × 105 quasars and 4.6 × 10⁵ stars4.
As a first selection criterion we kept only the galax-ies with redshift z ≤ 0.25. Then, after correctingfor the redshifts and subtracting stellar templates pro-
4http://www.sdss.org/dr7/start/aboutdr7.html.

258 COZIOL ET AL.
duced by STARLIGHT (Cid Fernandes et al. 2005), weapplied the signal-to-noise (S/N) criteria adopted byBrinchmann et al. (2004), Kewley et al. (2001, 2006),Kauffmann et al. (2003) and (Cid Fernandes et al.2010): we kept only the galaxies that have line ra-tios in emission with S/N ≥ 3, and S/N ≥ 10 in theadjacent continuum.
For the MIR data, we cross-correlated the positionsof the NELGs in our sample with objects in the cata-log produced by WISE (Wright et al. 2010), which isavailable through the IRSA (IR Science Archive)5. Us-ing a radius of one arcsecond around the positions ofthe galaxies, our search produced 110685 SFGs, 37829TOs, 11002 Sy2s and 7599 LINERs. The results ofour search were confirmed independently using the X-Match pipeline in VizieR (Ochsenbein, Bauer & Mar-cout 2000). Our selected galaxies have WISE fluxeswith signal to noise S/N > 2 (corresponding to qualityflags ph qual equal to A, B or C) in all of the four MIRbands of WISE (3.3, 4.6, 12, and 22 µm).
To test the PAGB hypothesis we have also selectedfrom SDSS DR7 a sample of LLAGN candidates. InCoziol et al. (1998) the LLAGNs were characterized bytheir spectra as galaxies that show, after a stellar tem-plate subtraction, high ratios of [NII]λ6584/Hα typicalof AGNs, but that cannot be classified using standarddiagnostic diagrams, because either Hβ or [OIII]λ5007,or both emission lines are undetected.
From the SDSS DR7 spectroscopic catalog we firstselected 476841 NELGs with a S/N ≥ 10 in the con-tinuum and redshift z ≤ 0.25. After having correctedfor the redshifts and subtracted stellar templates pro-duced by STARLIGHT, we found 10926 galaxies withboth Hβ and [OIII] undetected (hereafter identifiedas LLAGNα), 20784 galaxies with Hβ detected but[OIII]λ5007 undetected (identified as LLAGNβ), and61290 galaxies with [OIII] detected but Hβ undetected(identified as LLAGNγ). Together, these three samplesrepresent about 20% of the whole sample of NELGs.Keeping only the NELGs that have a S/N ≥ 3 in theremaining emission lines reduces the sample to 219375galaxies (46% of the original sample). In this sample wedistinguish 4198 LLAGNα, 12378 LLAGNβ and 36524LLAGNγ, which represents ∼24% of the NELGs withS/N ≥3. After cross-correlating the positions of thesegalaxies with those of the objects in the WISE catalog,applying the same search radius and quality criterionon the fluxes as for the standard NELGs, we found 2840LLAGNα, 9615 LLAGNβ, and 31467 LLAGNγ (83%of the LLAGN candidates with S/N ≥ 3). Countingonly the NELGs with WISE data (176115 standardNELGs and 43922 LLAGN candidates), the NELGswith undetected emission represent 21% of the wholesample. Contrary to what was stated in Cid Fernandes
5http://irsa.ipac.caltech.edu/cgi-bin/Gator/
nph-scan?mission=irsa\&submit=Select\&projshort=WISE.
Fig. 2. WHAN diagnostic diagrams for our three samplesof NELGs with some emission lines undetected: a) 9615LLAGNβ, b) 31467 LLAGNγ, and c) 2840 LLAGNα (seedescriptions in the text). The separations between the ac-tivity types are as defined in Cid Fernandes et al. (2010).
et al. (2010), the fact that the fraction of NELGs withundetected lines stays constant suggests that the rea-son why some emission lines are not detected in thesegalaxies is not due to a low S/N (see discussion in § 2.2below).
2.2. Classification of LLAGNs according to the
WHAN diagnostic diagram
According to Cid Fernandes et al. (2010, 2011) itis possible to determine the nature of the activity ofNELGs that have weak or undetected emission linesbased on a new diagnostic diagram, the WHAN diag-nostic diagram, that compares the EW of Hα with the
MIR STUDY OF LOW-LUMINOSITY AGNS 259
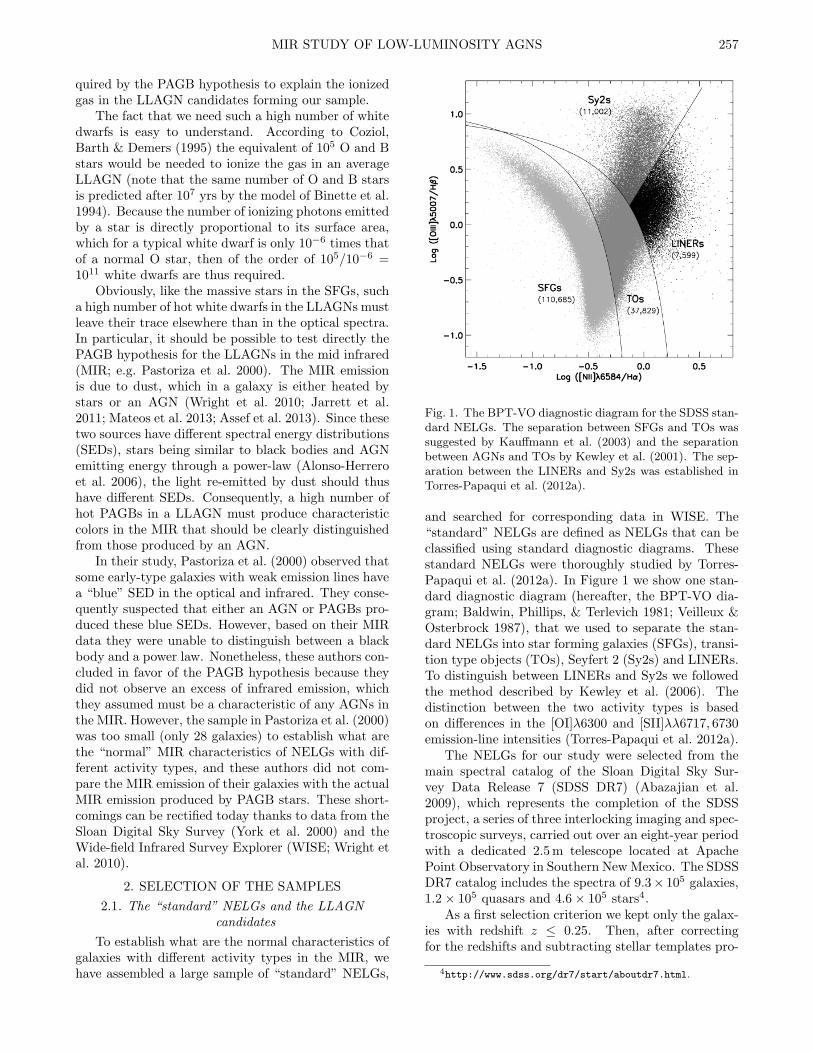
Fig. 3. Same as Figure 2 keeping only the NELGs withS/N ≥ 5.
ratio [NII]λ6584/Hα. Applying this diagram for a largesample of these galaxies taken from SDSS, these au-thors concluded that most of them are “retired galax-ies”, that is galaxies where the activity is dominatedby PAGBs.
In Figure 2 we show the WHAN diagrams for ourthree samples of LLAGN candidates. In Figure 2a theLLAGNβ sample seems to form a mixture of SFGs,Sy2s and LINERs. In Figure 2b, the LLAGNγ sampleshows even more diversity: a small number look likea mixture of SFGs and Sy2s, a higher fraction looklike LINERs, and only a few look like retired galaxies.In Figure 2c the LLAGNα sample seems to be mostlycomposed of LINERs. Consequently, there seem to bevery few LLAGNs in our sample consistent with thePAGB hypothesis.
From the above results, one could worry that thedefinition of retired galaxies is sensitive to noise intro-duced by the choice of a too low S/N selection criterion(e.g. Rola & Pelat 1994). To test this hypothesis, wehave changed our criterion, keeping only the NELGswith S/N ≥ 5. The number of LLAGNγ decreases to82% of the original sample with S/N ≥ 3, the num-ber of LLAGNβ to 77.0% and the number of LLAGNαto 74.0%. However, in the WHAN diagram for theLLAGNs with S/N ≥ 5 shown in Figure 3, we can stillidentify a good fraction of LLAGNγ as retired galax-ies. Also, our description in terms of mixture of ac-tivity types stays the same. This result confirms thatthe reason why some emission lines are not detected inthese galaxies is not due to low S/N. For the rest ofour analysis we will thus keep our original sample withS/N ≥ 3.
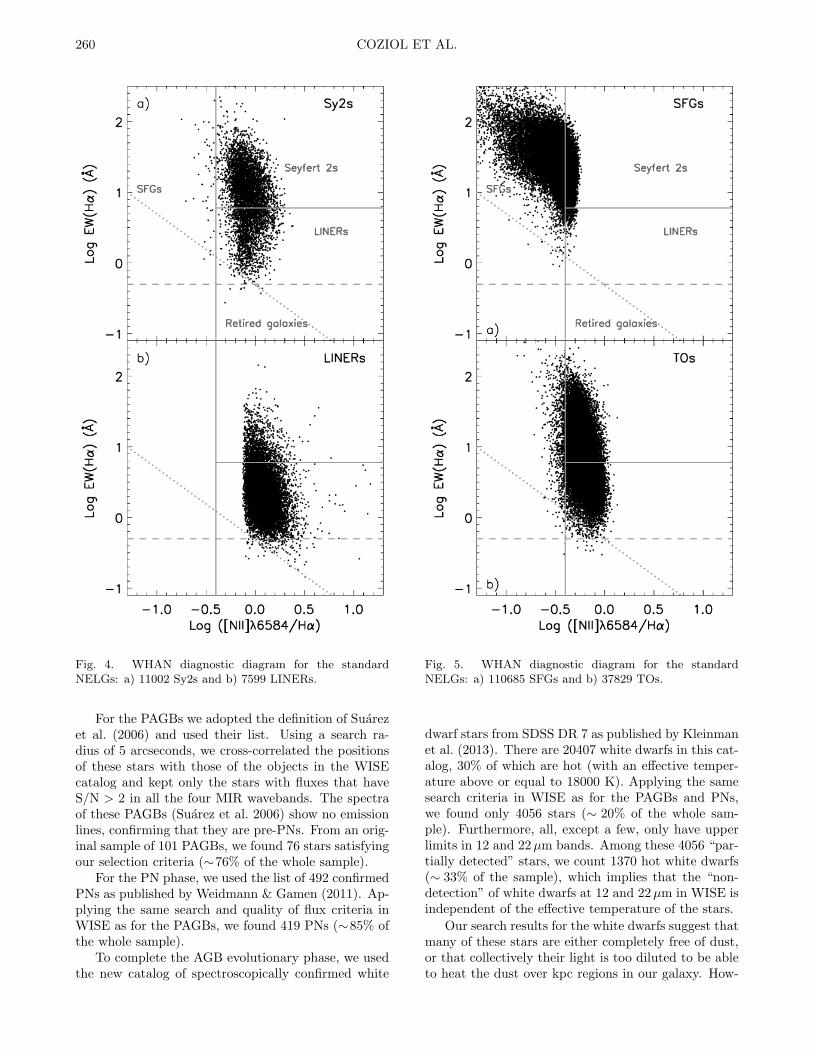
For comparison sake, we trace in Figure 4 theWHAN diagram for the standard NELGs classified asSy2s and LINERs. Here we can observe that althoughin the BPT-VO diagram we can discriminate betweenthe LINERs and the Sy2s, the two classes stronglyoverlap in the WHAN diagram. The difference comesfrom the use in the WHAN diagram of the EW, whichis sensitive to the stellar populations and morphologiesof the galaxies, but not to the ionization state of thegas or the nature of their ionizing source, which is re-lated to the ratio of the emission lines [NII]λ6584/Hα.According to the standard definition, Sy2s are AGNs(they show high [NII]λ6584/Hα ratios) with high ion-ization states, because they have high [OIII]λ5007/Hβratios, while LINERs are AGNs with low ionizationstates. This difference is not reflected in the WHANdiagram.
The situation is slightly better in Figure 5 for theSFGs, but this is because the hosts of the SFGs forma more homogeneous population, they are mostly late-type spirals. However, we also note an important over-lap with the Sy2s, which does not exist in the BPT-VOdiagram. The situation becomes even more ambigu-ous in the case of the TOs. However, according tothe WHAN diagram most of these galaxies are AGNs,classified either as Sy2s or LINERs, not SFGs.
According to the WHAN diagram, it is difficult tounderstand why the AGN nature of our three groups ofLLAGN candidates was not recognized. This is unlessone also rejects the AGN nature of LINERs (e.g. Era-cleous, Hwang, & Flohic 2010; Singh et al. 2013). So itseems fundamental in our analysis that we also verifythe PAGB hypothesis for the LINERs (see § 4.1).
2.3. Covering the entire post-AGB evolutionary phase
To be able to test the PAGB hypothesis, it is impor-tant to build a sample of stars that covers all the differ-ent evolutionary stages of the post-AGBs: the genuinePAGBs (pre-PNs), the PNs and the hot white dwarfs.
260 COZIOL ET AL.
Fig. 4. WHAN diagnostic diagram for the standardNELGs: a) 11002 Sy2s and b) 7599 LINERs.
For the PAGBs we adopted the definition of Suarezet al. (2006) and used their list. Using a search ra-dius of 5 arcseconds, we cross-correlated the positionsof these stars with those of the objects in the WISEcatalog and kept only the stars with fluxes that haveS/N > 2 in all the four MIR wavebands. The spectraof these PAGBs (Suarez et al. 2006) show no emissionlines, confirming that they are pre-PNs. From an orig-inal sample of 101 PAGBs, we found 76 stars satisfyingour selection criteria (∼76% of the whole sample).
For the PN phase, we used the list of 492 confirmedPNs as published by Weidmann & Gamen (2011). Ap-plying the same search and quality of flux criteria inWISE as for the PAGBs, we found 419 PNs (∼85% ofthe whole sample).
To complete the AGB evolutionary phase, we usedthe new catalog of spectroscopically confirmed white
Fig. 5. WHAN diagnostic diagram for the standardNELGs: a) 110685 SFGs and b) 37829 TOs.
dwarf stars from SDSS DR 7 as published by Kleinmanet al. (2013). There are 20407 white dwarfs in this cat-alog, 30% of which are hot (with an effective temper-ature above or equal to 18000 K). Applying the samesearch criteria in WISE as for the PAGBs and PNs,we found only 4056 stars (∼ 20% of the whole sam-ple). Furthermore, all, except a few, only have upperlimits in 12 and 22µm bands. Among these 4056 “par-tially detected” stars, we count 1370 hot white dwarfs(∼ 33% of the sample), which implies that the “non-detection” of white dwarfs at 12 and 22µm in WISE isindependent of the effective temperature of the stars.
Our search results for the white dwarfs suggest thatmany of these stars are either completely free of dust,or that collectively their light is too diluted to be ableto heat the dust over kpc regions in our galaxy. How-
MIR STUDY OF LOW-LUMINOSITY AGNS 261
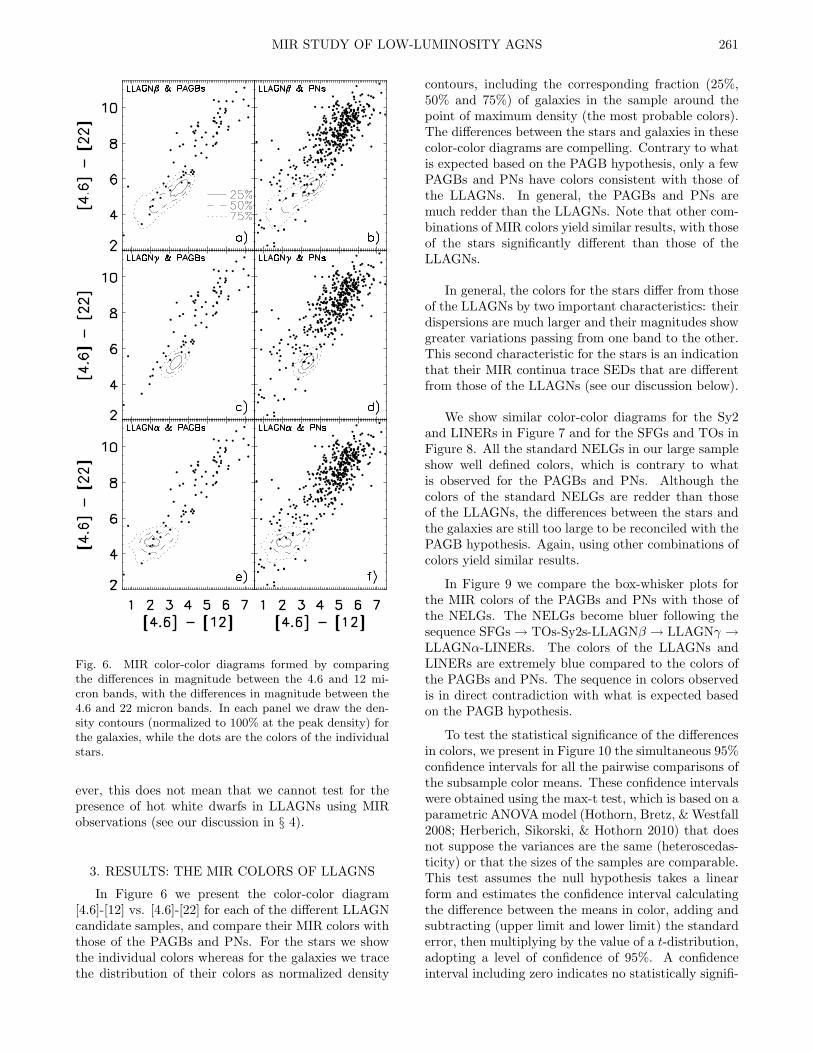
Fig. 6. MIR color-color diagrams formed by comparingthe differences in magnitude between the 4.6 and 12 mi-cron bands, with the differences in magnitude between the4.6 and 22 micron bands. In each panel we draw the den-sity contours (normalized to 100% at the peak density) forthe galaxies, while the dots are the colors of the individualstars.
ever, this does not mean that we cannot test for thepresence of hot white dwarfs in LLAGNs using MIRobservations (see our discussion in § 4).
3. RESULTS: THE MIR COLORS OF LLAGNS
In Figure 6 we present the color-color diagram[4.6]-[12] vs. [4.6]-[22] for each of the different LLAGNcandidate samples, and compare their MIR colors withthose of the PAGBs and PNs. For the stars we showthe individual colors whereas for the galaxies we tracethe distribution of their colors as normalized density
contours, including the corresponding fraction (25%,50% and 75%) of galaxies in the sample around thepoint of maximum density (the most probable colors).The differences between the stars and galaxies in thesecolor-color diagrams are compelling. Contrary to whatis expected based on the PAGB hypothesis, only a fewPAGBs and PNs have colors consistent with those ofthe LLAGNs. In general, the PAGBs and PNs aremuch redder than the LLAGNs. Note that other com-binations of MIR colors yield similar results, with thoseof the stars significantly different than those of theLLAGNs.
In general, the colors for the stars differ from thoseof the LLAGNs by two important characteristics: theirdispersions are much larger and their magnitudes showgreater variations passing from one band to the other.This second characteristic for the stars is an indicationthat their MIR continua trace SEDs that are differentfrom those of the LLAGNs (see our discussion below).
We show similar color-color diagrams for the Sy2and LINERs in Figure 7 and for the SFGs and TOs inFigure 8. All the standard NELGs in our large sampleshow well defined colors, which is contrary to whatis observed for the PAGBs and PNs. Although thecolors of the standard NELGs are redder than thoseof the LLAGNs, the differences between the stars andthe galaxies are still too large to be reconciled with thePAGB hypothesis. Again, using other combinations ofcolors yield similar results.
In Figure 9 we compare the box-whisker plots forthe MIR colors of the PAGBs and PNs with those ofthe NELGs. The NELGs become bluer following thesequence SFGs → TOs-Sy2s-LLAGNβ → LLAGNγ →
LLAGNα-LINERs. The colors of the LLAGNs andLINERs are extremely blue compared to the colors ofthe PAGBs and PNs. The sequence in colors observedis in direct contradiction with what is expected basedon the PAGB hypothesis.
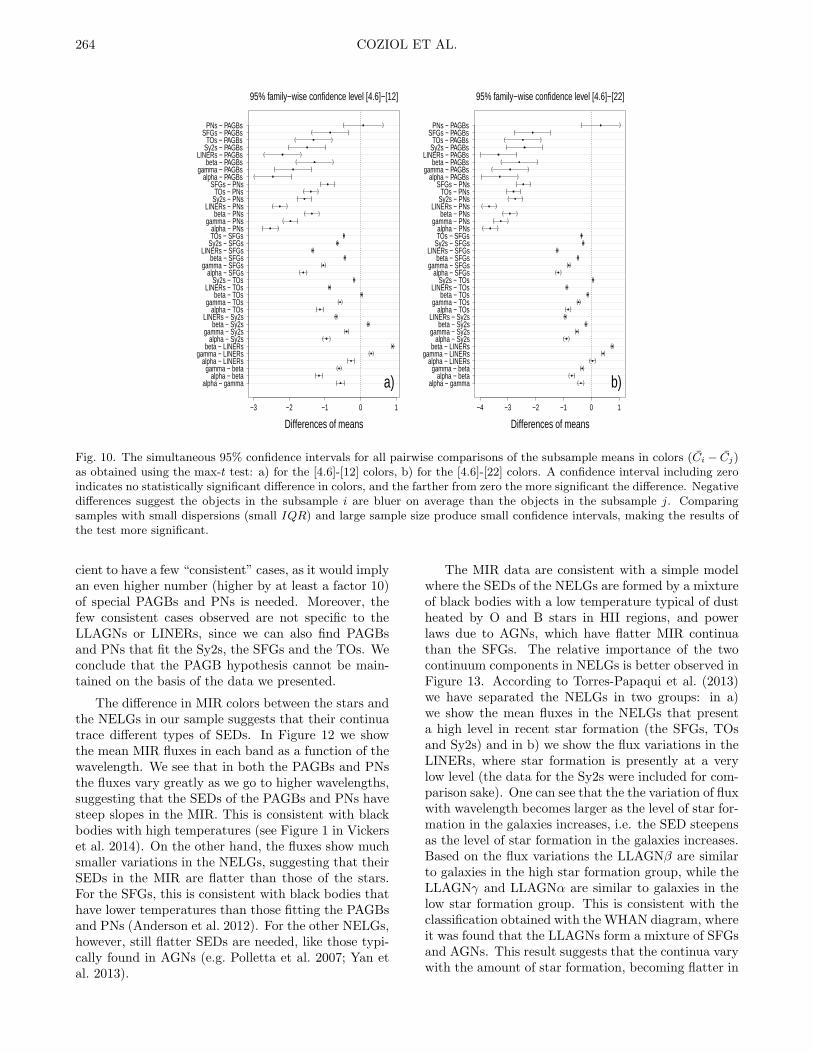
To test the statistical significance of the differencesin colors, we present in Figure 10 the simultaneous 95%confidence intervals for all the pairwise comparisons ofthe subsample color means. These confidence intervalswere obtained using the max-t test, which is based on aparametric ANOVA model (Hothorn, Bretz, & Westfall2008; Herberich, Sikorski, & Hothorn 2010) that doesnot suppose the variances are the same (heteroscedas-ticity) or that the sizes of the samples are comparable.This test assumes the null hypothesis takes a linearform and estimates the confidence interval calculatingthe difference between the means in color, adding andsubtracting (upper limit and lower limit) the standarderror, then multiplying by the value of a t-distribution,adopting a level of confidence of 95%. A confidenceinterval including zero indicates no statistically signifi-

262 COZIOL ET AL.
Fig. 7. Same as Figure 6 for the Sy2s and LINERs in thestandard NELGs sample.
cant difference between the subsample means, and thefarther from zero the more significant the difference.
According to the results of the max-t test presentedin Figure 10 there is no significant difference on aver-age between the colors of the PAGBs and PNs. A sim-ilar result was obtained before by Suarez et al. (2006)in the far infrared using IRAS. It is obvious from themax-t test that the NELGs, and most particularly theLINERs and LLAGNs, are too blue (all the differencesare negative) to be compatible with the dominant pres-ence of PAGBs or PNs in any of these galaxies. Basedon these results, we can confidently reject the PAGBhypothesis for the LLAGNs in our sample.
The max-t tests also confirm the color sequenceseen in Figure 9: the NELGs become bluer follow-ing the sequence SFGs → TOs-Sy2s → LLAGNβ →
LLAGNγ → LLAGNα-LINERs. In Torres-Papaqui et
Fig. 8. Same as Figure 6 for the SFGs and TOs in thestandard NELGs sample.
al. (2013) a similar sequence was found for the stan-dard NELGs, which was shown to trace a gradual de-crease in star formation activity as the morphologiesof the galaxies change from late to early types (Ken-nicutt 1992a,b; Coziol 1996; Coziol et al. 2011). Thisis supported by Figure 11, where we compare the box-whisker plots for the morphologies and EWs of Hα forall the NELGs in our sample, separated by activitytypes. The morphologies of the standard NELGs weredetermined in Torres-Papaqui et al. (2012a) and thesame method was used to determine the morpholo-gies of the three different samples of LLAGN candi-dates in this study. One can see that the EWs ofHα for the standard NELGs decrease following the se-quence SFGs → Sy2s-TOs → LINERs. Following thesame sequence these galaxies pass from late-type spi-rals to early-type spirals. Similarly, the EWs for the

MIR STUDY OF LOW-LUMINOSITY AGNS 263
Fig. 9. Box-whisker plots comparing the two MIR colorsused in our study as observed in the PAGBs, the PNs, thestandard NELGs and the three LLAGN candidates, whichare identified by their Greek letters. The lower side of thebox is the lower quartile, Q1, and the upper side is the upperquartile, Q3. The whiskers correspond to Q1 − 1.5 × IQRand Q3 + 1.5× IQR, where IQR is the interquartile range.The median is shown as a bar and the mean as a circle.The notches have a width proportional to the IQR and areinversely proportional to the square root of the size of thesample N . Comparing two samples, no overlapping notchesimplies that the medians of the two samples have a highprobability of being different.
three LLAGN samples decrease following the sequenceLLAGNβ → LLAGNγ → LLAGNα and following thesame sequence the morphologies change from late-typespirals to early-type spirals.
The above results suggest a simple physical expla-nation for the non-detection of some emission lines inthe LLAGNs. The high ratios [NII]λ6584/Hα of theLLAGNs in the WHAN diagram suggest that thesegalaxies are mostly metal rich (as was previously rec-ognized also by Cid Fernandes et al. 2010). If we could
trace the BPT-VO diagram for these galaxies, mostprobably they would be located at the junction be-tween the SFGs and AGNs arms of the ν shape dis-tributions, since this is where we find the most metalrich NELGs (Coziol et al. 2011; Torres-Papaqui et al.2012b). Therefore, the intensity of the [O III]λ5007emission line is expected to be lower than the intensityof the Hβ emission line by a factor 3, 10 or more. Thischaracteristic is at the basis of the explanation for thenon-detection of some emission lines in NELGs.
According to the color sequence, the LLAGNβ arestill actively forming stars, which suggests that theirspectra are surely affected by dust absorption. Bothemission lines in the blue, [OIII] and Hβ, would thusdecrease in intensity. However, considering the highintensity difference, [OIII] could easily disappear whileHβ would still be observed. On the other hand, thecolor sequence for the LLAGNγ suggests that thestar formation in these galaxies as compared to theLLAGNβ has already started to decline, which impliesthat these galaxies may be particularly rich in inter-mediate age stellar populations (Deutsch & Willner1986; Coziol 1996; Coziol, Doyon, & Demers 2001).Since the Balmer absorption lines are culminating inintermediate age stars (Rose 1985), the Hβ emissionline could completely disappear. At the same time, ifthe LLAGNγ have slightly lower metallicity than theLLAGNβ, then the intensity of the [OIII] lines couldbe sufficiently high to be detected. Finally, the colorsequence for the LLAGNα suggests star formation, likein the LINERs, is at its lowest level in these galaxies.Then, in high metallicity galaxies both emission linescould easily become undetected.
We conclude therefore that a variation in star for-mation (Torres-Papaqui et al. 2013), in parallel withvariations in morphology and metallicity explain theMIR colors sequence and the differences between thedifferent standard NELGs and LLAGNs. According tothis explanation, about 20% of the NELGs have un-detected lines, because they are especially metal rich,and, as we observed, this is independent of the S/N intheir spectra.
4. DISCUSSION
4.1. Revealing the AGN nature of LLAGNs
In the previous section we have shown that the MIRcolors of the LLAGNs are significantly different fromthose of the PAGBs and PNs. Only a few of these starshave colors consistent with those of the LINERs andLLAGNs in our sample. However, for the PAGB hy-pothesis to be satisfied, the PAGBs and PNs must de-fine the colors of the LLAGNs, which implies that theircolor distributions must be exactly the same. Also,considering the high number (of the order of 1011) ofhot white dwarfs required to explain the ionization ofthe gas in a typical LLAGN, it is obviously not suffi-
264 COZIOL ET AL.
−3 −2 −1 0 1
alpha − gammaalpha − beta
gamma − betaalpha − LINERs
gamma − LINERsbeta − LINERs
alpha − Sy2sgamma − Sy2s
beta − Sy2sLINERs − Sy2s
alpha − TOsgamma − TOs
beta − TOsLINERs − TOs
Sy2s − TOsalpha − SFGs
gamma − SFGsbeta − SFGs
LINERs − SFGsSy2s − SFGsTOs − SFGsalpha − PNs
gamma − PNsbeta − PNs
LINERs − PNsSy2s − PNsTOs − PNs
SFGs − PNsalpha − PAGBs
gamma − PAGBsbeta − PAGBs
LINERs − PAGBsSy2s − PAGBsTOs − PAGBs
SFGs − PAGBsPNs − PAGBs (
((
((
((
((
((
((
((
((
((
((
((
((
((
((
((
((
((
(
))
))
))
))
))
))
))
))
))
))
))
))
))
))
))
))
))
))
Differences of means
95% family−wise confidence level [4.6]−[12]
a)−4 −3 −2 −1 0 1
alpha − gammaalpha − beta
gamma − betaalpha − LINERs
gamma − LINERsbeta − LINERs
alpha − Sy2sgamma − Sy2s
beta − Sy2sLINERs − Sy2s
alpha − TOsgamma − TOs
beta − TOsLINERs − TOs
Sy2s − TOsalpha − SFGs
gamma − SFGsbeta − SFGs
LINERs − SFGsSy2s − SFGsTOs − SFGsalpha − PNs
gamma − PNsbeta − PNs
LINERs − PNsSy2s − PNsTOs − PNs
SFGs − PNsalpha − PAGBs
gamma − PAGBsbeta − PAGBs
LINERs − PAGBsSy2s − PAGBsTOs − PAGBs
SFGs − PAGBsPNs − PAGBs (
(((
((
((
(((
((
((
((
((
((
((
((
((
((
((
((
((
(
))
))
))
))
)))
))
))
))
))
))
))
))
))
))
))
))
))
)
Differences of means
95% family−wise confidence level [4.6]−[22]
b)
Fig. 10. The simultaneous 95% confidence intervals for all pairwise comparisons of the subsample means in colors (Ci − Cj)as obtained using the max-t test: a) for the [4.6]-[12] colors, b) for the [4.6]-[22] colors. A confidence interval including zeroindicates no statistically significant difference in colors, and the farther from zero the more significant the difference. Negativedifferences suggest the objects in the subsample i are bluer on average than the objects in the subsample j. Comparingsamples with small dispersions (small IQR) and large sample size produce small confidence intervals, making the results ofthe test more significant.
cient to have a few “consistent” cases, as it would implyan even higher number (higher by at least a factor 10)of special PAGBs and PNs is needed. Moreover, thefew consistent cases observed are not specific to theLLAGNs or LINERs, since we can also find PAGBsand PNs that fit the Sy2s, the SFGs and the TOs. Weconclude that the PAGB hypothesis cannot be main-tained on the basis of the data we presented.
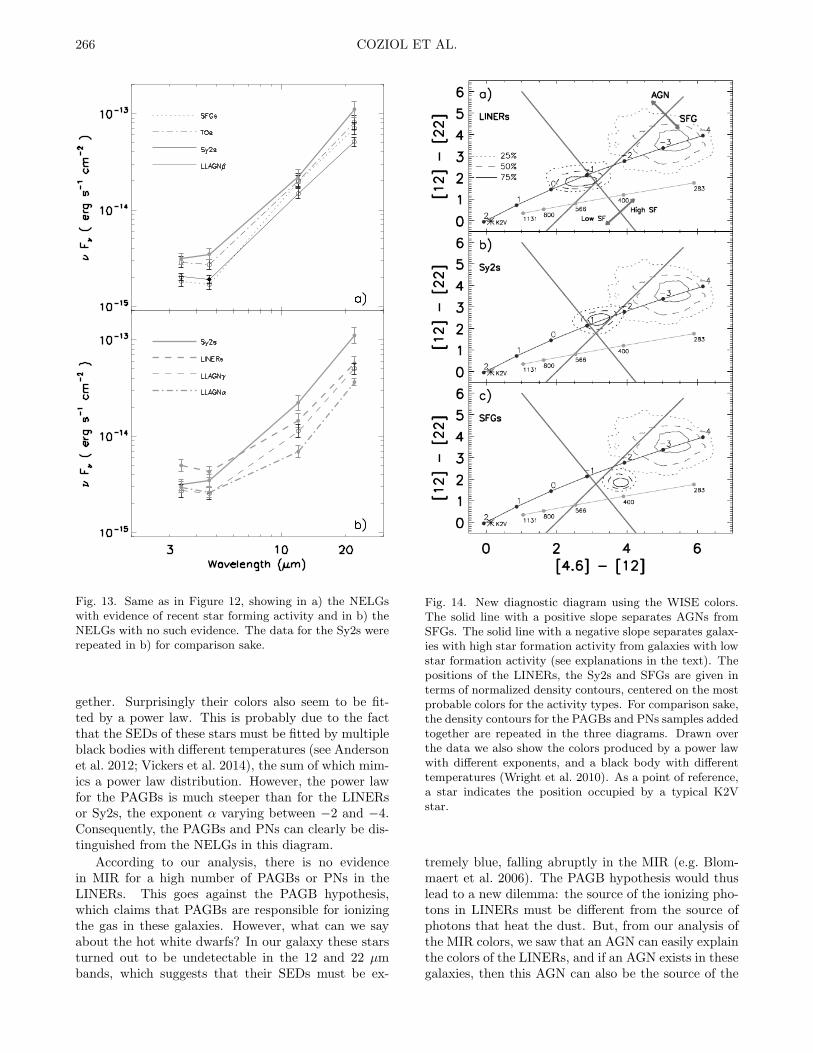
The difference in MIR colors between the stars andthe NELGs in our sample suggests that their continuatrace different types of SEDs. In Figure 12 we showthe mean MIR fluxes in each band as a function of thewavelength. We see that in both the PAGBs and PNsthe fluxes vary greatly as we go to higher wavelengths,suggesting that the SEDs of the PAGBs and PNs havesteep slopes in the MIR. This is consistent with blackbodies with high temperatures (see Figure 1 in Vickerset al. 2014). On the other hand, the fluxes show muchsmaller variations in the NELGs, suggesting that theirSEDs in the MIR are flatter than those of the stars.For the SFGs, this is consistent with black bodies thathave lower temperatures than those fitting the PAGBsand PNs (Anderson et al. 2012). For the other NELGs,however, still flatter SEDs are needed, like those typi-cally found in AGNs (e.g. Polletta et al. 2007; Yan etal. 2013).
The MIR data are consistent with a simple modelwhere the SEDs of the NELGs are formed by a mixtureof black bodies with a low temperature typical of dustheated by O and B stars in HII regions, and powerlaws due to AGNs, which have flatter MIR continuathan the SFGs. The relative importance of the twocontinuum components in NELGs is better observed inFigure 13. According to Torres-Papaqui et al. (2013)we have separated the NELGs in two groups: in a)we show the mean fluxes in the NELGs that presenta high level in recent star formation (the SFGs, TOsand Sy2s) and in b) we show the flux variations in theLINERs, where star formation is presently at a verylow level (the data for the Sy2s were included for com-parison sake). One can see that the the variation of fluxwith wavelength becomes larger as the level of star for-mation in the galaxies increases, i.e. the SED steepensas the level of star formation in the galaxies increases.Based on the flux variations the LLAGNβ are similarto galaxies in the high star formation group, while theLLAGNγ and LLAGNα are similar to galaxies in thelow star formation group. This is consistent with theclassification obtained with the WHAN diagram, whereit was found that the LLAGNs form a mixture of SFGsand AGNs. This result suggests that the continua varywith the amount of star formation, becoming flatter in

MIR STUDY OF LOW-LUMINOSITY AGNS 265
Fig. 11. Box-whisker plots comparing a) the morphologiesof the NELGs in our sample, and b) their Hα EWs. Theexplanations for the box-whisker plots and identification ofthe samples are as in Figure 9.
galaxies where the contribution of an AGN becomespredominant (Mateos et al. 2012; Donoso et al. 2012;Jarrett et al. 2013; Rosario et al. 2013).
It is easy to understand why a power law explainsthe trend for the colors to become bluer in the LINERsand LLAGNs. For example, consider a power lawLν = Cν−α with an exponent α = 0, which yieldsfluxes independent of the wavelength. Such contin-uum would produce comparable MIR fluxes, and, con-sequently, smaller differences in magnitudes, which isconsistent with the blue color trend (c.f. compare thecolors of the power laws and black bodies in Table 1of Wright et al. 2010). Therefore, we argue that dueto a decreasing level of star formation in the LLAGNsand the LINERs, the continua become flatter and the
Fig. 12. The mean MIR fluxes at the four different wave-lengths used by WISE. How one transforms the WISE mag-nitudes into fluxes is explained in Wright et al. (2010). Theerror bars for the stars are the errors on the means (Bev-ington & Robinson 2003). For clarity sake, the errors onthe mean for the galaxies are shown only in Figure 12.
MIR colors bluer, which we interpret as evidence thatthe power-law components due to the AGNs heatingthe dust in these galaxies become more apparent.
Based on the analysis described above, it shouldbe possible to separate the NELGs according to theirdominant continuum component. To verify this as-sumption, we present in Figure 14 the color-color dia-grams [4.6]-[12] vs. [12]-[22] for the LINERs, the Sy2sand SFGs. We have also traced over the data the es-timations made by Wright et al. (2010) of the colorsexpected in WISE for a power law with different ex-ponents, and a black body at different temperatures.In Figure 14 one can see that the LINERs and Sy2shave colors consistent with a power law, with an ex-ponent α varying between 0 and −1.5 in the LINERsand between −1 and −2 in the Sy2s. The SFGs on theother hand show colors that are intermediate betweenthose produced by a power law or a black body. Thevariation of the [4.6]-[12] color in the NELGs with dif-ferent activity types suggests that this color is sensitiveto the present level of star formation in these galaxies(for similar conclusions see Mateos et al. 2012; Rosarioet al. 2013).
In Figure 14 we have also included the color dis-tribution for the PAGBs and PNs samples added to-
266 COZIOL ET AL.
Fig. 13. Same as in Figure 12, showing in a) the NELGswith evidence of recent star forming activity and in b) theNELGs with no such evidence. The data for the Sy2s wererepeated in b) for comparison sake.
gether. Surprisingly their colors also seem to be fit-ted by a power law. This is probably due to the factthat the SEDs of these stars must be fitted by multipleblack bodies with different temperatures (see Andersonet al. 2012; Vickers et al. 2014), the sum of which mim-ics a power law distribution. However, the power lawfor the PAGBs is much steeper than for the LINERsor Sy2s, the exponent α varying between −2 and −4.Consequently, the PAGBs and PNs can clearly be dis-tinguished from the NELGs in this diagram.
According to our analysis, there is no evidencein MIR for a high number of PAGBs or PNs in theLINERs. This goes against the PAGB hypothesis,which claims that PAGBs are responsible for ionizingthe gas in these galaxies. However, what can we sayabout the hot white dwarfs? In our galaxy these starsturned out to be undetectable in the 12 and 22 µmbands, which suggests that their SEDs must be ex-
Fig. 14. New diagnostic diagram using the WISE colors.The solid line with a positive slope separates AGNs fromSFGs. The solid line with a negative slope separates galax-ies with high star formation activity from galaxies with lowstar formation activity (see explanations in the text). Thepositions of the LINERs, the Sy2s and SFGs are given interms of normalized density contours, centered on the mostprobable colors for the activity types. For comparison sake,the density contours for the PAGBs and PNs samples addedtogether are repeated in the three diagrams. Drawn overthe data we also show the colors produced by a power lawwith different exponents, and a black body with differenttemperatures (Wright et al. 2010). As a point of reference,a star indicates the position occupied by a typical K2Vstar.
tremely blue, falling abruptly in the MIR (e.g. Blom-maert et al. 2006). The PAGB hypothesis would thuslead to a new dilemma: the source of the ionizing pho-tons in LINERs must be different from the source ofphotons that heat the dust. But, from our analysis ofthe MIR colors, we saw that an AGN can easily explainthe colors of the LINERs, and if an AGN exists in thesegalaxies, then this AGN can also be the source of the

MIR STUDY OF LOW-LUMINOSITY AGNS 267
ionizing photons, which makes the PAGB hypothesisredundant.
Alternatively, one can suggest, without direct ob-servational evidence, that the hot white dwarfs some-how are also responsible for heating the dust in theLINERs. After all, some PAGBs and PNs in our anal-ysis do reproduce the MIR colors of some of the NELGsin our sample (note, however, that the colors are notspecific to one activity type) and one could propose toidentify the SEDs of these special cases with the typicalSEDS of hot white dwarfs in LINERs. However, thereare many problems with this hypothesis. For exam-ple, reproducing the flat SEDs required to explain theLINERs in our sample implies black bodies that havelower temperatures than those of O and B stars in theSFGs. But the huge amount of ionizing photons nec-essary to explain the ionized gas in a typical LLAGNconstitutes a strong constraint on the temperature ofthe stars, and the temperature cannot be lowered arbi-trarily without increasing significantly the number ofhot white dwarfs. Alternatively, one may assume verydifferent distributions for the gas and the dust, namelylarge dust free ionized regions bounded by huge cloudsof dust located at distances farther from the stars thanthe gas (the dust is not mixed homogeneously withthe gas). But the relatively strong emission observedin MIR constrains the quantity of dust required, andthe amount of dust cannot be increased arbitrarily ei-ther. Also, according to the current knowledge aboutthe SEDs of PAGBs and PNs in the MIR (e.g. Ander-son et al. 2012; Vickers et al. 2014) and according toour own analysis, it seems difficult to contrive a sim-ple scenario that would fit specifically the SEDs of theLLAGNs based on the SEDs of hot white dwarfs. Toexplain the MIR colors of the LINERs, therefore, thewhite dwarf hypothesis seems more complicated, andconsequenlty less credible than the AGN model.
4.2. Defining a new diagnostic diagram in MIR: the
AGN nature of LLAGNs
We can use the color-color diagram in Figure 14 as anew diagnostic diagram. The physical justification forthe two empirical separations shown in this diagram isthe following: the NELGs with different activity typescan be distinguished based on their dominant contin-uum component and based on their present level of starformation (Torres-Papaqui et al. 2013; Rosario et al.2013). Consequently, we have traced in Figure 14 a di-agonal (with a positive slope) that separates the SFGsfrom the AGNs, and another diagonal (with a negativeslope) that separates the AGNs with low star forma-tion activity (LINERs) from the AGNs with high starformation activity (Sy2s). Note that to define the dif-ferent activity zones we have used only the MIR fluxeswith S/N ≥ 3 (corresponding to quality flags, ph qual,equal to A or B, in all of the four WISE bands). The
Fig. 15. The MIR diagnostic diagram for a) the LLAGNα,b) the LLAGNγ, c) the LLAGNβ, and d) the TOs.
density contours suggest that one can only obtain aprobability of about 50% percent for the separation be-tween LINERs and Sy2s. However, according to thisdiagram the probability that a SFG could be mistakenas an AGN is smaller than 25%. In fact, the probabil-ity that a SFG could be mistaken as an AGN is zero,if one considers the different [NII]λ6584/Hα ratios ofthese galaxies (cf. Figure 1).
In Figure 15 we show the classification obtained forthe LLAGN candidates and the TOs using the newMIR diagnostic diagram. It can be seen in Figure 15athat the LLAGNα are similar to the LINERs. Thissuggests that they are AGNs with a low level of starformation activity. The LLAGNγ (Figure 15b), on theother hand, form a mixture of SFGs, Sy2s and LINERs,which again is consistent with our previous analysis. It
268 COZIOL ET AL.
is interesting to compare the LLAGNβ in Figure 15c,with the TOs in Figure 15d. The MIR colors of theTOs suggest they are intermediate between the SFGsand AGNs. This is consistent with the standard inter-pretation based on the BPT-VO diagram (Kewley etal. 2001, 2006). The LLAGNβ would thus be similarto the TOs, which are LLAGNs with a high level ofstar formation.
Considering the color sequence traced by theLLAGNs in Figure 15, we see that as the [4.6]-[12] colordecreases, the colors of the LLAGNs become similar tothose of the LINERs, i.e. there is a clear change ofcolors from those produced by black bodies in SFGs tothose consistent with power laws in AGNs. Because the[4.6]-[12] color is sensitive to the present level of starformation, we believe highly probable that as the starformation decreases in the LLAGNs, their MIR colorswill change for those of the LINERs (Lee et al. 2007;Wang & Wei 2008; Chen et al. 2009, 2010; Yuan et al.2010; Torres-Papaqui et al. 2012a; Zhang et al. 2013;Torres-Papaqui et al. 2013). Consequenlty, we con-clude that what distinguishes the different LLAGNs inour sample is their different levels of star formation.When the star formation activity is high, the LLAGNslook like TOs, and when the star formation is declin-ing they look like Sy2s or LINERs, which are all AGNs.Therefore, the PAGB hypothesis is also unnecessary inthe case of the LLAGNs.
In general, the results obtained using the new MIRdiagnostic diagram are consistent with those obtainedwith the BPT-VO diagram for the standard NELGsand the WHAN diagram for the LLAGNs. However,according to our analysis there are no more ambiguitiesas to the AGN nature of the LINERs, and consequentlyfor the other LLAGNs, since there are only two mainsources for heating the dust, namely massive stars andAGNs (Wright et al. 2010; Jarrett et al. 2011; Mateoset al. 2013; Assef et al. 2013). The MIR diagnosticdiagram also suggests that these two mechanisms arefrequently working at the same time (Ho, Filippenko,& Sargent 1997; Wu et al. 1998; Maoz 1999; Vila-Vilaro2000; Kewley et al. 2001; Carter et al. 2001; Chen &Zhang 2006; Gonzalez Delgado et al. 2008; Yuan etal. 2010; Carpineti et al. 2012). Indeed, what distin-guishes the LINERs, the Sy2s and SFGs and explainsthe distributions of the LLAGNs in the MIR diagnosticdiagram is their different levels of star formation (Leeet al. 2007; Wang & Wei 2008; Chen et al. 2009, 2010;Yuan et al. 2010; Torres-Papaqui et al. 2012a; Zhanget al. 2013; Torres-Papaqui et al. 2013).
Another advantage of this new MIR diagnostic dia-gram is that it should allow to classify different types ofgalaxies using the same criteria. This includes galaxiesthat cannot be classified using standard diagnostic di-agrams, like the LLAGNs, but also radio galaxies andbroad-line AGNs, like the Sy1s and the quasars.
5. SUMMARY AND CONCLUSIONS
For many authors in the field, LLAGNs do not ex-ist. They are retired galaxies, misidentified as AGNs,where the gas is ionized by PAGB stars. However, ac-cording to the PAGB hypothesis, of the order of 1011
hot white dwarfs would be required to produce theright amount of ionizing photons in a typical LLAGN.Such a high number of hot stars must leave a tracenot only in the optical but also in the infrared. In-deed, using MIR observations obtained with WISE wehave found that an important fraction of LLAGNs areemitting in infrared and that their colors are character-istically blue. However, by comparing the MIR colorsof the LLAGNs with those of the PAGBs and PNs inour galaxy, we have found that only a few of these starshave colors similar to the LLAGNs, the majority beingextremely red, which contradicts the PAGB hypothe-sis.
The main reason why the PAGBs colors differ fromthose of the LLAGNs is because they have differentSEDs. The SEDs of the stars in the MIR have steepslopes, while those of the LLAGNs are flatter. It isthe flatness of the SEDs that produces the blue col-ors. These differences can be explained by assuming ablack body with high temperatures in the PAGBs anda mixture in the LLAGNs of black bodies at low tem-perature, consistent with dust heated by O and B starsin HII regions, and different power laws due to AGNs,which have flatter MIR continua than the SFGs. Asthe level of star formation in the LLAGNs decreases,their continua become flatter, which we interpret asevidence that the power-law components due to theAGNs heating the dust in these galaxies become moreapparent.
Consistent with the AGN model, we have shownthat in a color-color diagram the LINERs and Sy2shave colors consistent with a power law with an ex-ponent α varying between 0 and −1.5 in the LINERsand between −1 and −2 in the Sy2s. Surprisingly wehave also found the colors of the PAGBs to follow apower law, but with a much steeper exponent than forthe AGNs. We have also shown that the variation ofthe [4.6]-[12] color allows to distinguish between theNELGs with different activity types, which suggeststhat this color is sensitive to the present level of starformation in these galaxies.
We conclude, therefore, that the MIR characteris-tics of the LINERs and of the other LLAGNs in oursample are consistent with the view that they are gen-uine AGNs (Heckman 1980; Osterbrock & Dahari 1983;Ho et al. 1993; Barth et al. 1998; Satyapal et al. 2004;Sarzi et al. 2005; Kewley et al. 2006; Filho et al. 2006;Chen & Zhang 2006; Gonzalez-Martın et al. 2006, 2009;Kauffmann 2009; Coziol et al. 2011; Torres-Papaqui etal. 2012a, 2013). If an AGN is responsible for heat-ing the dust in these galaxies, then this AGN may also

MIR STUDY OF LOW-LUMINOSITY AGNS 269
be responsible for ionizing the gas, which makes thePAGB hypothesis unnecessary.
The LLAGNs show a large variation in their levelof star formation, which explains their different char-acteristics. However, the MIR color sequence suggeststhat as the star formation decreases in these galaxies,they may all resemble the LINERs. Therefore, we alsoconclude that galaxies with a LINER spectral charac-teristic are akin to evolved or dying quasars (Heckman1980; Kauffmann 2009; Coziol et al. 1998; Richstone etal. 1998; Miller et al. 2003; Gavignaud et al. 2008).
Thanks to our analysis we have found a new diag-nostic diagram in the MIR that confirms the classifica-tion obtained using the BPT-VO diagram by eliminat-ing the ambiguity as to the AGN nature of the LINERs.Another important advantage of this new diagnostic di-agram is that it allows to determine the nature of theactivity in any type of galaxies using the same criteria.This includes galaxies that cannot be classified usingstandard diagnostic diagrams, like the LLAGNs andthe many radio galaxies, as well as broad-line AGNslike the Sy1s and the quasars. This diagnostic diagramrepresents a powerful new addition to the panoply oftools already in use to study active galaxies.
We thank an anonymous referee for making com-ments and suggestions that helped us to improve thequality of our study and its presentation. J.P. T.-P. acknowledges PROMEP for grant 103.5-10-4684,and DAIP for grant DAIP-Ugto (0432/14). Thisresearch has made use of the VizieR catalogue ac-cess tool, CDS, Strasbourg, France: (http://vizier.u-strasbg.fr/). This publication made use of dataproducts from the Wide-field Infrared Survey Explorer(WISE), which is a joint project of the University ofCalifornia, Los Angeles, and the Jet Propulsion Lab-oratory/California Institute of Technology, funded bythe National Aeronautics and Space Administration.The funding for Sloan Digital Sky Survey (SDSS) hasbeen provided by the Alfred P. Sloan Foundation, theParticipating Institutions, the National Science Foun-dation, and the U.S. Department of Energy Office ofScience. The full acknowledgement can be found here:http://www.sdss3.org/.
REFERENCES
Abazajian, K. N. et al. 2009, ApJS, 182, 543Alonso-Herrero, A. et al. 2006, ApJ, 640, 167Anderson, L. D., Zavagno, A., Barlow, M. J., Garcıa-Lario,
P., & Noriega-Crespo, A. 2012, A&A, 537, A1Assef, R. J. et al. 2013, ApJ, 772, 26Baldwin, J. A., Phillips, M. M., & Terlevich, R. 1981, PASP,
93, 5Barth, A. J., Ho, L. C., Filippenko, A. V., & Sargent,
W. L. W. 1998, ApJ, 496, 133Bevington, P. R., & Robinson, D. K. 2003, Data reduction
and error analysis for the physical sciences, McGraw-Hill
Bianchi, L., et al. 2011, MNRAS, 411, 2770Binette, L., Magris, C. G., Stasinska, G., & Bruzual, A. G.
1994, A&A, 292, 13Brinchmann, J., Charlot, S., White, S. D. M., et al. 2004,
MNRAS, 351, 1151Blommaert, J. A. D. L., Groenewegen, M. A. T., Okumura,
K., et al. 2006, A&A, 460, 555Carter, B. J., Fabricant, D. G., Geller, M. J., Kurtz, M. J.,
& McLean, B. 2001, ApJ, 559, 606Carpineti, A., Kaviraj, S., Darg, D., et al. 2012, MNRAS,
420, 2139Chen, P. S., & Zhang, P. 2006, AJ, 131, 1942Chen, X. Y., Liang, Y. C., Hammer, F., Zhao, Y. H., &
Zhong, G. H. 2009, A&A, 495, 457Chen, X. Y., Liang, Y. C., Hammer, F., et al. 2010, A&A,
515, A101Cid Fernandes, R., Mateus, A., Sodre, L., Stasinska, G. &
Gomes, J. M. 2005, MNRAS, 358, 363Cid Fernandes, R., et al. 2010, MNRAS, 403, 1036Cid Fernandes, R., Stasinska, G., Mateus, A., & Vale Asari,
N. A. 2011, MNRAS, 413, 1687Coziol, R. 1996, A&A, 309, 345Coziol, R., Barth, C. S., & Demers, S. 1995, MNRAS, 276,
1245Coziol, R., Doyon, R. & Demers, S. 2001, MNRAS, 325,
1081Coziol, R., Ribeiro, A. L. B., de Carvalho, R. R., &
Capelato, H. V. 1998, ApJ, 493, 563Coziol, R., Torres-Papaqui, J. P., Plauchu-Frayn, I., Islas-
Islas, J. M., Ortega-Minakata, R. A., Neri-Larios, D. M.,& Andernach, H. 2011, RMxAA, 47, 361
Davis, C. J., Smith, M. D., Gledhill, T. M. & Varricatt, W.P. 2005, MNRAS, 360, 104
Deutsch, L.K., & Willner, S. P., 1986, ApJ, 306, L11Donoso, E., Yan, L., Tsai, C., et al. 2012, ApJ, 748, 80Eisenstein, D. J., et al. 2006, ApJS, 167, 40Eracleous, M., Hwang, J. A., & Flohic, H. M. L. G. 2010,
ApJ, 711, 796Filho, M. E., Barthel, P. D., & Ho, L. C. 2006, A&A, 451,
71Gavignaud, I., et al. 2008, A&A, 492, 637Gonzalez-Martın, O., Masegosa, J., Marquez, I., Guerrero,
M. A., & Dultzin-Hacyan, D. 2006, A&A, 460, 45Gonzalez-Martın, O., Masegosa, J., Marquez, I., Guainazzi,
M., & Jimenez-Bailon, E. 2009, A&A, 506, 1107Gonzalez Delgado, R. M., Perez, E., Cid Fernandes, R., &
Schmitt, H. 2008, AJ, 135, 747Heckman, T. M. 1980, A&A, 87, 152Herberich, E., Sikorski, J., & Hothorn, T. 2010, PLoS ONE
5(3): e9788.doi:10.1371/journal.pone.0009788Ho, L. C., Filippenko, A. V., & Sargent, W. L. W. 1993,
ApJ, 417, 63Ho, L. C., Filippenko, A. V., & Sargent, W.L.W. 1997,
ApJS, 112, 315Hothorn, T., Bretz, F., & Westfall, P. 2008, Biom J, 50, 346Jarrett, T. H., et al. 2011, ApJ, 735, 112Jarrett, T. H., Masci, F., Tsai, C. W., et al. 2013, AJ, 145,
6Kauffmann, G., et al. 2003, MNRAS, 346, 105Kauffmann, G. 2009, A&A, 500, 201Kennicutt, R.C., Jr, 1992a, ApJS, 79, 255Kennicutt, R.C., Jr. 1992b, ApJ, 388, 310
270 COZIOL ET AL.
Kennicutt, R. C., Jr., Tamblyn, P., & Congdon, C. E. 1994,ApJ, 435, 22
Kewley, L. J., Dopita, M. A., Sutherland, R. S., Heisler, C.A., & Trevena, J. 2001, ApJ, 556, 121
Kewley, L.J., Groves, B., Kauffmann, G., & Heckman, T.,2006, MNRAS, 372, 961
Kitsikis, A. 2007, Ph. D. Thesis, University Munich, Ger-many
Kleinman, S. J., et al. 2013, ApJS, 204, 5
Kwok, S. 2000, The origin and evolution of planetary neb-ulae (Cambridge University Press)
Lee, J. H., Lee, M. G., Kim, T., et al. 2007, ApJL, 663, L69Madau, P., Pozzetti, L., & Dickinson, M. 1998, ApJ, 498,
106Maoz, D. 1999, Adv. Space Res., 23, 855Martınez, M.A., del Olmo, A., Coziol, R., & Focardi, P.
2008, ApJ, 678, L9Martınez, M.A., del Olmo, A., Coziol, R., & Perea, J. 2010,
AJ, 139, 1199Mateos S., et al. 2012, MNRAS, 426, 3271
Mateos, S., et al. 2013, MNRAS, 434, 941
McCook, G. P. & Sion, E. M. 1999, ApJS, 121, 1Miller, C. J., Nichol, R. C., Gomez, P. L., Hopkins, A. M.,
& Bernardi, M. 2003, ApJ, 597, 142Ochsenbein, F., Bauer, P., & Marcout, J. 2000, A&AS, 143,
23Osterbrock, D. E., & Dahari, O. 1983, ApJ, 273, 478Osterbrock, D. E. 1989, Astrophysics of Gaseous Nebulae
and Active Galactic Nuclei, University Science Books.Osterbrock, D. E., & Ferland, G. J. 2006, Astrophysics of
Gaseous Nebulae and Active Galactic Nuclei, SecondEdition, University Science Books
Pastoriza, M., Ferrari, F., Macchetto, F., & Caon, N. 2000,ASPC, 221, 95
Phillips, M. M., Jenkins, C. R., Dopita, M. A., Sadler E.M., & Binette, L. 1986, AJ, 91, 1062
Polletta, M., Tajer, M., Maraschi, L., et al. 2007, ApJ, 663,81
Pottasch, S. R. 1965, Vis. Astr., 6, 149Richstone, D., et al., 1998, Nature, 395, 14Rola, C., & Pelat, D. 1994, A&A, 287, 676
H. Andernach, R. Coziol, J. M. Islas-Islas, R. A. Ortega-Minakata, and J. P. Torres-Papaqui: Departamento deAstronomıa, Universidad de Guanajuato, Apdo. Postal 144, 36000, Guanajuato, Gto, Mexico (heinz, rcoziol,jmislas, rene, [email protected]).
D. M. Neri-Larios: School of Physics, The University of Melbourne, Parkville, Vic. 3010, Australia([email protected]).
I. Plauchu-Frayn: Instituto de Astronomıa, Universidad Nacional Autonoma de Mexico, Campus Ensenada, Apdo.Postal 877, Ensenada, B.C., Mexico ([email protected]).
Rosario, D. J., Santini, P., Lutz, D., et al. 2013, ApJ, 771,63
Rose, J. A. 1985, AJ, 90, 1927Sarzi, M., Rix, H.-W., Shields, J. C., et al. 2005, ApJ, 628,
169Satyapal, S., Sambruna, R. M., & Dudik, R. P. 2004, A&A,
414, 825Singh, R., et al. 2013, A&A, 558, 43Stasinska, G., Vale Asari, N., Cid Fernandes, R., Gomes,
J. M., Schlickmann, M., Mateus, A., Schoenell, W., &Sodre, L., Jr. 2008, MNRAS, 391, L29
Stern, D., et al. 2012, ApJ, 753, 30Suarez, O., et al. 2006, A&A, 456, 173Taniguchi, Y., Shioya, Y., & Murayama, T. 2000, AJ, 120,
1265Torres-Papaqui, J. P., Coziol, R., Andernach, H., Ortega-
Minakata, R. A., Neri-Larios, D. M. & Plauchu-Frayn,I. 2012a, RMxAA, 48, 275
Torres-Papaqui, J. P., Coziol, R., Ortega-Minakata R. A.,& Neri-Larios, D. M. 2012b, ApJ, 754, 144
Torres-Papaqui, J. P., Coziol, R., Plauchu-Frayn, I., Ander-nach, H. & Ortega-Minakata, R. A., 2013, RMxAA, 49,311
Veilleux, S., & Osterbrock, D.E., 1987, ApJS, 63, 295Vickers, S. B., Frew, D. J., Parker, O. A., & Bojicic, I. S.
2014, arXiv:1403.7230Vila-Vilaro, B. 2000, PASJ, 52, 305Volk, K. M., & Kwok, S. 1989, ApJ, 342, 345Wang, J., & Wei, J. Y. 2008, ApJ, 679, 86.Weidmann, W. A., & Gamen, R. 2011, A&A, 526, 6Wright, E. L., et al. 2010, AJ, 140, 1868Wu, H., Zou, Z. L., Xia, X. Y., & Deng, Z. G. 1998, A&AS,
132, 181Yan, L., Donoso, E., Tsai, C.-W., et al. 2013, AJ, 145, 55York, D. G., Adelman, J., Anderson, J. E., Jr., et al. 2000,
AJ, 120, 1579Yuan, T.-T., Kewley, L. J., & Sanders, D. B. 2010, ApJ,
709, 884Zhang, X.G., Dultzin-Hacyan, D., & Wang, T. G. 2007,
MNRAS, 374, 691Zhang, Z. T., Liang, Y. C., & Hammer, F. 2013, MNRAS,
430, 2605