1 Bond market development: The case of Hong Kong Alfred Wong Hong Kong Monetary Authority.
Upload
hugo-gordonCategory
view
218download
1
A Microfounded Model of Chinese Capital Account
LiberalisationDong He
Hong Kong Monetary Authority and Hong Kong Institute for Monetary Research
Paul Luk Hong Kong Institute for Monetary Research
1

Introduction
• China has been growing rapidly for the last 30 years, but it’s involvement in the international financial market is small due to limited capital account convertibility.
• The Chinese government plans to speed up the liberalisation of the capital account.
• Capital account liberalisation is closely related to the process of the interanationalisation of the renminbi.
• China’s international balance sheet has a ‘long debt, short equity’ asymmetry (Ma and Zhou, 2009). In contrast, the US’s balance sheet is China’s mirror image.– Gourinchas and Rey (2007) describe the US as the ‘world
venture capitalist’.2

Introduction
3

Three key questions
• What is the relationship between the limited capital account convertibility in China and its international balance sheet?
• How will the asset portfolio composition in China change after capital account liberalisation?– What are the consequences of the liberalisation to China’s gross
international investment position?
– What are the implications to renminbi internationalisation?
• To what extent will the economic growth and the ongoing economic reform in China affect China’s international balance sheet?
• We answer these questions with a general equilibrium model with endogenous portfolio choice.
4

Key findings
1. After capital account liberalisation in China, Chinese households will invest a substantial amount in the US firms. US will likewise invest more in Chinese firms.
2. China’s desired US bond holding will move from a long position to a short position.
3. US will hold a negative position in Chinese bonds.
4. As China grows and rebalances its economy with a higher share of labour income, Chinese holding of US equity will rise.
5

Related literature
• International portfolio choice in gen. eq. models:– Devereux and Sutherland (2008), Engel and Matsumoto (2009),
Coeurdacier and Gourinchas (2010), Coeurdacier, Kollmann and Martin (2010) etc.
– Devereux and Sutherland (2009): asymmetric economies with different asset market configurations.
• Models with imperfect substitutability of assets:– Blanchard Giavazzi and Sa (2005) etc.
• Empirical literature on Chinese capital account liberalisation:– Ma and Zhou (2009) and He et al. (2012).
6

7
The model
• A standard two country set-up similar to Coeurdacier, Kollmann and Martin (2010).
• Households and firms in each country.• Endogenous capital accumulation.• Equity and bond in each country, so 4 assets in total.• Two asset market configurations: before/ after Chinese
capital account liberalisation.

Consumption and investment
• Each country {A,B} produces one good, which is used for consumption and investment in both countries, with home bias, a.
• Demand for each country’s good is
• And
• Similarly for investment IAt, IBt , also with home bias a. 8

Household budget constraint
• Country i households have the following budget constraint:
• There are 4 assets in the economy, namely equity (S) and bond (b) of each of the two countries. Si
jt denotes country i’s holding of country j’s equity. Similar for bonds.
• pSit denotes country i’s equity price, and so on.
• Country i’s equity pays dividend dit.
• Country i’s bond pays one unit of country i’s goods pit.
9

Asset market configuration
• Asset market configuration:– Before Chinese capital account liberalisation, assume US equity
and Chinese bond are not tradable internationally. Think of US as country A and China as country B. Then .
• Only Chinese equity and US bond are tradable.
– After Chinese capital account liberalisation, all four assets are tradable.
10

Household optimisation
• Households have the following utility:
• The optimality conditions are:
Before liberalisation After liberalisation 11
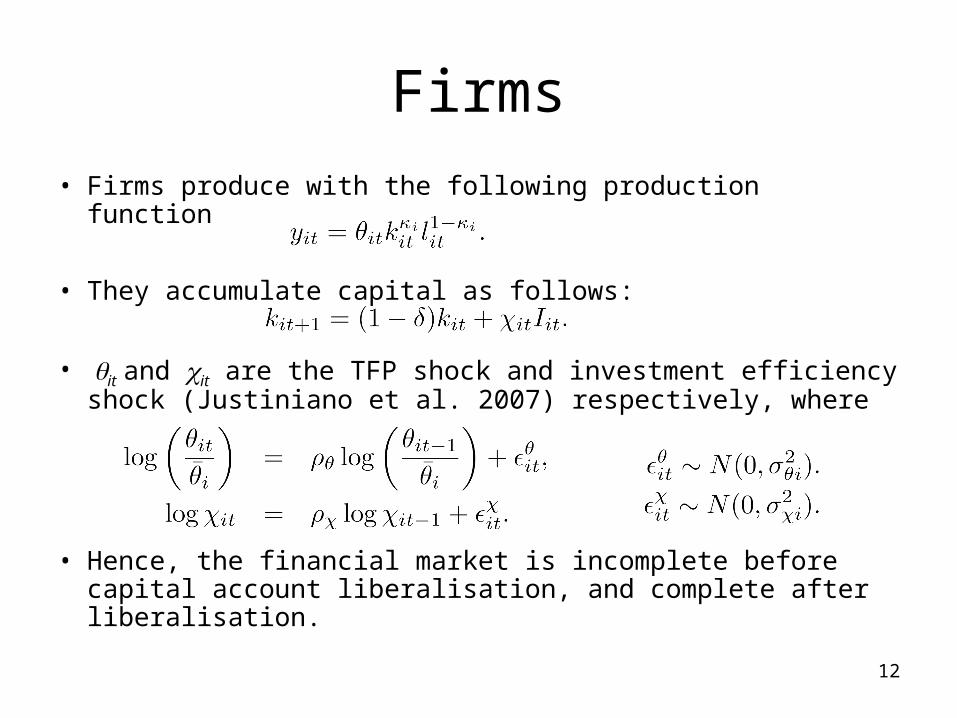
Firms
• Firms produce with the following production function
• They accumulate capital as follows:
• it and it are the TFP shock and investment efficiency shock (Justiniano et al. 2007) respectively, where
• Hence, the financial market is incomplete before capital account liberalisation, and complete after liberalisation.
12
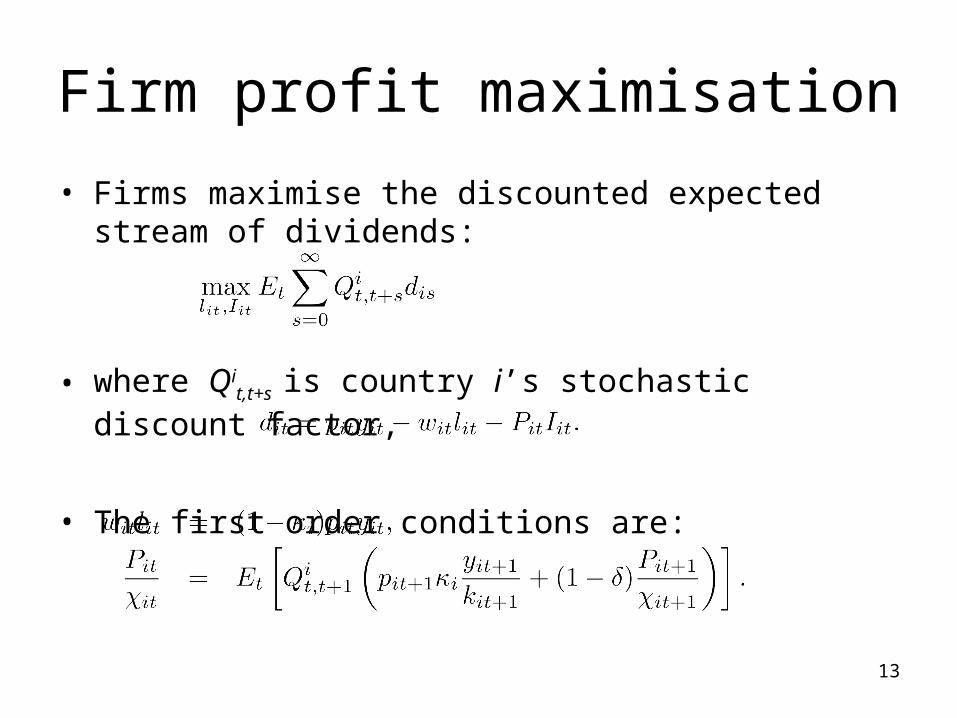
Firm profit maximisation
• Firms maximise the discounted expected stream of dividends:
• where Qit,t+s is country i’s stochastic discount factor,
• The first order conditions are:
13

Market clearing conditions
• Goods market clearing conditions are
• Asset market clearing conditions are
and
14
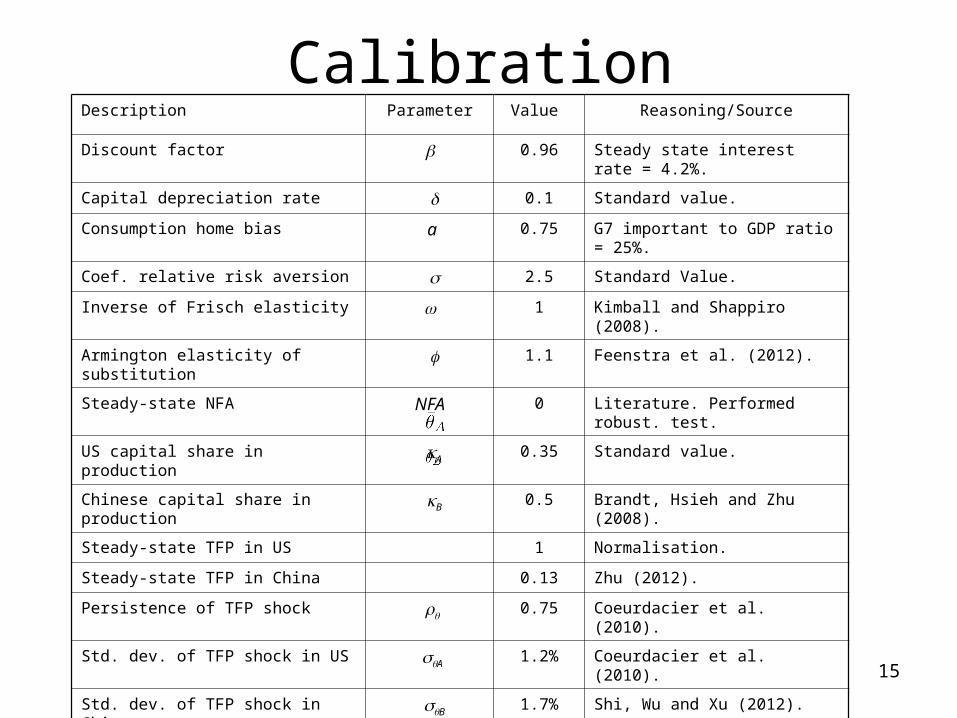
Calibration
15
Description Parameter Value Reasoning/Source
Discount factor 0.96 Steady state interest rate = 4.2%.
Capital depreciation rate 0.1 Standard value.
Consumption home bias a 0.75 G7 important to GDP ratio = 25%.
Coef. relative risk aversion 2.5 Standard Value.
Inverse of Frisch elasticity 1 Kimball and Shappiro (2008).
Armington elasticity of substitution 1.1 Feenstra et al. (2012).
Steady-state NFA NFA 0 Literature. Performed robust. test.
US capital share in production A0.35 Standard value.
Chinese capital share in production B0.5 Brandt, Hsieh and Zhu (2008).
Steady-state TFP in US 1 Normalisation.
Steady-state TFP in China 0.13 Zhu (2012).
Persistence of TFP shock 0.75 Coeurdacier et al. (2010).
Std. dev. of TFP shock in US A1.2% Coeurdacier et al. (2010).
Std. dev. of TFP shock in China B1.7% Shi, Wu and Xu (2012).
Corr. of TFP shocks Corr(A ,
B) 0.45 Coeurdacier et al. (2010).
Persistence of investment shock 0.79 Coeurdacier et al. (2010).
Std. dev. of investment shock in US A1.73% Coeurdacier et al. (2010).
Std. dev. of investment shock in China B1.73% Coeurdacier et al. (2010).
Corr. of investment shocks Corr(A ,
B) 0.19 Coeurdacier et al. (2010).

Model solution
• We are interested in the optimal portfolio allocations in the non-stochastic steady state under both asset market configuration. To compute these, we use a two-step procedure due to Devereux and Sutherland (2011).
• First step: We approximate the non-portfolio system up to the first order around the non-stochastic steady state, temporary treating the excess portfolio return as an exogenous i.i.d process.
• Second step: We make use of the second-order approximated optimal portfolio conditions to compute the portfolio allocations.
16
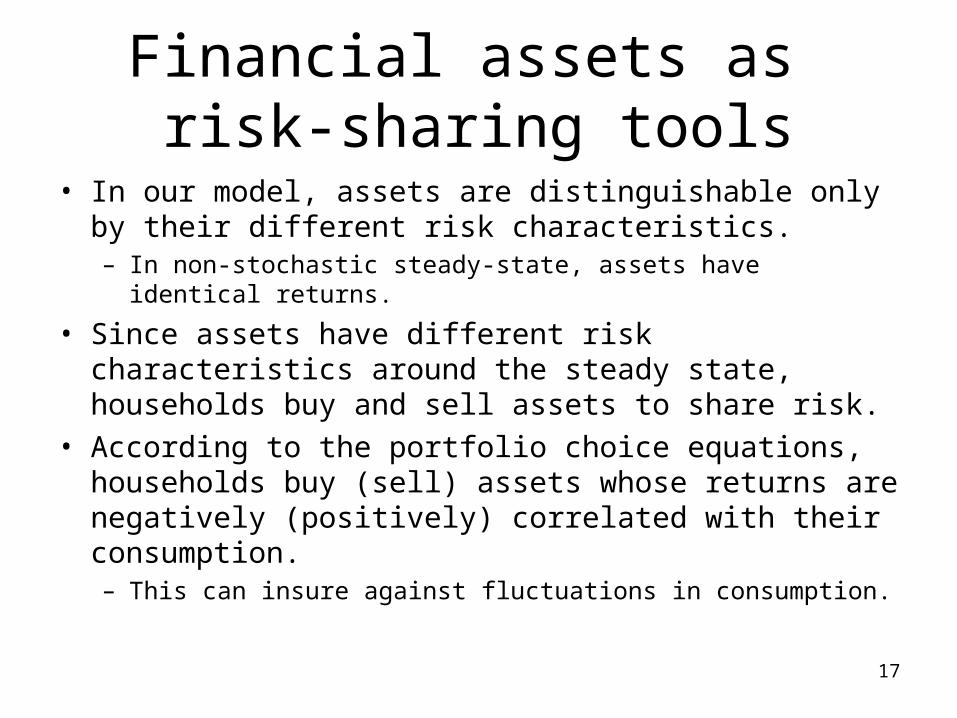
Financial assets as risk-sharing tools
• In our model, assets are distinguishable only by their different risk characteristics.– In non-stochastic steady-state, assets have identical returns.
• Since assets have different risk characteristics around the steady state, households buy and sell assets to share risk.
• According to the portfolio choice equations, households buy (sell) assets whose returns are negatively (positively) correlated with their consumption.– This can insure against fluctuations in consumption.
17

Steady-state portfolio before capital account liberalisation
Chinese relative consumption
(zero portfolio)
Chinese relative investment
(zero portfolio)
Chinese real exchange rate
Payoff of Chinese equity v.s. US bond
Chinese productivity
shock (Bt ↑)
↑ ↑ Depreciates ↓
US productivity
shock (At ↑) ↓ ↓ Appreciates ↑
Chinese investment efficiency shock
(Bt ↑)
↓ ↑ Appreciates ↓
US investment efficiency shock
(At ↑)
↑ ↓ Depreciates ↑

Steady-state portfolio before capital account liberalisation
• Only US bond and Chinese equity are tradable.
• Suppose US productivity (At) receives a positive shock
– Relative consumption in US rises.– US real exchange rate depreciates.– Due to the real exchange rate effect Chinese equity pays a
higher return than US bonds.
• Suppose instead Chinese productivity (Bt) rises
– Relative consumption in China rises.– Chinese firms increases investment and reduce relative dividend
payout.– Chinese real exchange rate depreciates– Relative return of US bond rises.
19
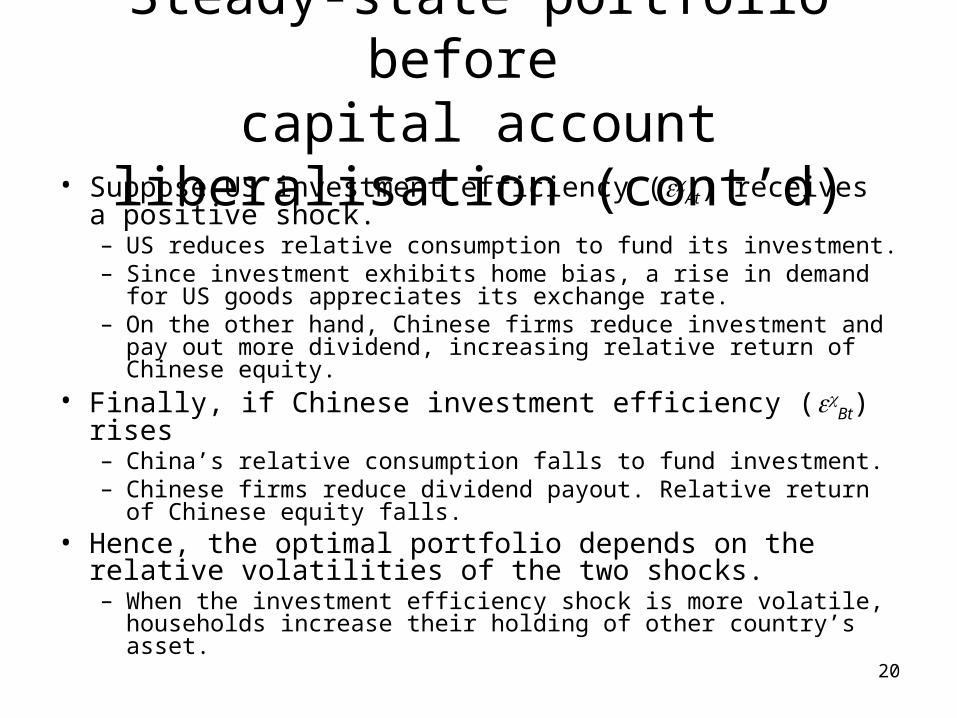
Steady-state portfolio before capital account liberalisation
(cont’d)• Suppose US investment efficiency (
At) receives a positive shock.– US reduces relative consumption to fund its investment.– Since investment exhibits home bias, a rise in demand for US
goods appreciates its exchange rate.– On the other hand, Chinese firms reduce investment and pay out
more dividend, increasing relative return of Chinese equity.• Finally, if Chinese investment efficiency (
Bt) rises – China’s relative consumption falls to fund investment.– Chinese firms reduce dividend payout. Relative return of
Chinese equity falls. • Hence, the optimal portfolio depends on the relative
volatilities of the two shocks. – When the investment efficiency shock is more volatile,
households increase their holding of other country’s asset.
20

Numerical results
21

Steady-state portfolio after capital account liberalisation
Relative Chinese consumption
Relative Chinese investment
Chinese real exchange rate
Chinese relative wage income
Relative dividend for Chinese equity
Relative coupon for Chinese bond
Chinese
prod.
(Bt ↑)
↑ ↑ Dep. ↑ ↓ ↓
US
prod.
(At ↑)
↓ ↓ App. ↓ ↑ ↑
Chinese
invest.
(Bt ↑)
↓ ↑ App. ↑ ↓ ↑
US
invest.
(At ↑)
↑ ↓ Dep. ↓ ↑ ↓

Steady-state portfolio after capital account liberalisation
• Analysis follows closely from Coeurdacier, Kollmmann and martin (2010) and Coeurdacier and Rey (2011).
• In a complete market, perfect risk-sharing can be achieved.
• Real exchange rate risks can be completely hedged by trading bonds. Relative bond return is just the terms of trade.– The job of hedging non-tradable income risks are left to the
trading of equities.
23

Steady-state portfolio after capital account liberalisation
• Suppose a combination of shocks raises relative investment in US but keeps the real exchange rate unchanged.– Due to home bias in investment goods, US output rises.– (Non-tradable) labour income of US households rises.– But relative dividend payout in US falls to fund investment. – Relative wage income and relative dividend are negatively
correlated, conditional on the real exchange rate, leading to equity home bias.
24

Steady-state portfolio after capital account liberalisation
• Consider the bond holding if there is no equity. Households in each country will hold domestic bonds:– Relative consumption and the real exchange rate are negatively
correlated.
• But through holding equity with home bias, households have already hedged against some real exchange rate risk.– Under our calibration, equity holding only partly offsets the need
to hedge against real exchange rate risk. As a result, households in each country will be holding domestic bonds and selling foreign bonds short.
25

Numerical results
26

Characteristics of the steady-state portfolios
• The portfolio exhibits equity home bias all the time. – The equity home bias falls after capital account liberalisation,
consistent with empirical evidence (eg. Sorensen et al. 2007).
• For China, both outward FDI and portfolio investment, as well as the inward counterparts rise.– Result echoes with the empirical prediction in He et al. (2012).
• Gross financial position in China will rise substantially. – Prediction of a rise in GIIP is consistent with Ma and Zhou
(2009).
27

Characteristics of the steady-state portfolios
• Chinese holding of US bonds reverse from a long position to a short position.– After liberalisation, Chinese households prefer US equity to US
bond, because US equity has more desirable risk-sharing properties than bonds.
– Chinese households short US bonds to offset excess real exchange rate exposure.
• US households in return will hold a negative position in Chinese bonds, after capital account liberalisation.– One possibility is that non-Chinese residents issue renminbi-
denominated bonds offshore.– Renminbi internationalisation.
28

Comparative statics:a rebalance in Chinese production
• Experiment 1: China rebalances its production with a higher share of labour income.
• Brandt et al. (2008) estimate that the capital share in production in China, B, is about 0.5, much larger than the G7 average of ~ 0.35. – With a shift towards service sector, the labour share in
production is expected to rise.
29
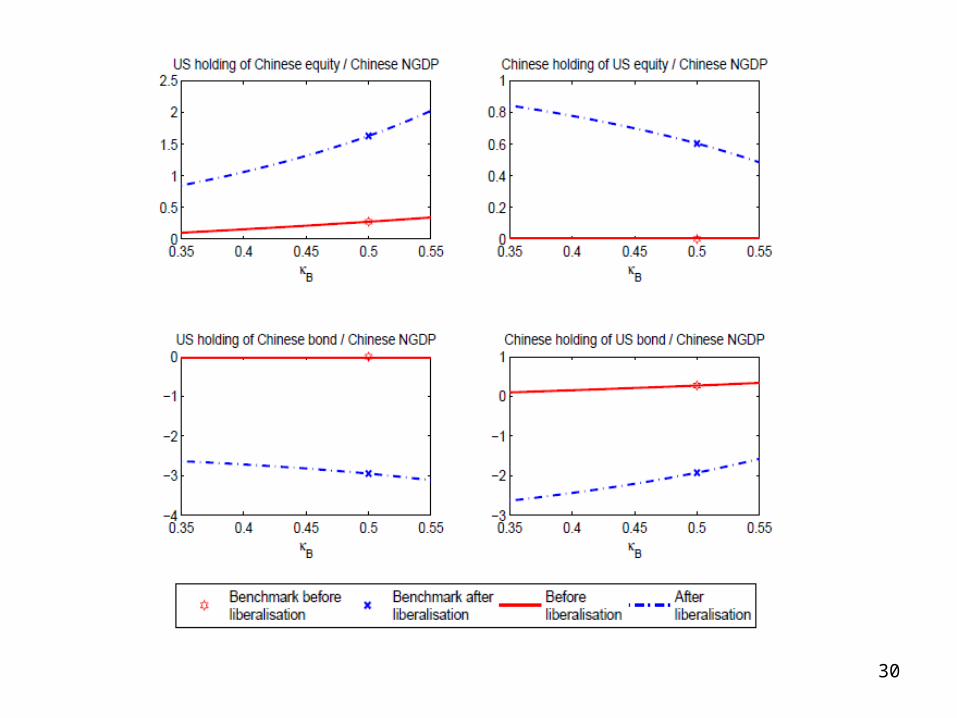
30

Comparative statics:A rise in Chinese productivity
• Experiment 2: China experiences a sustained rise in relative productivity.
• Zhu (2012) estimates that TFP in China is 13% of that of the US.– Through institutional reforms and policy changes that reduce
distortions and better align economic incentives, China’s TFP may catch up gradually.
31

32
Conclusion
• Our model shows that after Chinese capital account liberalisation:– Portfolio equity and FDI flows, both into and out of China, would
increase significantly.– China as a whole would reverse its US bond holding, from a long
position currently to a short position.– The US as a whole would take a short position in Chinese
bonds.– Continued economic growth in China and a reduction in capital
share in production could also rebalance China’s international balance sheet.
• Some caveats.
33