A METHODOLOGY TO REVIEW PUBLIC HEALTH INTERVENTIONS ... · A METHODOLOGY TO REVIEW PUBLIC HEALTH...
104
203.1 ~ity 85ME ~~~rnationaI Nutrition ~ A METHODOLOGY TO REVIEW PUBLIC HEALTH INTERVENTIONS: RESULTS FROM NUTRITION SUPPLEMENTATION AND WATER AND SANITATION PROJECTS by Steven A. Esrey, Jean-Pierre Habicht and William P. Butz 1. Measurement of Health and Nutrition Effects of Large-Scale Nutrition Intervention Projects by Jean-Pierre Habicht and William P. Butz 2. he Impact of Improved Water Supplies and Excreta Disposal Facilities on Diarrheal Morbidity, Growth and Mortality Among Children by Steven A. Esrey and Jean-Pierre Habicht Cornell International Nutrition Monograph Series. Number 15 (1985) Division of Nutritional Sciences NY.S. College of Human Ecology - N.Y~S. College of Agriculture and Life Sciences Statutory Colleges of the State University atCornellUniversity 203.1—3900 Ithaca, NY 14853 ~ -~ ~- ,~ ~-~-- — -~ 4 .~ —~ ~ ~ ~- ~
Transcript of A METHODOLOGY TO REVIEW PUBLIC HEALTH INTERVENTIONS ... · A METHODOLOGY TO REVIEW PUBLIC HEALTH...
203.1 ~ity85ME
~~~rnationaINutrition
~
A METHODOLOGY TO REVIEW PUBLICHEALTH INTERVENTIONS: RESULTS FROMNUTRITION SUPPLEMENTATION AND WATERAND SANITATION PROJECTS
by Steven A. Esrey, Jean-Pierre Habicht and
William P. Butz
1. Measurement of Health and Nutrition Effects ofLarge-Scale Nutrition Intervention Projects
by Jean-Pierre Habicht and William P. Butz
2. he Impact of Improved Water Supplies and ExcretaDisposal Facilities on Diarrheal Morbidity, Growth andMortality Among Children
by Steven A. Esrey and Jean-Pierre Habicht
Cornell International NutritionMonograph Series.Number 15 (1985)
Division of Nutritional SciencesNY.S. College of Human Ecology -
N.Y~S.College of Agriculture and Life SciencesStatutory Colleges of the State UniversityatCornellUniversity 203.1—3900Ithaca, NY 14853 ~ -~ ~-
,~ ~-~--— -~ 4 .~ —~ ~ ~ ~- ~

Cornell International Nutrition Monograph Series
1 (1974) Priorities in Dealing with Nutrition Problems in Indonesia, by Soekirman
2 (1975) The Promotion of Bottle Feeding by Multinational Corporations: How Advertisingand the Health Professions Have Contributed, by Ted Greiner
3 (1975) Using the Method of Paulo Freire in Nutrition Education: An Exi~erimental Planfor Community Action in Northeast Brazil, by Therese Drummond
4 (1977) Regulation and Education: Strategies for Solving the Bottle Feeding Problem,by Ted Greiner
5 (1977) Nutrition Planning and Policy for African Countries, Summary RE~port of a SeminarHeld in Nairobi, Kenya, June 2—19, 1976, Edited by Michael C. L.atham andSidney B. Westley
6 (1979) The Economic Value of Breastfeeding (with results from research conducted in
Ghana and the Ivory Coast), by Ted Greiner, Stina Almroth and Michael C. Latham
7 (1980) Nutritional Problems and Policy in Tanzania, by Olyvia Mgaza
8 (1981) Nutrition in Policy Planning for the Rural Sector, by Patricia M. O’Brien Place
9 (1981) The Impact of Socioeconomic Development and Ecological Change Ofl Health andNutrition in Latin America, by Giorgio R. Solimano and Georganne Chapin
10 (1982) The Decline of the Breast: An Examination of Its Imapct on Fertility and Health,and Its Relation to Socioeconomic Status, Edited by Michael C. Latham (ThreePapers: I. The Relationship of Breastfeeding to Human Fertilit~’, by Michael C.Latham; II. Appropriate Strategies to Improve Infant and Young Child Feeding, bya Cornell Working Group, III. Infant Feeding Options for Bangkäk ProfessionalWomen, by Penny Van Esterik)
11 (1982) The Decline in Breastfeeding: An Analysis of the Role of the Nestle Corporationfrom Two Perspectives, by Carolyn E. Campbell
12 (1983) A Comparison of Growth Standards: Similarities Between NCHS, Harvard, Denver andPrivileged African Children and Differences with Kenyan Rural Children, by LaniS. Stephenson, Michael C. Latham and Ad Jansen
13 (1984) The Energy Trap: Work, Nutrition and Child Malnutrition in Northern Nigeria, byRichard Longhurst
14 (1985) Determinants of Young Child Feeding and Their Implications for Nutritional Sur-veillance: I. Child Feeding Practices: Knowledge, Research Needs and PolicyImplications, by R. Martorell et al.; II. Intra-Family Food Distribution: ItsRelevance for Maternal and Child Nutrition, by P. Van Esterik
Copies of the Monographs may be obtained from: Dr. Michael C. Latham, Division of Nutri-
tional Sciences, Savage Hall, Cornell University, Ithaca, New York 14853, U.S.A.
Price: U.S.$3.OO including postage surface mail. Make check payable to Cornell University.
Cornell UniversityProgram in International Nutrition
A METHODOLOGYTO REVIEW PUBLIC HEALTH INTERVENTIONS: RESULTS FROMNUTRITION SUPPLEMENTATIONAND WATERAND .SANITATION PROJECTS
by Steven A. Esrey, Jean-Pierre Habicht and William P. Butz
1. Measurement of Health and Nutrition Effects
Nutrition Intervention Projects
by Jean-Pierre Habicht and William P. Butz
of Large-Scale
2. The Impact of Improved Water Supplies and Excreta DisposalFacilities on Diarrheal Morbidity, Growth and Mortality AmongChildren
by Steven A. Esrey and Jean-Pierre Habicht
Dr. Michael C. Latham, EditorDivision of Nutritional SciencesN.Y.S. College of Human EcologyN.Y.S. College of Agriculture and Life SciencesStatutory Colleges of the State Universityat Cornell UniversityIthaca, NY 14853
Cornell International NutritionMonograph SeriesNumber 15 (1985)
— — -- ---~
LIBRARY, INTERNAT~C~I~-FC~’-!C~~2ENTREFOR CC~V ~J r~Y VIA bi; ~Jb~-PLYAND sAN~IAT:o;J~C)RD. Box 931S3, ~ AD TheTel. (070) @14911 ax~. l41f1~2
~RN: ‘~ ‘7~:)c~~LO: r7(~tL~ N(2~
— ———-—-

Published and Copyright 1985, Cornell University
Program in International Nutrition
Copies may be obtained from:
Dr. Michael C. LathamDivision of Nutritional SciencesSavage Hall, Cornell UniversityIthaca, New York 14853, U.S.A.
Price: U.S. $3.00 including postage surface mail
We regret to inform our overseas buyers that only U.S.checks or currency are acceptable. We are not able toaccept foreign checks except for amounts over $10.00.
PREFACE AND SUMMARY
Two papers appear together in this monograph because theyevaluate benefits to child health following large-scale public healthinterventions. They provide an algorithm to examine studies beyondthe published substantive findings. Both papers develop a similarconceptual model to deal with confounding issues related to experi-mental design, measurement of variables, and statistical analysis.One paper deals with nutritional factors while the other focuses onissues related to disease. The first paper by Habicht and Butzdiscusses the literature on nutrition interventions on birthweight,morbidity, growth and mortality among children. The second paper byEsrey and Habicht reviews the literature on water supply and sanita-tion facilities and their impact on morbidity, growth, and mortalityamong children.
The paper by Habicht and Butz reviewed the criteria necessary tojudge the adequacy of nutrition interventions, in contrast to a laterreview by Beaton and Ghassemi (Supplementary feeding programs foryoung children in developing countries, AJCN 1982; 35:864-916).Habicht and Butz concluded, contrary to Beaton and Ghassemi, thatproperly conducted evaluations can show benefits following nutritionsupplementation programs. In addition, the choice of indicators forevaluation needs to be carefully chosen to prevent evaluations frombeing falsely negative. Of the five health indicators reviewed, onlyheight and weight could show health impacts. Furthermore, control ofnon-nutritional influences through intervention, design, and statisti-cal procedures is indispensable to avoid false negative evaluations oflarge-scale nutrition interventions. This review originally appearedin the book Evaluating the Impact of Nutrition and Health Programs,edited by Robert E. Klein, et al., 1979. It is reprinted here withthe permission of the publisher, Plenum Press.
The second paper in the monograph addresses the continued contro-versy over whether health benefits occur following water and sanita-tion interventions. The review comes at the mid-point of the Interna-tional Drinking Water Supply and Sanitation Decade (1981-1990). Esreyand Habicht used a similar algorithm as developed in the first paperto judge the impact of water and sanitation interventions. Theyconclude that the better studies consistently show health benefits,whereas studies reporting negative findings were all flawed in one ormore major ways. Further, the health impact due to sanitation waslarger than the impact due to water supplies. Water quality was ofmarginal importance in improving child health. Targeting of areasprior to intervention and adherence to specific epidemiologic princi-ples during evaluation need to be followed to enable researchers toidentify health impacts.
Steven A. EsreyJean-Pierre HabichtWilliam P. Butz
1

TABLE OF CONTENTS
MEASUREMENTOF HEALTH AND NUTRITION EFFECTS OFLARGE-SCALE NUTRITION INTERVENTION PROJECTS Page
byJean—Pierre Habicht and William P. Butz
List of Tables v
List of Figures . . vii
Introduction 2
Operational Definitions of Health and Nutrition . . 2
Levels of Evaluation of Field Studies arid Public HealthPrograms . . 3
4. Field Intervention Studies in individuals . . . . 3
B. Community Field Intervention S1.udies 4
C. Public Health Pilot Studies 4
0. Evaluation During Implementation of Large-ScaleInterventions 5
E. Evaluation Through Monitoring . 5
Choice of Evaluation Indicators . . 5
Indicator Sensitivity in Individuals 5
Indicator Sensitivity in Communities 8
Intervention, Outcome and Intermediary Indicators . . 11
Evidence that Conventional Health and Nutrition Indicators
are Sensitive to Nutrition Intervention 16
Establishing the Specificity of Indicator Response . . . . 16
Presentation of Specific Intervention Studies which Testedthe Sensitivity of Indicators of Nutritional Status . . . . 22
Evidence that the Nutrition Intervention Actually Improved
the Diet 23
Sensitivity of Height and Weight to Improved Nutrition . . 24
11

Page
Sensitivity of Morbidity and Mortality to ImprovedNutrition 25
Sensitivity of Birthweight and Infant Mortality to Improved
Nutrition of the Mother 26
Can Integrated Intervention Programs be Evaluated2 27
Setting for Large-Scale Integrated Interventions 27
Approach to Evaluating Integrated Interventions 29
Conclusion 32
Acknowledgement 32
References 33
THE IMPACT OF IMPROVEDWATERSUPPLIES ANDEXCRETADISPOSAL FACILITIES ON DIARRHEAL
MORBIDITY, GROWTHAND MORTALITY AMONGCHILDRENby
Steven A. Esrey and Jean-Pierre Habicht
List of Tables . . . v
List of Figures vii
Abstract 38
Biological Link Between Water, Excreta Disposal,and Child Health 39
Focus of Review 41
Review of Published Results 57
Association of Water and Sanitation to DiarrhealMorbidity 57
Association of Water and Sanitation to Nutritional
Status 61
Association of Water and Sanitation to Mortality . 63
Discussion of Criteria to Evaluate Studies 66
lii
Page
Experimental Studies 67
Observational Surveys: Positive Statistical
Association 73
Observational Surveys: Negative Statistical
Association 75
Conclusion 79
References 85
iv
LIST OF TABLES
MEASUREMENT OF HEALTH AND NUTRITION EFFECTS OFLARGE-SCALE NUTRITION INTERVENTION PROJECTS Page
byJean-Pierre Habicht and William P. Butz
Ia. Effect of protein-calorie intervention in preschoolchildren on total dietary intake 12
lb. Effect of protein-calorie intervention in preschoolchildren on height 13
Ic. Effect of protein-calorie intervention in preschoolchildren on weight 14
Id. Effect of protein-calorie intervention in preschoolchildren on morbidity 15
Ie. Effect of protein-calorie intervention in preschoolchildren on mortality . . 15
II. Summary of design and indicator characteristics fromintervention programs in Table 1 21
THE IMPACT OF IMPROVEDWATER SUPPLIES ANDEXCRETA DISPOSAL FACILITIES ON DIARRHEAL
MORBIDITY, GROWTHAND MORTALITY AMONGCHILDRENby
Steven A. Esrey and Jean-Pierre Habicht
1. The effect of water supply and excreta disposal conditionson intestinal infections, infestations and diarrhea . . . . 42
2. The effect of water supply and excreta disposal conditionson nutritional anthropometry 52
3. The effect of water supply and excreta disposal conditionson mortality 54
4. A list of questions asked about study findings dependingupon the type of study design and whether or not differencesin outcomes were tested and found 68
V
Page
5. Summary of ability to satisfy design characteristics forexperimental trials showing benefits from water orsanitation improvements 70
6. Summary of ability to satisfy design characteristics forobservational surveys showing benefits from water orsanitation improvements 76
7. Summary of ability to satisfy design characteristics forstudies reporting negative findings 80
vi
LIST OF FIGURES
MEASUREMENTOF HEALTH AND NUTRITION EFFECTS OFLARGE-SCALE NUTRITION INTERVENTION PROJECTS Page
byJean-Pierre Habicht and William P. Butz
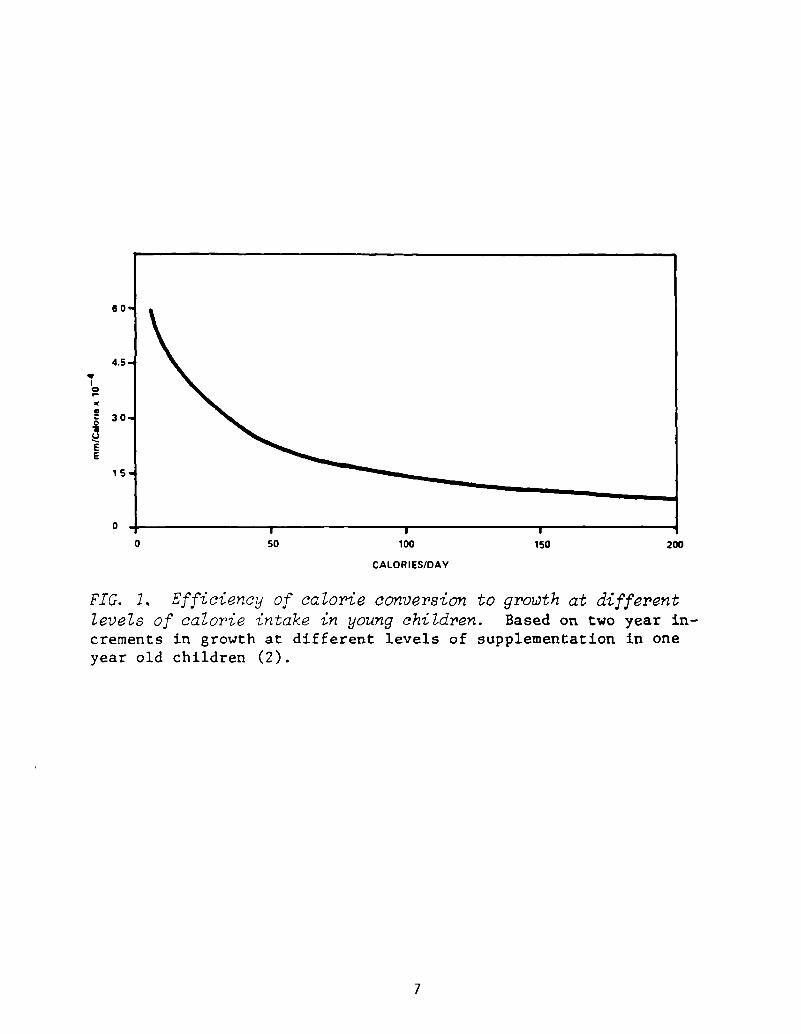
1. Efficiency of calorie conversion to growth at differentlevels of calorie intake in young children 7
2. Individual probability as contrasted to selectivity ofenvironment stunting 10
3. Infant mortality rate trends in two villages chosenfor a nutrition intervention 19
THE IMPACT OF IMPROVEDWATERSUPPLIES ANDEXCRETA DISPOSAL FACILITIES ON DIARRHEAL
MORBIDITY, GROWTHAND MORTALITY AMONGCHILDRENby
Steven A. Esrey and Jean-Pierre Habicht
1. Schematic presentation of the sequence of expected
benefits from water and sanitation improvements 40
2. A schematic diagram of different surveys and trials . . . . 69
3. Potential confounding factors and their relationshipsto the health benefits expected from water andsanitation improvements 74
4. Schematic presentation of the fecal-oral transmissionof pathogens in relation to water and sanitationinterventions 83
vii

MEASUREMENTOF HEALTH AND NUTRITION EFFECTS OF LARGE-SCALE
Reprinted from “Evaluating the Impact of Nutrition and HealthPrograms”, edited by Robert E. Klein, et al., 1979, with the permis-sion of the publishers, Plenum Publishing Corporation. Some minorchanges have been incorporated into the present publication. Theauthors express sincere appreciation to Marilyn Ward for preparationof the manuscript in its present form.
2 Address: National Center for Health Statistics, Hyattsville, MD;Current address: Division of Nutritional Sciences, Cornell Univer-sity, Ithaca, NY.
3 Address: Rand Corporation, Santa Monica, CA; Current address: U.S.Bureau of the Census, Department of Commerce, Washington, D.C.
NUTRITION INTERVENTION PROJECTS1
Jean-Pierre Habicht2 and William P. Butz3
1
1
INTRODUCTION
Increasingly the nutritional impact of complex interventionpackages is being sought. Typically these complex interventions in-clude intentional changes in the economic, social and political en-vironment as well as in medical and nutritional factors. We areconcerned in this paper with the critical issues of the choice ofindicators necessary to evaluate these complex interventions withmultiple treatments.
We first will argue that large scale, complex interventionsrequire knowledge about indicator variables that is likely to emergeonly from careful evaluations of simple interventions. We then dis-~cuss a set of optimal properties for field indicators of nutrition andhealth. These properties have implications for the design and evalua-tion of interventions. In light of these implications we will reviewthe few evaluations of nutrition interventions reported in the litera-ture in order to assess the knowledge now available for structuringcomplex, large scale interventions. Finally, we will explore problemsof design and measurement peculiar to interventions with multipletreatment.
OPERATIONAL DEFINITIONS OF HEMLTH AND NUTRITION
The objectives of the program to be evaluated must be clearlydefined and the evaluation must make the appropriate comparisons giventhese objectives. In the context of this volume, which focuses onvery poor populations, good health may be defined as the absence ofsymptomatic illness, the absence of life-shortening processes and theabsence of pathological constraints on performance. Although thisdefinition is broader than that of the clinician, it is narrower thanmany definitions of health which cannot be translated operationally.More importantly, this definition concentrates mainly on the soundnessof the body, little on the soundness of the mind, and not at all onthe soundness of the soul. When conditions which threaten the integ-rity of the body have been obviated thanks to social and economicdevelopment, the fostering of the non-physiological components ofhealth can receive a higher priority.
Also within the context of poor populations, good nutrition maybe defined as food intake which is adequate enough so that neitherhealth, performance, nor survival are impaired for lack or excess offood or of its components. Again, this definition is broader thanthat of classical nutrition, but is narrower than that of many nutri-tion demagogues. It may be considered a transient definition becauseother socially desirable components may come to be viewed as necessaryas a population’s physiological needs are met.
2
In the context of these operational definitions one should beable to infer from an improvement in indicators of health and nutri-tion that there is an associated improvement in performance, a de-crease in overt illness, and/or longer survival. This requires pre-vious demonstrations that these benefits are directly tied to improve-ments in the chosen indicators of health and nutrition. For instance,a reduction in infant mortality appears clearly to be a health bene-fit, while an increase in nutrient ingestion may or may not be. Somuch has been said about the interrelationships between nutrition andhealth that the interrelationships are presumed understood, at leastat most practical levels. Unfortunately, this is only true in severemalnutrition and very poor health. Among those with moderate degreesof ill-health and malnutrition, characteristics of the vast majorityof the poor, too few competent field studies have been done to estab-lish the implications for performance, health and survival of changesin indicators of health and nutrition.
LEVELS OF EVALUATION OF FIELD STUDIES AND PUBLIC HEALTH PROGRAMS
There is a logical sequence of evaluation studies depending uponprevious scientific and administrative knowledge (1). In general,these include field intervention studies, public health pilotprojects, evaluations in conjunction with implementations of an inter-vention, and ultimately continuous monitoring of program impact. Eachof these is discussed more fully in the paragraphs that follow. Theknowledge resulting from each is not only important in decidingwhether a given type of intervention is likely to be useful or not,but it also will indicate which experimental design to use and whichvariables to measure in an evaluation of new or on-going nutrition andhealth interventions.
A. Field Intervention Studies in Individuals
Some field intervention research is directed to identifyingphysiological and behavioral responses of individuals to public healthintervention. It is not concerned with macrochanges at the level ofthe community. One might think that such individual responses couldbe done in a laboratory setting where conditions can be controlled.However, clinical and laboratory studies cannot substitute for a fieldstudy because the natural ecology of infections and nutritionalstresses cannot be duplicated in metabolic wards.
An example of the value of such a field study is presented byYarbrough and Habicht (2). Their population consisted of older pre-school children whose dietary staple was maize, in whom they quanti-fied the relative contribution to growth resulting from differentdoses of calories as contrasted to similar doses of calories combinedwith protein. Two unexpected results developed. The first was that asmall increment in calories without added protein was as effective inimproving growth as was a similar increment in calories with protein.The second was that even large improvements in protein-calorie nutri-tion could not improve growth rates to the levels seen in developed
3
countries, in all probability because of recurrent and frequent diar-rhea] disease. These findings contradicted the inferences drawn fromresearch in laboratory and clinical settings which could not take thevillage ecology into account (3).
This kind of prospective experimental epidemiological field studyrequires a large array of measures and a rigorous experimental designto assure the comparability of data from those individuals receivingthe different kinds of interventions. Only by such careful controlcan the inferences be sufficiently strong and generalizable to indi-viduals in other populations to be of use to scientists and cliniciansin that they are assured of the effectiveness of the intervention forindividuals.
B. Community Field Intervention Studies
Field studies which show a benefit in individuals are not neces-sarily designed to show an effect at the community level. Yarbroughand Habicht, for instance, reported a clear benefit to some indi-viduals without any measurable impact in the entire population.Another type of field research, which must be based on knowledge, suchas that acquired under the type of study discussed in (A) above, isdirected to evaluating community or a population response to an inter-vention. Are there enough individuals who respond sufficiently to theprogram so that one can identify a response from measurements aggre-gated at the community level? This research is also expensive, aboveall because it requires replication at the community level and musthave as rigorous an experimental design as in (A). A good example isthe group of fluoridation evaluation studies done by the U.S. PublicHealth Service which examined many indices of fluoride nutrition andmany kinds of outcomes, including possible adverse side effects (4).Collectively, these clearly demonstrated the effectiveness of waterfluoridation to prevent caries in comn~unities.
C. Public Health Pilot Studies
Only when the results of field intervention studies have demon-strated effectiveness and thus promise a likely benefit from publichealth programs, is it worth investigating the feasibility and thecost-efficiency of large scale public health interventions. We callthese public health pilot studies. On the basis of the knowledgegained from studies such as those described in A or B above, thesepilot studies can utilize the best and most sensitive measures ofmediating variables and of outcomes. Similarly, they only need tomeasure the few confounding variables which have been shown in study Aor B to be important. However, they must also measure cost in such away that the three components of the intervention can be examinedseparately to permit cost-efficiency analyses. No such analyses canbe done without an experimental design which is at least as rigorousas in study (A) for cost-efficiency per individual benefited, or asrigorous as in study (B) for cost-efficiency of community impacts.
4

D. Evaluation During Implementationof Large-Scale Interventions
Once a pilot study has shown an intervention to be feasible,effective, and efficient, it may be extended more widely. A well-planned study needs to be conducted concurrently with this extension.It must be intensive and rapid, measuring those variables which arelikely to change rapidly as the intervention is introduced. Thisimplementation evaluation compares baseline data with that obtainedlater, or it compares geographic areas where the program has begunwith those where it is about to begin.
The kinds of measurements are less numerous and more selectivethan those needed in the pilot study described in (C). The analysisof data should proceed quickly for each new geographic area benefitingfrom the introduction of the intervention to assure that the resultscorrespond to those found in (C). If they do not correspond in spiteof corrective action, either the chosen introduction is not feasibleas a large scale public health activity, or the conditions whichpermitted the program to have an impact in study (C) do not hold atthis large scale level.
E. Evaluation Through Monitoring
Once a program is implemented on a large scale, the only concernis that it results in an improvement compared to past health andnutritional status and that these results persist. This requires theestablishment of a monitoring system which must be functioning ade-quately before the initiation of the public health intervention pro-gram (5). It requires no rigorous control group and a minimum ofcrucial measurements.
CHOICE OF EVALUATION INDICATORS
The choice of an indicator depends upon whether the evaluation is
directed towards change in individuals or in communities.
Indicator Sensitivity in Individuals
An indicator of nutritional or health status of individuals mustbe responsive to the improved health or nutrition for which the pro-posed intervention is designed. In other words, the indicator must beresponsive over the range of improvement expected.
This requires that there is an abnormal value for the indicatorin individuals before intervention. Furthermore, the abnormality mustbe due to that element of nutrition or health which is to be improved.Thus, for example, if the intervention only improves protein qualityof the diet in a population which is stunted because of inadequatecaloric intake, the intervention will not improve growth (6). His-torically, the health and nutritional factors responsible for abnormal
5
levels of indicators have often been incorrectly identified on thebasis of descriptive studies which were not buttressed by interventionstudies of the type described previously.
Even when an indicator’s abnormal value is related to, or due to,the factor which the intervention is designed to improve, the indica-tor often may not be sensitive to improvement. This occurs becausemany indicators of health and nutritional status have been derivedfrom comparisons between healthy, well-nourished individuals andclinically ill or malnourished patients. However, the majority ofindividuals in the usual target populations for large-scale interven-tions are not suffering extreme malnutrition or ill health.
The consequences of moderate malnutrition can often not be pre-dicted from severe malnutrition. For example, the severe proteindeficiency syndrome of kwashiorkor is accompanied by a deteriorationof the body’s defense mechanisms against infection and by impairedintestinal function, both of which result in diarrhea. However,protein deficiency sufficient to stunt growth does not result inincreased diarrhea (7). Therefore, one may not presume that a strongeffect on performance, health and survival, during severe malnutritionwill necessarily lead to proportionately reduced indicator valuesunder less severe malnutrition. In fact, trying to demonstrate theeffectiveness of an intervention by using indicators demonstratedeffective only under extreme conditions will usually fail.
Observations such as the above suggest that in many situationsthe dose-response curve may not be linear. Indeed, in those rarestudies where one has looked for a dose-response on performance,health and survival, through improved nutrition in man, one finds asignificantly lessened benefit as one improves nutritional state evenat levels of nutrition universally accepted as inadequate (2,8). Thismeans that for many indicators of performance, health and survival,one may not expect much improvement after intervention, unless thelevels of the indicators in the malnourished population are quitedifferent from normal levels in well-nourished regions (c.f. Figure1).
Measured dose-response depends not. only on the physiologicalresponse to dose consumed, but also, arid sometimes importantly infield conditions, on the vagaries of measuring the intervention in-dicators and the response or outcome indicators. The larger and morefrequent the errors of measurement of intervention and of outcome, theless sensitive will be the measured dose-response. For certain typesof intervention (e.g., Vitamin A fortification of a food eaten oc-casionally by everybody) and for certain outcomes (e.g., an increasein fat folds) these vagaries in measurement can conceal any signifi-cant association between intervention and outcome. Where such errorsare considerable, certain measurement strategies and statistical ma-nipulations can help (9). It is much better to assure that the inter-vention and outcome variables chosen have little intrinsic variabilityand that the measurements are done carefully (10).
6
60
4.5
0
‘ ::
0
CALORIES/DAY
FIG. 1. Efficiency of calorie conversion to growth at differentlevels of calorie intake in young children. Based on two year in-crements in growth at different levels of supplementation in oneyear old children (2).
0 50 100 150 200
7
Indicator Sensitivity in Communities
So far we have discussed the effects of a health and nutritionintervention on indicators of performanc:e, health and survival inindividuals. Now we turn to problems which arise when one wishes toevaluate the results of an intervention on a population, rather thanon individuals.
Evaluation of interventions in ind’ividuals usually depends uponsequential (longitudinal) measurements ~inthe same individuals. Thecomparison is between improvement in those individuals who receive theintervention with the lack of improvement in those who do not. Encontrast, the evaluation of interventions in populations often dependson sampling individuals at different points in time. Where the vari-ability between individuals in some indicator is large compared to theexpected response of that indicator to intervention, measuring dif-ferent individuals each time instead of the same individuals longi-tudinally, will result in a marked decrease in the sensitivity of theindicator, similar to that which we noted will occur if the measure-ments are done poorly in individuals. The decision as to whether theimproved sensitivity of evaluation acquired by longitudinally mea-suring the same individuals in populations is or is not worth theadded cost and difficulty, as compared to sampling different indi-viduals each time, can and should be calculated before intervention isstarted.
Usually, knowing the dose-response curve in individuals does notpermit predictions about the effectiveness of an intervention in thecomunity. One reason for this discrepancy can be found when a cer-tain critical reduction in disease or disease-causing agents resultsin eradication of the disease from the community because a cause-effect chain is interrupted, as in malaria prevention programs. Insuch a case, a greater response is obtained than would be anticipatedwhen looking at individuals alone. A similar situation can be postu-lated for the effect of natality of reducing infant and childhoodmortality. If there is a sudden marked decrease in child mortality,it may be that the birth rate will decrease more rapidly than with anequal but more gradual fall in child mortality. A sudden increase inthe number of infants and toddlers in the family may be more evidentto the parents than would be a slow increase in the proportion ofchildren who survive.
A more general reason why individual response rates to a givenintervention do not predict population response rates to that sameintervention, lies in the fact that the population response dependsupon the characteristics of beneficiaries of the intervention comparedto the rest of the population. Thus, one can expect different dose-responses in similar populations depending on the way the interventionis distributed. For instance, nutrition supplementation appears to beconsumed in some nutrition programs inversely to the individual’sneeds (11). The impact of such a supplement will be negligible com-pared to a program with identical coverage which also assures thatmaximum supplementation is ingested where it is most needed.
8
For the above reason, many programs direct their interventions tothose most likely to benefit. Other programs may cover the wholepopulation but select for evaluation those who will most benefit.This selection is done on the basis of indicators of probable benefit.For this purpose, one must choose an appropriate “cut-off point” onthat indicator which will permit the best selection (12). We callthis characteristic the “selectivity of the indicator’s ‘cut—offpoint’”. 1/
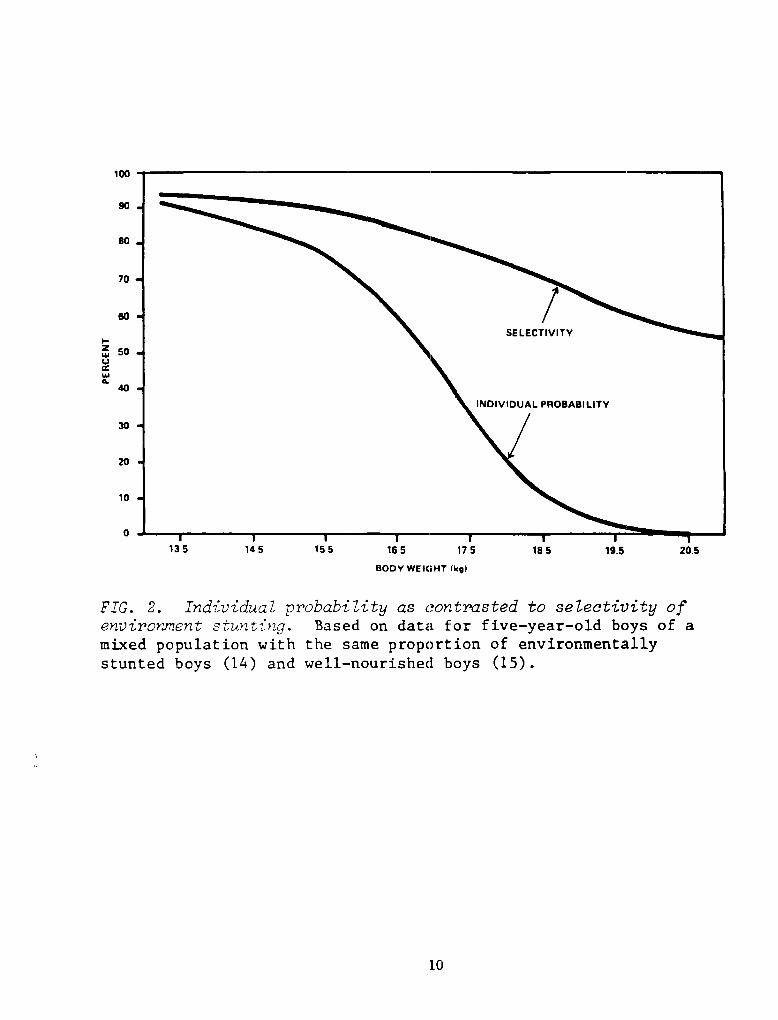
No variable is perfectly “selective”. A child who is small forhis age may be genetically stunted or he may be stunted for nutri-tional or health reasons. In the individual case one can ascribe aprobability to the genetic and non-genetic possibilities if one knowstwo of the following three distributions: the distribution of growthof all children in the population of which the child is representa-tive; the genetic distribution of sizes; or the distribution ofstunted children. Figure 2 shows the probability of environmentallystunted growth at different weights among five-year—olds in a mixedpopulation, half environmentally deprived (14) and half well-nourished(15). The smaller the child in this population, the greater theprobability that the child’s growth was stunted for non-geneticreasons.
Selectivity of an indicator’s “cut-off point” does not refer,however, to the individual’s probability of being malnourished or ill,but refers to the number of individuals who fall below that “cut-offpoint” because they suffer from malnutrition or ill health rather thanbecause of genetic factors. Figure 2 also shows how this selectivitychanges with different “cut-off” points in this same population offive-year-olds. Selectivity depends upon three characteristics of adichotomous diagnostic variable at a specified “cut-off point”: themeasured or true prevalence of the disease; the proportion of allcorrectly diagnosed as ill for this disease (sensitivity of diagno-sis); and the proportion of non-ill persons correctly diagnosed as notill with this disease (specificity of diagnosis). Only one of thesecharacteristics, the sensitivity of diagnosis, can be expected toremain constant under standardized conditions across different popula-tions. It is obvious that the prevalence of disease can change. Thespecificity of diagnosis will also change with the changing prevalenceof factors other than the disease or nutritional cause against whichthe intervention is addressed. Therefore, selectivity has to beestimated for each population.
Such estimates of selectivity will often show that an interven-tion can only have a modest impact even when it improves markedly thecondition for all those who can benefit from it, because only a few of
1/ Clinical pathologists with a concern for prognosis havedescribed the identical characteristic and called it “predictability”(13). We have tried to use the term “predictability” in the contextof public health but found it so confusing that we have regretfullyretained “selectivity” for this presentation.
9
100
90
80
70
60
~ 50U
a.40
30
20
10
0
BODY WEIGHT (kg)
FIG. 2. Individual probability as contrasted to selectivity ofenvironmentstuntinq. Based on data for five—year—old boys of amixed population with the same proportion of environmentallystunted boys (14) and well—nourished boys (15).
135 145 155 165 175 185 19.5 20.5
10

those selected can benefit. For instance, in the U.S.A., the officialhemoglobin “cut-off point” for anemia is 12g. in Black women. This“cut-off” delivers a prevalence of 20% anemics among Black women, allpresumed to be iron deficient based on the literature. In fact,probably less than 10% of those classified as anemic would benefitfrom iron therapy (16)--the selectivity of this hemoglobin “cut-offpoint” is, therefore, only about 10%. If each of those Black womenwho could benefit from iron therapy responded to an iron fortificationprogram by raising their hemoglobin 2g., this increase in hemoglobinwould be diluted to a mean 0.2g. increase among those classified asanemic. Such results would not indicate iron therapy to be an effec-tive intervention if the selectivity were not known beforehand.
Thus, whether or not an indicator is sensitive at the level ofthe population, depends not only on its sensitivity at the level ofthe individual, but equally important, upon the selectivity of theindicator.
It is clear from this discussion that, to ensure that evaluationdoes not result in spurious negative results, no large—scale interven-tion program should be evaluated unless certain facts about the inter-vention, the measurements, and the population’s probable response tothe program are known beforehand. The easiest and safest way toelucidate these facts is by conducting carefully designed and imple-mented intervention studies in similar populations beforehand. TablesI.a-e present the data reported in nine such intervention programs.The specifics of these tables are discussed in the next section.
These Tables present the results of nutritional interventions inpopulations of preschool children with malnutrition and they revealthat growth in height is the most sensitive indicator, increments inweight are less sensitive, and improvements in health and post-infantsurvival are so insensitive that they cannot be used as indicators ofnutritional status or to measure the effect of nutritionalinterventions in populations.
We do not review here the results of nutrition interventionstudies in pregnant women because we reviewed this literaturepreviously (25) and concluded that birthweight and duration ofpregnancy probably were not related to nutrition of the mother exceptin sever maternal deprivation. We have since persuaded ourselvesotherwise, at least as far as birthweight is concerned (26,27). Wewill try to justify our conversion at the end of the next section. Wehope soon for a similar justification in the literature for thinkingthat infant mortality is sensitive to maternal and infant nutrition——but that is not yet available.
This evidence about the sensitivity of indicators can only comeabout from careful, well-designed intervention studies such as thosedescribed previously.
Intervention, Outcome and Intermediary Indicators
Later we will review the evidence for the sensitivity of outcome(impact) indicators which reflect cellular responses to improved
11
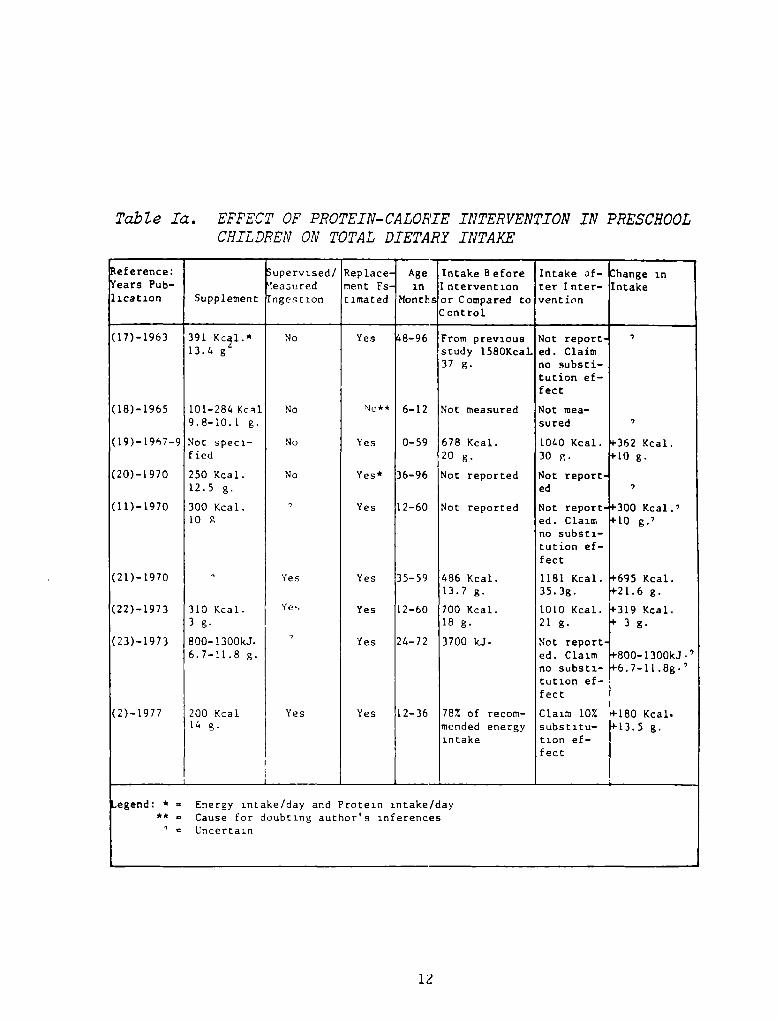
Table Ia. EFFECT OF PROTEIN-CALORIEINTERVENTIONIN PRESCHOOLCHILDREN ON TOTAL DIETARY INTAKE
eference: upervised/ Replace Age Intake Before Intake of— hange in‘ears Pub— ~easured ment Fs in Intervention ter Inter— Intakelication Supplement nge~t ion timated Months or Compared to
Controlventi’n
(17)—1963
(18)—1965
(19)—19~7—9
(20)—i 970
(11)—1970
(21)— 1970
(22)—1973
(23)—1973
(2)—1977
39113.4 g
101—284 Kc~l9.8—10.1 g.
Not speci-fied
250 Kcal.12.5 g.
300 Kcal.10 g
310 Kcal.3 g.
800—l300kJ.6.7—11.8 g.
200 Kcal14 g.
No
No
No
No
Yes
Yes
Yes 8—96
No** 6—12
Ye,s 0—59
Yes* 36—96
Yes 12—60
Yes 35—59
Yes 12—60
Yes 24—72
Yes 12—36
From previousstudy l58OKcal.37
Not measured
67820Not reported
Not reported
486 Kcal.13.7 g.
700 Kcal.18 g.
3700 kJ.
78% of recom-mended energyintake
Not report.ed. Claimno substi-tution ef-fect
Not rnea—su red
1040 Kcal.30 g.
Not report.ed
Not report.ed. claimno substi-tution ef-fect
1181 Kcal.35. 3g.
1010 Kcal.21 g.
Not reported. Claimno substi-tution ef-fect
Claim 10%subs t itu—tion ef-fect
~362 Kcal.~10 g.
~300 Kcal.)10 g.~
‘-695 Kcal.~21.6 g.
‘-319 Kcal.‘- 3 g.
p800—i 300kJ.’-6.7—11.8g.’
‘-180 Kcal.‘-13.5 g.
.egend: * = Energy intake/day and Protein intake/day** Cause for doubting author’s inferences
Uncertain
12
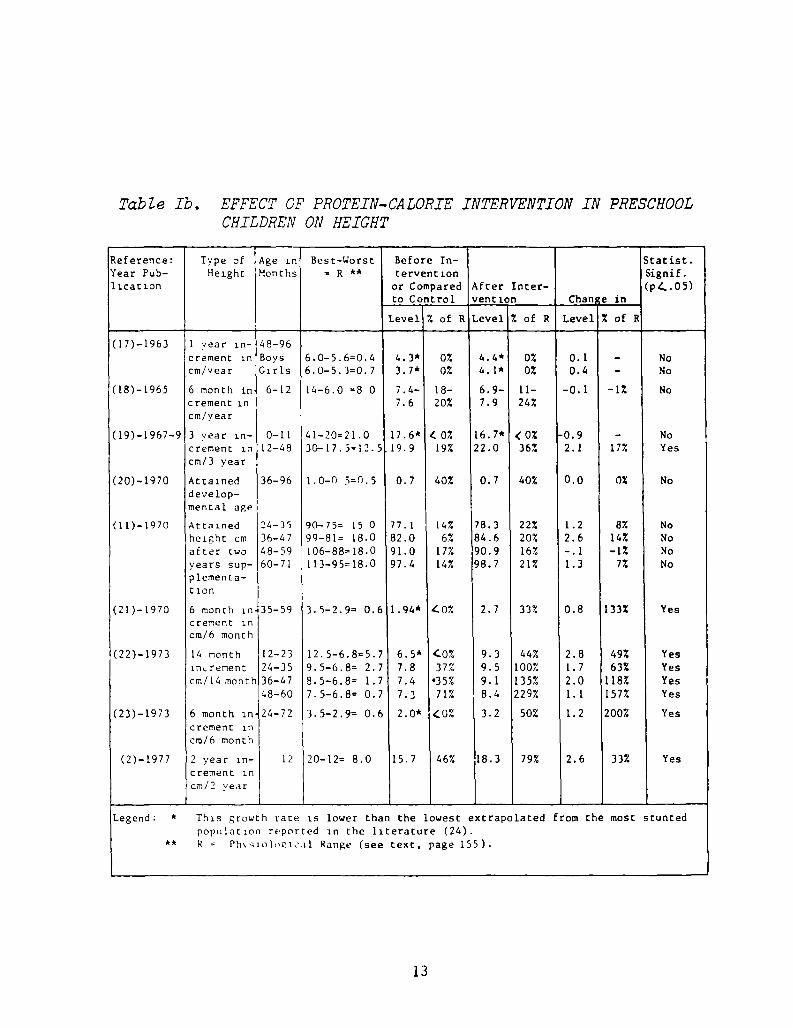
Table lb. EFFECT OF PROTEIN-CALORIE INTERVENTION IN PRESCHOOLC’HILDREN ON HEIGHT
Reference: Type of Age in Best—Worst Before In— Statist.Year Pub— Height Months = R ** tervention Signif.licacion or Compared
to Control
Level 7. of R
After Inter—vention
Level 7. of R
Chan
Level
e in
% of R
(p4.05)
4•4*4.1*
6.9—7.9
0%0%
11—24%
16.7* (0%22.0 36%
0.10.4
—0. 1
P0.92.1
0.0
1.22.6—.11.3
0.8
2.81.72.01.1
1.2
2.6
(17)—1963 1 year in— 48—96crement in Boys 6.0—5.6=0.4 4.3* 0%
cm/year Girls 6.0—5.3=0.7 3~7* 0%
(18)—1965 6 month increment incm/year
6—12 14—6.0 =5 0 7.4—7.6
18—20%
(19)—1967—9 3 year in—crement in
cm/3 year
0—1112—48
41—20=21.030—17.5=12.5
17.6*19.9
0%19%
(20)—1970 Attaineddevelop-mental age
36—96 1.0—fl 5=0.5 0.7 40%
(11)—1970 Attainedheight cmafter iwoyears sup—
plementa—I ion
24—3536—4748—5960—71
90—75= 15 099—81= 18.0106—88=18.0113—95=18.0
77.182.091.097.4
14%67.
17%14%
(21)—1970 6 month increment incm/6 month
35—59 3.5—2.9= 0.6 1.94* ~0%
(22)—1973 14 month 12—23lnLrement 24—35cm/14 month 36—47
48—60
12.5—6.8=5.79.5—6.8= 2.78.5—6.8= 1.77.5—6.8= 0.7
6.5*
7.87.4
7.3
~.0%
37%35%
71%
(23)—1973 6 month in 24—72 3.5—2.9= 0.6 2.0* ~0%
crement incm/6 month
(2)—1977 2 year in—crement in
crn/2 year
12 20—12= 8.0 15.7 46%
Legend: * This growth rate is lower than the lowest extrapolated from the most stuntedpopulation reported in the literature (24).
** R Ph’.’~io1opic,~1 Range (see text, page 155).
NoNo
No
NoYes
No
NoNoNoNo
Yes
YesYesYesYes
Yes
Yes
—1%
17%
0%
8%14%—1%
7%
133%
49%63%
118%157%
200%
33%
40%
22%20%16%21%
33%
44%100%135%229%
50%
79%
0.7
78.384.690. 998.7
2.7
9.39.59.1
8.4
3.2
18.3
13
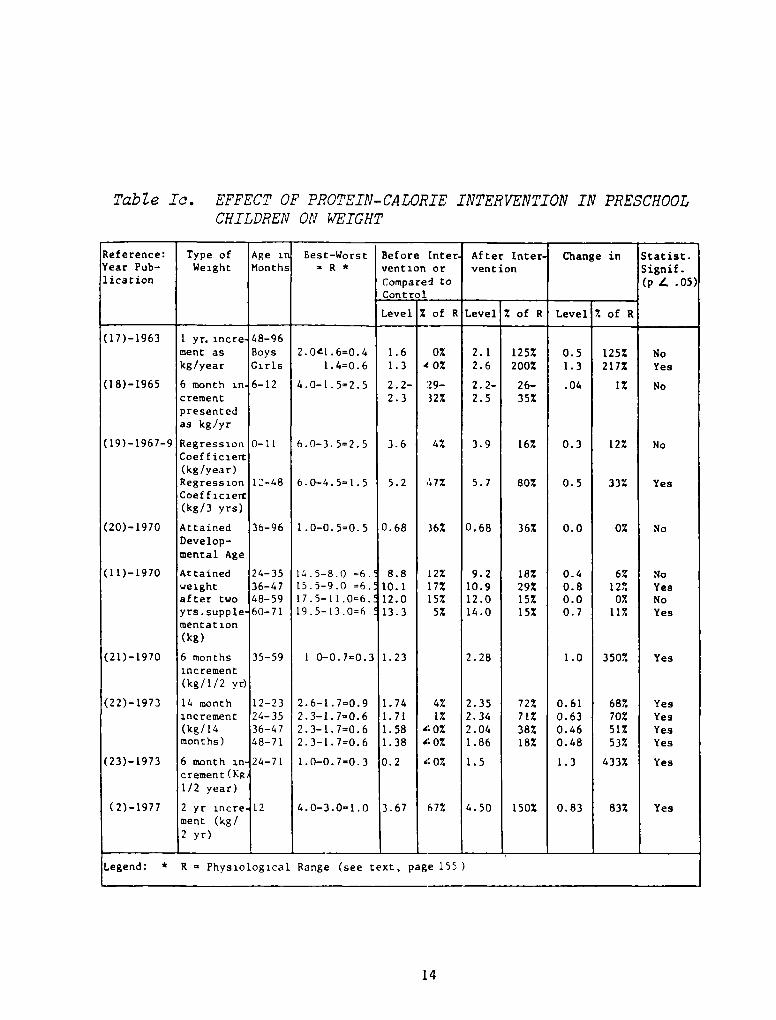
Table Ic. EFFECT OF PROTEIN-CALORIE INTERVENTION IN PRESCHOOLCHILDREN ON ~ITEIGHT
Reference: Type of Age ii Best—Worst Before [nter After Inter- Change in Statist.Year Pub— Weight Months R * vention or vencion Signif.licacion Compare~ to
Control
Level Z of R Level % of R Level % of R
(p 1. .05)
1.61.3
2.2—2.3
3.6
5.2
2.12.6
2.2—2.5
3.9
5.7
2.0~1.6=0.41.4=0.6
4.0—1.5=2.5
6. 0—3. 5=2. 5
6. 0—4. 5= 1. 5
1.0—0.5=0.5
14.5—8.0 =6.15.5-9.0 =6.17.5—11.0=6.19.5—13.0=6
(17)—1963 1 yr. incre 48—96ment as Boys 0% 125% 0.5 125% Nokg/year Girls 40% 200% 1.3 217% Yes
(18)—1965 6 month in
crementpresentedas kg/yr
6—12 29—32%
26—35%
.04 1% No
(19)—l967—9 Regression 0—11Coef f iclert(kg/year)Regression 12—48Coefficiert(kg/3 yrs)
4%
67%
16%
80%
0.3
0.5
12%
33%
No
Yes
(20)—1970 AttainedDevelop-mental Age
36—96 0.68 36% 0.68 36% 0.0 0% No
(11)—1970 Attained 24—35weight 36—47after two 48—59yrs.supple 60-71mentat ion(kg)
8.810.112.013.3
[2%17%15%
5%
9.210.912.014.0
18%29%15%15%
0.40.80.00.7
6%12%
0%11%
NoYesNoYes
(21)—1970 6 months 35—59 1 0—0.7=0.3 1.23 2.28 1.0 350% Yesincrement(kg/l/2 yr)
(22)—1973 14 monthincrement(kg/14months)
12—2324—3536—4748—71
2.6—1.7=0.92.3—1.7=0.62.3—1.7=0.62.3—1.7=0.6
1.741.711.581.38
4%1%
‘~0%‘0%
2.352.342.041.86
72%71%38%18%
0.610.630.460.48
68%70%517.53%
YesYesYesYes
(23)—1973 6 month increment (Kg1/2 year)
24—71 1.0—0.7—0.3 0.2 ‘0% 1.5 1.3 433% Yes
(2)—1977 2 yr incre 12ment (kg!2 yr)
4.0—3.0=1.0 3.67 67% 4.50 150% 0.83 83% Yes
Legend: * R Physiological Range (see text, page 155
14
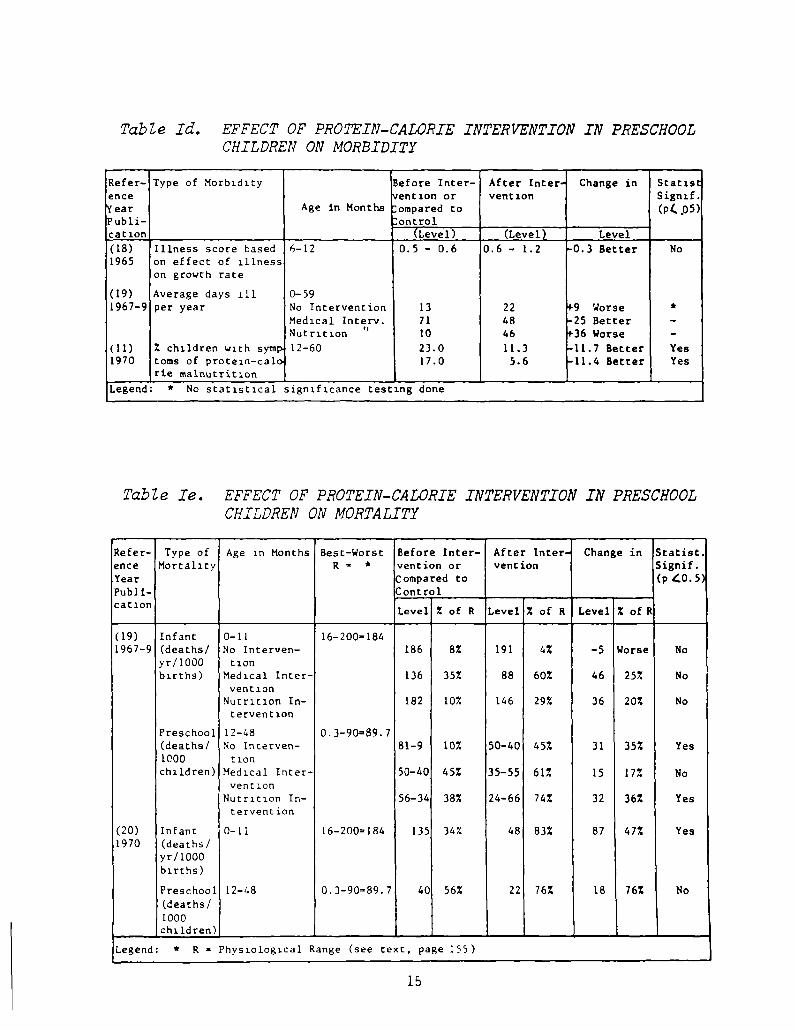
Table Id. EFFECT OF PROTEIN-CALORIE INTERVENTION IN PRESCHOOLCHILDREN ON MORBIDITY
Refer— Type of Morbidity Before Inter— After Inter Change in Statigence rention or vention Signif.‘ear Age in Months :ornpared to (P4 ~05)‘ubli—cation
ontrol(Level) (Level) Level
(18) Illness score based 6—12 0.5 — 0.6 0.6 — 1.2 .0.3 Better No1965 on effect of illness
on growth rate
(19) Average days iii 0—591967—9 per year No Intervention 13 22 ‘9 Worse *
Medical Inter,. 71 48 25 Better —
Nutrition “ 10 46 ‘36 Worse —
(11) % children with symp 12—60 23.0 11.3 11.7 Better Yes1970 toms of protein—calc 17.0 5.6 11.4 Better Yes
ne malnutrition
Legend : * No statistical significance testing done
Table Ie. EFFECT OF PROTEIN-CALORIE INTERVENTION IN PRESCHOOL
CHILDREN ON MORTALITY
Refer— Type of Age in Months Best—Worst Before Inter— After Inter. Change in Statist.ence Mortality R * vention or vention Signif.
Year Compared to (p~o.S
Publi-cation
Control
Level Z of R Level % of R Level % of I
(19) Infant 0—11 16—200—1841967—9 (deaths! No Interuen— 186 8% 191 4% —5 Worse No
yrtl000 tionbirths) Medical Inter— 136 35% 88 60% 46 25% No
ventionNutrition In— 182 10% 146 29% 36 20% No
tervention
Preschool 12—48 0.3—90=89.7(deaths! No Incerven— 81—9 10% 50—40 457. 31 35% Yes1000 tionchildren) Medical Inter— 50—40 45% 35—55 61% 15 17% No
vent ionNutrition In— 56—34 38% 24—66 74% 32 36% Yes
tervent ion
(20) Infant 0—11 16—200=184 135 34% 48 83% 87 47% Yes1970 (deaths!
yr/bOObirths)
Preschool 12—48 0.3—90=89.7 40 56% 22 76% 18 76% No(deaths!
1000children)
Legend: * R — Physiological Range (see text, page 155)
lb
nutrition because these indicators alone provide evidence of physio-logical benefit from a public health intervention. No evaluationstudy can, however, rely on such outcome indicators alone. Theseoutcome indicators must be complemented by indicators which measurethe intervention itself and its intermediary results. In field inter-vention studies the intermediary results are crucial for substanti-ating that the intervention caused the outcome. For this purpose theintermediary variables chosen will be those which biology indicatesshould change together, and they will be analyzed for such congruityof response. This analysis is imperative to substantiate causalitybetween an intervention and a coincidental outcome.
The evaluation of all intervention studies is greatly facilitatedif one knows how much intervention various members of the populationreceives relative to their needs. To achieve this, the interventionindicators should be as unambiguously tied to the intervention aspossible. For instance, including in food supplements a tracer thatcan be measured in the urine permits one to ascertain who is consumingthe food supplements. This and similar strategies for evaluatinginterventions are particularly essential when an intervention does notsucceed in improving health, performance or survival. In such circum-stances, one must differentiate between the question, “Was the failurebecause the intervention failed to reach those who needed it?” ascontrasted to the question “Was the intervention itself inappropri-ately chosen?”.
EVIDENCE THAT CONVENTIONALHEALTH AND NUTRITION INDICATORS
ARE SENSITIVE TO NUTRITION INTERVENTION
Establishing the Specificity of Indicator Response
To document the sensitivity of an indicator of nutritional statusrequires nutrition intervention studies, which demonstrate that theindicator responds to improved nutrition. Demonstration of such aresponse includes exclusion of the probability that the response wascaused by non-nutritional factors. This exclusion, which assures thespecificity of response to the nutritic’n intervention, can only beachieved by carefully designed and implemented intervention studies.
This section presents the criteria necessary to judge whether aresponse in an indicator was likely to be due to nutrition, in whichcase the indicator is sensitive to changes in nutrition, or whetherthe change could have been due above all to non-nutritional influ-ences. In the context of testing the sensitivity of an indicator,these non—nutritional influences are “confounding” factors in statis-tical parlance.
The need to control for confounding factors is of course asimportant in evaluating the success of an intervention as in iden-tifying sensitive indicators. Therefore the considerations reviewedin this section are important for designing all evaluations. This isespecially true where the biological response to an intervention isunder investigation as in Section (A) and (B) cited earlier, but
16
controlling for confounding becomes less important since evaluation isless concerned with proving intervention effectiveness and is moreconcerned with monitoring as one proceeds through the evaluationsdescribed in Sections (0) and (E). The reason for describing thecontrol of confounding factors in this section, however, is not toprescribe experimental designs for intervention evaluation, but israther to aid in judging whether a putative indicator of nutritionalstatus has been demonstrated to be sensitive to changes in nutritionin individuals and populations where only a small minority suffer theflorid clinical forms of kwashiorkor or marasmus.
We have discussed how the sensitivity of response is diminishedby random errors of measurement and random variations in the indi-cators. These errors of measurement and other variations in theindicators are all due to factors other than those to which the inter-vention is addressed. They are, in that context, variations that arenot specific to the purposes of the intervention. So long as thesenon-specific variations are random and their effects add up to zero,they only decrease the sensitivity of response. When, however, a non-specific influence changes the indicator among many individuals in thesame direction, there is a danger that the resulting shift in the meanwill be incorrectly attributed to the intervention.
There are basically three strategies to control for confoundingfactors: Controlled experimental designs; use of complementary indi-cators; and statistical analyses. The classical procedure is by ex-perimental design where one compares the group benefiting from theintervention with a group similar in all relevant characteristics butwhich does not benefit from intervention (28). For instance, volun-teering to participate in an intervention immediately introduces abias if this group is to be compared to a control group which did notchoose to take advantage of the intervention, because the factorswhich promote cooperation with the intervention program may alsoeffect changes in the outcome indicators.
Good experimental design is the single most important factornecessary for successful evaluation. This depends upon careful formu-lation of the questions which the evaluation is supposed to answer.Defining the appropriate questions is facilitated if the practicalconsequences of alternative answers are specified. For instance, thequestion, “What are the correlates and consequences of participationby potential beneficiaries of a program?”, is much less useful thanasking, “Who needs the program? If these needy participate, is theirperformance, health or survival improved?” If not, “why not? Whatproportion of the needy participate? Why not?” Alternative answersto each of the questions in the latter series has immediate implica-tions for program implementation. Experimental design is alwaysslighted in compendia, such as this volume, because adequate treatmentof the issue cannot proceed without addressing specific substantivequestions. Generalizations on this issue have not been useful becauseapparently minor constraints on the use of “classical” experimentaldesigns vitiate their usefulness and such constraints are the rule infield evaluations.
17
One particular constraint which results in falsely optimisticevaluations about a program’s effectiveness, is the use of the sameindicator to select those who are in need of the intervention, and tojudge the response of the intervention in those selected. The use ofsuch an indicator must correct for the indicator’s inevitable regres-sion towards the mean between the time of selection and the time ofevaluation (29).
Evaluations which sample different individuals in a populationinstead of following individuals longitudinally must be particularlycareful to ascertain whether population movements in and out of theintervention areas are not due to the immigrant’s desire to cooperatewith the intervention compared with the emigrants’ indifference. Insuch a case, the immigrants may immigrate into the intervention areawith better indicators of performance, health and survival than thoseof the emigrants, because those better indicators are associated withfactors which promote cooperation with the intervention program, butare not due to the intervention program per se.
One of the great disappointments in evaluating intervention pro-grams has been the discovery that comparisons between villages orregions often result in spurious differences due to non-specificinfluences which affect whole villages and regions. Often theseeffects cannot be explained, much less prevented (6). In this con-text, Gordon et al. stated that in the nutrition intervention studiesthey reported it was impossible to determine how much of the differ-ence in effects observed between villages was due to the differentinterventions, to general secular trends which were different betweenthe three villages, to sudden unexpected occurrences such as epidemicswhich infested villages differently, and to other unknown factorswhich might have affected the villages differently (19:VIII).
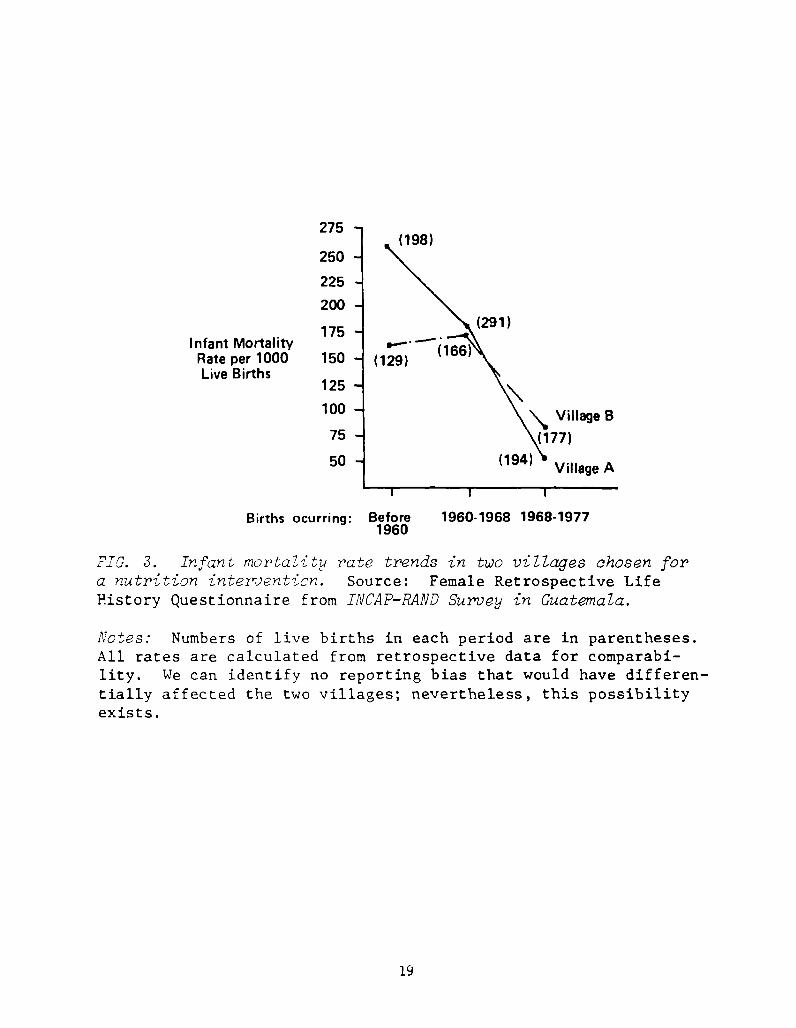
For instance, it is usual practice to ascertain through baselinesurveys the comparability of villages with respect to the evaluationindicators. Figure 3, shows actual data on infant mortality rates fortwo villages chosen to be comparable in 1968 for a nutrition interven-tion that began in 1969. Comparing the rates in 1968 suggests thatthe two villages were quite similar with respect to this indicator.However, looking at the trends between 1960 and 1968 in these vil-lages, sorely tries one’s confidence in the comparability of futureinfant mortality data across the villages. Such confidence is, ofcourse, a prerequisite for believing that the reduced mortality afterthe intervention seen in village A relative to village B is due to anintervention applied to village A and not to village B.
Therefore, any experimental design which does not randomly dis-tribute the intervention and its control within a village or a regionmust have sufficient villages or regions covered by each treatment(replicates) so that one can estimate the probable contribution ofnon-specific influences at the village or regional level. Adjacentvillages and regions must have different treatments, and the villagesand regions should be so stratified that any other random non-specificinfluences are controlled for. Designs which show differences betweenregions or villages but do not have these required replicates mustremain suspect.
18
275 -
(198)250
225
200
175
150
125
100 -
75 -
50- A
Births ocurring: Before 1960.1968 1968-19771960
FIG. 3. Infant mortality rate trends in two villages chosen fora nutrition intervention. Source: Female Retrospective LifeHistory Questionnaire from Ii’JCAP—RAND Survey in Guatemala.
Notes: Numbers of live births in each period are in parentheses.All rates are calculated from retrospective data for comparabi-lity. We can identify no reporting bias that would have differen-tially affected the two villages; nevertheless, this possibilityexists.
Infant MortalityRate per 1000Live Births
(291)
(129)
Village B
I I
19
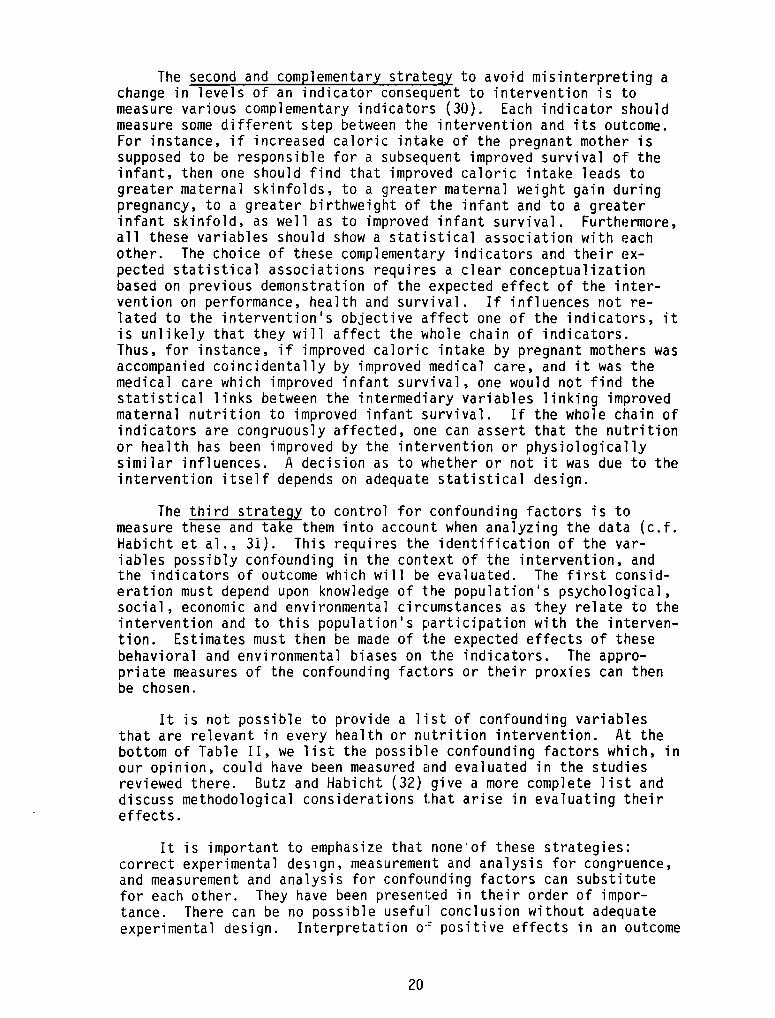
The second and complementary strat~y to avoid misinterpreting achange in levels of an indicator consequent to intervention is tomeasure various complementary indicators (30). Each indicator shouldmeasure some different step between the intervention and its outcome.For instance, if increased caloric intake of the pregnant mother issupposed to be responsible for a subsequent improved survival of theinfant, then one should find that improved caloric intake leads togreater maternal skinfolds, to a greater maternal weight gain duringpregnancy, to a greater birthweight of the infant and to a greaterinfant skinfold, as well as to improved infant survival. Furthermore,all these variables should show a statistical association with eachother. The choice of these complementary indicators and their ex-pected statistical associations requires a clear conceptualizationbased on previous demonstration of the expected effect of the inter-vention on performance, health and survival. If influences not re-lated to the intervention’s objective affect one of the indicators, itis unlikely that they will affect the whole chain of indicators.Thus, for instance, if improved caloric intake by pregnant mothers wasaccompanied coincidentally by improved medical care, and it was themedical care which improved infant survival, one would not find thestatistical links between the intermediary variables linking improvedmaternal nutrition to improved infant survival. If the whole chain ofindicators are congruously affected, one can assert that the nutritionor health has been improved by the intervention or physiologicallysimilar influences. A decision as to whether or not it was due to theintervention itself depends on adequate statistical design.
The third strategy to control for confounding factors is tomeasure these and take them into account when analyzing the data (c.f.Habicht et al., 31). This requires the identification of the var-iables possibly confounding in the context of the intervention, andthe indicators of outcome which will be evaluated. The first consid-eration must depend upon knowledge of the population’s psychological,social, economic and environmental circumstances as they relate to theintervention and to this population’s participation with the interven-tion. Estimates must then be made of t.he expected effects of thesebehavioral and environmental biases on the indicators. The appro-priate measures of the confounding factors or their proxies can thenbe chosen.
It is not possible to provide a list of confounding variablesthat are relevant in every health or nutrition intervention. At thebottom of Table II, we list the possible confounding factors which, inour opinion, could have been measured and evaluated in the studiesreviewed there. Butz and Habicht (32) give a more complete list anddiscuss methodological considerations 1.hat arise in evaluating theireffects.
It is important to emphasize that noneof these strategies:correct experimental design, measurement and analysis for congruence,and measurement and analysis for confounding factors can substitutefor each other. They have been presented in their order of impor-tance. There can be no possible useful conclusion without adequateexperimental design. Interpretation of positive effects in an outcome
20
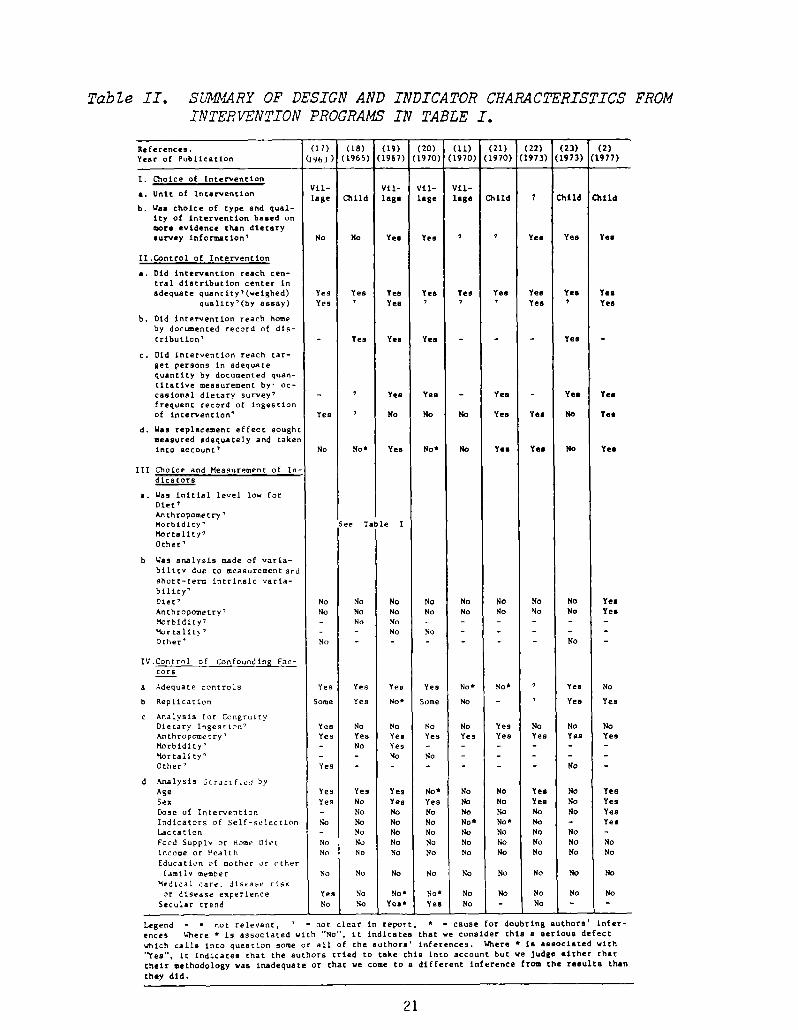
TabZ.e II. S~vL4RYOF DESIGN AND INDICATOR CRAMCTERISTICS FROMINTERVENTION PROGRAMSIN TABLE I.
References.
Year of Publication
(17)
(I’m))
(18)(1965)
(19)(1967)
(20)(1970)
(11)(1970)
(21)(1970)
(22) (23) (2)(1973) (1973) (1977)
I. Choice of Interventionvii— vii— vii— vii—
a. Unit Of intervention lage Child laB. lage lag. Child 7 Child Child
b. Wa. choice of type and qual-ity of intervention ba.ed onmor. evidence than dietarysurvey information’ No No Yea Yea ‘ Ye. Yea Ye.
1I.Control of Intervention
a. Did intervantion reach cen-
tral diatribution center inadequate quantity’(weighed) Yes Yes Yea Yea Yea Yea Yea Yes
quality’(by assay) Yes ‘ Yea ‘ ‘ Yea ‘ Yea
b. Old intervention reach homeby doc~ented record of dis-tribution’ — Yes Yea — Yea
c. Did intervention reach tar-get persons in adequate
quantity by documented quan-
titative measurement by~ Oc—caaion..al dietary survey’ — Yes Yea — Yea Ye. Ye.frequent record of ingestion
of intervention’ Yea No No No Yea Yea NO Yea
d. Uaa replacement effect soughtmeasured adequately and taken
into account’ No No5 Yea NO5 No Ye. Yea No Ye.
III Choice and Measurement of In
—
d ica tore
a. Wa, initial level low forDirt’An th ropome try’Morbidity’ See Table IMortality’Other’
b Was analysis made of varia—bilitv due to measurement and
short—term intrinsic varia-bility’
Diet’ No No No No No No No No Yea
Anthroposetry’ No No No No No No No No YesMorbidity’ - No No — — — — — —
Mortalit~’ — - No No - — — — —
Other’ No - - - — - - No -
IV.Control of Confounding Far-ET1 w106 273 m222 273 lSBTtors
a Adequate controls Yes Yes Yes Yes No5 No5 Yea No
b Replication Some Yes No~ Some No — Ye. Yea
c Analysis for CongruityDietary Ingestion’ Yes No No No No Yes No No NoAnthropowecry’ Yes Yes Yea Yes Ye, Yes Yes Yes Yea
Morbidity’ — No Yes — — — — — —
Mortality’ — — No No — — — — —
Other’ Yes — — — — — — No —
d Analysis Strjrif.ed byAge Yes Yes Ye, HoC No No Yea No Yea
Sex Yes No Yes Yes No No Yea No YesDose of Intervention — No No 14o No No No No Yes
Indicators of Self—selection No No No No No* No5 Mo — Yea
Lactation — No No No No No No No -
Food Supply or Home Diet No No No No No No No No No
Income or l~ealth No No No No No No No No No
Education of mother or otherfamily member No No No No No No No No No
Medical care. disease riCkor disease experience Yes No No5 No5 No No No No No
Secular trend No No Yca~ Yea No — No — —
Legend — . not relevant, ‘ — not clear in report. s — cause for doubting authors’ infer-
ences Where ~ is associated with ‘No’, it indicates that we consider this a serious defectwhich calls into question some or all of the author,’ inferences. Where * is associated with
‘~Yes’. it indicates that the authors tried to take this into account but we judge either that
their methodology was inadequate or that we come to a different inference from the results than
they did.
21
indicator must ~e reinforced by analysis of other indicators forcongruity to be persuasive. Analysis of possible confounding factorsreinforces the assertion that a change in an indicator of nutritionalstatus was, indeed, due to the intervention and not to some con-founding factors (see Table II).
Presentation of Specific Intervention Studies which Testedthe Sensitivity of Indicators of Nutritional Status
Tables I. a-e present results froni nutrition intervention studiesat the individual or population levels directed against proteinS-calorie malnutrition in preschool children who live at home. Thesetables present those variables which have been studied often enough tobe tabulated. This is a rather small subset of the many variablesproposed for evaluation studies (33-35). Other variables have notbeen reported frequently enough in intervention literature to be ableto ascertain whether they will or will not respond to nutrition inter-vention programs directed against protein-calorie malnutrition underfield conditions.
Where possible, we have tried in Table I to set limits or maximalranges within which the indicator is expected to vary. The level seenor recommended in developed countries we call the “best” level. The“worst” level is that which we believe is compatible with survival ofthe population in its present numbers. 2/
We convert the levels of the indicator before and after interven-tion to a percent of the physiological range, R, by subtracting thevalue of the indicator from the “worst” level and dividing this dif-ference by the range R to deliver a percentage. Thus, in Table I.cthe first study measured one year increments in weight (17).
In developed countries this one year increment is 2 kg over theage period under consideration. Under the “worst” conditions in theliterature the one year increment in boys is 1.6 kg. the range, R, is0.4 kg. The control group of boys who received no supplement gained1.6 kg per year, no better than the “worst” expected growth. Theirpercent of R was therefore (1.6-1.6)10.4 = 0%. The boys who received
2/ In Table I, the Worst and the Best situations for height,weight and mortality were estimated in the following fashion:
Weight and height: attained and increment: The “best” levelswere data taken from a well fed population (15). The “worst” aretaken from a compilation (36). In preschool children, measuring theincrement from these data produces the same result as measuring themean increment in children followed longitudinally [see comparativedata in Hansman (37)], which is not the case in adolescence.
Mortality: The best levels were those reported to the UnitedNations Organization (38). The worst levels were taken from our guessbased on our experience in underdeveloped countries, where deaths areunderreported.
22
the supplement gained 2.1 kg per year. Their percentage of R wastherefore (2.1-1.6)104 = 125%. Thus if the indicator is already atlevels similar to those of developed countries, the percentage ofrange will approach 100%. If the indicator reflects conditions simi-lar to those worst conditions reported in the literature the percentof the range will approach 0%. A comparison between the percentage ofthe adequacy before the intervention and that after intervention givesan idea of change during the intervention.
The last column of Table I indicates whether the authors reporteda statistically significant change in the indicator subsequent tointervention as compared to a control group. The next step is todecide whether a negative finding in this column reflects insensitiv-ity of the indicator or ineffectiveness of the nutritional interven-tion.
Evidence that the Nutrition Intervention Actually Improved the Diet
Unless a dietary intervention of adequate quality can be shown tohave reached target individuals in sufficient quantity, the failure tofind an effect on outcome indicators could be due to an inadequateintervention. Demonstration of adequate quantity of interventionrequires that one show that individuals consume an adequate amount ofsupplement (Table II. Section II.c), and that this increase was notlost through a comparable reduction in the usual home diet con-sumption. The latter is referred to as dietary substitution (TableII. Section II.d). Only careful, well-designed surveys entailinglarge sample sizes of about 600 person-measurements in each comparisongroup can discard the possibility of physiologically important substi-tution of 5% or more of home diet. These calculations are based onthe fact that the day to day variability in the intake of individualsin malnourished populations has a coefficient of variation of about35% for protein and calories. Therefore, where the claim for nosubstitution effect was made on the basis of small dietary surveysthis is considered an inadequate response to the question, “Was re-placement effect sought, measured adequately, and taken into account?”In such cases the estimated “change in intake” is followed by a ques-tion mark in Table l.a. This table presents the dietary interventiondata on the nine studies reviewed. Because none of the studies pre-sented age distribution data, we could not estimate minimum protein—energy requirements for survival (“worst” case) or for maximum growth(“best” case) so as to judge how much the intervention would be ex-pected to improve the diet. However, one study reported such a highprotein-energy intake before intervention that one wonders whether onecould expect any improvement from the intervention (17). For five ofthe studies the data presented does not permit an estimate of improveddietary intake (see last column). The four studies which adequatelymeasured substitution effects represent interventions which shouldhave resulted in some beneficial outcomes for the participating pre-school children inasmuch as the baseline protein and especially theenergy intakes were low in all, and the improvement of the protein-energy intake was substantial: from 45% to over 140% of the energycontained in the initial diet. The latter increase seems hardly
23
believable (21). Either the initial diet was not compatible with lifeor the increase was not compatible with physiological ingestive Ca-paci ty.
Sensitivity of Height and Weight to Improved Nutrition
Tables I.b and I.c report the outcome indicators of growth inheight and weight. Of the five studies in which one could not judgethe quantity of the intervention, only one showed any consistentimprovement in growth (23). Two others showed inconsistent results.On the other hand all of the four studies which presented adequateevidence of an appropriate nutrition iritervention also reported sta-tistically significant increments in growth for preschool childrenafter infancy (2,19,21,22). Of these studies, only one measuredinfants and this study revealed no improved growth during infancy dueto supplementation of the infants or of their lactating mothers.Thus, one may conclude that the outcome indicators of height andweight are sensitive in preschool children to factors associated withthe intervention. Martorell, et al., reached the same conclusion intheir review of post-infancy growth and protein-calorie supplementa-tion (39).
Whether or not the effect on growth was due solely or even prin-cipally to the nutritional component of the intervention must beaddressed by examining the adequacy of the control groups, the outcomeof analyses for congruity, and inspection of concurrent changes inconfounding variables (Table II. Sections IV. a-d). In this contextone of the five positive studies selected the intervention group fromvolunteers and compared that group to non-volunteers (21). The re-sults of the statistical analyses cannot, therefore, be ascribed tothe nutrition intervention. Another ol these studies reporting posi-tive results is not specific enough concerning its comparison groupsfor one to be sure they were appropriate, although careful reading ofthe report inclines one to believe they were (22). A third study hasinappropriate comparison groups but presents convincing data to showthat the improvement in growth is not due to factors affecting con-sumption of the supplement (2).
Appropriate comparisons imply adequate estimates of random vari-ability to decide if a difference is significant. One study (19) didnot have enough replicate groups to do so; another (22) may have hadsuch replicates, but did not present the necessary analyses for thereader to judge.
Congruity analysis of the five positive studies separately (TableII) results in discarding one (21) as presenting very unlikely re-sults, and the discarding of the infant data in another (19) becausethe values of growth in height and weight are incompatible with infantphysiology. The preschool data in the third (23) presents non-inter-vention data for weight increments which are so low as to appearincompatible with the survival of a stable population. The responseto intervention overshoots normal growth enormously during a period ofsix months. This data is not, however, so incongruous with presentknowledge that we reject it.
24
From a practical point of view, we conclude that at least certainstudies demonstrate that height and weight are sensitive to nutritionintervention programs, especially if measured longitudinally in thesame children. In such cases, height is considerably more sensitiveto intervention in the sense of producing greater statistical signifi-cance than is weight--a fact which we have commented upon elsewhere(40).
Sensitivity of Morbidity and Mortality to Improved Nutrition
Table I.d presents the reported effects on morbidity of nutritionintervention in these studies. The only study (11) which presentsevidence of any positive effect of nutrition on illness had comparisongroups which were self-selected and could be expected to show thispattern without nutrition intervention. The study most cited (19) asshowing a beneficial nutritional effect on mortality does not show itat all in the data as presented in Table I.d, and the argument in thereport based upon a change in secular trends is not convincing, es-pecially in view of the lack of replicability in the experimentaldesign. This lack of a beneficial effect on the morbidity of free-living malnourished but ambulatory children corresponds to ourfindings of a marked effect of disease on child growth but no effectof growth stunting on the incidence of disease (7).
Table I.e presents the reported effect on mortality of nutritioninterventions in two studies (19,20). The first of these is the studymost cited as showing a beneficial effect on mortality from improvednutrition, but in fact it shows no greater improvement due to nutri-tion than is evident in one of the comparison groups. Again, theargument made in the report that the nutrition-supplemented group wasin some way better is based on secular trends which are not replicatedin the experimental design, a defect recognized and mentioned by theauthors of these reports and brought to the attention of the reader inone (19:VIII).
Gordon et al., pointed out in reporting on his field study thatin developed countries only about 30% of all infant deaths occur afterthe first months of life (postneonatal), whereas about 60% of allinfant deaths are postneonatal in developing countries. However, thisratio of postneonatal to infant mortality is influenced by so manyfactors that it is probably not useful for evaluation of this type ofintervention. For instance, in the village receiving medical care,the ratio worsened from 54% to 69% of postneonatal deaths over allinfant deaths at the same time as the total infant death fell from 136to 88 per 1000 live births.
In the other study (20), data are presented suggesting thatinfant mortality is improved by nutrition intervention, but theauthors could show no effect whatsoever on growth. This lack ofcongruity makes us believe that the beneficial effect reported was dueto other causes, such as differing medical care. In practical termswe must conclude that morbidity and mortality are not sensitive enoughindicators to serve as evaluation indicators for the effect of nutri-tion intervention in preschool children.
25
Sensitivity of Birthweight and Infant Mortalityto Improved Nutrition of the Mother
We have reviewed elsewhere our reasons for believing thatbirthweight can be a useful indicator to evaluate nutritionalintervention in malnourished mothers (26,27). Although many reportsin the literature would contradict this belief, we found that thesereports either did not substantiate improved dietary intakes or thatthe studies were done in well-nourished populations (25). Ourconversion to thinking that birthweight could reflect individual andaggregate maternal malnutrition in malnourished populations was basedon a study which controlled for many confounding factors byexperimental design. The distribution curve of birthweight was moreaffected by maternal supplementation among the lower than among thehigher birthweights, which is congruent with a physiological effectassociated with supplementation rather than with biases in measurement(8). This study also examined the relative additive and synergisticeffects of important influences, including nutrition, on birthweight(41), and explored which confounding factors might explain theassociation between intervention and outcome (41). This study foundcongruent dose-responses of the home diet and of the nutritionalintervention (27). The dose-response was independent of when and ofhow long the supplement was consumed during pregnancy (42). This iscongruent with efficient maternal storage of energy during pregnancyfor use when the energy requirements of the fetus are greatest towardsthe end of the third trimester. The birthweight was moresignificantly affected by maternal nutrition than was the length ofthe newborn, in contradiction to the pattern after birth, butcongruent with a transfer of more enerqy from the better nourishedmother to her child toward the end of pregnancy. There is to dateonly this one study which shows such clear-cut results thatDirthweight will increase if nutrition is improved in malnourishedpregnant women. Belief based on the results of one study border onfaith, and corroborative evidence is sorely needed from an independentresearch team.
This evidence for an effect of maternal malnutrition on infantmortality was vigorously and eruditely denied until the nutritioncommunity came to believe that maternal nutrition affected birthweighton the evidence of the single study reported above. Early data fromthat study gave some basis for hope that the clear association betweenlow birthweight and infant mortality was mediated by malnutrition,rather than ~y gestational prematurity, intrauterine infection orother similar non-nutritional courses (41). Until more definitive datais available, projected estimates of infant lives to be saved bynational nutrition programs are premature. In particular it isprobable that nutrition intervention which is not coupled with primarymedical care (24) will not be cost-effective, nor perhaps evenbeneficial in terms of improved infant health and well-being (8).
In conclusion to this section, we were amazed at how little compe-tent work has been done in the evaluation of nutrition interventionsdirected towards remedying protein-energy malnutrition in populations.Before much more can be said about choosing sensitive indicators forsuch evaluations, more candidate indicators must be tested in careful
26
field intervention studies as described earlier in (A) and (B). Thisresearch cannot be accomplished by evaluations of pilot or large-scaleinterventions because such interventions cannot assure the specificityof response necessary to identify sensitive indicators of nutritionalstatus.
CAN INTEGRATED INTERVENTION PROGRAMSBE EVALUATED?
Our discussion so far has treated issues of measurement andevaluation of simple interventions: those in which the treatmentconsists of only one or a few changes introduced as part of a singleintervention. As Table II indicates, successful application of opti-mal design and evaluation principles has been rare in areas of nutri-tion and health, even when interventions were of this simple type.These studies could have taken advantage of experimental designtechniques for which the standard principles and techniques weredeveloped.
More often than not, nutrition and health interventions are notof this simple type. Therefore, we turn now to discuss the specialmeasurement and evaluation complications that arise in complex inte-grated interventions in which intentional changes are introduced inmedical, nutritional, social, political and economic factors. Evalua-tion is complicated immensely in these situations. The greater thenumber of factors purposely changed, the more difficult it will be toestimate the separate effect of changes in each factor on chosenindicator variables. More importantly, replication of the interven-tion also will be more complicated.
Setting for Large Scale Integrated Interventions
Before outlining the nature of these measurements and evaluationdifficulties, it is useful to ask why integrated interventions arebecoming popular. Frustration of researchers as well as policy-makerswith their meager results from simpler specific interventions isprobably an important factor. Their frustration is partly due toseveral of the problems discussed above leading to failure of manysimple interventions to produce measurable and important changes inindicators of health and nutrition in individuals and more frequentfailure to produce significant results at the population level.
Health and nutrition professionals are also increasingly con-cerned that very specific interventions may be ineffective within thesame institutional, technological and socio-economic environment thatoriginally led to poor nutrition and health. The concern is wellfounded in light of the rich interactions that characterize biologi-cal, social, economic and agricultural systems in poor populations.It is clear that nutrition and health outcomes emerge from theseinteractions. However, a change introduced as an intervention may notaffect these outcomes if other factors in the environment are in factlimiting improvements in health and nutritional status. In addition,
27

individuals can frequently take advantage of these interactions toturn the effect of an outside intervention away from that intended toa direction they prefer.
Let us illustrate the biological, socio—economic and agriculturalinteractions that commonly exist in economically poor environments.Consider that the nutrition and health of a family’s members (and,therefore, of a population) in a poor area are influenced by theamounts and types of food produced or transported into the region, thetypes and distribution of food storage facilities, the prices ofnutritious and non—nutritious foods, the prices and availability ofmedical care, and people’s knowledge and beliefs concerning food andmedical care. The family’s income and ~iealth also directly influencethe family members’ consumption of food and their use of traditionaland/or modern medical care. In addition, the complex of economic andother factors that influence how people spend their time can havesignificant indirect effects on nutrition and health. As an example,in communities where women have incentives to work away from home,breast-feeding is less common and those women with the higher workincentives tend to lactate the shortest period. These women may alsospend less time in food preparation and home health care. As anotherexample, changes in the amount of time children spend working and inschool may affect both their own nutritional requirements and theeffectiveness of their mothers in meeting these requirements. In poorpopulations family members’ nutritional status also depends on pat-terns of food distribution within the family and on determinants ofthese patterns. We discuss elsewhere the role of many of thesefactors in influencing women’s breastfeeding behavior (32).
Is is thus clear that nutrition and health are among the manyoutcomes of the biological, social, economic and agricultural systemsthat interact within families and communities. If these systems areequilibrating systems--that is, if the pattern of observed outcomesreflects an optimal allocation of the family’s or community’s re-sources given the biological, techno]ociical and economic conditionsthat exist--then particular changes in the environment may, indeed, beineffective. For example, a particular intervention may only relax anon-effective constraint. Increasing food grain production will notincrease rural people’s grain consumption nor nutritional status iffacilities for storing grain from plentiful to sparse seasons arealready inadequate or if the high cost of transporting the grain toother communities prevents the farmers from selling their higherproduction for income. Reducing the price of existing means ofstorage and transport or introducing new technologies in these areaswould enable the community to benefit from increased food production.
Similarly families may find it in their interest to reduce theirown health- or nutrition-producing activities in response to an inter-vention that independently contributes to health or nutrition. Aschool supplementation program cannot be expected to increase chil-dren’s food ingestion by the amount of supplementation. Poor parentsrespond to the school feeding program as though it were a decrease inthe effective price of food and therefore encourage their children toconsume somewhat more food at school. They then divert resources fromchildren’s food to food for other family members and to expenditures
28
on non-food commodities such as shelter or clothing. As long as thesesubstitution possibilities exist, persons can be expected to make useof them in order to increase their perceived benefit from an interven-tion. The result is a smaller change in the indicator variables thanmight be expected. The less the people in a community value betterhealth and nutritional status relative to other things, the more theywill rearrange the allocation of their resources to transform a nutri-tion and health intervention into benefits that they value morehighly.
For both these reasons there is considerable appeal to shiftingfrom simple interventions of the classic experimental design towardintegrated interventions that change a number of conditions thought tobe limiting to better nutrition and health. Furthermore, an inte-grated intervention study may well be the most cost—effective way toelucidate critical facts necessary for effective public health policyfor certain important questions.
Approach to Evaluating Integrated Interventions
When intentional changes are introduced in medical, nutritional,social, political and economic factors, evaluation is complicated im-mensely in these complex interventions. The greater the number offactors purposefully changed, the more difficult it is, in general, toestimate the separate effect of changes in each factor on chosenindicator variables. More importantly, replication of the interven-tion is also more complex. Finally, if the intervention is unsuc-cessful, it is more difficult to find out why--which factors wereresponsible.
Unfortunately, inadequate formulation, operation, measurement orevaluation results in programs of doubtful benefit and even moredoubtful replicability. It is here that a clear perception is neces-sary as to the nature of the program. Is it an intervention studydesigned to prove biological relationships between an intervention andoutcome in a free-living population whose characteristics are welldefined? Alternately, is the program a pilot study which is basedupon the proven results of a field intervention study and which triesto accomplish an outcome which is known to be sensitive to the inter-vention under the expected constraints of a large-scale public healthprogram? Or perhaps it may be the large-scale public health programitself.
Formulating a comprehensive intervention requires considerablymore knowledge about the structure of the complex system from whichpeople’s nutritional status and health emerge than does formulating asimple experimental design. In addition to following the importantconsiderations discussed in previous sections, designers of integratedinterventions must also use procedures that maximize the probabilitythat the set of chosen interventions has a significant effect on theindicators while simultaneously minimizing the losses from undesirableside effects--and do this all on a budget.
29

The first goal is not so difficult. The list of things causallyassociated with good health and nutrition is long, and we know how tochange many of these things, from food production and distribution towater, sewage, and hygiene. By intervening in enough ways, a sig-nificant result is nearly guaranteed. The evidence is all around,however, that significant undesirable side effects are nearly impossi-ble to avoid in large interventions, and often very difficult tomeasure. Our limited scientific understanding of the linkages withinand among biological, behavioral and agricultural systems does notfacilitate identification of the many outcomes that may be affected bya single change in the environment, much less by multiple changes.These issues as well as the identification of promising integratedinterventions, can only be determined by rigorous interventionstudies. Only these will reveal integrated interventions that arelikely to succeed within the resources available to public healthprograms. Intervention studies and pilot programs will reveal theinitial outcome variables and side effects which must be measured inthe evaluation of large-scale integrated public health programs.
After an integrated intervention has been formulated and testedin field studies, additional problems will arise during its operationas a pilot study. Chief among these is the temptation, sometimesexplicitly encouraged, to alter the set of interventions in mid—courseas experience accumulates. The decision is admittedly a difficultone. If it is clear that an additional change should have been addedto the intervention set based on the emerging data concerning limitingconditions or the efficacy of the existing intervention, one wouldlike to make the indicated change for the duration of the interven-tion. Similarly, the initial intervention set may have been wellformulated, but conditions have changed, due either to natural re-sponses to the intervention or to independent changes in the environ-ment. Making the indicated change in mid-course increases the ex-pected change in the indicator variablEs. The result of such anoperational change is to hamper the measuring of the experimentaltreatment and of evaluating the intervention. The cost of the pilotstudy which revealed these deficiencies will, however, have been smallin comparison to making these mistakes in the course of a large-scalepublic health program. And another pilot public health program cansubstantiate that the new integrated intervention is replicable andcost-effective.
Another pitfall in the operation of integrated interventionsarises when part of the intervention consists of political, social oreducational activities intended to organize people or redirect theirattention toward goals of the intervention. The exact nature of suchinterventions invariably shifts and adjusts as the intervention pro-ceeds, making it very difficult to measure and keep track of just whatthe intervention was at particular times. Even if accurate recordsare kept, evaluation of these parts of the intervention and possiblyof the entire effort is in jeopardy because the form of the interven-tion has become endogenous and dependent on the population’s re-sponses. How then can one examine these or related responses toevaluate the effectiveness of the intervention? In addition, politi-cal and social interventions are very difficult to replicate since,among other reasons, their outcomes generally depend on personalities
30

and activities of the persons who are intervening. Hence, replicatingthe treatment across villages in the experimental design, as recom-mended above, is difficult. Replicating it later in other sites iseven more difficult. However, adequate knowledge about the cruciallinkages acquired through intervention studies and substantiation ofthe replication in pilot studies will increase the likelihood that thelarge-scale intervention will be successful and be adequatelyevaluated and monitored for maximum cost-effectiveness.
Proper experimental design is critically important in the case ofcomplex integrated interventions. For simple experiments there is thepossibility of making inferences about cause and effect through multi-variate statistical analyses if the design is flawed, as long as mostconditions in the population have stayed static. When many factorsare intentionally changed, on the other hand, inadequate replicationand controls leave one unable to untangle the mass of changes and makestatements about nutrition and health effects due to the intervention.This problem is exacerbated if the effects of the components of theintervention are not additive. Indeed, one generally acts as if theyare not, since one generally tries to combine complementary interven-tions in the hopes that their result will be greater than the simpleaddition of their effects (synergistic action).
In our opinion, the evidence that many kinds of behavioral andbiological processes are interrelated does not imply the conclusionthat interventions must be broad and complex to produce lastingchanges in health and nutrition indicators. The implication instead,is that the specific interventions chosen must be those that changethe conditions——institutional, economic, biological——that are limitingin a particular setting. By changing specific conditions in differentexperimental settings, by formulating the experiments wisely, and bymeasuring the treatments, major confounding factors, and indicatorvariables intelligently, we can accumulate understanding of the rele-vant mechanisms and the particular interventions that are effective inspecific settings.
One should design the integrated intervention studies so thatthis synergistic effect is sufficiently understood so that it can beapplied cost-effectively. For instance, perhaps one wishes to knowwhich combination of medical care, environmental sanitation, nutritioneducation, and food subsidies will result in cost-effective results inhealth. Single-purpose intervention studies such as those reviewedearlier, will have delivered the best indicators for improvements inhealth and nutrition. By using these indicators to evaluate differentcombinations of interventions one can evaluate new additions to pre-vious combinations, beginning with the least expensive and most feasi-ble first, and progressing to more expensive additions later, untilthe benefits no longer justify further increments in cost. Thisprocedure will not permit a teasing out of the synergistic from theadditive effects of the intervention, but will reveal a good candidatefor pilot testing and ultimately for large-scale intervention. Thealternative is complex large-scale interventions that are costly tooperate, costlier to replicate on a national scale, and from whichlittle can be learned if the intervention fails and nothing can besafely changed in the future if it succeeds.
31
CONCLUSION
We conclude that an indicator must be sensitive to the interven-tion and be specific for that intervention. Knowledge about sensi-tivity must come from single purpose intervention studies. In thesestudies specificity of the indicator’s responses to nutrition isassured by controlling non-nutritional influences through interven-tion, experimental design and statistical analyses. The procedures,therefore, are clear for amassing the knowledge necessary to implementand evaluate the nutritional and health impact of large-scale inte-grated public health programs. It is distressing that we have fol-lowed this procedure so little that most of the crucial indicatorsnecessary for evaluation of interventions have not even been properlytested. In particular, only height and weight have been reliablyshown to be sensitive to improved protein-calorie nutrition in pre-school children, and height is more sensitive than weight.Birthweight as an indicator of maternal nutrition has so far only beenshown to be sensitive to improved nutrition in one study—-this findingmust be replicated before it can be generalized. Morbidity and mor-tality appear to be poor and insensitive indicators of nutritionalstatus in the preschool years, although infant mortality may ulti-mately prove to be a useful indicator where medical care is otherwiseadequate.
The little experience to date in testing these very few of themany indicators suggested for evaluation should be a warning thatpronouncements, even by renowned authorities, cannot replace valida-tion by single purpose intervention stLldies. Relaxing “scientific”constraints to recommend the continued use of “commonly used” evenunvalidated indicators will only result in falsely negative evalua-tions of valuable and useful programs. It would be better to recog-nize our limited knowledge about useful indicators and to use themgingerly when we must do so now. We should proceed as quickly aspossible to focus single purpose intervention studies to validate“commonly used” indicators and to develop other better indicators.
ACKNOWLEDGEMENT
This is a report of research of the Cornell UniversityAgricultural Experimental Station, Division of Nutritional Sciences.
32

REFERENCES
1. Habicht, 3-P., and M.C. Latham. Ethics of population research inpopulation. (Submitted for publication).
2. Yarbrough, C., 3-P. Habicht, R.E. Klein, et al. Response ofindicators of nutritional status to nutritional interventions inpopulations and individuals. In: S.d. Bosch and 3. Arias(eds.). Evaluation of Child Health Services: The InterfaceBetween Research and Medical Practice. DHEWPublication No.(NIH) 78-1066. Washington, D.C.: U.S. Government PrintingOffice, 1977. pp. 195-206.
3. Scrimshaw, N.S., and M. Behar. Malnutrition in underdevelopedcountries. New Engl. J. Med., Part I. 272: 137-144, 1965; PartII, ibid. 272: 193-198, 1965.
4. McClure, F.J. Fluoride in Drinking Water. U.S. Public HealthService Publication No. 825. Washington, D.C.: U.S. GovernmentPrinting Office, 1962.
5. Habicht, 3-P., J.M. Lane, and A.J. McDowell. National nutritionsurveillance. Fed. Proc., (in press).
6. El Lozy, M., and G.R. Kerr. Results of lysine fortification ofwheat products in southern Tunisia. pp. 113—133. In: H.L.Wilcke, (ed.). Improving the Nutrient Quality of Cereals.Washington, D.C.: U.S. Agency for International Development,1977.
7. Martorell, R. Illness and Incremental Growth in Young GuatemalanChildren. Ph.D. dissertation. Seattle: University of Wash-ington, 1973.
8. Habicht, 3-P., A. Lechtig, C. Yarbrough, and R.E. Klein.Maternal nutrition, birth weight and infant mortality. pp. 353—378. In: K. Elliott, and 3. Knight, (eds.). Size at Birth.CIBA Foundation Symposium 27, London: Elsevier, 1974.
9. Habicht, 3-P., and C. Yarbrough. Growth monitoring and nutri-tional assessment: anthropometric field methods; criteria forselection. In: R. Alfin—Slater, and D. Kritchvsky, (eds.).Nutrition: A Comprehensive Treatise. New York: Plenum Press,(in press).
10. Habicht, 0-P. Estandarizacion de metodos epidemiologicoscuantitativos sobre el terreno. Bol. Of. San. Pan., 76: 375-384,1974.
11. Swaminathan, M.C., D.H. Rao, R.V. Rao, et al. An evaluation ofthe supplementary feeding programmes for preschool children inthe rural areas around Hyderabad City. Indian 3. Nutr. Dietet.,7: 342-350, 1970.
33

12. World Health Organization. Methodology of Nutrition Survei I-lance. Report of a Joint FAO/UNICEF/WHO Expert Comittee. ~iHOTechnical Report Series No. 593. Geneva: World Health Organiza-tion, 1976.
13. Galen, R.S, and S.R. Gambino. Beyond Normality: The Predic-ET1 w300 623 m479 623 lSBTtive Value and Efficiency of Medical Diagnoses. New York: Wiley& Sons, 1975.
14. Yarbrough, C., 3-P. Habicht, R. Malina, et al. Length and weightin rural Guatemalan ladino children: birth to seven years ofage. Am. 0. Phys. Anthropol., 42: 439-447, 1975.
15. National Center for Health Statistics. 1976 NCHS Growth Charts.Monthly Vital Statistics Report, 25(3) Supplement, 1977.
113. Meyers, L., 3-P. Habicht, and C. Johnson. Components of thedifference between black and white women in the USA of hemoglobinconcentration in blood. Am. 0. Epidemiol., 1979.
17. King, K.W., W.H. Sebrell Jr., E.L. Severinghous, et al. Lysinefortification for wheat bread fed 1.0 Haitian school children.Am. 0. Clin. Nutr., 12: 36-48, 1963.
18. Bancroft, T., and K.V. Bailey. Supplementary feeding trial inNew Guinea highland infants. 0. Trop. Pediat., U: 28-34, 1965.
19. Series of articles written with various coauthors by Gordon,J.E., N.S. Scrimshaw, M.A. Guzman, M. Behar, and W. Ascoli withalternating first authorship: Nutrition and infection fieldstudy in Guatemalan villages. Guatemala: Institute of Nutritionof Central America and Panama, (INCAP), 1959-1964.I. Study plan and experimental design. Arch. Environ. Health,14: 657-662, 1967; II. Field reconnaissance, administrative andtechnical; study area; population characteristics; and organiza-tion for field activities. Arch. Environ. Health., 14: 787-801,1967; III. Field procedure, collection of data and methods ofmeasurement. Arch. Environ. Health., 15: 6-15, 1967; IV. Deathsof infants and preschool children. Arch. Environ. Health, 15:439-449, 1967; V. Disease incidence in preschool children undernatural village conditions, with improved diet, and with medicaland public health services. Arch. Environ. Health, 16: 223—234,1968; VI. Acute diarrheal disease and nutritional disorders ingeneral disease incidence. Arch. Environ. Health, 16: 424-437,1968; VII. Physical growth and development of preschool chil-dren. Arch. Environ. Health, 17: 107-118, 1968; VIII. An epi-demiological appraisal of its wisdom and its errors. Arch
.
Environ. Health, 17: 814-827, 1968; IX. An evaluation of medi-cal, social, and public health benefits, with suggestions forfuture field study. Arch. Environ. Health, 18: 51-52, 1969.
20. Baertl, J.M., E. Morales, G. Verastegui, and G.G. Graham. Dietsupplementation for entire communities. Growth and mortality ofinfants and children. Am. 0. Clin. Nutr., 23: 707—715, 1970.
34
21. Kamalanathan, G., G. Nalinakshi, and R.P. Devadas. Effect of ablend of protein foods on the nutritional status of preschoolchildren in a rural balwadi. Indian 0. Nutr. Dietet., 7: 288—292, 1970.
22. Gopalan, C., M.C. Swaminathan, V.K. Srishna Kumari, et a].Effect of calorie supplementation on growth of undernourishedchildren. Am. 0. Clin. Nutr., 26: 563-566, 1973.
23. Rajalakshmi, R., S.S. Sail, D.G. Shar, and S.K. Ambody. Theeffects of supplements varying in carotene and calcium content onthe physical, biochemical and skeletal status of preschool chil-dren. Brit. 3. Nutr., 30: 77-86, 1973.
24. Habicht, 3-P., and Working Group on Rural Medical Care. Deliveryor primary care by medical auxiliaries: Techniques of use andanalysis of benefits achieved in some rural villages in Guate-mala. pp. 24-37. In: Medical Auxiliaries. PAHO ScientificPublication No. 278. Washington, D.C.: Pan American HealthOrganization, 1973.
25. Lechtig, A., G. Arroyave, 0-P. Habicht, and M. Behar. Nutricionmaterna y crecimiento fetal. Arch. Latinoamer. Nutr., 21: 505—530, 1971.
26. Lechtig, A., 0-P. Habicht, C. Yarbrough, et al. Influence offood supplementation during pregnancy on birth weight in ruralpopulations of Guatemala. pp. 44-52. In: A Chavez, H. Bourges,and S. Basta, (eds.). Nutrition. Vol. 2. Basel: S. Karger,1975.
27. Lechtig, A., 0-P. Habicht, H. Delgado, et al. Effect of foodsupplementation during pregnancy on birthweight. Pediatrics, 56:508-520, 1975.
28. Federer, W.T. Experimental Desigfl. New York: MacMillan, 1963.
29. Davis, C.E. The effect of regression to the mean in epidemi-ologic and clinical studies. Am. 0. Epidemiol., 104: 493-498,1976.
30. Habicht, 0-P., C. Yarbrough, and R.E. Klein. Assessing nutri-tional status in a field study of malnutrition and mental devel-opment: specificity, sensitivity, and congruity of indices ofnutritional status. pp. 35-42. In: 0. Cravioto, L. Hambraeus,and B. Vahlqvist, (eds.). Early Malnutrition and MentalDevelopment. Symposia of the Swedish Foundation, Vol. XII.Uppsala: Almqvist and Wiksells, 1974.
31. Habicht, 0-P., C. Yarbrough, A. Lechtig, and R.E. Klein. Rela-tion of maternal supplementary feeding during pregnancy to birthweight and other sociobiological factors. pp. 127-145. In: M.Winick, (ed.). Nutrition and Fetal Development. New York:Wiley Interscience, 1974.
35

32. Butz, W.P., and i-P. Habicht. The effects of nutrition andhealth on fertility: hypotheses, evidence and interventions.pp. 210-238. In: R.G. Ridker, (ed.). Population andDevelopment. Baltimore: Johns Hopkins University Press, 1976.
33. Jelliffe, D.B. The Assessment of the Nutritional Status of theCommunity (With Special Reference to Field Surveys in Developjj~Regions of the World). pp. 3-27. WHOMonograph Series No. 53.Geneva: World Health Organization, 1966.
34. Gordon, J.E., and N.S. Scrimshaw. Field evaluation of nutritionintervention programs. World Rev. Nutr. Diet., 17: 1-38, 1973.
35. Beaton, G.H., and J.M. Bengoa. Nutrition in Preventive Medicine.WHOMonograph Series No. 62. Geneva: World Health Organization,1976.
36. Habicht, 0-P., R. Martorell, C. Yarbrough, et al. Height andweight standards for preschool children. Lancet, 1: 611-615,1974.
37. Hansman, C. Anthropometry and related data. pp. 101-154. In:R.W. McCammon, and V.E. Beales, (eds.). Human Growth andDevelopment. Springfield: Charles C. Thomas, 1970.
38. United Nations. Demographic Yearbook 1974. New York: UnitedNations, 1975.
39. Martorell, R., A. Lechtig, C. Yarbrough, et al. Protein-caloriesupplementation and postnatal physical growth: a review offindings from developing countries. Arch. Latinoamer. Nutr., 26:115-128, 1976.
40. Yarbrough, C., 0-P. Habicht, R. Martorell, et a]. Anthropometryas an index of nutritional status. Adv. Exp. Med. Biol., 49: 15—26, 1974.
41. Habicht, 0-P., C. Yarbrough, A. Lechtig, and R.E. Klein. Rela-tionships of birthweight, maternal nutrition and infant mor-tality. Nutr. Rep. Int., 7: 533-546, 1973.
42. Habicht, 0-P., A. Lechtig, C. Yarbrough, and R.E. Klein. Theeffect on birth weight of timing of supplementation during preg-nancy. p. 71. In: P. Arroyo et aL, (eds.). Sumaria - IXInternational Congress of Nutrition. Mexico, 1972.
36
THE IMPACT OF IMPROVEDWATERSUPPLIES AND
EXCRETA DISPOSAL FACILITIES ON DIARRHEAL
MORBIDITY, GROWTHAND MORTALITY AMONGCHILDREN’
Steven A. Esrey2 and Jean-Pierre Habicht2
1Supported in part by USAID grant number OTR-2199 and the CornellNutritional Surveillance Program Cooperative Agreement No. AID DSANCA-0240 between USAID and Cornell University.
2Division of Nutritional Sciences, Savage Hall, Cornell University,Ithaca, NY 14853.
The authors express appreciation to Maureen Lewis (USAID) for usefulsuggestions, Penny Spingarn for editorial assistance, and Marilyn Wardand Elaina Oeddry for manuscript preparation.
37
ABSTRACT
Many studies have tried to associate water supply and sanitationfacilities with health status. The published results are confusingand contradictory. This review examined the nature of the relation-ship between poor water and sanitation and diarrheal morbidity, growthfaltering and mortality in children by systematically assessing theavailable reports according to their research design and health out-come. The evidence shows that improving excreta-disposal facilitieshas been more effective than improving water supplies for loweringdiarrhea] morbidity and mortality rates and improving children’sgrowth. Water supply improvements by themselves appear to havelimited effectiveness in improving health. A conceptual framework hasbeen developed to reduce methodological problems when evaluating ex-isting and future water or sanitation programs.
38
BIOLOGICAL LINK BETWEENWATER, EXCRETA DISPOSAL, AND CHILD HEALTH
Diseases related to poor excreta-disposal facilities and inade-quate or contaminated water, especially diarrheal diseases, are stilla major health problem in the less-developed countries. Diarrhea]diseases impose a heavy toll in terms of the number of children af-fected and the severity of the consequences. From 500 million to 1billion episodes of diarrhea occur annually among African, Asian, andLatin American children (1). Diarrhea leading to dehydration, elec-trolyte imbalance, and sometimes fever is the major cause of death inyoung children: estimates range from 3.9 to 18 million deaths peryear (1, 2). Diarrhea may also debilitate children slowly throughanorexia, improper feeding, decreased absorption of nutrients, andincreased catabolism. Growth faltering or, ultimately, death mayoccur if the effects of diarrhea are severe and protracted.
Most of the pathogenic agents causing diarrhea in infants andchildren are transmitted via the fecal-oral route. That is, fecalpollution of the environment leads to the oral ingestion of pathogenicagents. The fecal-oral route is also the pathway of some non-diarrhea] disease agents, such as poliomyelitis and Ascarislumbricoides. Inadequate waste disposal is associated with all ofthese diseases (figure 1).
Poor water quality and availability are also related to thepersistence of diarrheal diseases. Contaminated water is thought tobe mainly responsible for the spread of cholera, typhoid, andgiardiasis. These diseases are called water-borne diseases (3, 4),because water is the vehicle for transmission for the disease agents,although they can also be transmitted by contaminated food and hands.Pathogens leading to diarrhea but related more to water availabilityare Shigella, Entamoeba histolytica, enterovirus, and rotavirus.These diseases are called water-washed diseases (3, 4) because it islikely that contamination of food, utensils and hands by these diseaseagents would be prevented if there were sufficient water, even of poorquality, for washing.
Improvements in water and sanitation are thought to affecthealth, mainly by reducing the ingestion of fecal-oral pathogens(figure 1). However, this is not always the case. For instance,hookworm infection, which may affect child growth, will not be af-fected by improvements in water alone, but may be reduced by sanita-tion improvements. On the other hand, water supply improvements maylead to improved health through home gardening, improved child care asa result of time savings, or other income generating activities.However, figure 1 does conform to the fact that reducing diarrhea isprobably the major mechanism whereby children’s health can beimproved. Therefore, this paper examines this mechanism in detail.
39
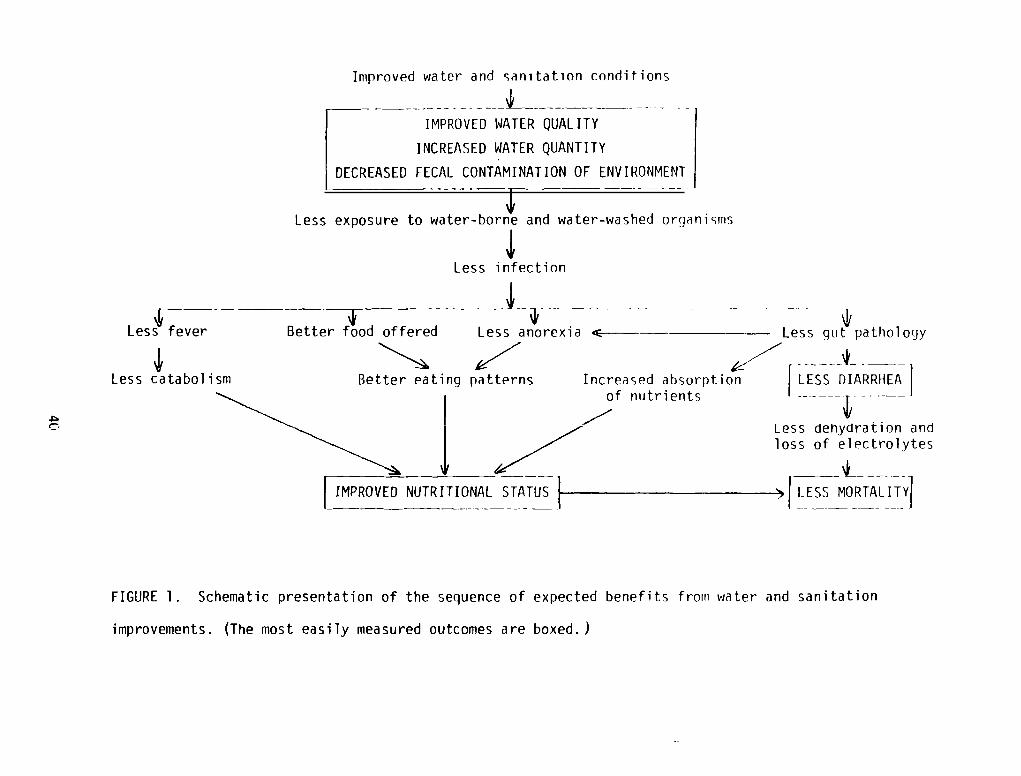
Improved water and sanitation conditions
IMPROVED WATERQUALITY
INCREASED WATERQUANTITY
LDECREASED FECAL CONTAMINATIONOF ENVIRONMENT
Less exposure to water-borne and water-washed organisms
‘ii,Less infection
Better eating patterns
IMPROVEDNUTRITIONAL STATUS 1-
LESS DIARRHEA
LeSS dehydration andloss of electrolytes
LESS MORTALITY}
FIGURE 1. Schematic presentation of the sequence of expected benefits from water and sanitation
Less fever Better food offered
‘II,Less catabolism
Less anorexia ~ Less gut pathology
Increased absorptionof nutrients
improvements. (The most easily measured outcomes are boxed. )
The United Nations has launched a worldwide effort to break thefecal-oral transmission of diarrheal diseases by declaring the l98Osto be the International Drinking Water Supply and Sanitation Decade(5). The intention is to provide everyone with access to safedrinking water and waste-disposal facilities by 1990. This task isformidable, because of the great number of people who need this ser-vice, and because of the great cost. In 1975 only an estimated 22percent of the rural population in less-developed countries, excludingChina, had access to safe water, and only 15 percent had access toadequate waste disposal (6). Urban areas were somewhat better off:77 percent of the people had access to safe water and 75 percent hadaccess to adequate waste disposal. Thus, improved water and sanita-tion facilities need to be extended to 500,000 people a day during the1980s in order to achieve the U.N. goal. The cost of accomplishingthis within 10 years has been estimated at $60 billion for adequateworldwide water supplies and $300-600 billion for sanitation (7). Theper-capita cost is $200-400, a cost that exceeds the yearly per-capitaincome of most of those in need.
Investments of this magnitude could be justified by showing thatsuch improvements in water and sanit~tion have been cost-effective.These calculations are difficult to do with any precision becauseestimates of effectiveness are elusive. Despite the fact that thesteps needed to determine cost-effectiveness appear to be straight-forward, the true benefits of water and sanitation improvements arenot known. This review evaluates the published studies that havelooked at improvements in water and sanitation in terms of healthbenefits--specifically, lower morbidity and mortality, and bettergrowth in children.
FOCUS OF REVIEW
The review evaluates published studies examining water and/orsanitation conditions that quantified differences in diarrhea] mor-bidity or specific pathogens, nutritional status, or mortality. Im-proved sanitation measures include the provision of flush toilets andpit latrines. Improved water supplies include taps and handpumps.All of these improvements can be installed at the community or house-hold level. The review attempts to be exhaustive of all studies since1950; however, in a few cases, the data were too difficult to obtainor were too meager. Some of the studies included did not specificallyanalyze water or sanitation conditions but provided information onthese conditions and health.
For review, all of the studies considered are categorized ac-cording to health outcome: diarrhea] or pathogen morbidity (table 1),nutritional status (table 2), or mortality (table 3). The tablessummarize the location, type of comparison, ages of children studied,and the results reported. The review section highlights only selectedstudies, to exemplify major methodological and design issues, thatcould explain the results--whether positive, negative, or inconclu-sive. These issues form the basis in the discussion section for
41
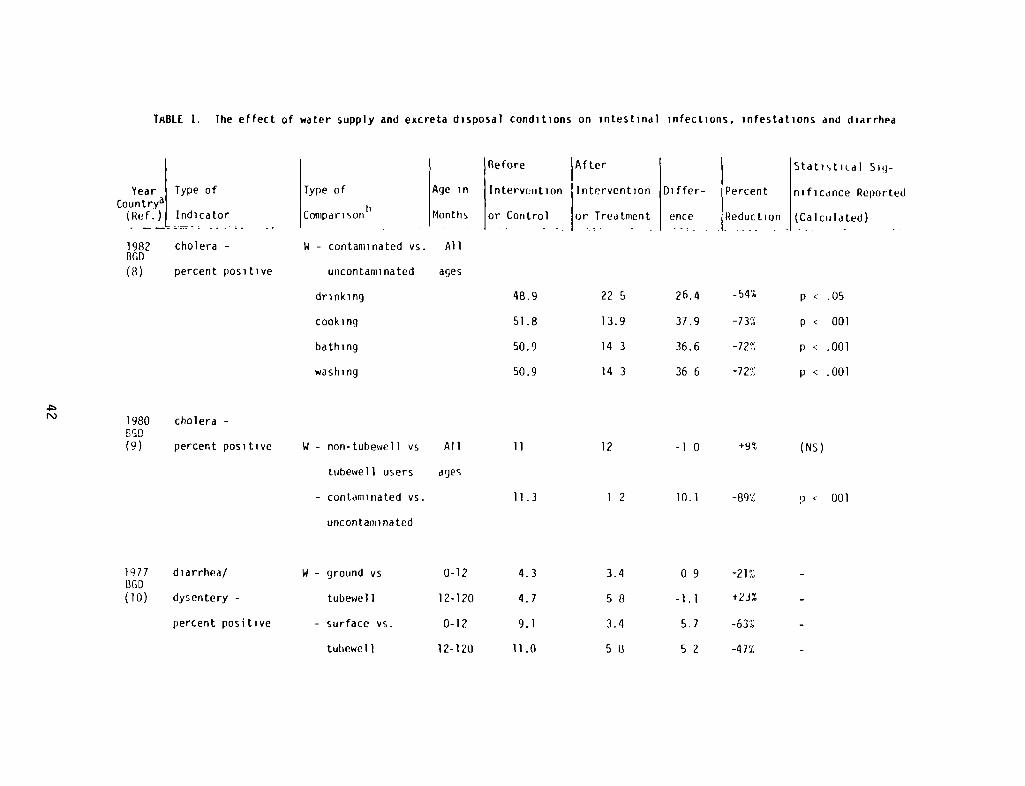
TRBLE 1. The effect of water supply and excreta disposal conditions on intestinal infections, infestations and diarrhea
Type of
Comparisorib - - -
W - contaminated vs. All
uncontaminated ages
drinking
cooking
bathing
washing
Statistical Sg-
Percent nificance Reported
Reduction - (Calculated)
Before After
Age in Intervention Intervention Differ-
Months or Control or Treatment ence
i\)
Year Type ofCountrya
(Ref.) Indicator
1982 cholera -
BGD
(8) percent positive
1980 cholera -
(9) percent positive
1977 diarrhea!BGD(10) dysentery -
percent positive
-54%
-73%
-72%
-72%
22 5
13.9
14 3
14 3
12
p .05
p < 001
p < .001
p < .001
26.4
37.9
36.6
36 6
-l 0
48.9
51.8
so.~
50.9
11
11.3
4.3
4.7
9.1
11.0
W - non-tubewell vs
tubewell users
- contaminated vs.
uncontaminated
W - ground vs
tubewel 1
- surface vs.
tutiewel 1
+9% (Ns)All
ages
0-12
12-120
0-12
12-120
1 2 10.1 -89% P 001
3.4
58
3.4
5 II
09
—1.1
5J
52
-21%
+23%
-63%
-47%
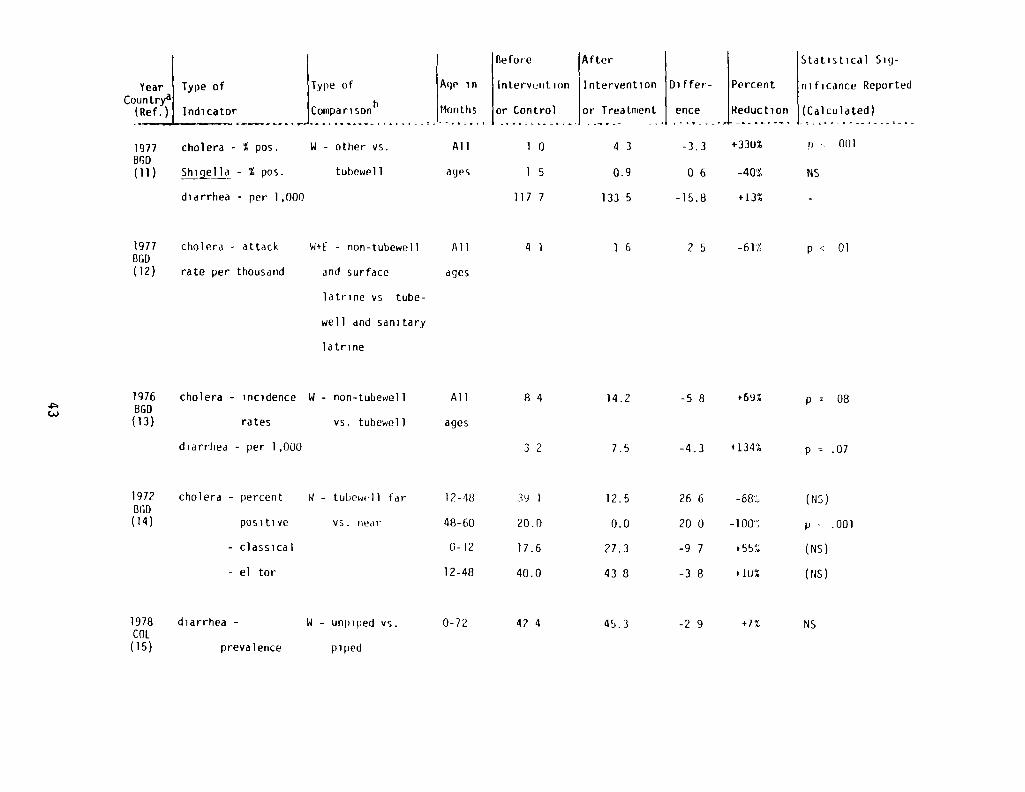
Before (After
Year Type of Type of Age in Intervention Intervention Differ-Countr? h
(Ref.) Indicator Comparison Months or Control or Treatment ence
1977 cholera - % pos. W - other vs. All 1 0 4 3 -3.3BOD(11) ~Jj~lla - % pos. tubewell ayes 1 5 0.9 0 6
diarrhea - per 1,000 117 7 133 5 -15.8
Percent
Reduction
+ 330%
-40%
t13%
a(‘-I
Statistical Sig-
nificance Reported
(Calculated)
p 0(11
MS
p c 01
p = 08
p = .07
(Ns)
p . .001
(NS)
(ris)
1977BGD(12)
cholera - attack
rate per thousand
W+E - non-tubewell
and surface
All
ages
4 1 1 6 2 5 -61%
latrine vs tube-
well and sanitary
latrine
1976860
(13)
cholera - incidence W - non-tubewell
rates vs. tuhewell
All
ages
8 4 14.2 -5 8 +69%
diarrhea - per 1,000 3 2 7.5 -4.3 +134%
1972860
(14)
cholera - percent 8 — tubewell far
positive vs. near
12-48
48-60
- classical 0-12
- el tor 12-48
1978COL
(15)
diarrhea - W - unpiped vs.
prevalence piped
0-72
3Y 1 12.5 26 6
20.0 0.0 20 0
17.6 27.3 -9 7
40.0 438 -38
42 4 45.3 -2 9
- 68~
-l00~
+55%
+ 10%
+1% MS
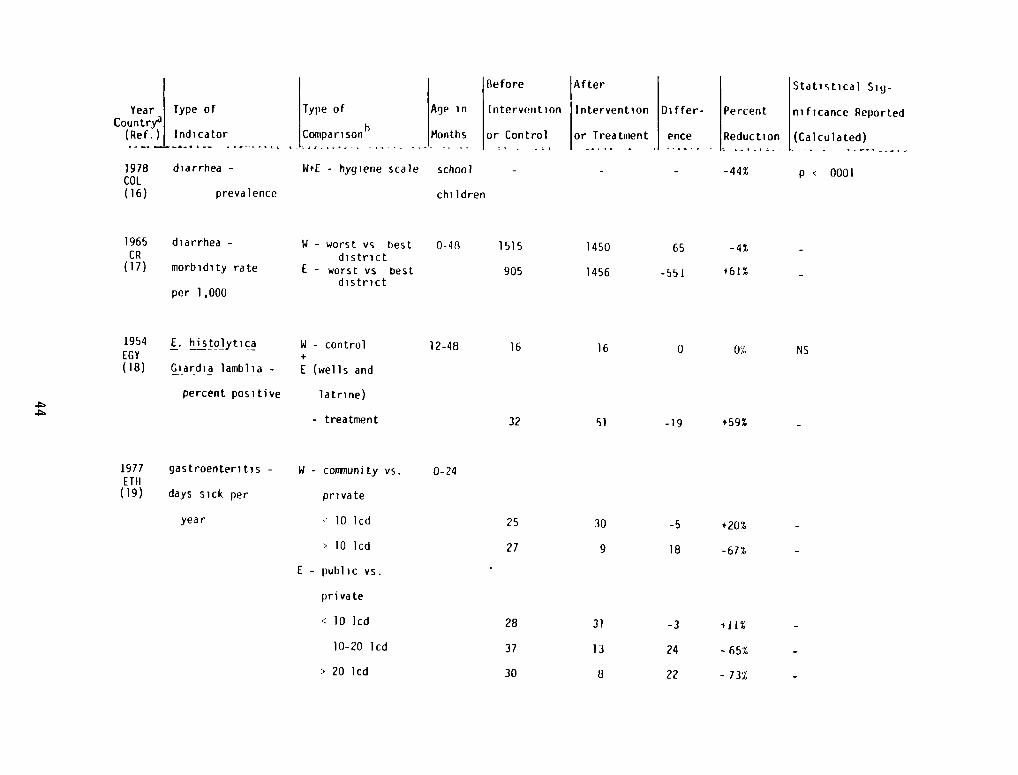
1965 diarrhea -
CR(17) morbidity rate
per 1,000
W - worst vs bestdistrict
I - worst vs Destdistrict
1954 E. histolyticaEGY
(18) Giardia lamblia —
percent positive
W - control+
I (wells and
latrine)
- treatment
W - coirinunity vs.
private
10 lcd
> 10 lcd
E - public vs.
private
< 10 lcd
10-20 lcd
> 20 lcd
-5
18 -67%
JYear Type of
Country~(Ref.!L Indicator
Type of
hComparison
Age in
Months
Before
Intervention
or Control
V~”te~Intervention
or Treatiuient
Differ-
ence
1978 diarrhea - W+E - hygiene scale school - - -
COL(16) prevalence children
Statistical Sig-
nificance Reported
(calculated) -
p < 0001
Percent
Reduc ti on
-44%
-4%
+61%
0-48 1515 1450 65
905 1456 -55!
.~
12-48
0-241977 gastroenteritis -
I TB(19) days sick per
year
0 0% NS
-19 +59% -
16 16
32 51
25 30
27 9
28 31 -3 i-jj%
37 13 24 -65%
30 8 22 -73%
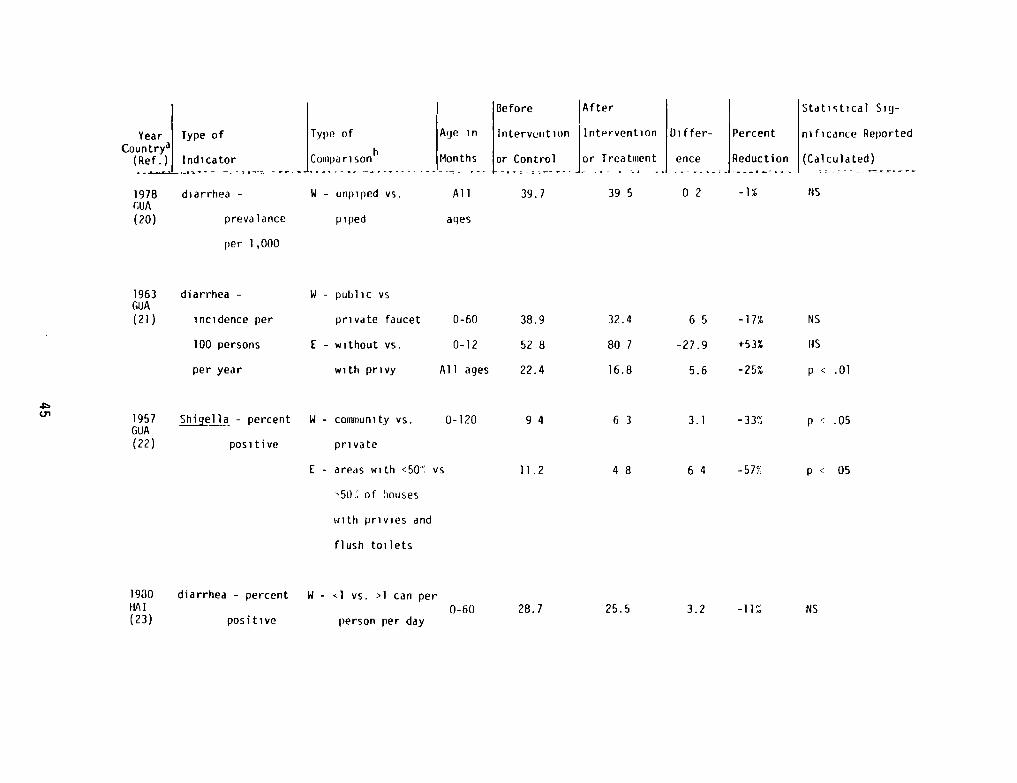
I Before After Statistical Sig-
Year Type of Type of Age in Intervention Int*-~rvention Differ- Percent nificance ReportedCountryàl h
(Re~~jIndicator Comparison Months or Control or Treatuiient ence Reduction (Calculated)
1978 diarrhea - W - unpiped vs. All 39.7 39 5 0 2 -1% NSGUA(20) prevalance piped ages
per 1,000
1930 diarrhea - percent W - ~l vs. >1 can perHAl(23) positive person per day
01
1963GIJA(21)
diarrhea -
incidence per
W - public vs
private faucet
100 persons E - without vs.
per year with privy
1957GUA(22)
~~~l1a - percent
positive
W - community vs.
private
I - areas with <50~’vs
‘50~of houses
with privies and
flush toilets
0-60 38.9 32.4 6 5 -17% NS
0-12 52 8 80 7 -27.9 +53% F1S
All ages 22.4 16.8 5.6 -25% p < .01
0-120 9 4 6 3 3.1 -33%
11.2 4 8 6 4 -57% p 05
0-60 28.7 25.5 3.2 -11% NS
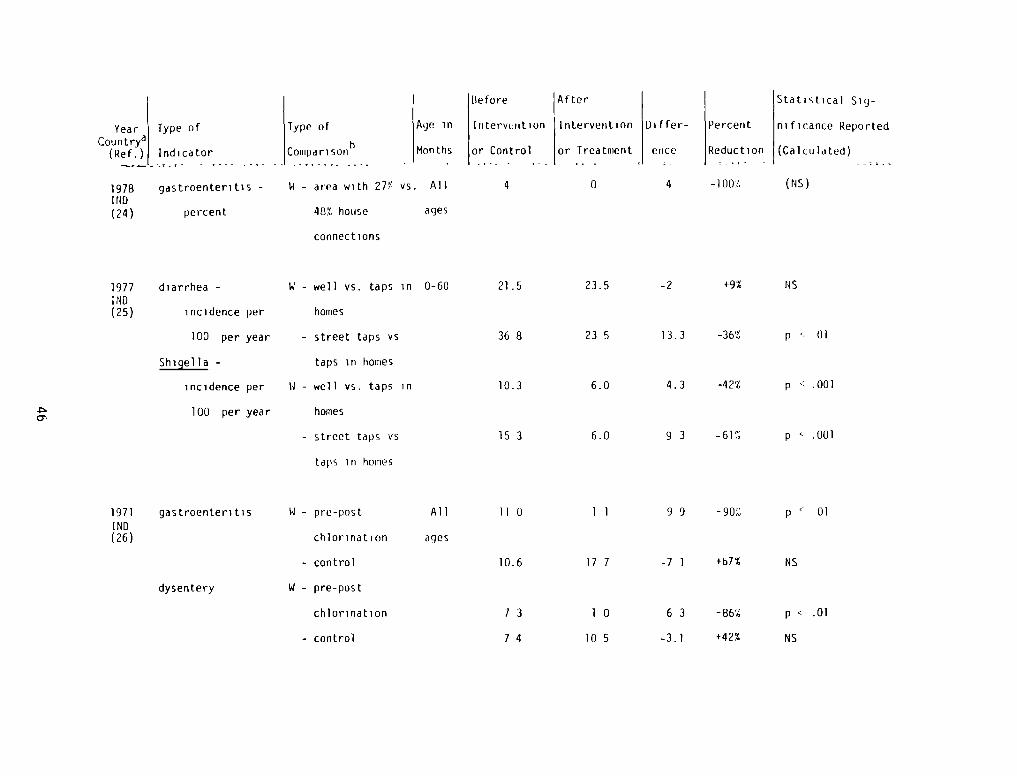
Year Type ofCountry’~
(Ref.) Indicator
1978 gastroenteritis -
I ND(24) percent
Type of
h
Coiupari son
W - area with 27%
48% house
connections
Before After
Age in Interveiution Intervention Differ- Percent
Months or Control or Treatment ence Reduction
vs. All 4 0 4 -100%
ages
Statistical Sig-
ni ficance Reported
(Calculated) - -
(NS)
1977 diarrhea -
I ND(25) incidence per
100 per year
Shigella -
incidence per
100 per year
1971 gastroenteritisIND(26)
dysentery
0-60
All
ages
W - well vs. taps in
homes
— street taps vs
taps in homes
W — well vs. taps in
homes
— street taps vs
taps in homes
W -
chlorination
- control
W - pre-post
chlorination
- control
21.5
36 8
10.3
15 3
11 0
10.6
73
74
23.5
23 5
6.0
6.0
11
17 7
10
10 5
-2 +9% NS
13.3 -36% p 01
4.3 -42% p .001
9 3 -61% p ~- .001
9 9 -90% p c 01
-7 1 +b7% NS
6 3 -86% p < .01
-3.1 +42% NS
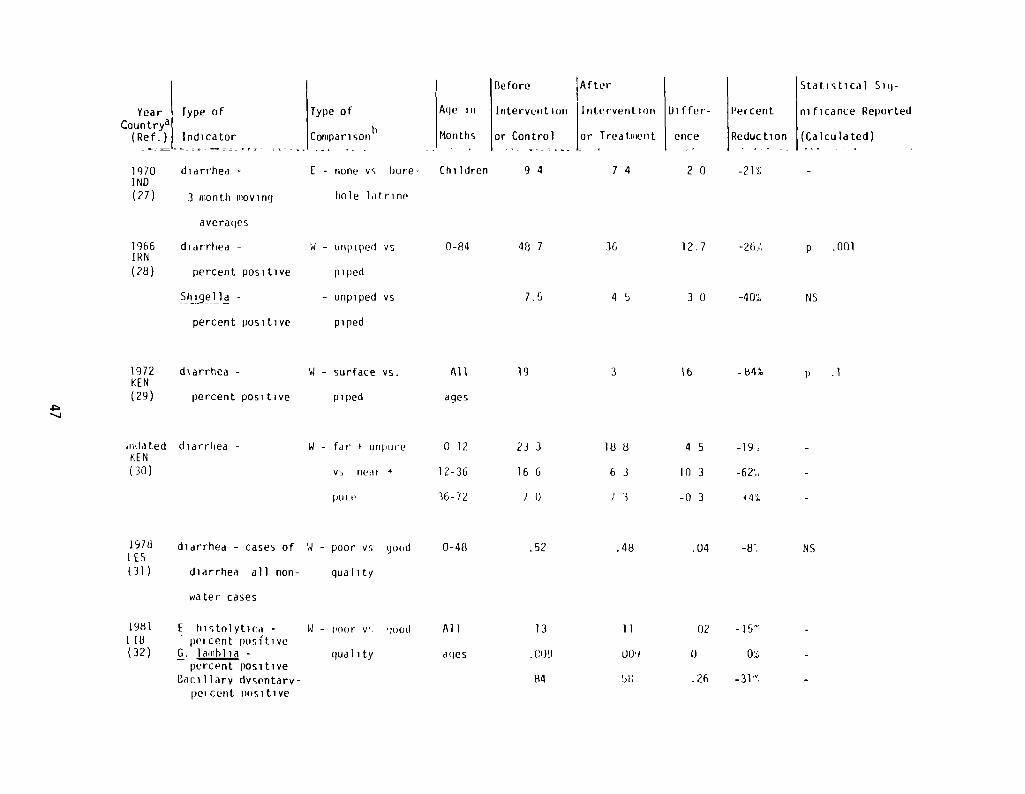
Year Type ofCountrya
(Ref.) Indicator
1970 diarrhea -
INO(27) 3 month moving
averages
1966 diarrhea -
IRN(28) percent positive
percent positive
1978 diarrhea - cases of
(31) diarrhea all non-
water cases
1981 E histnlytica -
LID - percent positive(32) G. laiiiblia -
percent positiveBacillarv dvsentarv-
per cent nositive
W - surface vs.
piped
All 19
ages
Type of
b
Comparison
I - none vs bore-
hole latrine
Before ~After
Age in Intervention lntt~rvention Differ- Percent
Months or Control or Treatment ence Reduction
Children 9 4 7 4 2 0 -21%
48 7 36
Statistical Sig-
nificance Reported
(Calculated)
W — Ull]) ipe(i vs 0-84
piped
- unpiped vs
piped
1972 diarrhea -
KEN(29) percent positive
iida ted diarrhea -
KEN(30)
W - far + unplire
vs neat +
I)Ut
127 -26/ p .001
7.5 4 5 3 0 -40% NS
3 16 -84% p .1
23 3 18 8 4 5 -l9~
16 6 6 3 10 3 -62/
7 1) / 3 -0 3
.52 .48
0-12
12-36
36-7%
N - poor vs ~joud 0-48
qua] ity
11 — nor v~ IUOd
quality
Al 1
ages
.04 -8/ NS
13 11 02 -]5~
(~)9 (J(J~) 1) 0%
84 hh .26 -31%
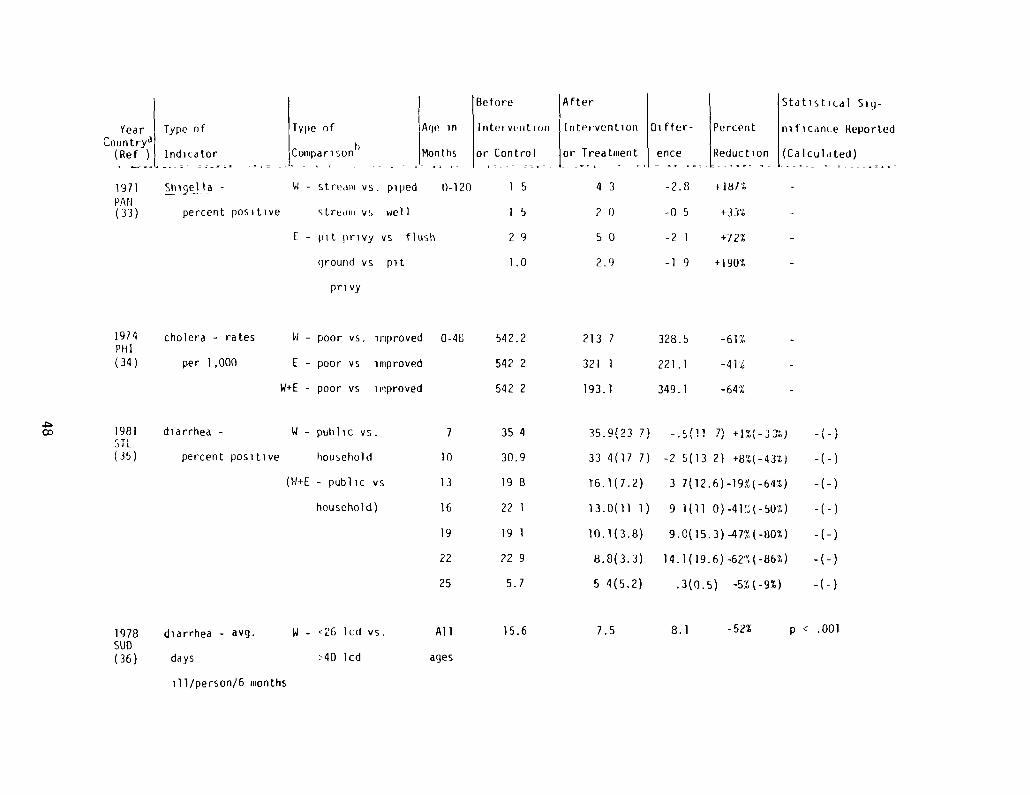
Type of Age in
Comparisonh Months
N - stream vs. piped 0-120
s tredill vs wel F
E - pit privy vs flush
diarrhea -
percent positive
7 35 4
10 30.9
13 198
16 221
19 191
22 229
25 5.7
AfterIntervention Differ- Percent
or Treatment ence Reduction
4 3 -2.8 +18/%
2 0 -0 5 +33%
50 -21 +12%
2.9 -l 9 +190%
35.9(23 7)
33 4(17 7)
T6. 1(7.2)
13.0(11 1
10.1(3.8)
8.8(3.3)
5 4(5.2)
-.~(l1 7) +1%(-33%)
-2 5(13 2) +8%(-43%)
3 7(12.6)-l9%(-64%)
9 1(11 0)-4l%(-s0%)
9.0(15.3) -47% (-80%)
14.1(19.6) -62%(-86%)
.3(0.5) -5%t-9%)
I ~—I’—)
-(-)
-( -)
Stdtisti(.dl Siq-
nificanLe Reported
(Calculated) -
Before
I n ter yr I t 1(111
or Control - -
15
15
29
1.0
542.2
542 2
542 2
ground vs pit
privy
N - poor vs. improved 0-48
I - poor vs improved
W+E - poor vs improved
Year Type ofCountrya
(Ref ) Indicator
1971 Shi~eHo -
PA N(33) percent positive
19/4 cholera - ratesPHI(34) per 1,000
1981~IL
(35)
1978SUB(36)
213 7
321 1
193.1
328.5
221 .1
349.1
-61%
-41%
-64%
N - pubhc vs.
house ho 1 d
(w+E - public vs
household)
W - <26 lcd vs.
>40 lcd
diarrhea - avg.
days
ill/personl6 months
Al 1
ages
15.6 7.5 8.1 -52% p < .001
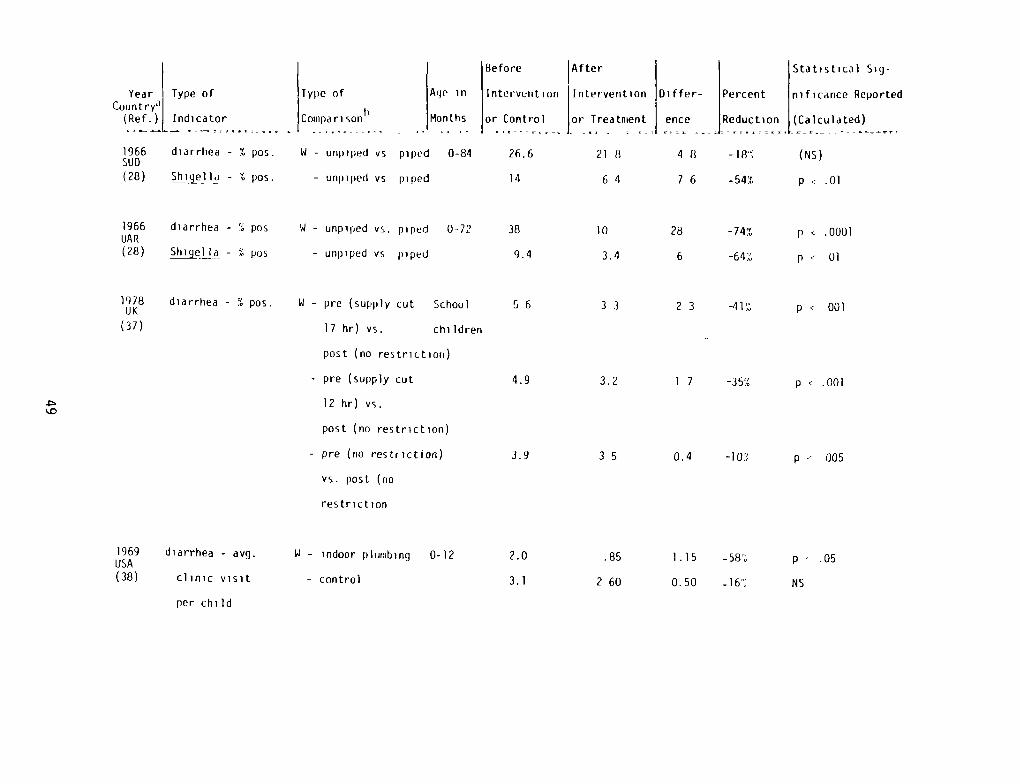
Year Type ofCount ry”I
(Ref.!L Indicator
1966 diarrhea - % pos.SU D(28) Shiq~e1la - % pos.
After
Intervention Differ-
or Treatment ence
218 48
64 76
Stat,stcal Sig-
Percent nificance Reported
- Reduction (Calculated)
-18% (NS)
-54% p .01
1966 diarrhea -
UAR(28) ~j~lIa -
1969 diarrhea - avg.USA(38) clinic visit
per child
N - pre (supply cut
17 hr) vs.
post (no restriction)
- pre (supply cut
12 hr) vs.
post (no restriction)
- pre(no restriction)
vs. post (no
restriction
Type of
t)
Coiiipari son
W - unpiped vs
- unpiped vs
Age in
Mon ths
piped 0-84
piped
Before
Interverit ion
or Control
26.6
14
%
%
N - unpiped vs. piped 0-72
- unpiped vs piped
1978UK
(37)
diarrhea — 5 pos. School
children
38 10 28 -74% p < .0001
9.4 3.4 6 -64% p .- 131
5 6 3 3 2 3 -41% p < 001
4.9 3.2 1 7 -35% p < .001
3.9 3 5 0.4 -10% p 005
.85 1.15 -58/ p . .05
2 60 0.50 NS
W - indoor plumbing 0-12
- control
2.0
3.1
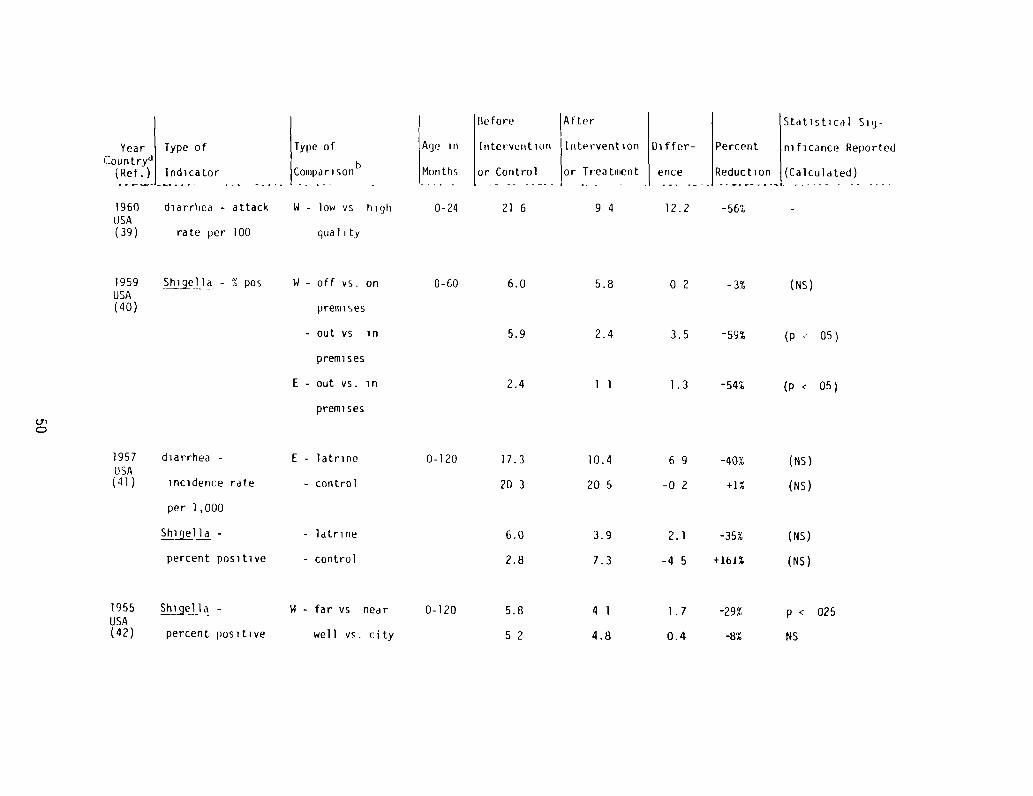
Before After
Interveiiti()nt Itrtr~rvention
or Control or Treatiiient
21 6 9 4
1957 diarrhea -
USA(4]) incidence rate
per 1,000
1955 ~~i~geF1 -
USA(42) percent positive
N - off vs. on
pretrir ses
- out vs in
premises
E - out vs. in
premises
Year Type of Type of Age inCountry~
(Ref.) Indicatorh
Coniparisori Months
1960 diarrhea - attack N - low vs high 0-24USA(39) rate per 100 quality
1959USA(40)
- S ~05
Statistical Siy-
Differ- Percent nificance Reported
ence Reduction (Calculated)
12.2 -56% -
01
0-60 6.0 5.8 0 2 -3% (Ns)
5.9 2.4 3.5 -59% (p 05)
2.4 1 1 1.3 -54% (p < 05)
17.3
20 3
Sh~j~ -
percent positive
E - latrine 0-120 10.4 6 9 -40% (NS)
- control 20 5 -0 2 +1% (NS)
- latrine 6.0 3.9 2.1 -35% (NS)
- control 2.8 7.3 -4 5 +161% (NS)
N - far vs near 0-120 5.8 4 1 1.7 -29% p < 025
well vs. city 5 2 4.8 0.4 -8% NS

Before Statistical Sig-
Intervention Differ- Percent riificance Reported
or Control1or Treatment ence Reduction (Calculated)
5.8 3.0 2.8 -48% (p .05)
Year Type of Type of Age inCountry
1 h(Ref.) Indicator Comparison Months
1955 ShijelIa W - out vs. in homes 0-120USA(43) -% individuals (unmatched)
positive - out vs. in hoiiies
(matched)
— out vs. in home
(unmatched)
1953 ~!i!a~iia - W - >15 vs <15 0-120 9 2 5.3 3.9 -42% p .0001USA(44) percent positive people per faucet
(out of home)
8 - unpiped vs piped 0-84
— unpiped vs. piped
1976 338 212 126 -37%2AM(45)
a Country code BuD = Bangladesh, BRA Brazil, CDL = Colombia, CR = Costa Rica, EGY = Egypt, ETH = Ethiopia, FIJ =
Fiji, GUA = Guatemala, HAL = Haiti, IOU India, LRN = Iran, KEN = Kenya, LES = Lesotno, 118 = Libya; MAL = Malaysia,MG = Nigeria, PAN = Panama, PHI = Philippines. SRI = Sri Lanka, STI = St. Lucia, SUD = Sudan, UAR = United ArabRepublic, UK = United Kingdom, USA = United Stales, YEN = Venezuela, LAM = Zambia.
b W watri supply, I - excreta di~pnsal
5 9 1.2 4 7 -80% (p c 05)
11.0 6.2 4.8 -44% (p c .05)
43 39 4 -9t 145
7 6 3 0 4 6 -61% p 001
lAfter
-% families
positive
U,
1966 diarrhea - % pos.V F N(28) Shigeila - % P05
diarrhea - % clinic
cases/i ,000
N — unpiped vs. piped All
ages
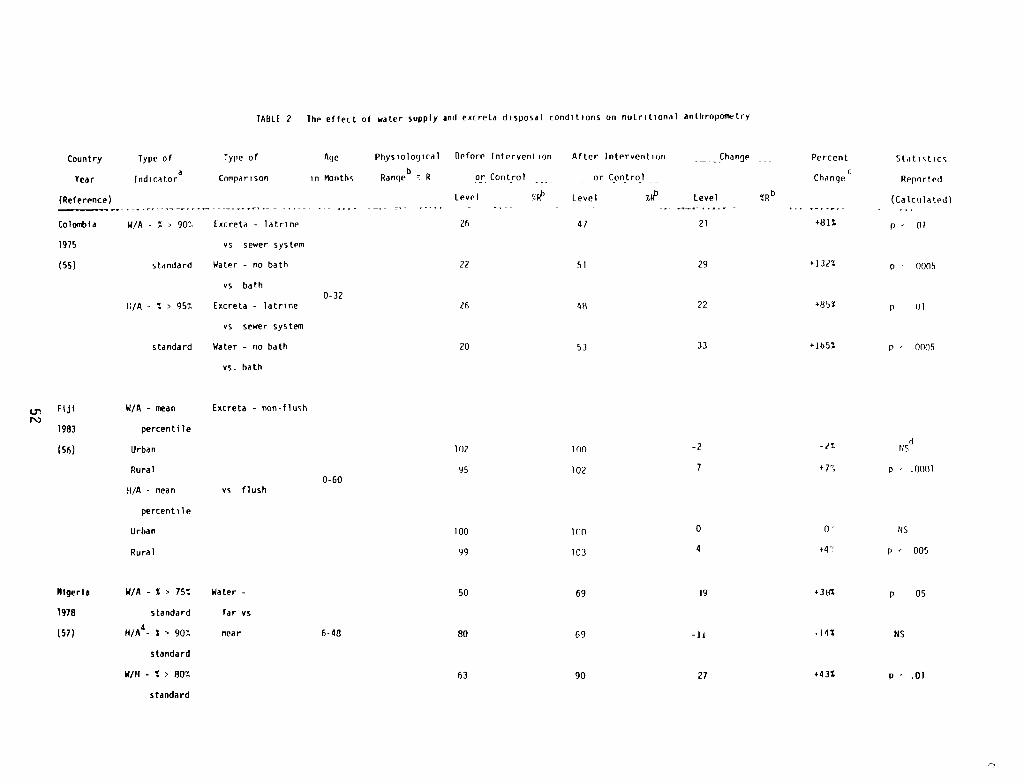
TABLE 2 The effect of water supply and eucreta disposal conditions on nutritional anthropometry
Country Type of Type of
Year Indicatora Comparison
(Reference I
Colombia W/A - S 90 Excreta - latrine
1975 vs sewer system
(55) standard Water - no bath
vs bath
1:/A - 5 95% Excreta - latrine
vs sewer system
standard Water - no bath
vs. bath
Age Physiological Before Intervention
in Months pangeb R or Control
level
0-32
26
22
/6
20
Fiji
1983
(561
W/A - n~an
percentile
Excrete - non-flush
After Intervention Change Percent Statistics
or Control cChange Reported
Level tiP Level SR6 (Calculated)
47 21 +131% p 01
51 29 +132% p - 0005
48 22 +85% p (ii
53 33 +165% p - 0005
100 —2 —/~ dUS
102 p .0001
100 0 0’ US
103 4 +4~ p — 005
Urban 102
Rural
14/A mean vs flush0-60
95
percentile
Urban 100
Rural 99
Nigeria W/A - S 75% Water - 50 69 19 36%
1918 standard far vs
(57) H/A4- 5 90% near 6-48 80 69 -1! -145
standard
W/H - S 80% 63 90 27 .435
p 05
MS
p .01
standard
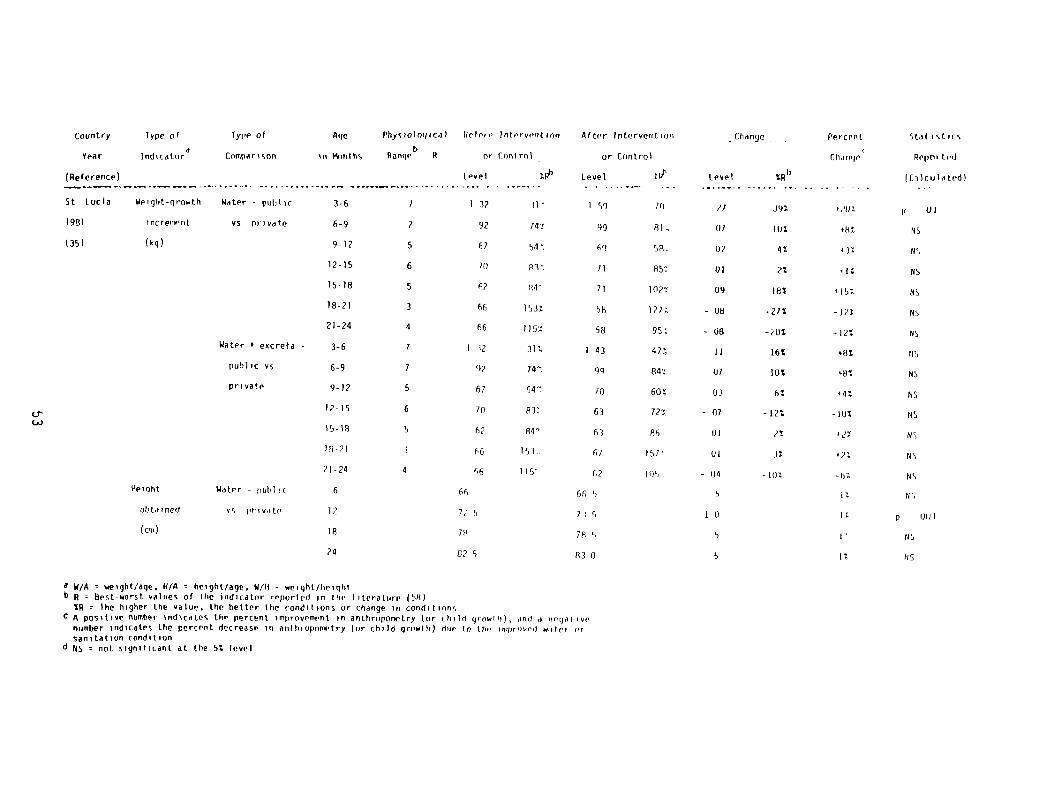
country Type of Type of Age Physiological Urtoie liitervi’iition After Initerveritioo change -- Percent Stat stirs
a V/A = weight/age. H/A = height/age, W/ll = weight/heightb R = Best-worst values or the indicator reported in the I iterature (58)
Ihe higher the value, the better the conditions or change in conditionsC A positive number indicates the percent improvement in anthropcvnrtry (or child grow! ii), and a negative
number indicates the percent decrease in aotln oprinwtry (or chi 3d growth) ilue In the in’pr’n’ed waici sir
sanitation condition~ 65 not significant at the St level
Year lndicator~ comparison in Months P or Print mi or Control Ph 1090
(Reference)
5t Lucia Weight-growth Water . public
193i increment vs private
(35) (kg(
Water 4 eocreta
public vs
private
Height Water - pull ic
obtained vs private
(cli)
Level tiP Level ui’ te’sel
3-6 7 I 3? 3i’ 1 59 70 ~j 395 ~/v3
6-9 2 92 74~ 99 Ri 0/ lOt ~8t9-12 5 67 54~ 69 50. 07 it viz
12-15 6 /0 833 1) R5~ 01 2% alt
is-lB 5 6? p4 7i 1027 09 18% fIst
18-71 3 66 1533 SR i27t - 08 -21% -In
21-24 4 66 l~5~ 5~ g5~ - 08 -20% -12%
3-6 7 1 32 312. 1 43 473 11 16% ~Bt
6-9 1 ‘47 741 99 843 0/ lot ~8%
9-12 5 67 547 70 601 03 6% v-4%
12-iS 6 /0 833 63 721 - 01 —lzt .~j%
15-18 5 67 84= 63 86 01 2% ilT
10-71 3 66 153. 6) IS? UI 32 v73
21-24 4 66 1W 67 1’)5 - 04 -102. -hL
Re1irirterl
(tliculated(
UI
95
145
145
145
85
145
115
145
145
laS
145
N S
us
U,,6 oh 66, 5 5 FL
12 7,5 7)5 10 IL p iJt)J
18 /8 70 5 5
24 025 830 5 US
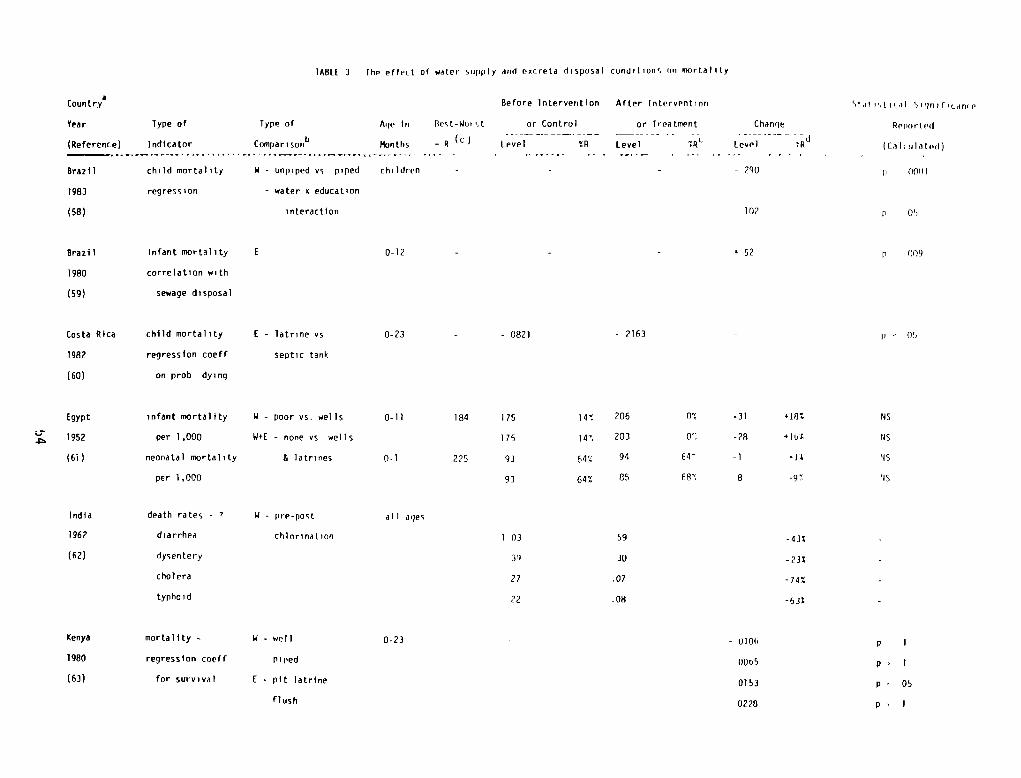
TABtL 3 the effect of water supply and oecreta disposal conditions on mortality
Coontrya
Year Type of Type of Age in Best-Woi
(Reference) Indicator Comparison6 l¾jnths = R
Brazil child mortality V - unpiped vs piped children
1983 regression - water v education
(58) interaction
Before Intervention After Intervention Stat ‘,tical Sillnifican(e
or Control
Level — YR
or
Level
Treatment
Pt
Change
tevel —
7~d
Retracted
(Cilirililed)
- - - 290 p 0001
102 p us
- - p 009
-0821 -2163 - ~= us
Brazil
1980
(sg)
Costa Rica
1982
(60)
Egypt
1952
(61)
India
1962
v 52infant mortality
correlation with
sewage disposal
child mortality
regression coeff
on prob dying
infant mortality
per 1 ,000
neonatal mortality
per 1,000
death rates -
diarrhea
0-12
0-23
0-li
0-1
all ages
0-23
E — latrine vs
septic tank
W - poor vs. wells
W+E - none vs wells
& latrines
W - pm-post
chlorination
W - well
p i lied
E - pit latrine
flush
184 175 141 206 0% -31 +18% us
175 141 203 01 -28 +Iut US
225 93 64% 94 64 -1 +11 NS
93 64% 85 681 8 -97 US
(62) dysentery
cholera
typho i d
Kenya mortality —
1980 regression coeff
(63) for survival
1 03 59 -43%
3” 30 -23%
27 .07 -74%
22 .08 -632
- 0106
0005
0153
0228
p I
p’ I
p. 05
p- I
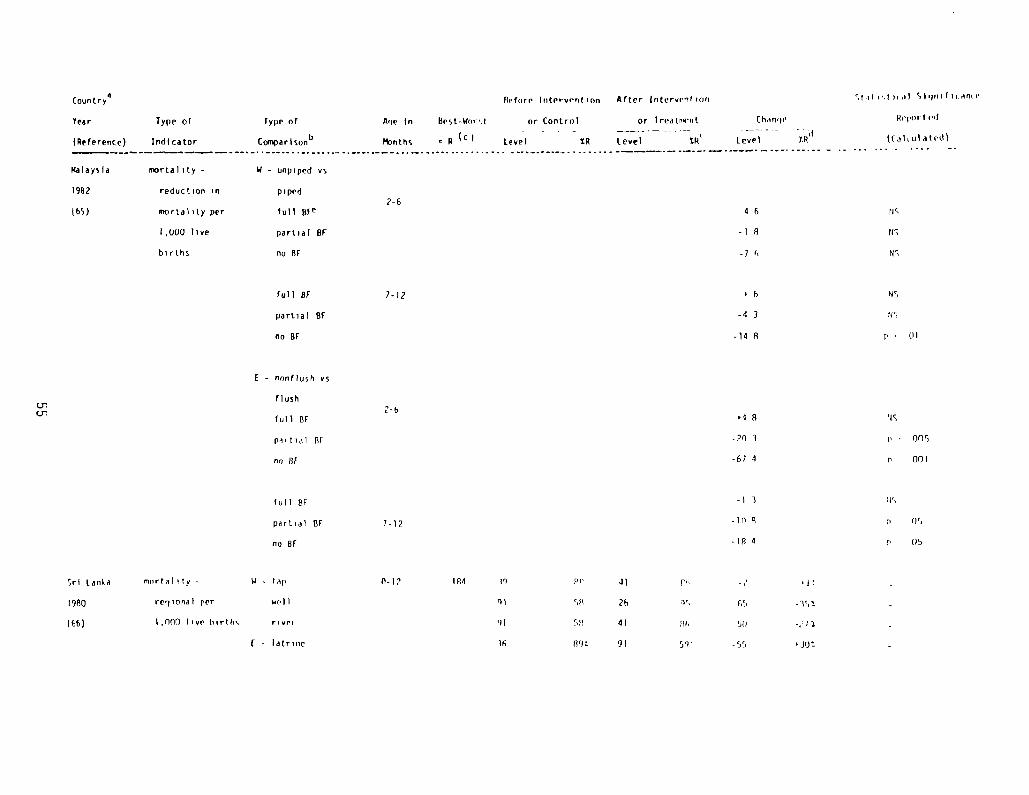
Countrya Pefore Intervention After lntervrntioo
Year Type of Type of Age in Best-Wort or Control or Treatr’eiit than’ie
(Reference) Indicator comparison” ~bnths ~ (c ( Level %R Level tR’ Level SR’1
Malaysia mortality - V - unpiped vs
1982 reduction in piped
7-6(65) mortality per full BEe 4 6
1,000 live partial BE -l 8
births no Br -7 1
full BE
partial SF
no BF
1-12
-4 3
-14 8
Stii i’,I il Slujiriticanie
Reported
([at till at id)
p45
US
US
us
US
p = UI
tic
ii = 005
p 001
ii’,
mortality -
regional per
1,000 live births
W - tap
will
r i wi-p
F - latrine
(3-I? 184 0
01
36
Crcr
t - non(l~jsh vs
2-bflush
full St +1 11
partial BE -20 3
no lit -67 4
full Br -I 3
partial St 7-12 -114 8 p 05
noBI -1/34 p 05
Sri Lanka
1980
(66)
41 )li, -? ‘It
5(1 26 ‘iS 65
5!) 41 pt 5))
R’JL 91 59’ -55 ‘Jo:
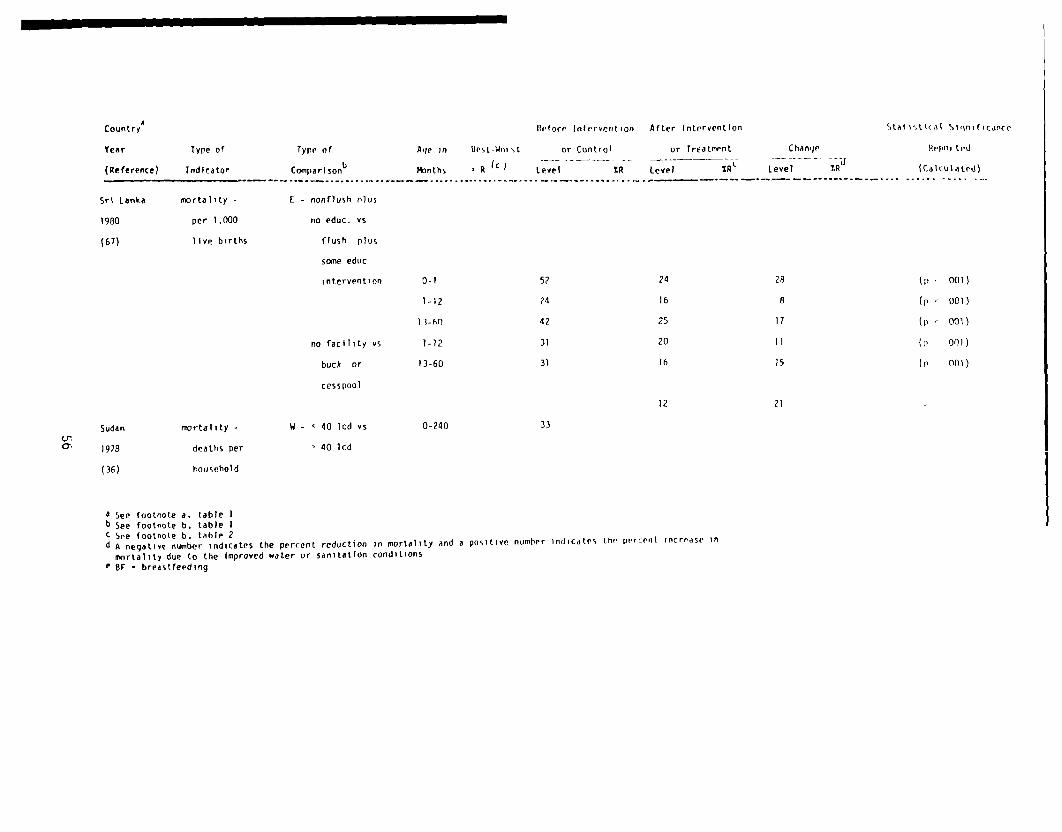
Count rya Before Intervention After Intervention Staiitical Sillnificance
Age in Best-Win st or Control or Treatment Change Hi-ported
i’tnths R (c I Level %R Level ~gt Level TR~’ (Calculated)
Year Type of
(Reference) Indicator
Type of
Coinpari son1’
Sri Lanka mortality - F - nonflush olus
1980 per 1,000 no educ. vs
(67) live births flush plus
some educ
intervention 0-1
1-12
33-op
no facility vs 1-i?
buck or 13-60
cesspool
Sudan mortality - W - < 40 lcd vs 0-240Uta 1978 deaths per 40 lcd
(36) household
a See footnote a. table 1b See footnote 6, table 1c See footnote 6. table 2d A negative number indicates the percent reduction in mortality and a positive number indicates the percent increase in
mortality due to the Improved water or sanitation conditionsC St breastfeeding
52 24 28 (p . 001)
24 16 8 (p = 0131)
42 25 17 (p = ool)
31 20 11 (p 001)
31 16 15 (p fbi)
12 21 -
33
developing an algorithm, related to the study’s design and reportedhealth associations, covering the criteria necessary for establishinga cause-effect relationship between water or sanitation and health.The studies reviewed are evaluated against these criteria to identifythose that succeed in showing the most plausible relationships.
REVIEW OF PUBLISHED RESULTS
Association of water and sanitation to diarrheal morbidity
Most studies of improvements in water and sanitation have triedto show effects on diarrheal disease or infection rates (table 1; (8-45)). The results are by no means consistent: Some studies obtainedstrong positive results; others, the reverse of the expected benefits.
A typical study is one conducted in two Indian villages in Arizona(38), one village with indoor plumbing (treatment village) and onewithout (control). Hospital admissions of infants with diarrhealdisease reportedly declined in the village where indoor plumbing wasinstalled. There are a number of major confounding issues in thisstudy, but one in particular should be noted. There was no randomassignment to the treatment group. One village simply cooperated whenthe Public Health Service wanted to construct indoor plumbing facili-ties, while the control village resisted all attempts to improvetheir condition. Therefore, the reported differences cannot be as-cribed to plumbing conditions alone. They may also be related tocharacteristics of self-selection by the participants, especiallytheir interest in or attitudes toward health.
In fact, none of the studies that have evaluated the effect ofinterventions on diarrheal morbidity, were randomized (18, 20, 26, 27,30, 31, 32, 34, 35, 38, 39, 41, 45). Yet random assignment iscrucial, for it is never possible to identify all the possible dif-ferences between comparison groups which may influence the results.Randomly assigning interventions to villages can transform the uncer-tainty about these differences into a statistical probability state-ment.
Another design problem is illustrated in a study from Guatemala(21), which reported no differences in diarrhea attack rates amonginfants from families with and without privies. On the other hand,children 1-5 years of age from families with privies were reported tohave lower attack rates than children from families without privies.But the results are inconclusive. A protracted epidemic occurredwhile the study was conducted, which the authors believe may have beenmeasles. Since measles has a high attack among infants, a measlesepidemic, unrelated to water or sanitation, may have masked results inthe infant age group.
57
Of course, it is not always possible to anticipate nonspecificproblems, such as a measles epidemic that may affect the results of astudy; nor is it always possible to identify these problems if theyoccur. But replicating the number of villages in a study can diminishthe effect of nonspecific influences. Both random assignment andreplication, neither of which can be substituted for the other, areimportant to the validity of health-intervention studies.
Studies are often compromised because health outcomes are diffi-cult to measure. A study in Haiti (23) examining diarrhea prevalenceamong children from homes using less than one can of water per personper day or more than one can of water per day reported that thebetter-off group had 11 percent less diarrhea, but the difference wasnot significant. A major problem with this study was the measurementof diarrheal disease, because the disease recall period was over 240days long. Underreporting of diarrhea increases as the recall periodlengthens (46), so in this study the dirferences between the twogroups were probably underestimated. Bias in the measure of theoutcome indicator, diarrhea, may have prevented the investigators fromfinding true differences.
Underreporting in field surv-eys is only one way that a diarrhealmorbidity indicator can mask benefits from improved water or sanita-tion supplies. A study from Lesotho (3:1) illustrates two other ways.This study examined reductions in the ratio of clinic—reported diar-rhea to all non-water-related diseases among all age groups and amongchildren under four years of age after improvement in village watersupplies. Although children from improved villages were reported tohave less diarrhea, this difference was not statistically significant.
The investigators used this ratio 1:0 provide a measure of diseasewhich was independent of differential village attendance at clinicsand population size. If children from unimproved villages werefarther from a clinic, they may have underreported diarrhea more thanthose from improved villages (47). However, if the non-water-relateddiseases were not differentially underreported, or to a lesser extent,the ratio used to compare diarrhea rates between the two villageswould underestimate true differences.
Underreporting could have also occurred even if the ratio cor-rected for village attendance and population size. That is, alldiseases, including diarrhea, could have’ been higher among childrenfrom unimproved villages. In this case, reductions in diarrhea couldhave occurred, but use of the ratio precluded finding any differences.
Negative results were obtained in a study from Bangladesh (13)that examined cholera and non-cholera diarrheal rates among familiesthat used coliform-free public tubewells differently. The three tube-wells provided water for 88 families averaging 6.7 persons per familyand 3.3 below the age of 15, and families were defined as tubewellusers if they used tubewell water five times more often than otherwater sources (canal or tank). Diarrheal incidence data obtained froma hospital were correlated with water use for 11 years.
58

Tubewell users were not reported to have lower cholera or non-cholera diarrheal rates; instead, they had higher rates than non-tubewell users. The type of water supply made no difference even whenthe educational level (families with or without high school graduates)was taken into account, but educational level made a difference re-gardless of the water source.
There are several possible explanations for the negative associa-tion between tubewells and health. Each well had two or three me-chanical breakdowns per year, and service from the well was inter-rupted for about 3 weeks during each breakdown. Thus, each tubewellwas inoperative 9 weeks/year. In addition, some of the familiesclassified as tubewell users reported using surface water (1800coliforms/100 ml) for drinking. It seems clear that tubewell userswere still consistently exposed to polluted water for domestic hy-giene and drinking. It was not that the tubewells failed to reducediarrhea, but that people were still exposed to fecally-pollutedwater.
It is worth noting that better education was associated withreduced cholera and non-cholera diarrhea. This suggests that certainextraneous factors could produce positive associations; they couldjust as easily mask true differences when they exist. Few studies intable 1 controlled for known extraneous factors which could haveproduced the findings reported.
Another study in which the results are questionable becauseextraneous confounding factors were not taken into account, compareddifferences in Shigella prevalence rates among individuals and fami-lies in migrant-labor camps in Fresno County, California, which hadvarious types of water and sanitation facilities (43). The campscontained scattered subcamps that were either equipped with insidewater faucets or had no indoor plumbing. Shigella prevalence waslower among individuals and among families in the subcamps with indoorfaucets. When the authors matched these two types of subcamps for anumber of factors, such as people per household, faucet, shower, andtoilet, total child population and percent of total camp with insidefaucets, the difference in Shigella prevalence between the two wasreported to be greater than in the unmatched analysis.
Yet several factors could have confounded these results, particu—larly family composition. Families were classified as positive ifthey had one infected child under 11 years of age. The subcamps withno indoor facilities had many more children under 11 years of age thandid subcamps with indoor faucets, 61 percent vs. 7 percent respec-tively. If the children in the subcamp without plumbing were youngerthan the children in the subcamp with plumbing, they and their fami-lies would be more likely to be classified as positive for Shigellasince children under five have higher positivity rates than childrenover five (22). Age could have confounded the results from thefamily-level analysis even if Shigella positivity rates were constantover the first 10 years of life. Families with many young childrenwould be more likely to be classified as positive since only onepositive child classified the entire family.
59
Positivity rates among families may also have been affected bymigration. During the 6-month period of investigation, the number ofmigrant workers declined from 175,000 to 25,000. If younger, lesswell-settled parents with more children move more often than older,well-settled parents with fewer young children, this could affectpositivity rates. The relationship between Shigella prevalence andthe parentsi length of settlement was nct investigated. It is pos-sible that migration or family age distribution rather than water andsanitation were responsible for the lower Shigella rates found in thesubcarnps with indoor plumbing.
The problem of childrenis age and family composition was commonamong the studies of morbidity. A number of studies failed to controlfor age at all (8-9, 11-13, 20, 24, 26, 29, 32, 36, 4). Two studiesdid not observe children under 5 years of age (16, 37). In one studyit was unclear what age was observed (27), and eight studies combineddata on children below and above 5 years of age (15, 22, 28, 33, 41—44).
Similar problems affected a study in India (27) that examined theeffect of bore-hole latrines on diarrhea prevalence among children.It was reported that diarrhea was lowered by the introduction of thelatrines, although no statistical tests were done. But seasonalchanges in diarrhea rates could have produced this reduction with orwithout the latrine improvements. Preintervention diarrhea rates weredetermined only during a time of year when the incidence of diarrhearises and reaches its peak (48). Postintervention observations in-cluded the time of year when diarrheal incidence was falling and atits lowest. Thus, the different seasons alone could have accountedfor this reduction.
An example of how some factors can mask true differences isillustrated from a study in Panama (33). The authors examined bac-teriological evidence of Shigella, Salmonella, enteropathogenic E.coli, and Edwardsiella tarda among children under 10 years of age andcompared the pathogen prevalence rates with types of waste-disposalsites and sources of drinking water. Fhish toilets had a higherassociation with infection than any other type of excreta disposalsite (ground, pit privy, and river or sea). Piped water was reportedto be worse than streams or wells, but better than rain water.
This unexpected finding was explained by the fact that most ofthe faucets and flush toilets were located in substandard dwellings ormultifamily tenement slums in Panama City. It is likely that thefacilities were shared and not adequately maintained. The authorsalso cited lack of knowledge about personal hygiene as masking theexpected benefits of plumbing. Not only population density but alsofeeding patterns and medical care are likely to differ between ruraland urban areas, and these factors shoutd be measured and included inrural/urban analyses.
Conflicting results from a single set of data were obtained froma study conducted in two villages in rural lowland Guatemala (20).This study examined, among other outcomes, the impact of piped wateron diarrheal morbidity. In one village, each household initially
60
received a piped water supply, with health education and latrines insubsequent years. The control village received no improvements. Com-parison of diarrhea rates before and after the intervention within thetreatment village for all ages combined showed no differences usingsimple t-statistics. No data were presented for the control village.A reanalysis of these data (49), separately by different age groupsusing a Chi-square technique on the episodes of diarrhea, found sta-tistically different diarrhea rates for all age groups except infantsand those over 45 years of age.
A panel was convened to resolve this discrepancy (50). The panelconcluded that no valid relationship between water and diarrhea couldbe found in this study, and discredited the use of the Chi-squaretechnique. Chi-square testing requires independent observations, butepisodes of diarrhea were not independent since some individualssuffered repeated bouts of diarrhea. Thus, the Chi-square statisticwas artificially inflated and the probability of finding a significantdifference by chance was not 5 percent, as was expected, but washigher. This issue points to the need to use the correct test statis-tic and to correctly calculate the chance of finding significantdifferences when none exist.
The panel noted that the study also suffered from some of themethodological problems already discussed, including inadequate stan-dardization of measurement and failure to randomize and replicate thevillages studied to control for confounding factors.
These nine studies illustrate the most important design andmethodological problems in the studies of diarrheal morbidity listedin table 4: lack of randomization, inadequate replication of the unitof intervention, errors in the measurement of diarrhea, inability toverify usage of improved services, failure to identify known extra-neous factors, failure to include those factors in a multivariateanalysis, and inappropriate statistical analysis. Failure to accountfor these problems could have accounted for the differences reportedin some studies or masked true differences not found in other studies.
Association of water and sanitation to nutritional status
The use of nutritional status, as measured by anthropometry, hasa biological and statistical basis for inclusion in studies evaluatingdifferent water and sanitation conditions. There is good evidencethat diarrtiea contributes to growth faltering (51-53) and that anthro-pometric indicators may respond as readily to improved water andsanitation as diarrheal indicators (54). Four studies (35, 55-57)examined the association between water and sanitation and nutritionalanthropometry (table 2); one of these (35) also examined diarrhealmorbidity. Many of the problems already discussed apply to thesestudies but will be addressed in the context of using nutritionalanthropometry as the outcome measure.
A longitudinal study in St. Lucia (35), in which about 75 babiesin each of three valleys were followed for up to two years, reportedan association between water and sanitation conditions and mean growthincrements for height and weight. The ucontrol valley~ had one
61
standpipe for every 350 people. The “water valley” had an individualwater supply system installed for each family. The “water-and-excretavalley” had an individual water supply system and water-seal latrinesinstalled for each family. In the water group babies 3-6 months ofage put on more weight when compared to control babies. Thereafter,no differences in growth between comparison groups were seen throughthe first two years of life. In fact, the water group appeared to bebetter off than the water and excreta group, although not statis-tically. The control group was reported to be significantly shorterand lighter than the other two groups from 5-16 months of age.
Failure to replicate the valleys receiving each treatment af-fects this analysis. Since no estimate of the between—valley variancecan be calculated when only one replicate per treatment group ismeasured, the analysis had to use within-child variance. And sincethe within-child variance is lower than the between-valley variance,the test statistic is inflated. Between—valley variance would havehad two components: variance due to children within a valley andvariance due to valleys within a treatment. In this study, the proba-bility of finding a significant difference was increased when in factone did not exist.
Other data in this study render the results inconclusive. Ifwater or sanitation does affect growth by reducing diarrheal morbid-ity, then this study should have found differences in diarrhea eitherconcurrent with or preceding differences in growth. In two valleys,the control and water groups, growth differences were detected onlyduring 3-6 months of age while no differences in diarrhea prevalencewere detected during the first year of life. During the second year oflife, when diarrhea rates in the two valleys were different, no growthdifferences were found. In fact, the mean differences in height andweight became smaller; that is, catch-up growth seemed to occur in thecontrol group which was suffering more diarrhea. The lack of congru-ity between the growth and diarrhea data tends to cast doubt on theinference that improved water and sanitation improved health.
A study in Colombia (55) also reported that better water andsanitation were related to better growth among children under 5 yearsof age. Families connected to sewage systems had taller and heavierchildren than did families with only latrines, and families with ashower or bath had taller and heavier children than did familieswithout these facilities. A number of other factors were also asso-ciated with children’s height and weight: dwelling size, persons perbed, education of parents, and general cleanliness of the dwelling.
When a multivariate regression analysis was performed that in-cluded these socioeconomic factors, the sanitary scale (which wasundefined) was still reported to significantly affect children’sheight, but not weight. But the multivariate analysis did not sep-arate the effect of a better water supply from better excreta-disposalfacilities, and the numbers of smaller, lighter children associatedwith poor water or poor excreta disposal were very similar. Conse-quently, no statement can be made regarding which component, water orexcreta disposal, was more important. Since water and sanitationinterventions may have different design requirements, cOsts, and
62
effects on health, it is important to identify the component of anintervention that is responsible for the desired outcome. It is alsoimportant to distinguish effects due to water quality from those dueto water quantity.
A recent analysis from Fiji (56) examined how differences inheight and weight among preschool children were affected by excreta-disposal facilities. In rural areas the presence of a flush toilet inthe home was reported to significantly improve both height and weightof children. No differences could be detected in urban areas wherethe children could be considered to come from a well-off group andwere not malnourished. But in this case, the absence of a relation-ship between toilets and health in the urban sample does not mean thatthe addition of flush toilets would not improve growth of malnourishedchildren. Growth parameters would not be expected to respond to anyimprovement in sanitation where children are already well-off. It isimportant to measure differences in populations that can respond tothe intervention.
The last study of nutritional outcomes was conducted in 1978 inNigeria (57) and examined weight-for-age (W/A), height-for-age (H/A),and weight-for-height (W/H) in two groups of preschool children whoused water from protected or unprotected wells. Protected water wasobtained from dug wells 20-40 feet deep with at least 18 inches ofsurrounding parapet. This water was reported to be clean, plentiful,and easily accessible. Unprotected water came from wells withoutparapets, usually shallow, or from ponds or pools dug in river beds,all located at least one-half mile from the households.
The authors reported differences in measures of wasting (W/H andW/A) between the two groups, but no differences in stunting (H/A)--although stunting was prevalent in both groups. The analysis was doneusing Harvard standards instead of more powerful multivariate techni-ques to adjust for age and the H/A figures were inaccurately reported.
Thus, the four studies examining the effect of water and sanita-tion on chilaren’s growth suffered from some of the same problemsidentified in the preceding section on diarrheal morbidity: lack ofrandomization, inadequate replication, failure to identify, measureand control for extraneous factors, inappropriate statistical analy-sis, and failure to verify usage of services. Additional issuesrevealed by these studies are the importance of supporting findingswith collateral evidence, of measuring populations that can respond tothe intervention, and of calculating and using the correct statisticalerror term in the analysis.
Association of water and sanitation to mortality
The ten studies that have examined the association of water andsanitation with infant and childhood mortality (58-67) are reported intable 3. Although mortality is a more distal response indicator thanmorbidity and anthropometry to water and sanitation conditions (figure1), reductions in mortality should follow improvements in water andsanitation since diarrhea and malnutrition are leading causes ofchildhood death in the less-developed countries.
63
Many of the problems that affected the studies of diarrhealmorbidity and nutritional anthropometry also apply to the mortalitystudies: lack of randomization, inadequate replication, measurementerrors, inappropriate analytical methods, and classification problems.Selected mortality studies shed further light on these issues.
A study in Kenya (63) included water supply and sanitation aspossible determinants of childhood mortality at the district- andhousehold-levels. The district analysis used the 1969 populationcensus data to predict the probability of a child’s surviving to agetwo. The source of data for the household analysis was the 1974ILO/University of Nairobi Household Survey. A benefit from sanitationwas reported at the household level.
In the district-level analysis the percentage of adult literacy(PAL) was used as a proxy for type of drinking water, toilet facili-ties, personal hygiene, and nutrition. It was reported that PAL had astatistically positive effect on children’s life expectancy--exceptwhen the number of hospital beds per 1,000 persons was included in theregression analysis, which suggests that medical care may be moreimportant than water supplies or toilet facilities.
An ecological study of this nature uses a geographic unit (e.g.,districts) to measure exposure (e.g., toilets) and disease (e.g.,mortality). But such an ecological study contains no information onthe exposure of all individuals or of individuals who died, and it isnot possible to attribute geographic characteristics to individuals.In the context of this study no causal statement may be made about PALand mortality. Furthermore, since risk factors tend to cluster intogeographic units, there is an increased risk of confounding in theresults. Another ecological mortality study (66) has this problem.
In the household-level analysis, data on the type of water supplyand sanitation facilities were available. Only pit latrines werereported to be associated with reduced mortality: This was signifi-cant at p K .1 level for the rural sample, but at p < .05 level whenthe rural and urban samples were combined, suggesting that sanitationmay be more important in urban areas. The presence of a toilet wasreported to have a greater magnitude of benefit than a pit latrinedid, but this was not significant at the 5 percent level. Piped orwell water did not appear to reduce mortality rates.
In this analysis household characteristics were measured andapplied only for 1974, while births could have occurred as early as1960. A retrospective study of this nature is subject to misclassifi-cation bias according to the exposure, presence or absence of toilets.Because an erroneous temporal sequence between toilets and mortalityevents cannot be ruled out, a spurious association between toilets andmortality could have occurred. In other words, the associationbetween sanitation and mortality may be merely coincidental. Threeother studies suffered this problem as well (58, 66, 67).
An Egyptian study (61) examined neonatal and infant mortalityrates in a control village that had no improvements of ~ny kind and infour other areas that had one or more of four improvements: wells and
64
latrines, fly-control measures, preventive medical care, and installa-tion of refuse disposal. The author reported that only fly controlseemed to reduce mortality rates.
This study suffered from several of the flaws already discussed:failure to randomize, to replicate villages within a treatment, and toverify exclusive use of improved facilities. Another possible expla-nation for the negative findings is the overall poor condition of allvillages in the study. That is, an objective sanitation score indi-cated that despite the improvements examined in the study, poor condi-tions continued after the interventions. Any expected reduction inmortality rates may have been offset by the deplorable conditions ingeneral. This is tantamount to saying that no intervention occurred,since no improvement was able to reduce pathogen ingestion suffi-ciently to reduce mortality.
A descriptive study in Sri Lanka (66) reported the associationbetween regional variations in water and sanitation conditions andinfant mortality rates. The rates were similar in the region in whichonly 2 percent of the households had tap water and the region in which30 percent of the households had tap water. The situation was evenmore pronounced for latrines: the region with the highest percentageof households possessing latrines (42 percent) had the highest infantmortality rate of all regions in Sri Lanka, while the region in whichonly 3 percent of households had latrines was 60 percent lower.Regions which relied heavily on well water had lower infant mortalityrates than regions which did not rely on well water.
Despite a number of flaws in this report, one particular problemshould be mentioned. The infant mortality rate had been declining inSri Lanka for several years before data on water and sanitation werecollected. It is likely that regional differences in mortalityreflected differential improvements in health during the precedingyears rather than water or sanitation conditions at a particular pointin time.
A retrospective study from Sri Lanka (67), in which the estatesector was analyzed separately from the rest of the country, analyzedthe statistical interaction between types of sanitation, mother’sliteracy, and father’s education at different periods in the infant’slife. The presence of toilets was reported to be significantly asso-ciated with lower mortality. When the presence of toilets wasexamined along with data on mother’s literacy and husband’s education,a synergistic interaction was found: that is, the reduction in infantmortality was even greater than would result from adding the effectsof toilets and good education.
A problem in interpreting results of this study, if the impact isreal, is the likelihood of mortality underreporting. The study pooledmortality rates from 1950-1975 but used toilet conditions and educa-tional levels only from 1975. If mortality underreporting in theworse-off group was greater than the better-off group, this wouldsuggest that the actual differences in mortality were even larger than
65
the reported differences. In this case the magnitude of improvementto be expected from the installation of toilets would be underesti-mated, and so would the cost-effectiveness relative to other interven-tions.
Another retrospective study, this one from Malaysia (64-65),analyzed the effect of toilets and piped water on infant mortality.The effect of breastfeeding was also considered. The presence oftoilets was associated with lower infant mortality, particularly inthe postneonatal period. Piped water had a beneficial effect for 2-6-month—olds but not for other infants.
When the statistical interaction ol toilets and breastfeeding wasanalyzed, the presence of a toilet was ‘reported to be even more bene-ficial for children who were not breastfed. It did not add any bene-fit for children who were breastfed. Similarly, piped water wasassociated with lower infant mortality among babies who were partiallybreastfed, although the effect was smaller than the one found fortoilets. It should be noted that mothers who breastfed tended to havepoor sanitation facilities, and those who did not breastfeed generallyhad good facilities.
This analysis controlled for a number of extraneous factors:income, birthweight, parity, mother’s age, preceding inter-pregnancyinterval, child’s age, and ethnicity. However, the analysis was doneat the child level, not the community level, and regional controlswere not included in the analysis. Because this design did not takeinto account the large clusters from which the data were collected,the chance of finding a statistically significant difference when onedid not exist was actually greater than 0.05 as reported. Becauseintracluster correlations were not taken into account, the varianceused when testing differences was artificially lowered.
In conclusion, methodological and design problems could haveproduced spurious associations in the studies reporting on water,sanitation, and mortality, as well as in the other studies of mor-bidity and nutritional status. These issues will now be systemat-ically structured to judge the plausibility of all studies in tables1-3, according to their design and the statistical associations theyreport.
DISCUSSION OF CRITERIA TO EVALUATE STUDIES
Overall, the studies examining associations between improvedwater or sanitary facilities and diarrheal disease have reportedconflicting and inconsistent results. In the studies using nutri-tional anthropometry as an indicator, water appeared to have a greatereffect on children’s height and weight than sanitation conditions.The studies on childhood mortality, on the other hand, suggest thatwaste-disposal facilities may be more important than water facilities.But regardless of the type of association reported--whether a positiveone, negative one, or none at all--each study must satisfy certaincriteria for internal validity before any implications can be drawn.
66

Systematic criteria applied to research findings expose biaseswhen they occur and help distinguish between causal and indirectassociations, thus permitting an assessment of the plausibility of thefindings. A previous algorithm (68) has been extended and used toshow whether or not the findings associated with different water andsanitation conditions satisfy the criteria for validity.
For this evaluation, the studies are grouped according to whethera statistical association was reported and what study design was used(table 4). Studies reporting positive associations between water orsanitation conditions and health (figure 2) included experimentaltrials that evaluated interventions and observational surveys thatexamined nonrandomized differences or preexisting differences in wateror sanitation conditions.
Experimental studies
Experimental trials provide more plausible results than observa-tional studies, because experimental trials make probability state-ments of causality of association. All studies which reported posi-tive associations and evaluated interventions were considered experi-mental trials and are included in table 5 along with the criterianecessary for judging experimental trials. The most important cri-terion is that the intervention is assigned in a strictly randomfashion. This decreases the possibility that associations are due tosome confounding variable inherent in the treatment or control groupwhen the intervention is applied. Furthermore, a probability state-ment can be assigned to the possibility that the association describedis not due to confounding, even when some possible confounding factorsare not measured or even recognized (see table 5, part Bla). A ran-domized trial can use cross-sectional data or include before-aftermeasurements; in the latter case it is called a before-after ran-domized trial.
Although randomized trials can assign a probability to the like-lihood that an intervention caused a result, randomization alonecannot identify which component of an intervention was responsible.In order to identify the responsible component additional techniquesmust be used when designing experimental trials. First, randomizationshould be done across enough independent units so that statisticalprobability tests can be applied. In trials involving water andsanitation measures, the unit of intervention is not the child eventhough the objective of the intervention is to improve children’shealth. The appropriate unit of intervention that must be suffi-ciently replicated is the village, since children within a village aresubject to any influences which affect the entire village. Forinstance, if a measles epidemic affected an entire village, it wouldmask or exaggerate the true effect of any intervention if only thatvillage was included in the study (table 5, part Blb).
Second, if statistical testing is done using the incorrect unitof replication, then probability statements will invariably be wrong.Child-level variances are smaller than village-level variances and ifchild-level variances are used in the analyses, then statisticalprobability statements of association due to chance alone will be

Ti~BLE 4. A list of questions asked about study findings depending upon the type of study design
and whether or not differences in outcomes were tested and found
WAS THERE A STATISTICAL_ASSOCIATION REPORTED?
EXPERIMENTAL STUDI ES
YES NO
(experi mental
OBSERVATIONALSTUDIES
A. Control for confounding
1. Was randomization
properly executed?
2. Was analysis done with:
a. proper unit of
observation?b. proper variance term?
3. Was study blinded by
a. assignment?
b. assessment?
4. Was randomization
confi rmed?
B. Analysis for congruity
Was intervention
confi rmed?
2. Were other concomitant
outcomes measured and
analyzed?
A. Control for confoundin
1. Were major confounding
variables measured?
2. Was there matching by
design?
3. Did statistical analysis
deal with confounding?
4. Were measurements blinded?
B. Analysis for congruity
1. Were measures of different
water/sanitation
conditions confirmed?
2. Were other concomitant
outcomes measured and
analyzed?
EXPERIMENTAL AND OBSERVATIONAL STUDIES
A. Control for confounding
1. Was intervetion (experimental
studies) necessary?
2. Did intervention
studies) occur?
3. Were differences large enough to
produce a change in health
(observational studies)?
4. Was randomization (exper~imerita1
studies) carried out?
5. Were measurement biases
controlled?
6. Was sample size adequate?
7. Did statistical analysis deal
with confounding?
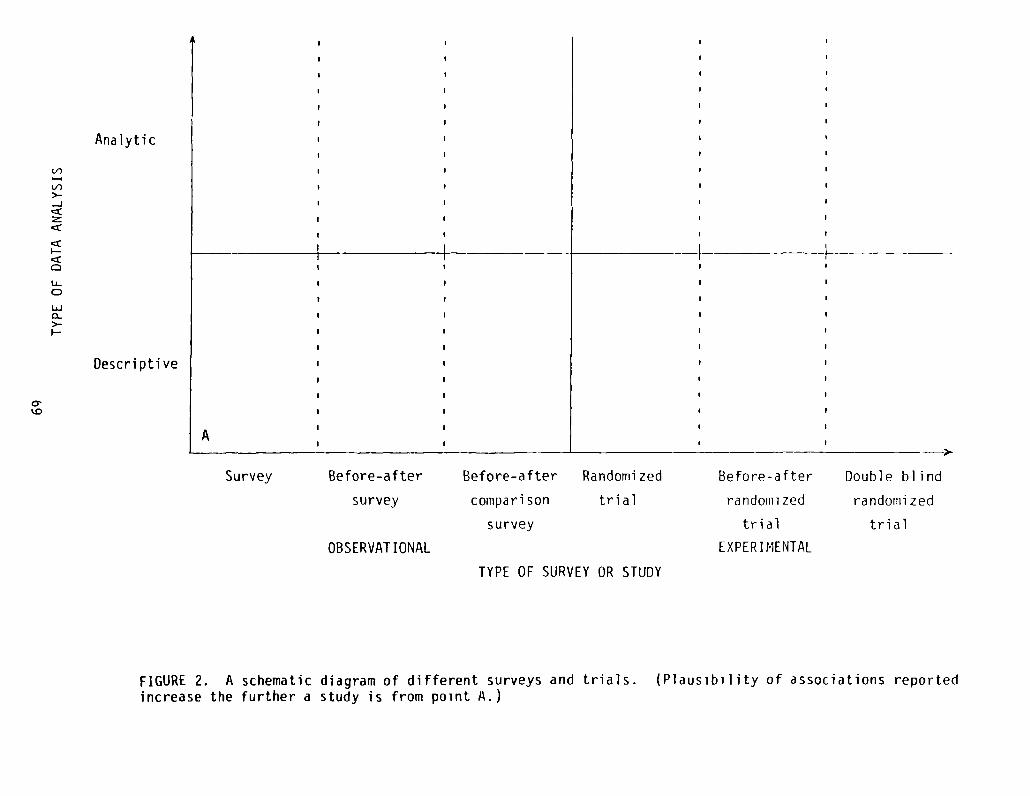
Survey Before-after
survey
OBSERVAT IONAL
Before-after
compari son
survey
Randomized
trial
Before-after
randoiiii zed
trial
EXPERI MENTAL
Double blind
randotni zed
trial
TYPE OF SURVEY OR STUDY
FIGURE 2. A schematic diagram of different surveys and trials. (Plausibility of associations reportedincrease the further a study is from point A.)
(1)
>--J
cZ
U-0
UJ0~>_
Analytic
Descriptive
—I —IF
F-
A
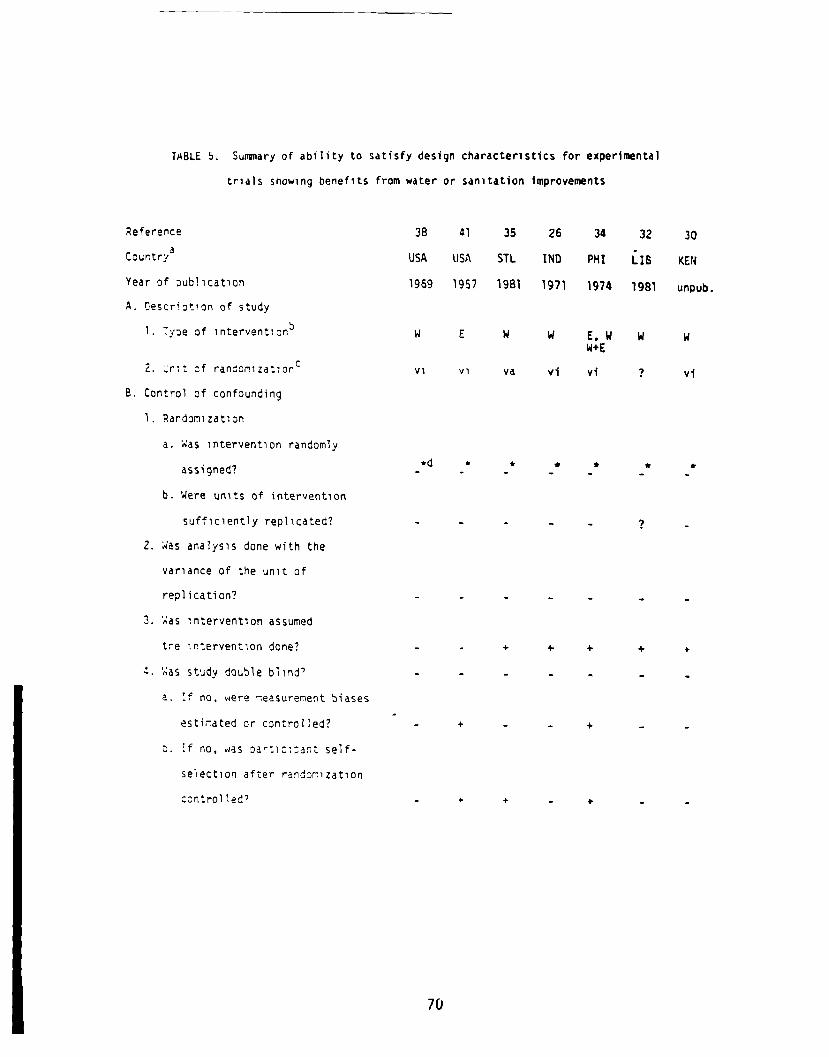
TMBL.E 5. Sumary of ability to satisfy design characteristics for experin~nta1
trials showing benefits from water or sanitation Improvements
Reference
Country3
Year of publication
A. Descriotion of study
1. Tyoe of interventionb
2. ‘~ri~t of randon1z~tion°
B. Control of confounding
1. Randomization
a. Was intervention randomly
assigned?
b. Were units of intervention
sufficiently replicated?
2. ~4asanalysis done with the
variance of the unit of
replication?
3. ~as ~ntervent1on assumed
tre lr.tervention done?
~. ~asstudy double blind’
a. f no, were ~easurernent biases
estfrated or controlled?
o. tf no, was Dar:1ci~ant self—
s&ection after randonization
control led’
38 41 35 26 34 32 30
USA USA STL IND PHI 118 KEN
1959 1957 1981 1971 1974 ~981 unpub.
W E W W E,W W W
vi vi ye vi vi ? vi
* * * * * *
- 4. 4 4 +
+ - - +
+ + - +
70

5. Was randomization confirmed through
corDarison of the distribution of
confounding variables?
a. Exposure to infection
1) Education
2) Income
3) Rural/urban
4) Seasonality
5) Crowding
6) Secular trend
b. Susceptibility to infection
1) Age
2) Sex
3) Diet
4) Breastfeeding
c. Prevention of outcome
1) Medical care
C. Analysis for congruity
1. Measures of intervention
confi rmed
a ~•.ater quality
~. ..ater quantity
C ~ti~ization •o~ services
2 ~‘eas..~es tor cons~stency
a
5 ~trit~onal status
c “ortalitj
~ See footnote a, table 1b w water supply, E excreta disposal, W+E = water supply + excrete disposal.C vi village; va valley
- means no. + means yes, ~ means unclear.
‘ Since random assignment did not occur, these studies will be considered asobservation studies, table b.
71

higher than those reported. Since the statement regarding the proba-bility of causality of association is high, the plausibility of thefindings is diminished (see table 5, part B2).
A third important issue concerns the application of the interven-tion to the recipients. Water or sanitation interventions may beaccompanied by additional inputs such as health education. In thiscase the assumed intervention (water or sanitation) was not the trueintervention (water or sanitation and health education). Thus, thetrue benefit of water or sanitation cannot be estimated (see table 5,part B3).
Fourth, the study should be conducted in a manner that preventssystematic bias from occurring when measuring the outcome. Forexample, measurement of diarrhea might I)e biased if the enumeratorsknow which villages received the intervention and which did not. Thiscan be avoided by blinding the assessment of the outcome, in which theenumerators do not know which villages have received the interventionor ignore this knowledge (see table 5, part B4a).
A randomized trial should also control for behavioral differencesassociated with the intervention. If those villages receiving a watersupply act differently because they know they received the interven-tion and are being observed, this could bias the study’s results. Animprovement in health might be caused by a change in behavior thatwould not be duplicated unless the intervention were applied in anexperimental context. This can be controlled by blinding byassignment--that is, by applying a placebo intervention to the non-intervention groups, so that all groups think they are receiving anintervention but are blinded as to which one (see table 5, part B4a).
Even if an intervention is randomly assigned, there may be ele-ments of self-selection in the results. If enumerators measure onlyparticipants who choose to be measured, they would obtain a biasedestimate of the health outcome. This would diminish the plausibilityof the findings (see table 5, part B4b).
Studies in which the unit of intervention is randomly assigned,sufficiently replicated, and blinded by assessment and by assignmentare known as double-blind randomized trials. This is the only type ofstudy that permits assigning a probability statement that the associa-tion found is a causal one.
Finally, experimental trials should measure known and potentialconfounding factors, to verify that randomization was successful indistributing confounding factors equally across comparison groups (seetable 5, part B5). Experimental trials can increase the probabilitythat an association is causal if confounding variables are identifiedand taken into account either in the design of the study (e.g.,matching) or in the analysis of the results. Even if some potentialconfounding factors are missed, there is a greater possibility thatassociations found are not due to confounding.
Confounding factors that are likely to affect studies of waterand sanitation conditions can be identified on the basis of the
72

biological pathways that lead from the intervention to the outcome(see figure 1). The most relevant confounding factors that mightaffect the outcomes can then be measured (figure 3). If all stepschange concurrently as predicted by biological theory, the plausibil-ity that the changes are due to the lntervention is increased. Ana-lytic studies that control confounding are more valuable than descrip-tive studies that only report associations.
These criteria can now be applied to the studies of water andsanitation interventions that reported a statistically significantassociation. Table 5 indicates that even though several studiesevaluated interventions and were intended as experimental trials, nonewere conducted as randomized trials and, therefore, none can be consi-dered truly experimental. Since these studies did not use true randomassignment, they must be evaluated according to the criteria forobservational surveys.
Observational surveys: Positive statistical association
Observational surveys of various types can only make probabilitystatements of association (figure 2). Cross-sectional observationalstudies use survey data to examine the concurrent presence or absenceof good water or sanitation facilities in relation to an outcome, suchas diarrhea. Before-after surveys would look for a reduction indiarrhea following an intervention. Both types of surveys could findassociations that are due to factors other than improved water andsanitation. For instance, a before-after survey could detect a de-cline in diarrheal rates due to a general regional improvement in thestandard of living which would include better health and hygiene. Inorder to avoid this type of secular confounding, data from areaswithout the improvements can be included in before/after comparisonswith data from the improved areas. This design, which is differen-tiated from the before-after survey by the presence of the comparisongroup, increases the plausibility of the findings. However, it isimpossible to identify and measure every possible confounding factorthat could affect the intervention and comparison groups, so there isalways some doubt about the findings of observational studies. Thefactors most likely to confound results in observational studies ofwater or sanitation are listed in table 6, part Bi.
Two techniques can be used to control for confounding factors.Comparison groups can be matched on certain identified factors, orthese factors can be controlled by multivariate statistical techni-ques. Analytical studies, in which confounding is controlled by theabove techniques, yield more plausible results than descriptive re-ports (see table 6, parts B2 and B3).
As in experimental studies, measurement errors must be minimized.Although blinding by assignment is not possible, blinding by as-sessment remains an issue and is the only way to ensure that potentialbiases are estimated and controlled. Measurements can be standardizedby stratifying or randomizing the enumerators across comparison groups(see table 6, part B4).
73
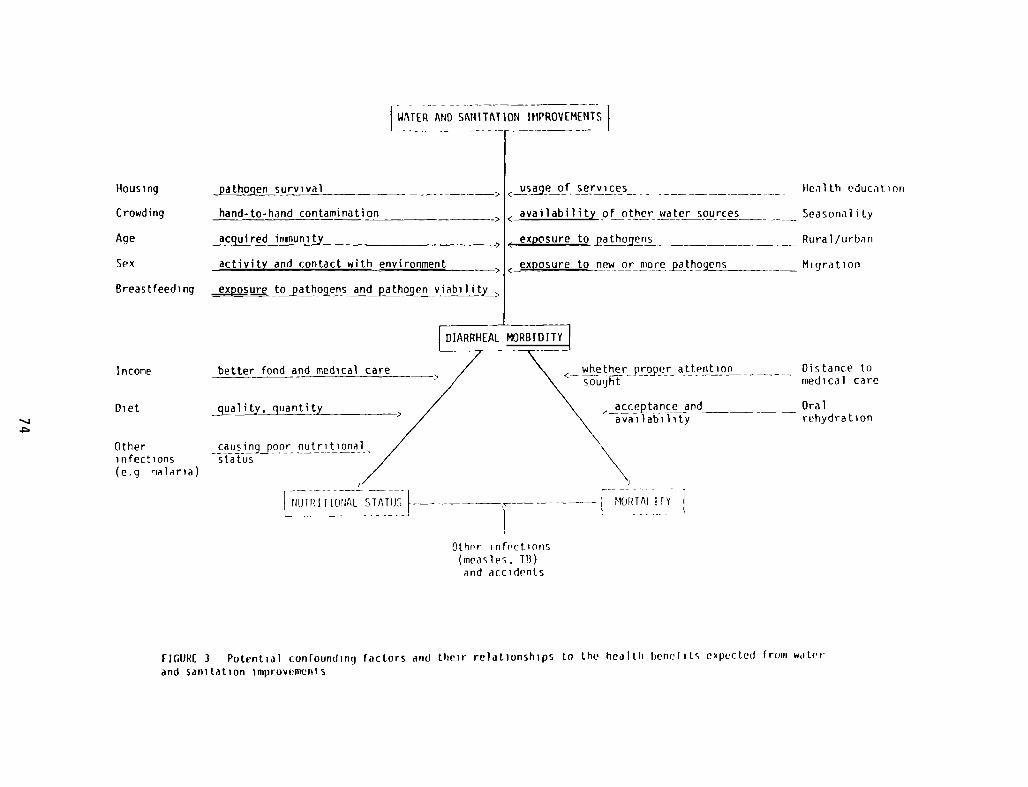
WATER AND SANITATION IPIPROVEMENTS
~~EAL MORB1D7~J
~ ~ attent~o~ —~ -
/~ IT IONAL STATIJ~ - - MOI~TAI II
Other infrctions(measles, TB)and accidents
FII1URE 3 Potential conlounding factors and their relationships to the health benefits cxpectcd frouii w,iter
and sanitation improvements
hand-to-hand contamination
acquired iriinunity
activity and contact with environment
~pos ure t~athojensandpathqgenviabi~y~
Housing
Crowding
Age
Sex
Breast feed ing
income
Diet
Otherinfections(eq nalaria)
<_u~eofsery)_ces -
< availability of other water sources
<~~p~sureto patho~ens
< exposure to new orniorej~tho~jens
IIe~iith education
Seasonal i ly
Rural /urbiin
Mi qra t ion
Distance tomedical care
ca us in 9J) oor nutnitiona 1status
acceptance and — Oralavailability rehydration
Observational studies of water and sanitation must be particu-larly aware that improved services may not always be used. There aremany possible reasons, including breakdowns, lack of knowledge on howto use the services, easy access to other sources of water (e.g.,streams or ponds), and sanitation problems (e.g., odors and darknessin improved pit latrines). If positive associations were reported butthe usage of services was not measured, then the plausibility of theassociation is diminished (table 6, part Cl). On the other hand,plausibility of an association is increased if several health outcomesare measured (see figure 1) and change concurrently as predicted bybiological theory (see table 6, part C2).
Table 6 evaluates the observational studies that reported astatistical association between water or sanitation and health. Inaddition, a few studies reported a change in outcome but did notcalculate statistical associations; if the change was greater than 50percent, the study is included in table 6. Some studies reported bothpositive and negative findings, either for different indicators or fordifferent ages. These studies are also included in table 6.
According to table 6, there are a few studies that do satisfysome of the criteria necessary to increase the plausibility of theassociations they report. Most of these are mortality studies (60,63, 64, 65, 67), and their results suggest that improving facilitiesfor excreta disposal is more important than improving the watersupply. This is in accordance with what is known about fecal-oraltransmission of pathogens (figure 4). If excreta is effectivelyremoved from the environment, fewer pathogens are available for inges-tion. Once pathogens have entered the environment, they may take manypathways to ingestion and are thus more difficult to control.
The evidence in favor of excreta-disposal facilities is advancedwhen results from two studies examining nutritional status are consi-dered (55, 56). In these studies children’s body size was associatedwith excreta-disposal facilities even when other factors were control-led in the analyses. These two outcomes--anthropometry and mor-tality--offer collateral evidence that excreta-disposal facilities canaffect health.
One study in diarrheal morbidity (16) reported that hygienicbathrooms were associated with less diarrhea among grade schoolers.In another morbidity study (42) diarrhea was reduced when water wasmore readily accessible, whether well or piped city water. A thirdstudy (19) also found sanitation to be a good predictor of diarrhea.In addition, the amount of water used per person was more importantthan the source of water used.
Observational surv~ys: Negative statistical association
The next question to be considered is whether the studies re-porting a negative association or lack of association between sanita-tion and health counterbalance these inferences. Because no negativestudy was randomized, all are subject to the criteria for observa-tional surveys. Some issues described above for positive studies arepertinent: documentation of usage of services, control of measurement
75
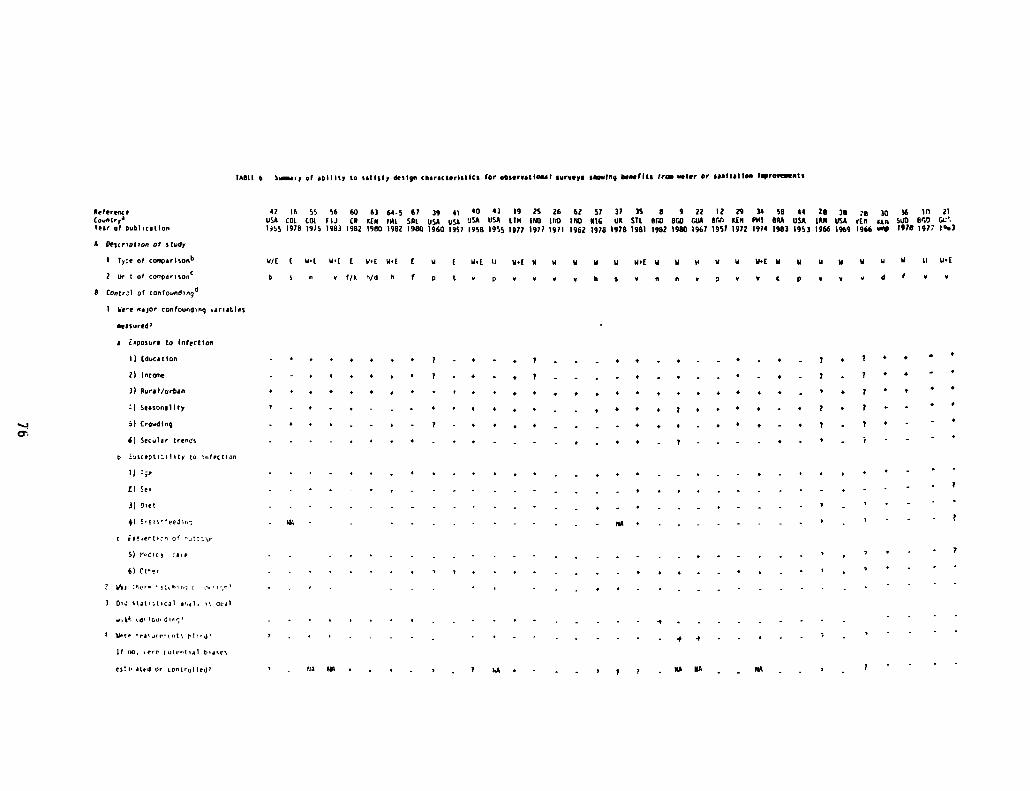
InSt 1 6 Sairy of oW 1117 to tot toRy dfl Igo choroctcrlstiCt (or otliroot least ooroeyo cRowing Seal Iii Scow woler or cost folios lSrovoeants
ReferenceCountry
1leer of p,abl,cotio,
A De;cr,pt,on of study
I ly~0 of cooçortso,1’
2 LW I of co’rpor,so.°
S Contr;i of confouod~ng4
1 We’o nojor confoun4ing o.or,obies
4) E’tss”ee3i,~
C rf0~0flC’~n of ‘~tz:i~r
5) r’cic~ ca’e
6) Urer
2 ohi :rcr. n:(h rn;
7 Cc sioi~t,coi o’iji. ~dtol
;o too’ din.’
~ U— c’’ea’u’ r tnt ti’ ii
Lf 00. ,rrr Lotr,t,,i hosrs
42 ik 95 56 60 63 fl.5 67 39 4* 40 43 19 25 26 67 57 37 35 0 9 22 I? 29 34 58 44 28 38 28 )~ *6 lii itUSA CCI CDI. 11.1 CR KEN fAt sm USA usA USA USA 1114 160 HiD 1140 RIG Uk 5TL BUD BUD (*16 Rrai KIN Pill BRA USA imu USA VIII iso SÜD V.0 Gt’1955 970 1975 1983 *982 i980 *962 1980 1960 1953 1958 1995 1877 1977 1971 1962 *978 1978 1981 1982 1980 *967 1957 1972 1974 1983 1953 1966 1969 1966 uo~ 1978 197? 1°c)
0/1 1 01 0’( I 0.1 0.1 1 w I 0.1 ii 11.1 0 0 14 u U 0’l u ii to 0 0 U.k 0 U U U U U U It *1.1
of/k h/d 6 f p 1 o p 0 Ii 0 0 A 0 3 V V C ~ 0 V d V
o E.po,ore to infectIon
I) (d,acotton
2) Iocane
3) Rorol/orbon
Seolooo lily
5) CrowdIng
A) Secuior trends
o iuocept’titity to nfrctian
1) :;e
C) So’
3) SeC
i 4 =
7 7 0 0
. , 4 7 0 t • •
4 0 4 . • 7 • 7 • . 0 0
0 ° 4 n 7 . 7 I . •
- 7 . 0 . • 7 . . . 0 4 . •
. — 0 0 0 4 n ‘ 7 . 4 — o 7 . . . o . .
, . , . , . . . , , . , o . . • • o 7
. +4,..,. 7 . o o • 0 . . . . o
- , - . . . 0 . 0 4 -
.
4 0 . . .
. . •0
7
roIl’ otrd Or tootrolted’ , - Itj lOt 7 hA, . . . , 7 7 . flih NA
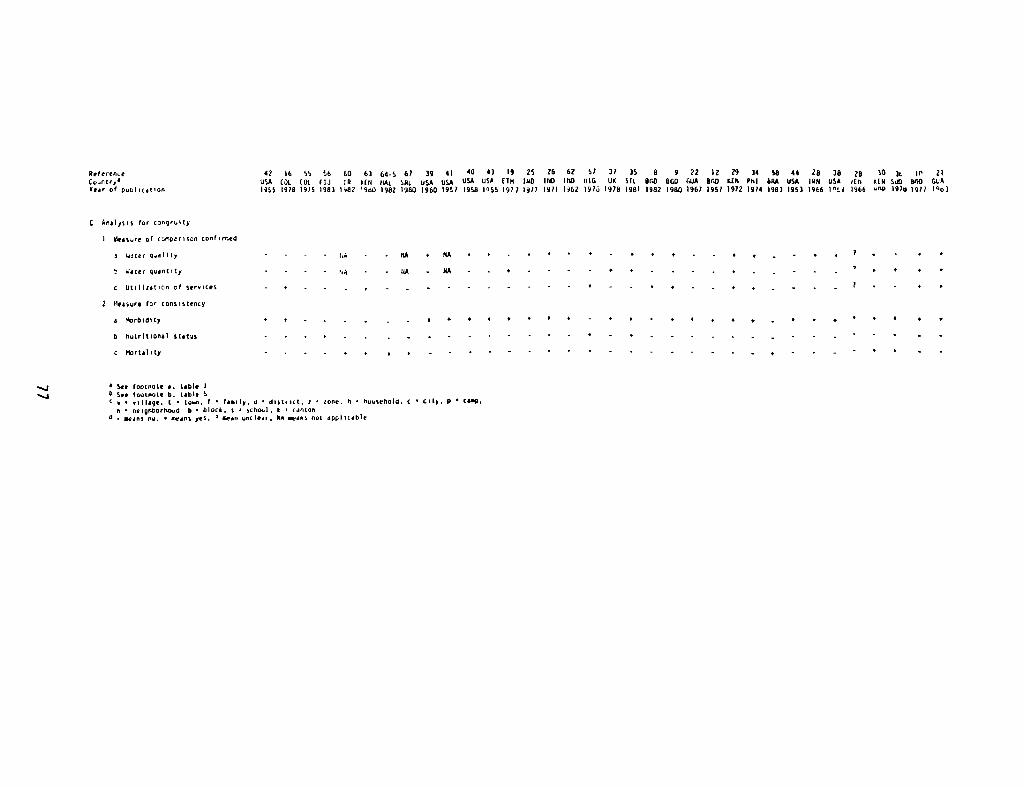
Aefrrro~eC oufl 1r
1°Year of ooUllcotIoO
17169996606)64567394* 104319152662 573735 8 972 *22934 58 442838 26
103t II 21USA (3* COt. fIJ CR 4111 CLII. SAL USA USA USA 09+ 174 hID ItO 1110 LuG UI Sit DUO AGO GIJA BUD KEN Pl’I AM USA IAN USA olit tIll StO 61,0 GCA1955 978 1919 983 947 963 1982 1960 *960 997 1998 1055 977 977 1471 962 *973 1978 1981 1882 1980 1967 1957 1972 1874 1983 1953 1966 i°t1 1966 u09 1970 1977 l°oj
C Anaiys,s for congruity
1 bleOture of cci”yorioco cool irred
I W~1er Quolity
S 051cr guontity
C Ut,ilzotiOo of serolces
2 Iieosure for coosistency
o ltrAldlty
S tlutrItlonoi Ulotus
c itrtotity
- - - - 7.3
7’)
#A • NA
- :1* - 110
V + ‘ ‘ 0 0 0 0 — t ‘
, 7
a See footnote a. loWe IU Soc lootnoto U. 40410 9
o ‘ n~IOpe. t • to—n. I . fos’Iy, A dl,tr,ct. I loVe. U • lluuselloId C • I’t~. P • COOp.o oeIgIiGortc040 6 • Ulock. S school. I • canton
O . ~ flij• • t~~V5yfl• 0 aeon unclear. Na eao,’s out applicable
n.j—4

biases, and control of identified confounding factors by eithermatching or statistical analysis. But studies that fail to show anassociation must also be evaluated in light of three additionalcr i te r i a.
First, was the outcome likely to be changed by improvements inwater and sanitation? That is, were conditions such that an outcomecould respond to the intervention? For example, in an area where mostchildren are breastfed, the addition of good water is not likely toreduce infant mortality rates, because breastfeeding reduces exposureto pathogens and confers immunity to ingested pathogens. Thiscriterion is checked in table 7, part B:L.
The second criterion deals with sample size. Were there enoughreplications of the unit of analysis so that the power of the test wassufficiently large to find differences in the groups compared? Thiscriterion is checked in table 7, part C.
The third criterion is control for possible negative confounding.A negative confounder is a factor related to both the intervention andthe outcome which would wipe out any true benefit from the interven-tion. For example, improved water supplies may draw many people to aparticular area, creating a crowding problem. Overcrowding, whichenhances the spread of pathogens directly from one person to another,will mask the true effects of improved water. Negative confoundingmay prevent an outcome from occurring, whereas positive confoundingmay allow an event to occur independently of the intervention. Thiscriterion is checked in table 7, parts ) and E.
Examination of the studies reporting negative associations orreporting a change in outcome of less than 50 percent (table 7)reveals that all suffer from one or more of these flaws. Only twostudies attempted to control for confounding factors in the analysis(13, 14); both were in Bangladesh and examined the health impact ofthe tubewells. In these studies tubewell users used other pollutedsources of water because of tubewell breakdown. The confirmed highexposure to pathogens from other sources would suggest that theactual level of tubewell use was insufficient to improve health.
In many of the other studies reporting negative associations theinvestigators failed to measure confounding, so it is difficult toknow if negative confounding affected study results.
Only three studies included more than two villages in theircomparison (11, 31, 33). In two of these (31, 33), the analysis wasdone at the individual level; both were confounded by other factors.One study (31) used an inappropriate measure of diarrhea and the otherstudy (33) was confounded by urban/rural differences. The study whichreported data at the village level failed to control for age dif-ferences.
In summary, most studies reportinci negative associations areflawed by either not measuring age (11, 13, 24, 32, 45) or reportingon too large an age range (28, 33), or by an inability to specifywhich age was included in the analysis (27). The remaining studies
78
are flawed by failure of the intervention to occur (18, 61), regionaldifferences in the comparison groups (17, 59, 66), or failure tocontrol for identified confounding factors (15, 20, 23). As a result,there are no reported negative associations suggesting that water orsanitation will not improve health. These negative results have muchless plausibility than reports of positive associations.
CONCLUSION
When all of the published studies of water or sanitation improve-ments are subjected to scrutiny, it becomes apparent that the trueeffect of such interventions remains difficult to estimate. There area few studies (16, 19, 40, 42, 55, 56, 60, 63, 64, 65, 67) that: 1)support the hypothesis that excreta disposal is more important thanwater interventions, 2) support the hypothesized pathway between waterand sanitation improvements and better health, and 3) do not havesevere flaws (16, 42, 55, 56, 60, 63, 64, 65, 67).
Examination of these studies provides useful information fortargeting areas (e.g. those with negative risk factors) most in needof these environmental interventions. The type of intervention (e.g.water quality, water availability and usage, or excreta disposal)which would result in the largest health impact of children can alsobe determined.
A model has been proposed which examines the relationship betweenthe level of pathogen exposure and the percent reduction in diarrheafollowing an intervention (69). This model suggests that maximumhealth impacts can be achieved when exposure levels are highest. Itdid not address the issue of which type of intervention should beconsidered, particularly in the presence or absence of risk factors.
When the level of exposure to fecal contamination from theenvironment is high, the health impact due to sanitation would beexpected to be greater than the impact due to water availability,which would in turn be greater than water quality (figure 4). On theother hand, when exposure is low this ranking may change.
All the major pathogens of diarrhea are shed via feces, thereforeeffective sanitation measures should remove these pathogens from theenvironment and result in large health impacts. Excreta disposal wasa more important determinant of child health than were water relatedvariables when the better studies were examined. This effect was seenfor all types of outcomes, morbidity, child growth, and mortality. Inmost studies which reported an effect due to a water related variable,the effect due to sanitation was usually not controlled for in theanalysis. When the effect of both variables were controlled for inthe analysis, the effect of the water variable was greatly diminishedand in most cases lost statistical significance (56, 63, 64).
The health impact due to the quality of drinking water may belarger when the level of fecal contamination from the environment islow compared to high levels of exposure. When exposure is high, water
79
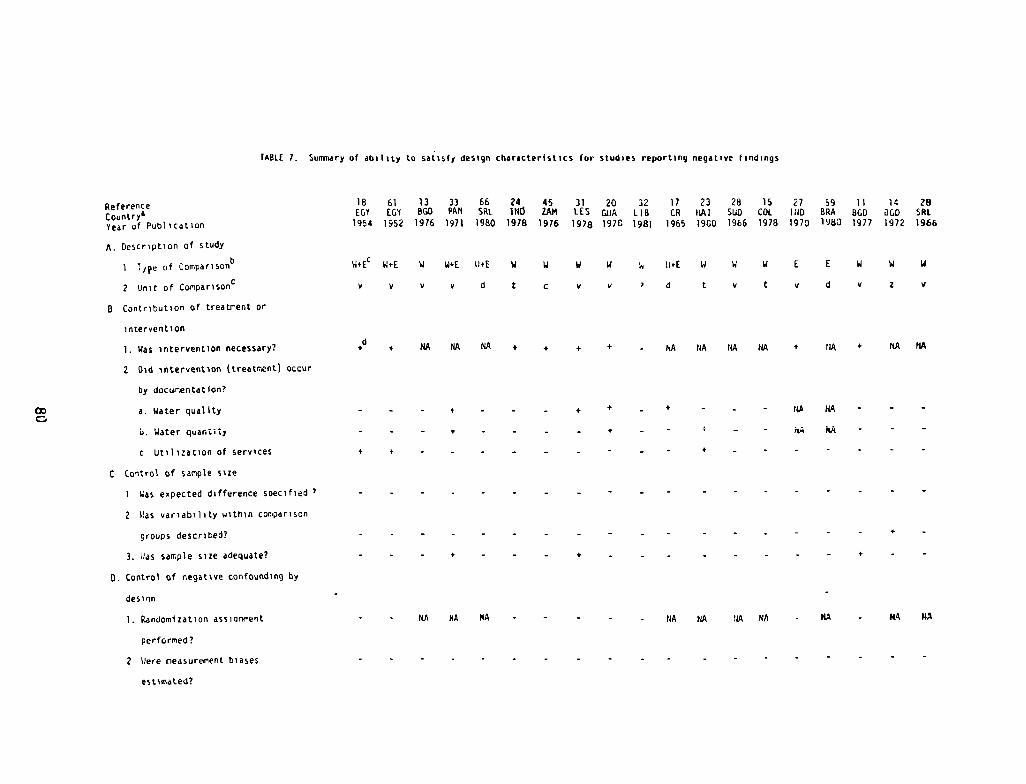
TABLE 7. Suoonary of ab~Iity to satisfy deslgn characterist,cs br studies reporting negative llndings
ReferenCeCountry’Year of Pub)tcatlon
A. DesCription of study
I t,pe of coiopar1sonb
2 Unit of conparisonG
B Contribution of treatrent or
intervention
1. Was intervention necessary?
2 Did intervention (treatment) occur
by docur.entation?
a. Water quality
Li. HALO! quonL,sy
C Utilization of services
C Control of sample sue
Was expected difference soecified
Was variability within comparison
groups described?
3. ~assample size adequate?
0. Control of negative confounding by
des i tin
W4EC SUE W GIvE SUE W W V W
to v to v d I c to to
~i ))rE W w W E E
‘ d t to t to d
1. RandomIzation assiaronent
perforned?
2 h)ere measurement biases
estimated?
NA NA NA NA NA NA NA - NA HA NA
18 61 13 33 66 24 45ECI ECOY 860 PAN SAt INi 2AM
1954 1952 1976 1971 1980 1978 1978
31 20 32IES QUA LIB1978 1976 1981
17 23 28 15 2? 59 1) 14 28CR ihA) SUD COL 1)10 BRA 860 8COO SRt
1965 1960 1966 1978 1970 1983 1977 1972 1966
C,
W W V
v z to
d + NA NA NA + + + + - NA NA NA NA + NA 4 NA NA
- - + - - - + + - 4 - ta NA - -
NA NA - -
- + -
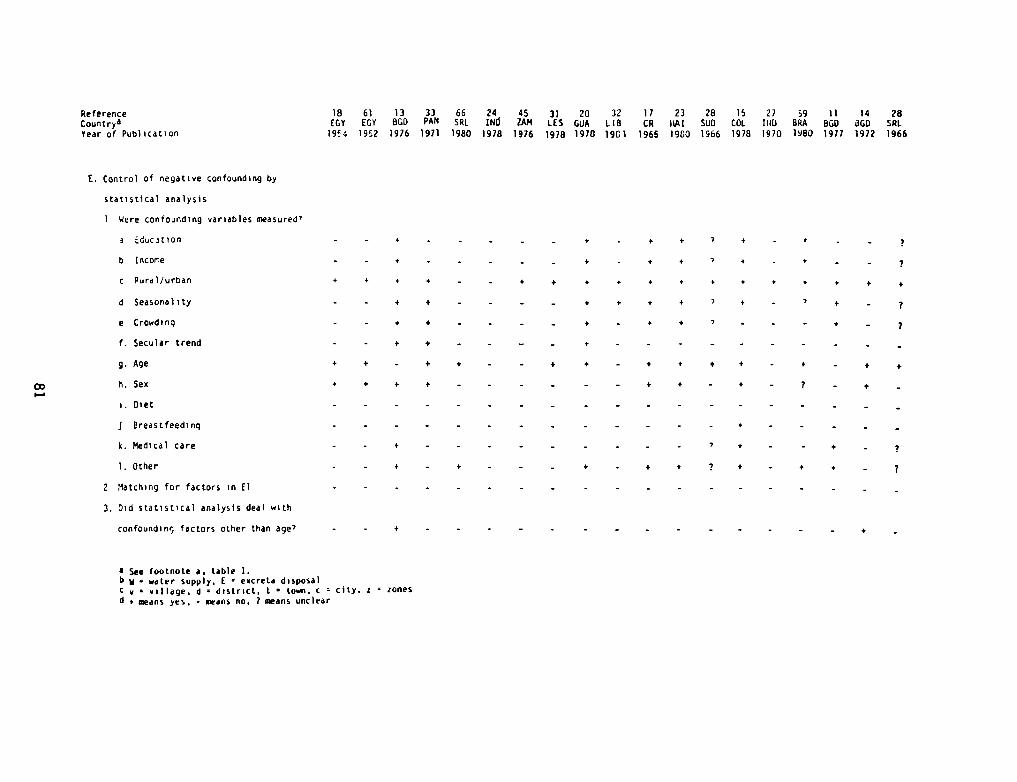
ReferenceCount ryaYear of Publication
E. Control of negative confounding by
18 61 13 33 66 24 45 31 20 32 11 23 28 15 27 59 11 14 28(COY EGY 860 PAN SRI INd lAM LES QUA LIB CR hA! SUD COL 1)10 BRA 860 860 SRI
l9~4 1952 1976 1971 1980 1978 1976 1978 1970 1961 1965 1960 1966 1978 1970 1980 1977 1972 1966
statistical analysis
Were confounding variables measured’
a Educition
b Income
c Pura)/urban
d Seasonality
e Crowdinq
f. Secular trend
g. Age
h. Sex
i. Diet
j Breastfeedinq
k. Medical care
1. Other
2 Matching for factors in El
3. Did statistical analysis deal with
confounding factors other than age’
- - + +
+ + - +
+ + + +
- +
— - + + +
- - + - +
- - — - + -
+ - — + + - +
- +
- +
- +
+ +
, +
7 4
+ + + + + + +
7 + - 7 + -
7 - . - + - 7
+ - +
— — +
- 7 +
+ 7 +
+ +
• See footnote a. table 1.b V water supply. I eocreta disposalc ~ village. d o district. I town. c city. a zonesd to means yes. - means no~ 7 means unclear
- - + -
+ + + + —
- - + + -
- - + + -
+ -
+ -
— 7
- 7
+ +
+ —
+ - +
— 7
- +
+ -
— 7
— 7
+
+
- +
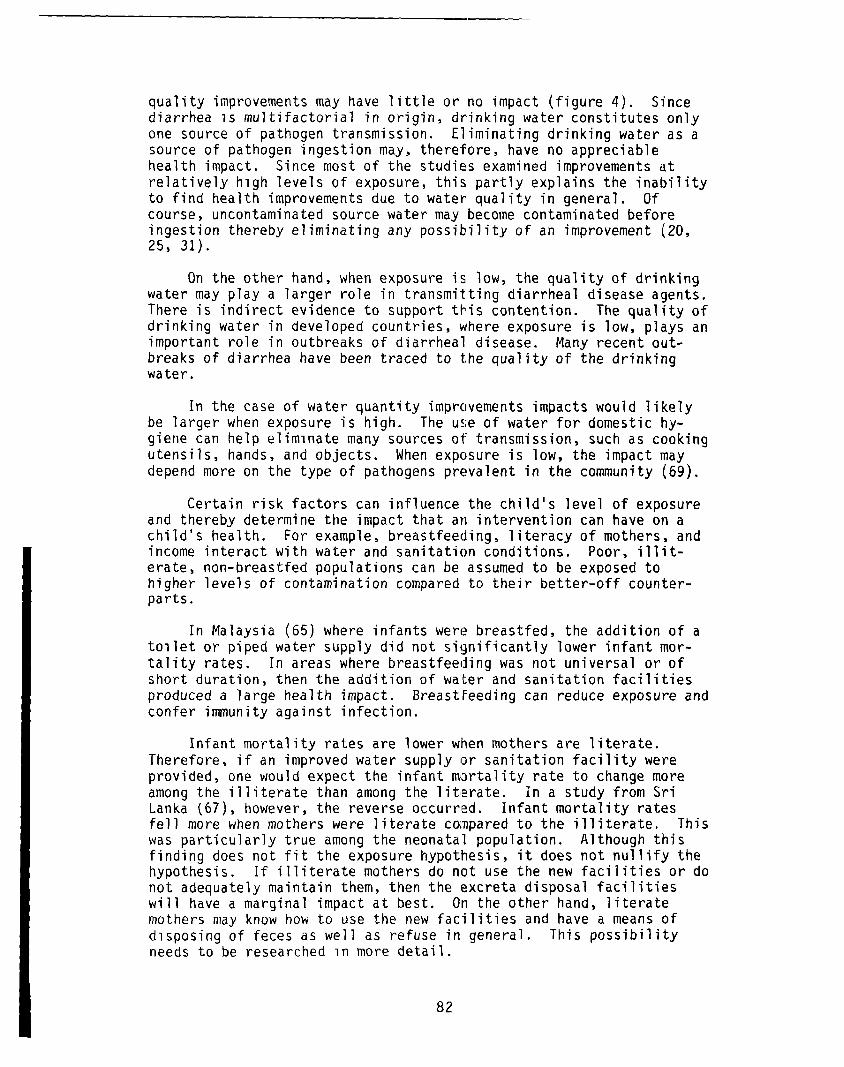
quality improvements may have little or no impact (figure 4). Sincediarrhea is multifactorial in origin, drinking water constitutes onlyone source of pathogen transmission. Eliminating drinking water as asource of pathogen ingestion may, therefore, have no appreciablehealth impact. Since most of the studies examined improvements atrelatively high levels of exposure, this partly explains the inabilityto find health improvements due to water quality in general. Ofcourse, uncontaminated source water may become contaminated beforeingestion thereby eliminating any possibility of an improvement (20,25, 31).
On the other hand, when exposure is low, the quality of drinkingwater may play a larger role in transmitting diarrheal disease agents.There is indirect evidence to support this contention. The quality ofdrinking water in developed countries, where exposure is low, plays animportant role in outbreaks of diarrheal disease. Many recent out-breaks of diarrhea have been traced to the quality of the drinkingwater.
In the case of water quantity improvements impacts would likelybe larger when exposure is high. The use of water for domestic hy-giene can help eliminate many sources of transmission, such as cookingutensils, hands, and objects. When exposure is low, the impact maydepend more on the type of pathogens prevalent in the community (69).
Certain risk factors can influence the child’s level of exposureand thereby determine the impact that an intervention can have on achild’s health. For example, breastfeeding, literacy of mothers, andincome interact with water and sanitation conditions. Poor, illit-erate, non-breastfed populations can be assumed to be exposed tohigher levels of contamination compared to their better—off counter-parts.
In Malaysia (65) where infants were breastfed, the addition of atoilet or piped water supply did not significantly lower infant mor-tality rates. In areas where breastfeeding was not universal or ofshort duration, then the addition of water and sanitation facilitiesproduced a large health impact. Breastreeding can reduce exposure andconfer immunity against infection.
Infant mortality rates are lower when mothers are literate.Therefore, if an improved water supply or sanitation facility wereprovided, one would expect the infant mortality rate to change moreamong the illiterate than among the literate. In a study from SriLanka (67), however, the reverse occurred. Infant mortality ratesfell more when mothers were literate compared to the illiterate. Thiswas particularly true among the neonatal population. Although thisfinding does not fit the exposure hypothesis, it does not nullify thehypothesis. If illiterate mothers do not use the new facilities or donot adequately maintain them, then the excreta disposal facilitieswill have a marginal impact at best. On the other hand, literatemothers may know how to use the new facilities and have a means ofdisposing of feces as well as refuse in general. This possibilityneeds to be researched in more detail.
82
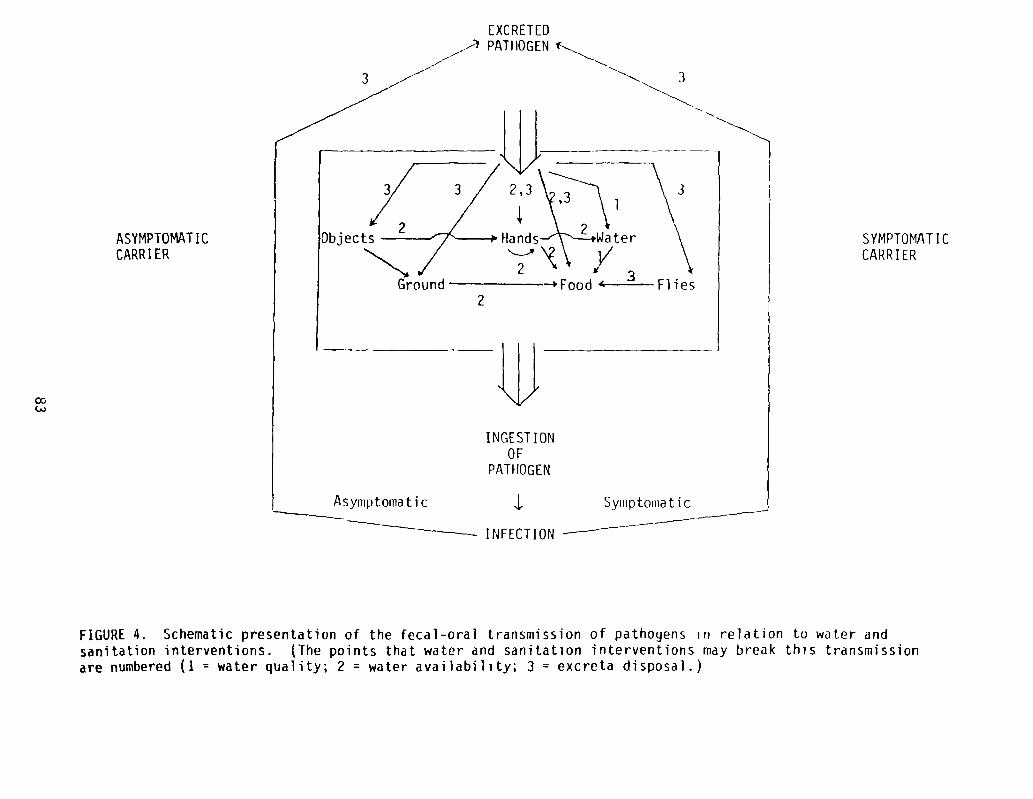
OD(,J
ASYMPTOMAT ICCARRIER
PATHOGEN
INFECT ION
SYMPTOMAT ICCARRIER
FIGURE 4. Schematic presentation of the fecal-oral transmission of pathogens in relation to water andsanitation interventions. (The points that water and sanitation interventions may break this transmissionare numbered (1 = water quality; 2 = water availability; 3 = excreta disposal.)
3
[XCRETED
PATHOGEN
3
)bjects
3
2
2
1
ood ‘- Flies
INGEST IONOF
Asymptomatic Syinptouiat i c

In Fiji (56) toilet and income interacted among the Fijian popu-lation. Flush toilets were associated with improved child nutritionalstatus among the low income group. This was also true among the highincome group but to a much lesser extent. Thus, when exposure washigh, toilets produced a measurable health impact.
In Ethiopia (19) sanitation was a riore powerful predictor ofmorbidity than were cultural demographic characteristics of the house-hold. During the first two years of life children had less diarrheawhen they came from families with higher water usage per person com-pared to children from families with lower water usage per person.This effect was greatest when no latrine was present in the household.Thus when exposure is high increased use of water can reduce diarrhearates among children. In this study the amount of water used perperson was more important than the source of water used.
Despite the inferences drawn from these studies, it is certainlydifficult to calculate accurate estimates of the magnitude of improvedhealth, but this should be less difficult if the methodological issuesdescribed above are considered in the design and analysis of water andsanitation evaluations. Although it is unlikely that double—blindrandomized trials can be designed for sanitation or water availabilityinterventions because recipients and enumerators would know whichvillages received the intervention, double-blind randomized trials arepossible for water quality interventions. For instance, improvingpiped water in communities selected at random among many communitieswith piped water of bad quality should be possible. Thus, recipientsand enumerators could be blinded as to who receives the good or poorquality water. If the ideal study cannot be implemented, those partswhich are possible should be implemented. For instance, randomiza-tion, albeit not double-blinded, could be a part of sanitation andwater supply interventions. Most projects are implemented over aperiod of years. Therefore, randomization could be incorporated intothe staging of the project.
The biological theory and epidemiological techniques are advancedenough to provide better estimates of the cost-effectiveness of wateror sanitation programs. Failure to provide more accurate estimatescould very likely lead to the reallocation of available funds awayfrom water and sanitation projects and toward other projects. Inshort, many of the water and sanitation programs being planned andimplemented for the International Drinking Water Supply and SanitationDecade should be evaluated so that their cost-effectiveness relativeto other interventions can be demonstrated.
84

REFERENCES
1. Rhode JE, Northrup RS. Taking science where the diarrhoea is.In: Elliott K, ed. Acute diarrhoea in childhood. Amsterdam:Elsevier/Excerpta Medica, 1976.
2. World Bank. Water Supply and Waste Disposal. Washington, D.C.:Transportation, Water, and Telecommunications Department, 1980.
3. White GE, Bradley DJ, White AU. Drawers of Water: DomesticWater Use in East Africa. Chicago: University of Chicago Press,1972.
4. Saunders RJ, Warford JJ. Village Water Supply: Economics andPolicy in the Developing World. Baltimore: Johns Hopkins Uni-versity Press, 1976.
5. United Nations. Report of the United Nations Water Conference,Mar del Plata, 14-25 March. New York: (document E/CONF. 70/29),1977.
6. World Health Organization. World Health Statistics Report:Water and Sanitation 1976; 29:544-603.
7. Kalbermatten JM, Julius DS, Gunnerson, CG. Appropriate Tech-nology for Water Supply and Sanitation: Technical and EconomicOptions. Washington, D.C.: World Bank, 1980.
8. Hughes JM, Boyce JM, Levine RJ, et a]. Epidemiology of eltorcholera in rural Bangladesh: Importance of surface water intransmission. Bull WHO1982; 60:395-404.
9. Spira WM, Khan MU, Saeed YA, et a]. Microbiological surveillanceof intraneighborhood El Tor Cholera transmission in rural Bangla-desh. Bull WHO 1980; 58:731-40.
10. Skoda JD, Mendis JB, Chia M. A survey in rural Bangladesh ondiarrhoeal morbidity, water usage and related factors. Dacca:UNICEF (First Report), 1977.
11. Curlin GT, Aziz KMA, Khan, MR. The influence of drinkingtubewell water on diarrhea rates in Matlab Thana, Bangladesh.Dacca, Cholera Research Lab Working Paper #1, 1977.
12. Khan M, Curlin GT. Urban cholera study, 1974 and 1975. Dacca,International center for diarrhoeal disease research, BangladeshScientific Report #7, 1977.
13. Levine RJ, Khan MR, O’Sauza S, et al. Failure of sanitary wellsto protect against cholera and other diarrhoea in Bangladesh.Lancet 1976; 10 July:86-9.
85
14. Sommer A, Woodward WE. The influence of protected water supplieson the spread of Classical/Inaba and El Tor/Ogawa cholera inrural East Bengal. Lancet 1972; 2:985—7.
15. Wray JO. Direct nutrition intervention and the control of diar-rheal diseases in preschool children. AJCN 1978; 31:2073-82.
16. Koopman JS. Diarrhea and school toilet hygiene in Cali, Colom-bia. Amer J Epi 1978; 107:412-20.
17. Moore I-IA, de la Cruz L, Vargas-Mendez 0. Diarrhea] diseasestudies in Costa Rica: IV. The influence of sanitation upon theprevalence of intestinal infection and diarrheal disease. Amer JEpi 1965; 82:162-84.
18. Chandler AC. A comparison of helminthic and protozoan infectionin two Egyptian villages two years after installation of sanitaryimprovements in one of them. Amer J Trop Med Hyg 1954; 3:59-73.
19. Ereij L, Wall S. Exploring child health and its ecology. ActaPaediatrica Scandinavica 1977; Supplement 267:1-180.
20. Shiffman MA, Schneider R, Faigenblum JM, et al. Field studies onwater sanitation and health education in relation to healthstatus in Central America. Prog Wat Tech 1978; 11:143-50.
21. Bruch HA, Ascoli 14, Scrimshaw NS, et al. Studies of diarrhealdisease in Central America. V. E:nvironmental fators in theorigin and transmission of acute diarrhea] disease in four Guate-malan villages. Amer J Trop Med Hyg 1963; 12:567-79.
22. Beck MD, Munoz JA, Scrimshaw NS. Studies on diarrhoeal diseasesin Central America. I. Preliminary findings on cultural surveysof normal population groups in Guatemala. Amer J Trop Med Hyg1957; 6:62—71.
23. Thacker JB, Music SI, Pollard RA, et al. Acute water shortageand health problems in Haiti. Lancet 1980; 1:471-3.
24. Raman V. Parhad NM, Deshpande AW, et al. Assessment and controlof water quality in a town distribution system with reference tothe incidence of gastrointestinal diseases. Prog Water Tech1978; 11:65-71.
25. Rajaskeran P, Dutt PR, Pisharoti (A. Impact of water supply onthe incidence of diarrhoea and Shigellosis among children inrural communities in Madurai. Ind J Med Res 1977; 66:189-99.
26. Trivedi BK, Gandhi HS, Shukla NK. Bacteriological water qualityand incidence of water borne diseases in a rural population. mdJ Med Sci 1971; 25:795-801.
86

27. Kumar P, Sehgal BS, Singh R. Bore-hole disposal of excreta ofchildren and diarrhoeal morbidity in a rural community. Env Hlth1970; 12:155-9.
28. Van Zijl WJ. Studies on diarrhoea] diseases in seven countriesby the WHO diarrhoeal disease advisory team. Bull WHO 1966;35: 249-61.
29. White GE, Bradley DJ, White AV. Drawers of Water. Chicago:Univ of Chicago Press, 1972.
30. Fenwick KWH. The short term effects of a pilot environmentalhealth project in rural Africa: The Zaina scheme re-assessedafter four years. Mimeographed undated.
31. Feachem R, Burns E, Cairncross 5, et al. Water Health andDevelopment. London: Tn-Med Books, 1978.
32. Ghannoum MA, Moore KE, Al-Dulaimi M, et a]. The incidence ofwater-related diseases in the Brak area, Libya from 1977 to 1979,before and after the installation of water treatment plants. ZblBakt Hyg, I Abt Orig B 1981; 173:501-8.
33. Kourany M, Vasquez MA, Mata U. Prevalence of pathogenic entericbacteria in children in 31 Panamanian communities. Amer J TropMed Hgy 1971; 20:608-15.
34. Azurin JC, Alvero H. Field evaluation of environmental sanita-tion measures against cholera. Bull WHO 1974; 51:19-26.
35. Henry FJ. Environmental sanitation infection and nutritionalstatus of infants in rural St. Lucia, West Indies. Trans Roy SocTrop Med Hyg 1981; 75:507-13.
36. Bannaga S, Pickford J. Water-health relationships in the Sudan.Effluent and Water Treatment Journal 1978; Nov:560—9.
37. Burr ML. Diarrhoea and the drought. Public Hlth, London 1978;92:86-7.
38. Rubenstein A, Boyle J, Odoroff Cl, et a]. Effect of improvedsanitary facilities on infant diarrhea in a Hopi village. PublicHlth Reports 1969; 84:1093-7.
39. Petersen NJ, Hines VD. The relation of summertime gastrointesti-nal illness to the sanitary quality of the water supplies in sixRocky Mountain communities. Amer J Hyg 1960; 71:314-20.
40. Schliessman DJ. Diarrhoeal disease and the environment. BullWHO 1959; 21:381-6.
41. McCabe U, Haines TW. Diarrheal disease control by improvedhuman excreta disposal. Public Hlth Reports 1957; 72:921-8.
87
42. Stewart WH, McCabe U, Hemphill EC, et a]. The relationship ofcertain environmental factors to prevalence of Shigella infectionIV. Diarrheal disease control studies. Amer J Trop Med Hyg1955; 4:718-24.
43. Hollister AC, Beck MD, Gittelsohn I~M, et al. Influence of wateravailability on Shigella prevalence in children of farm laborfamilies. AJPH 1955; 45:354-62.
44. Watt J, Hollister AC, Beck MD, et al. Diarrhea diseases inFresno county, California. AJPH 1953; 43:728—41.
45. Bahi MR. Impact of piped water supply on the incidence oftyphoid fever and diarrhoeal diseases in Lusaka. Med J Zambia1976; 10:98—9.
46. Martorell R, Habicht J—P, Yarbrough C, et al. Underreporting infortnightly recall morbidity surveys. J Trop Ped 1976; 22:129—34.
47. Rahamari MM, Aziz KMS, Munshi MH, et al. A diarrhea clinic inrural Bangladesh: Influence of distance, age, and sex on atten-dance and diarrhea] mortality. AJPH 1982; 72:129-34.
48. Kielman AA, Taylor CE, DeSweemer C, et al. The Narangwal experi-ment on interactions of nutrition and infection: II. Morbidityand mortality effects. md J Med Res 1978; 68 (Suppl.):21-41.
49. Dworkin D, Dworkiri J. Water supply and diarrhea: Guatemalarevisited. Washington, D.C.: AID Evaluation Special Study #2,1980.
50. Cvjetanovic B, Chen L, Kronmal R, et a]. Measuring and evalu-ating diarrhoea and malabsorption in association with a villagewater supply and sanitation. Washington, D.C.: Wash Tech Report#12, 1981.
51. Martorell R. Acute morbidity and physical growth in rural Guate-malan children. Amer J Dis Child ~975; 129:1296—301.
52. Mata U, Urrutia JJ, Albertazzi C, et al. Influence of recurrentinfections on nutrition and growth of children in Guatemala.AJCN 1972; 25:1267-75.
53. Rowland MGM, Cole TJ, Whitehead RG. A quantitative study intothe role of infection in determining nutritional status in Gain-bian village children. Brit 3 Nutr 1977; 37:441-50.
54. Esrey SA, Habicht 3-P. Nutritional anthropometric indicatorsfor evaluating water and sanitation projects. 1983; Paper pre-sented at the International Workshop on Measuring the HealthImpact of Water and Sanitation Programs. 21—25 Nov., Cox’sBazaar, Bangladesh.
88

55. Christiansen N, Mona JO, Herrera MG. Family social characteris-tics related to physical growth of young children. Brit 3 PreySoc Med 1975; 29:121-30.
56. Yee V. Household level correlates of child nutritional status inFiji. 1983; Master~sThesis, Div Nutr Sci, Cornell University.
57. Tomkins AM, Drasar BS, Bradley AK, et a]. Water supply andnutritional status in rural Northern Nigeria. Trans Roy Soc TropMed Hyg 1978; 72:239-43.
58. Merrick 1. The effect of piped water on early childhood mortal-ity in urban Brazil, 1970-1976. World Bank Working Paper #594,1983.
59. Victora CS, Blank N. Epidemiology of infant mortality in RioGrande de Sol, Brazil. 3 Trop Med Hyg 1980; 83:177-86.
60. Haines MR, Avery RC. Differential infant and child mortality inCosta Rica: 1968-1972. Pop Studies 1982; 36:31-43.
61. Weir JM. An evaluation of health and sanitation in Egyptianvillages. J Egyptian Pub Hlth Assoc 1952; 27:55—114.
62. Zaheer M, Prasad BG, Govil KK, et al. A note on urban watersupply in Uttar Pradesh. J md Med Assoc 1962; 38:177-82.
63. Anker R, Knowles JC. An empirical analysis of morbidity differ-entials in Kenya at the macro and micro levels. Econ Dev &Cultural Change 1980 29:165-85.
64. Butz WP, DaVanzo J, Habicht J-P, et al. Environmental factors inthe relationship between breastfeeding and infant mortality: Therole of sanitation and water in Malaysia. Amer 3 Epi, 1984;119:516-25.
65. Butz WP, DaVanzo J, Habicht J-P, et a]. Biological and behav-ioral influences on the mortality of Malaysian infants. SantaMonica: The Rand Corporation, 1982.
66. Patel N. Effects of the health services and environmentalfactors on infant mortality: The case of Sri Lanka. 3 Epi CommHlth 1980; 34:76-82.
67. Megeema SA. Socio-economic determinants of infant and childhoodmortality in Sri Lanka: An analysis of post-war experience.London: World Fertility Survey Report #8, 1980.
68. Habicht J-P, Butz WP. Measurements of health and nutritioneffects of large-scale nutrition intervention projects. In:Evaluating the impact of nutrition and health programs. PlenumPublishing Corporation, 1979.
89

69. Esrey SA, Feachem RG, Hughes J. Interventions for the control ofdiarrhoeal diseases among young children: Improving watersupplies and excreta disposal facilities. Bull WHO 1985; 63:(4),in press.
90

~i.~