
A methodology for strategic sourcing
15
O.R. Applications A methodology for strategic sourcing Srinivas Talluri * , Ram Narasimhan Department of Marketing and Supply Chain Management, Eli Broad College of Business, Michigan State University, N370 North Business Complex, East Lansing, MI 48824, USA Received 16 May 2001; accepted 29 July 2002 Abstract Strategic sourcing is critical for firms practicing the principles of supply chain management. It specifically deals with managing the supply base in an effective manner by identifying and selecting suppliers for strategic long-term part- nerships, involving in supplier development initiatives by effectively allocating resources to enhance supplier perfor- mance, providing benchmarks and continuous feedback to suppliers, and in some cases involving in supplier pruning activities. Currently, the methodologies in practice for strategic sourcing have mostly been subjective in nature with few objective decision models focused at supplier evaluation, which are also not devoid of limitations. This paper proposes an objective framework for effective supplier sourcing, which considers multiple strategic and operational factors in the evaluation process. Suppliers are categorized into groups based on performance, which assists managers in identifying candidates for strategic long-term partnerships, supplier development programs, and pruning. In addition, this research investigates the differences among supplier groups in proposing possible improvement strategies for ineffectively per- forming suppliers. Also, we demonstrate the methodological richness of our framework when compared to some of the traditional methods proposed and utilized for supplier evaluation purposes. The supplier data utilized in the study is obtained from a large multinational corporation in the telecommunications industry. Ó 2002 Elsevier B.V. All rights reserved. Keywords: Nonparametric efficiency analysis; Purchasing; Strategic sourcing 1. Introduction Strategic sourcing is a critical challenge faced by many firms involved in the latest innovations of supply chain management. With the recent emphasis on just-in-time (JIT) manufacturing phi- losophy, strategic sourcing that establishes a long- term relationship with suppliers has become even more important and vital for enhancing organi- zational performance. Also, in todayÕs dynamic environment strategic relationship with suppliers is a key ingredient to the success of a supply chain. Strategic sourcing decisions must not be solely based on operational metrics such as cost, quality, and delivery, but also incorporate strategic di- mensions and capabilities of suppliers such as emphasis on quality management practices, pro- cess capabilities, management practices, design and development capabilities, and cost reduction capabilities into the decision-making process. * Corresponding author. Tel.: +1-517-3536381; fax: +1-517- 4321112. E-mail addresses: [email protected] (S. Talluri), nara- [email protected] (R. Narasimhan). 0377-2217/$ - see front matter Ó 2002 Elsevier B.V. All rights reserved. doi:10.1016/S0377-2217(02)00649-5 European Journal of Operational Research 154 (2004) 236–250 www.elsevier.com/locate/dsw
-
Upload
srinivas-talluri -
Category
Documents
-
view
213 -
download
0
Transcript of A methodology for strategic sourcing

European Journal of Operational Research 154 (2004) 236–250
www.elsevier.com/locate/dsw
O.R. Applications
A methodology for strategic sourcing
Srinivas Talluri *, Ram Narasimhan
Department of Marketing and Supply Chain Management, Eli Broad College of Business, Michigan State University,
N370 North Business Complex, East Lansing, MI 48824, USA
Received 16 May 2001; accepted 29 July 2002
Abstract
Strategic sourcing is critical for firms practicing the principles of supply chain management. It specifically deals with
managing the supply base in an effective manner by identifying and selecting suppliers for strategic long-term part-
nerships, involving in supplier development initiatives by effectively allocating resources to enhance supplier perfor-
mance, providing benchmarks and continuous feedback to suppliers, and in some cases involving in supplier pruning
activities. Currently, the methodologies in practice for strategic sourcing have mostly been subjective in nature with few
objective decision models focused at supplier evaluation, which are also not devoid of limitations. This paper proposes
an objective framework for effective supplier sourcing, which considers multiple strategic and operational factors in the
evaluation process. Suppliers are categorized into groups based on performance, which assists managers in identifying
candidates for strategic long-term partnerships, supplier development programs, and pruning. In addition, this research
investigates the differences among supplier groups in proposing possible improvement strategies for ineffectively per-
forming suppliers. Also, we demonstrate the methodological richness of our framework when compared to some of the
traditional methods proposed and utilized for supplier evaluation purposes. The supplier data utilized in the study is
obtained from a large multinational corporation in the telecommunications industry.
� 2002 Elsevier B.V. All rights reserved.
Keywords: Nonparametric efficiency analysis; Purchasing; Strategic sourcing
1. Introduction
Strategic sourcing is a critical challenge faced by
many firms involved in the latest innovations
of supply chain management. With the recent
emphasis on just-in-time (JIT) manufacturing phi-losophy, strategic sourcing that establishes a long-
* Corresponding author. Tel.: +1-517-3536381; fax: +1-517-
4321112.
E-mail addresses: [email protected] (S. Talluri), nara-
[email protected] (R. Narasimhan).
0377-2217/$ - see front matter � 2002 Elsevier B.V. All rights reserv
doi:10.1016/S0377-2217(02)00649-5
term relationship with suppliers has become even
more important and vital for enhancing organi-
zational performance. Also, in today�s dynamic
environment strategic relationship with suppliers is
a key ingredient to the success of a supply chain.
Strategic sourcing decisions must not be solelybased on operational metrics such as cost, quality,
and delivery, but also incorporate strategic di-
mensions and capabilities of suppliers such as
emphasis on quality management practices, pro-
cess capabilities, management practices, design
and development capabilities, and cost reduction
capabilities into the decision-making process.
ed.

S. Talluri, R. Narasimhan / European Journal of Operational Research 154 (2004) 236–250 237
These supplier attributes provide information to a
firm�s managers on the infrastructure and practices
employed by the suppliers, which are key elements
for long-term strategic relationships (SR). It is well
established in the strategic supplier evaluation lit-
erature that sourcing decisions significantly impactvarious aspects of a product such as cost, design,
manufacturability, and quality (Burt, 1984; Bur-
ton, 1988). Other research that emphasizes the
importance of supplier evaluation includes works
by Banker and Khosla (1995) and Dobler et al.
(1990). Banker and Khosla (1995) have identified
the supplier evaluation and justification problem
as an important one in operations management.While several methods have been proposed and
utilized for evaluation and selection of suppliers,
they have limitations including: evaluation solely
based on operational metrics without the consid-
eration of strategic capabilities, simple weighted
scoring methods based on subjective assessments,
inappropriate or arbitrary methods utilized to
derive factor weights, and lack of relative evalua-tion across various suppliers. We now expand on
each of these limitations.
While operational metrics such as price, quality
and delivery are important and critical in evalu-
ating suppliers, strategic evaluation of suppliers
leading to a long-term relationship requires con-
sideration of supplier capabilities and practices.
This is important because as a firm�s productsevolve over time it is critical to form relationships
with suppliers that can effectively meet the chang-
ing requirements from the perspective of new prod-
uct development, design, manufacturing processes
and manufacturing capability, at lower costs. Such
suppliers are more likely in the long run to have
the infrastructure and organizational capabilities
in place to effectively meet the changing demandsof the buying firms. For example, it has been
suggested in the literature that quality manage-
ment practices with strategic implications such as
total quality management, zero defects, process
improvement, statistical process control, and con-
tinuous process improvement lead to tangible im-
provements in quality and cost reduction (De Ron,
1998; Lederer and Rhee, 1995; Tham, 1988). Sim-ilarly, design based practices that encompass ini-
tiatives such as design for manufacturability,
modularity, product redesign, concurrent engi-
neering, and standardization have also been asso-
ciated with cost reduction and better delivery
performance (Koulamas, 1992; Tummala et al.,
1997; Coughlan and Wood, 1992). Thus, it is im-
portant to consider these factors in supplier eval-uation decisions.
Several techniques utilized for evaluation of
suppliers assign importance weights to various
supplier evaluation factors in a subjective and/or
arbitrary manner. As the complexity of the deci-
sion-making process increases in terms of factors
and alternatives considered, it is increasingly dif-
ficult to assign a consistent set of weights. Finally,relative evaluation methods that compare suppli-
ers and identify potential reasons for differences in
supplier performance have not been fully explored
in the literature. The primary advantage associated
with relative evaluation methods is that they allow
for grouping suppliers based on performance,
which provides useful insights to management in
identifying benchmarks for ineffective suppliers,and assists in decisions relating to supplier devel-
opment initiatives (SDI) and programs.
This paper proposes a methodology for strate-
gic sourcing that addresses the aforementioned
issues. The methodology utilizes a combination of
traditional and advanced data envelopment anal-
ysis (DEA) models in estimating the efficiencies of
alternative suppliers, and the variability in theirefficiency scores. Nonparametric statistical tech-
niques are utilized in identifying homogenous
groups of suppliers based on their efficiency scores,
which assist management in selecting suppliers
for strategic partnerships, SDI, and supply base
rationalization decisions. Inter-group differences
with respect to various factors are identified in
order to assist in benchmarking and process im-provement efforts.
In summary, some of the questions our meth-
odology addresses, which current supplier evalua-
tion techniques do not comprehensively answer,
are:
• Which suppliers to consider for strategic part-
nerships?• Which suppliers must be a part of supplier de-
velopment initiatives?

238 S. Talluri, R. Narasimhan / European Journal of Operational Research 154 (2004) 236–250
• Which suppliers must be pruned from the sup-
ply base?
• How can ineffective suppliers improve their per-
formance? Against whom should they bench-
mark?• How can firms effectively allocate resources to
supplier improvement programs?
While our paper proposes a new methodology
for evaluating suppliers, the primary focus of our
study is on managerial implications and usefulness
of the results in addressing strategic sourcing is-
sues faced by companies.
2. Literature review
Supplier evaluation is one of the most widely
researched areas in purchasing with methodologies
ranging from conceptual to empirical and model-
ing streams. It is beyond the scope of this paper todiscuss all these works in detail. Since our frame-
work is primarily related to the modeling area, we
mainly limit our discussion to quantitative models
proposed for supplier evaluation.
Empirical work in supplier evaluation dates
back to 1960s. Dickson (1966) conducted a study
that investigated the importance of supplier eval-
uation criteria for industrial purchasing managers.The study concluded that cost, quality, and de-
livery performance were the three most impor-
tant criteria in supplier evaluation. Other relevant
works in this area emphasized the strategic im-
portance of supplier evaluation and the relative
importance and tradeoffs among cost, quality, and
delivery (Hahn et al., 1983; Jackson, 1983; Kralijic,
1983; Browning et al., 1983; Ansari and Modar-ress, 1986; Treleven, 1987; Burton, 1988; Bernard,
1989; Benton and Krajeski, 1990, and Ellram,
1990). Other researchers that specifically addressed
issues relating to the relative importance of various
supplier attributes include Monczka et al. (1981),
Moriarity (1983), Woodside and Vyas (1987),
Chapman and Carter (1990), Tullous and Munson
(1991), and Weber et al. (1991). Based on a reviewof 74 articles on supplier evaluation, Weber et al.
(1991) concluded that quality was the most im-
portant factor followed by delivery performance
and cost in supplier evaluation. It is evident from
these studies that multiple factors need to be in-
corporated into the supplier evaluation process
and that it should not be solely based on a single
criterion such as cost. However, these works have
not developed decision models for supplier evalu-ation.
2.1. Supplier evaluation techniques
In a comprehensive review of supplier selection
methods, Weber et al. (1991) reported that 47 of
the 74 articles in the review utilized multiple cri-
teria. Some of the traditional multi-criteria ap-proaches have utilized factors such as cost, quality,
and delivery, which have become increasingly im-
portant with the emphasis on JIT manufacturing
philosophy (Chapman, 1989; Chapman and Car-
ter, 1990). However, these measures are primarily
at the operational level.
Table 1 depicts the supplier evaluation tech-
niques by methodological area. Several of thesetechniques have utilized multiple supplier criteria
in the evaluation process. However, some of the
issues with many of these techniques include lack
of objective methods for assigning factor weights,
lack of relative comparison of alternative suppliers
for facilitating benchmarking and SDI, minimal
emphasis on strategic level capabilities or prac-
tices, and not addressing issues and reasons relat-ing to ineffective supplier performance.
Application of DEA as a tool for strategic
sourcing of suppliers has been limited. To date
there have been few works that have applied this
tool for supplier evaluation purposes. Kleinsorge
et al. (1992) utilized DEA as a tool for perfor-
mance monitoring of a single supplier over time.
However, their work did not address issues relat-ing to strategic supplier selection or benchmark-
ing. Two articles by Weber and Desai (1996) and
Weber et al. (1998) have addressed the issue of
supplier selection and negotiation using DEA.
However, the supplier metrics utilized by them
were strictly operational ones. Also, their analysis
is based on a traditional DEA model, which has
certain limitations as discussed in the next sectionof the paper. Narasimhan et al. (2001) have ap-
plied DEA for strategic evaluation of suppliers by
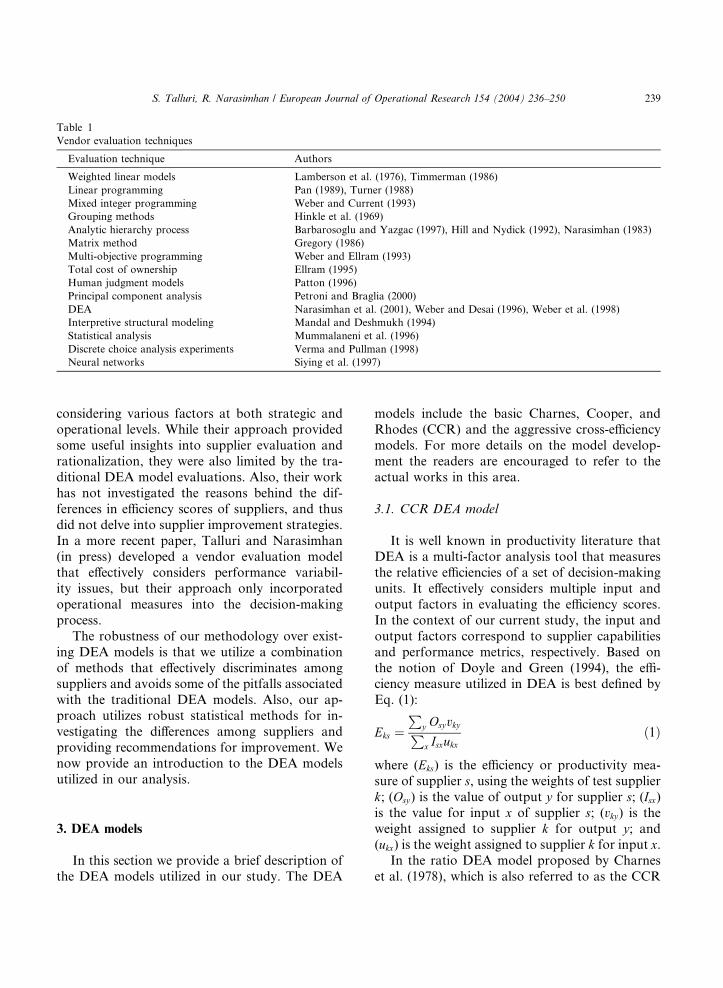
Table 1
Vendor evaluation techniques
Evaluation technique Authors
Weighted linear models Lamberson et al. (1976), Timmerman (1986)
Linear programming Pan (1989), Turner (1988)
Mixed integer programming Weber and Current (1993)
Grouping methods Hinkle et al. (1969)
Analytic hierarchy process Barbarosoglu and Yazgac (1997), Hill and Nydick (1992), Narasimhan (1983)
Matrix method Gregory (1986)
Multi-objective programming Weber and Ellram (1993)
Total cost of ownership Ellram (1995)
Human judgment models Patton (1996)
Principal component analysis Petroni and Braglia (2000)
DEA Narasimhan et al. (2001), Weber and Desai (1996), Weber et al. (1998)
Interpretive structural modeling Mandal and Deshmukh (1994)
Statistical analysis Mummalaneni et al. (1996)
Discrete choice analysis experiments Verma and Pullman (1998)
Neural networks Siying et al. (1997)
S. Talluri, R. Narasimhan / European Journal of Operational Research 154 (2004) 236–250 239
considering various factors at both strategic andoperational levels. While their approach provided
some useful insights into supplier evaluation and
rationalization, they were also limited by the tra-
ditional DEA model evaluations. Also, their work
has not investigated the reasons behind the dif-
ferences in efficiency scores of suppliers, and thus
did not delve into supplier improvement strategies.
In a more recent paper, Talluri and Narasimhan(in press) developed a vendor evaluation model
that effectively considers performance variabil-
ity issues, but their approach only incorporated
operational measures into the decision-making
process.
The robustness of our methodology over exist-
ing DEA models is that we utilize a combination
of methods that effectively discriminates amongsuppliers and avoids some of the pitfalls associated
with the traditional DEA models. Also, our ap-
proach utilizes robust statistical methods for in-
vestigating the differences among suppliers and
providing recommendations for improvement. We
now provide an introduction to the DEA models
utilized in our analysis.
3. DEA models
In this section we provide a brief description ofthe DEA models utilized in our study. The DEA
models include the basic Charnes, Cooper, andRhodes (CCR) and the aggressive cross-efficiency
models. For more details on the model develop-
ment the readers are encouraged to refer to the
actual works in this area.
3.1. CCR DEA model
It is well known in productivity literature thatDEA is a multi-factor analysis tool that measures
the relative efficiencies of a set of decision-making
units. It effectively considers multiple input and
output factors in evaluating the efficiency scores.
In the context of our current study, the input and
output factors correspond to supplier capabilities
and performance metrics, respectively. Based on
the notion of Doyle and Green (1994), the effi-ciency measure utilized in DEA is best defined by
Eq. (1):
Eks ¼P
y OsyvkyPx Isxukx
ð1Þ
where (Eks) is the efficiency or productivity mea-
sure of supplier s, using the weights of test supplier
k; (Osy) is the value of output y for supplier s; (Isx)is the value for input x of supplier s; (vky) is the
weight assigned to supplier k for output y; and(ukx) is the weight assigned to supplier k for input x.
In the ratio DEA model proposed by Charnes
et al. (1978), which is also referred to as the CCR

240 S. Talluri, R. Narasimhan / European Journal of Operational Research 154 (2004) 236–250
model, each test supplier k selects optimal weights
for capabilities (inputs) and performance metrics
(outputs) in achieving the highest possible effi-
ciency score subject to the restrictions that these
weights prevent the set of suppliers s from
achieving an efficiency score of greater than 1. TheCCR model is presented in expression (2) below:
maximize Ekk ¼P
yOkyvkyP
xIkxukx
subject to :Eks 6 1 8 Suppliers sukx; vky P 0
ð2Þ
The conversion of (2) into a linear programming
problem is shown below in (3).
maximize Ekk ¼PyOkyvky
subject to :Eks 6 1 8 Suppliers sPxIkxukx ¼ 1
ukx; vky P 0
ð3Þ
This conversion is performed by equating the de-
nominator of the efficiency ratio in (2) to a value of
1, represented by the constraintP
x Ikxukx ¼ 1.
The result of problem (3) is an optimal effi-
ciency score (E�kk), which does not exceed a value of
1. If E�kk ¼ 1 and the corresponding slack variables
are 0 then supplier k is considered to be efficient. If
E�kk < 1, then supplier k does not lie on the efficient
frontier and is dominated by at least one other
supplier or a linear combination of suppliers.
Problem (3) is executed s times in evaluating the
efficiency scores of all the suppliers.
3.2. Cross-efficiency models
Cross-efficiency models are primarily utilized toovercome the unrestricted weight flexibility prob-
lem of the CCR model. The CCR model allows
DMUs to emphasize relatively few inputs and
outputs in achieving a high efficiency score while
ignoring other important factors. Sexton et al.
(1986) introduced the concept of cross-efficiencies
and the cross-efficiency matrix (CEM) in DEA. In
the context of the current paper, the CEM pro-vides information on the efficiency of a specific
supplier with the optimal weighting schemes de-
termined for other suppliers. In the CEM, the ele-
ment in kth row and the sth column represents the
efficiency measure of supplier s when evaluated
against the optimal weights of supplier kðEksÞ.Each of the columns of the CEM is then averaged
to get a mean cross-efficiency score for each sup-plier. The suppliers can be ranked based on these
mean scores. Thus, the CEM provides a mech-
anism for effectively differentiating among the
suppliers.
One issue that may arise in utilizing the cross-
efficiency scores is the uniqueness of the input and
output factor weights obtained from the CCR
model used in their evaluation. This makes thecross-efficiency analysis arbitrary and limits its
applicability. To overcome this potential limita-
tion, a formulation developed by Doyle and Green
(1994) may be used for cross-efficiency evaluations
and development of a CEM. This formulation,
shown as (4), generates a unique set of weights.
minimizePy
vkyPs 6¼k
Osy
!;
subject to : Px
ukxPs 6¼k
Isx
!¼ 1;P
yOkyvky � E�
kk
PxIkxukx ¼ 0
Eks 6 1 8 Suppliers s 6¼ kukx; vky P 0
ð4Þ
The above formulation has a primary goal of
obtaining a maximum CCR efficiency score for
supplier k (the test unit) and a secondary goal of
determining a set of weights that minimize theother suppliers� aggregate output, as defined by the
objective function. The test unit k is defined as an
average unit whose efficiency is minimized. This
model has been defined as an aggressive formula-
tion. The data required in (4) includes the optimal
efficiency scores (E�kk) from the CCR model, as
shown by the second constraint set. Thus, a key
advantage of the aggressive model utilized incross-efficiency analysis is that units emphasize on
their strengths, which are the weaknesses of their
competitors. Thus, a unit with high mean cross-
efficiency score can be considered as a superior
performer because it is excelling across many

Table 2
Key differences between the CCR and cross-efficiency models
CCR model Cross-efficiency model
Allows for the selection of weights in an unrestricted
manner resulting in some units to achieve a high
relative efficiency score by emphasizing on relatively
few inputs and outputs
Computes the efficiency of each unit with respect to the optimal weights of
other units for a more comprehensive peer evaluation. This allows in
effectively differentiating between good overall performers and niche
performers
The model is run one time for each unit in obtaining
the relative efficiency scores
The model is run one time for each unit for determining the input and
output weights that not only maintain its CCR efficiency score but also
minimize the efficiency scores of all other units. These weights are utilized
in deriving a mean cross-efficiency score
Supply BaseEfficiencyEvaluation
Identificationof Supplier
Groups
Identificationof Group Diff. on
Inputs and Outputs
ManagerialDecisions
on SR, SDI, Pruning
Capabilities (Inputs)
Performance Metrics (Outputs)
Performance Feedbackand Resource AllocationDecisions
Fig. 1. A framework for strategic sourcing.
S. Talluri, R. Narasimhan / European Journal of Operational Research 154 (2004) 236–250 241
dimensions. The key differences and the relative
advantages of the cross-efficiency models over the
CCR model are summarized in Table 2.
The second reason for utilizing the cross-effi-
ciency analysis in our study is to identify vari-
ability in the efficiency scores of a supplier whenevaluated against the optimal weights of its peers.
This facilitates identifying homogenous groups of
suppliers for strategic relationships, SDI, and
pruning decisions for the buying firm.
The third reason for utilizing the cross-effi-
ciency analysis is associated with the limitations in
our sample size. Since small sample size exacer-
bates the unrestricted weight flexibility problem inDEA (Boussofiane et al., 1991), we utilize cross-
evaluations to discriminate better among the sup-
pliers.
It is important to note that other methods de-
veloped in the literature such as reconstructing
virtual input and output combinations from expert
consultation proposed by Thanassoulis and Allen
(1998), and the bootstrap procedure for replicatinginput–output combinations by Simar and Wilson
(1998) can be utilized as alternative approaches for
improving the discriminatory power of the DEA
models.
4. Methodology for strategic sourcing
Fig. 1 depicts the framework utilized for stra-
tegic sourcing. The first step involves the identifi-
cation of the suppliers to be evaluated followed by
data collection. Data collection can be performed
through questionnaires and/or site visits to candi-
date suppliers. The efficiency evaluations are per-
formed by obtaining data on capabilities (inputs)
and performance metrics (outputs) of suppliers
being evaluated. The following section provides
details on the data acquisition process. In general,
any resource can be utilized as a possible input
measure and outputs can encompass activity/per-
formance measures.
The next step involves the evaluation of effi-ciency scores and ranking of suppliers based on
DEA models. Subsequently, the supplier groups
are identified by a nonparametric procedure,
which effectively incorporates variability in effi-
ciency measures into the evaluation process. This
step is performed by utilizing a procedure pro-
posed by Talluri et al. (2000) in categorizing sup-
pliers into groups based on their cross-efficiencies.The next part of the framework addresses the
managerial decisions associated with supplier eval-
uation that can be handled through our analysis.
242 S. Talluri, R. Narasimhan / European Journal of Operational Research 154 (2004) 236–250
Here, we stress the identification of suppliers for
SR, SDI, and pruning, which assists managers in
decisions relating to partnerships and effective al-
location of resources to various SDI programs.
Also, we identify the differences among the sup-
plier groups in terms of capabilities and perfor-mance metrics, and provide feedback to ineffective
supplier groups regarding the necessary improve-
ments across various dimensions.
5. Strategic sourcing: An illustrative case
Our study was carried out in a large multi-national telecommunications company, which we
refer to as Company X throughout the paper in
order to maintain anonymity. Company X is a
global leader in design, production, and marketing
of communication systems. It operates production
plants, research and development facilities, and
distribution systems on a global basis. The critical
objectives of the company in procurement andsupply management include:
• improving the quality of purchased products/
services;
• reducing lead-time and improving on-time de-
livery;
• developing long-term relationships with key
suppliers;• securing global competitive pricing.
In order to achieve these objectives, Company
X has placed emphasis on supplier rationalization
by evaluating and developing suppliers for long-
term SR, providing continuous feedback for im-
proving performance, achieving excellence across
multiple competitive dimensions, and decreasingsupply based by pruning inefficient suppliers. As
discussed earlier, our framework specifically ad-
dresses these issues.
The factor selection and data acquisition pro-
cess was initiated by first defining the relevant
input and output dimensions to be utilized in the
efficiency analysis. This was accomplished in focus
group sessions with the management of CompanyX. Due to the decentralized nature of Company
X�s supply management system, these focus group
sessions required had to be carefully planned. A
series of meetings were conducted in order to
identify the specific product-line to be examined
and the input and output dimensions to be used in
DEA. It was decided that the data gathering ef-
forts must be performed as objectively as possiblewhile ensuring convenience of data collection.
Also, in order to ensure full participation, it was
decided early in the study that the time and effort
required to collect data from suppliers and buyers,
must be kept to an acceptable minimum.
After the identification of the input and output
dimensions, we developed two separate question-
naires––one to assess supplier capabilities (com-prising the input dimensions of DEA) and the
other to assess supplier performance (comprising
the output dimensions of DEA). The question-
naires utilized multiple items to measure the input
and output dimensions. The individual items were
measured on a binary scale (yes/no responses) to
afford maximum objectivity and accuracy of sur-
vey responses. The questions were carefully wor-ded so that the responses of the suppliers could be
easily verified for accuracy. In addition, the bi-
nary scale used obviated the need for suppliers to
be making judgments regarding their capability
allowing for distortion of input data. The design
of the questionnaire and the binary scale were
conscious design choices made by us in the data
collection phase of the study to ensure a highdegree of reliability of input data. It should be
noted that the alternative of conducting a de-
tailed audit of suppliers by a team from Company
X was rejected as both time consuming and re-
quiring an inordinate amount of effort. The
questionnaires were reviewed by Company X�smanagement and revised to reflect their comments
and suggestions.The Supplier Capability Questionnaire was sent
out to the suppliers and the Supplier Performance
Assessment Questionnaire was sent out to the pur-
chasing staff of Company X. The returned ques-
tionnaires were sent to the project staff for data
coding, entry, and analysis.
To test the hypothesis that the questionnaires
might have contained difficult or ambiguousquestions, an analysis of responses to individual
items was carried out by examining the proportion

S. Talluri, R. Narasimhan / European Journal of Operational Research 154 (2004) 236–250 243
of sample with missing data on individual items.
The analysis showed that there was no evidence to
support the hypothesis, confirming that the ques-
tionnaire was acceptable (i.e., not difficult to fill
out) as a data collection instrument. The following
section describes the questionnaires and subse-quent sections discuss the data analysis and man-
agerial implications of the study.
5.1. Supplier capability questionnaire
Items on the Supplier Capability Questionnaire
were grouped into the following categories, which
are utilized as the inputs in the DEA model eval-uations:
• quality management practices and systems
(QMP);
• documentation and self-audit (SA);
• process/manufacturing capability (PMC);
• management of the firm (MGT);
• design and development capabilities (DD);• cost reduction capability (CR).
These six categories were measured with a
composite score between 0 and 1. The score was
computed as the proportion of �yes� answers to
individual questionnaire items in the category.
�Blank� and �not applicable� responses were not
considered in the calculation of the proportion ofthe �yes� responses.
5.2. Supplier performance assessment questionnaire
Items on the Supplier Performance Assessment
Questionnaire were grouped into the following
categories, constituting the outputs:
• quality;
• price;
• delivery;
• cost reduction performance (CRP);
• other.
The above categories were also measured with a
composite score between 0 and 1. To evaluate thescore, the proportion of �yes� answers were identi-
fied in each category to provide an �objective�
measure of the variables in the category. Table 3
shows the scaled composite scores for the input
and output variables for the 23 suppliers. While we
have utilized the actual composite scores in the
DEA evaluations, in order to maintain confiden-
tiality of the data we have scaled it by dividingeach measure by a factor.
For the categories in which subjective questions
were included, the answers to the questions were
normalized to a value between 0 and 1, and then
combined with the responses to the �objective�measures on items belonging to the category. This
was performed by taking a weighted average of the
�subjective� and �objective� measures, with 0.4 and0.6, respectively, as weights for the two, based on
the managerial input from Company X.
6. Data analysis
6.1. DEA results
First we determined the CCR efficiency scores
of the 23 suppliers with respect to the six capa-
bilities (inputs) and five performance metrics
(outputs). The scaled supplier input and output
data is shown in Table 3. CCR model identified
suppliers 2, 3, 4, 6, 7, 10, 12, 15, 20, 22, and 23 to
be efficient with a score of 1.000, and the other 12
suppliers are inefficient with scores of less than1.000. These results are shown in Table 3 under the
heading ‘‘CCR Eff’’. Since firm�s objectives of
linearity in inputs and outputs and the implicit
technology assumptions are not justified in the
selection of the CCR model, we have tested the
sensitivity of the results using the Banker, Char-
nes, and Cooper (BCC) model (Banker et al.,
1984), which works under the assumption ofvariable returns to scale. While the BCC model
identified 12 suppliers to be efficient and the rest
inefficient, the CCR model identified 11 of those 12
suppliers to be efficient and the remaining suppli-
ers inefficient. Also, we utilized the Mann–Whit-
ney test (nonparametric t-test) to test for the
differences in mean efficiency scores between the
CCR and BCC model results, and failed to rejectthe null hypotheses at a p-value 6 0.05 indicating
that the differences are statistically insignificant.

Table 3
Scaled supplier data with inputs and outputs and efficiency scores
Supplier # QMP SA PMC MGT DD CR Quality Price Delivery CRP Other CCR
Eff.
X-Eff.
mean
Standard
deviation
1 0.9662 0.9742 1.0385 1.0808 1.1417 0.7839 0.6211 0.8922 0.1284 1.2107 0.6359 0.602 0.427 0.129
2 0.7054 1.0438 0.7500 0.8782 0.0000 0.8750 0.6932 0.8922 0.3855 0.0000 0.3179 1.000 0.412 0.288
3 0.5611 0.8947 0.7789 0.7205 0.8372 0.7404 1.0205 0.4341 1.5420 0.0000 1.2719 1.000 0.536 0.326
4 1.1272 1.0438 0.9520 0.9607 0.9661 1.1402 1.6639 1.1333 1.5420 1.2107 1.8019 1.000 0.752 0.243
5 1.1272 1.0438 1.1251 1.0808 1.2560 1.2115 0.9983 1.3503 1.1565 1.2107 0.9540 0.855 0.615 0.207
6 0.9877 1.0438 0.9376 1.0808 1.0466 0.9422 1.0426 1.3263 1.7990 2.4214 1.2719 1.000 0.810 0.171
7 0.8051 0.8351 1.0385 0.9607 1.2560 1.0768 1.2201 1.2056 0.7710 2.4214 1.2719 1.000 0.821 0.207
8 1.1809 1.0438 1.1251 1.0208 1.0627 1.0096 0.8429 1.1333 0.6424 1.2107 0.8479 0.723 0.523 0.156
9 1.2346 1.0438 1.1251 1.0808 1.2560 1.1442 0.6433 0.8922 0.3855 0.0000 0.5299 0.562 0.316 0.201
10 0.5904 1.0438 0.6058 0.7629 0.5796 0.4038 1.4419 0.4341 1.4135 0.0000 1.2719 1.000 0.578 0.369
11 0.8642 0.8118 0.8182 0.9536 0.9661 0.8076 0.4215 0.8922 1.0279 0.0000 0.8479 0.805 0.459 0.275
12 0.6441 0.8351 1.0227 1.0208 0.9661 1.0768 1.0205 1.3263 0.7710 1.2107 0.7418 1.000 0.722 0.252
13 1.2346 1.0438 1.1251 1.0808 1.2560 1.2115 0.5546 1.1092 1.0279 1.2107 1.1660 0.773 0.518 0.175
14 1.0662 1.0438 1.1251 1.0808 1.1593 1.2115 0.8208 0.8922 0.8994 1.2107 0.8479 0.609 0.479 0.115
15 1.0100 1.0438 0.8654 1.0208 0.7322 0.6815 1.2423 1.5674 1.4135 2.4214 1.2719 1.000 0.906 0.16
16 0.8978 0.9742 1.0385 1.0208 0.9420 0.8076 1.0205 0.8922 0.3855 0.0000 0.4240 0.764 0.392 0.255
17 1.1272 0.9742 1.0385 1.0208 1.2560 1.0768 1.0205 0.8681 0.7710 0.0000 0.5299 0.702 0.398 0.242
18 1.1809 1.0438 1.1251 1.0808 1.2560 1.2115 1.2201 0.2411 0.0000 0.0000 0.4240 0.733 0.193 0.204
19 1.0735 1.0438 1.1251 0.9007 1.1593 0.9422 1.1647 0.8922 1.4135 1.2107 1.0599 0.904 0.596 0.159
20 1.0735 1.0438 1.1251 1.0808 0.6762 1.1442 0.8429 1.0550 1.4135 1.2107 1.4839 1.000 0.618 0.193
21 1.2346 1.0438 1.1251 1.0133 1.2560 1.2115 0.7764 0.8922 1.0279 0.0000 0.9540 0.658 0.405 0.232
22 1.2346 1.0438 0.9520 1.0808 1.0466 1.2115 1.4642 1.3263 1.7990 2.4214 1.4839 1.000 0.817 0.186
23 1.0735 1.0438 1.0385 1.0172 0.8695 1.0768 1.2423 1.3503 1.2849 2.4214 1.5900 1.000 0.813 0.168
244
S.Tallu
ri,R.Narasim
han/EuropeanJournalofOpera
tionalResea
rch154(2004)236–250
S. Talluri, R. Narasimhan / European Journal of Operational Research 154 (2004) 236–250 245
This indicates that our results are not very sensi-
tive to model changes. In order to further test the
sensitivity of these results, we have evaluated the
supplier efficiency scores based on the free disposal
hull (FDH) model proposed by Tulkens (1993),
but the model did not show effective discrimina-tion among the suppliers. This may be a result of
small sample size in the current application. It is
also important to note in these comparisons that
the ratio efficiency measure shown in (1) does not
apply to the BCC and FDH models.
Since the CCR model has certain limitations as
discussed earlier, we utilize the Doyle and Green
(1994) aggressive cross-efficiency model for a morecomplete evaluation of the supplier performance.
The mean cross-efficiency scores of the suppliers
identified from the weights obtained from the
Doyle and Green formulation are shown in Table
3 under the heading ‘‘X-Eff Mean’’. Based on the
mean cross-efficiency scores it can be concluded
that supplier 15 is the best performer with a score
of 0.906, and supplier 18 is the worst performerwith a score of 0.193. It is interesting to note that
supplier 2, which is efficient based on the CCR
model evaluations, is ranked very low based on
cross-efficiency evaluations with a mean score of
only 0.412. In fact some of the CCR inefficient
suppliers such as 1, 5, 8, 11, 13, 14, and 19 are
better performers than supplier 2 based on cross-
efficiency evaluations. Supplier 2 is a typical caseof a ‘‘false- positive’’ or niche performer. Also,
supplier 5, with a CCR efficiency score of 0.855,
achieved a cross-efficiency mean score of 0.615,
which is higher than the CCR efficient suppliers
that include 2, 3, and 10. These types of insights
and differentiation among suppliers are not pos-
sible when using the CCR model alone, which
demonstrates the strength of cross-efficiency eval-uations as a more comprehensive technique for
efficiency evaluation. It is essential for the deci-
sion-maker to consider these issues in supplier
rationalization in order to avoid making a Type II
error in the selection process.
6.2. Identifying homogenous groups of suppliers
Since the traditional cross-efficiency analysis is
primarily based on the mean scores and does not
take into consideration the variability in the effi-
ciency scores, the ranking obtained from the
analysis may not be the best. In fact it can be
concluded from Table 3 that mean scores alone
may not be appropriate in ranking suppliers be-
cause while certain suppliers, such as 3 and 8, haveclose to the same mean scores their variability in
terms of cross-efficiencies are quite different. Thus,
we utilized the method proposed by Talluri et al.
(2000), which effectively incorporates the vari-
ability measures in identifying homogenous groups
of suppliers. Talluri et al. (2000) performed this
step by applying a nonparametric statistical test
due to Friedman (Friedman, 1937) on the CEM.They utilized a nonparametric test because the
efficiency scores do not lend themselves to the as-
sumptions of normality.
We conduct the Friedman�s test for the fol-
lowing null and alternative hypotheses:
Ho: The suppliers have identical cross-efficiency
scoresHa: At least one of the suppliers tends to yield lar-
ger cross-efficiency scores than at least one other
supplier
We treated the rows of the CEM as blocks and
the columns as the treatments. The cross-efficiency
scores within each block are ranked by assigning 1
for the lowest, 2 for the second lowest, and so on.Mean ranks are considered in the event that ties
exist. The cross-efficiency matrix based on ranks is
shown in Table 4. The test resulted in a p-value of0.000 thereby rejecting the null hypotheses at an
a ¼ 0:05. Thus, there is sufficient evidence to
conclude that at least one supplier tends to yield
larger cross-efficiency scores than at least one
other supplier.Using the least significant difference tests
(Cononver, 1980) on the ranked transformed data,
all pair-wise comparisons were performed to iden-
tify suppliers that are different. For this case, for a
pair of suppliers to be significantly different, at
a ¼ 0:05, the absolute difference between sums of
their ranks must be greater than 54.95. The results
of the analysis are shown in Table 5. We identifiedthree groups of suppliers based on the overlaps in
the least significant difference tests. It is evident

Table 4
Ranked cross-evaluation scores
Supplier # 1 2 3 4 5 6 7 8 9 10 11 12 13 14 15 16 17 18 19 20 21 22 23
1 11 8 3 14 18 19 21 15 6 2 16 22.5 13 5 22.5 10 9 1 7 12 4 17 20
2 6 21.5 14 19 12 15 17 9 1 21.5 5 21.5 3 7 21.5 13 8 2 10 11 4 16 18
3 2 6 23 18 12 21 11 5 3 22 13 15 8.5 10 19 4 7 1 16.5 16.5 8.5 20 14
4 6 2 21 22.5 10 16 15 9 4 22.5 12 7 14 8 18 3 5 1 13 17 11 19 20
5 6 5 3 16 17 19.5 21 12 4 2 15 22.5 13 8 22.5 7 9 1 11 14 10 19.5 18
6 14 4 8 17 12 22 22 10 2 9 7 18 11 13 22 3 5 1 15 15 6 19 20
7 17 5 5 12.5 12.5 22 23 11 5 5 5 18 10 16 21 5 5 5 14.5 14.5 1 19 20
8 4.5 13 3 16 19 17.5 20 15 6 2 10 21 14 4.5 23 8 7 1 12 11 9 17.5 22
9 10 9 3 16 19 17.5 21 15 4.5 2 14 22.5 13 4.5 22.5 11 7 1 8 12 6 17.5 20
10 8 7 20 21 9 14 15 10 3 23 2 11.5 1 5 22 19 11.5 13 18 6 4 17 16
11 2 3.5 11 17 16 22 18 9.5 3.5 6 15 20 12 8 22 5 7 1 13 14 9.5 22 19
12 10 19 6 14 17 20 21 11 2.5 4 15 23 9 8 22 13 5 1 7 12 2.5 16 18
13 5 2 12 21.5 15 18 21.5 10 3 8 14 17 13 7 21.5 4 6 1 11 16 9 21.5 19
14 5 2 15 20 14 18 22 8 3 10 13 17 12 7 22 4 6 1 11 16 9 22 19
15 18 5 5 14 11 22 20.5 16 5 5 5 15 11 11 23 5 5 5 17 13 5 19 20.5
16 5 7 15 21.5 12 16 21.5 10 2 21.5 3 19 1 6 21.5 14 11 8 13 9 4 18 17
17 6 4 11 22 15 16 22 10 1 17 3 19 2 7 22 13 12 8 14 9 5 20 18
18 4 5 15 23 10 11 22 8.5 3 20 1 19 2 7 17.5 12.5 12.5 16 14 8.5 6 21 17.5
19 2 5 21 21 14 18 13 8 3 21 11 12 9 7 21 4 6 1 17 15 10 21 16
20 5 22.5 17 20 7.5 15 14 10 2 21 11 9 13 6 18 4 3 1 12 22.5 7.5 16 19
21 2 5 19 22 14 20 13 8 3 16 10 12 11 7 22 4 6 1 17 15 9 22 18
22 10 3 9 18 14 21.5 21.5 11 2 8 7 17 13 12 21.5 4 5 1 16 15 6 21.5 19
23 10 2 9 18 11 19 22 14 4 8 6 15 13 12 22 3 5 1 17 16 7 20 22
246
S.Tallu
ri,R.Narasim
han/EuropeanJournalofOpera
tionalResea
rch154(2004)236–250

Table 5
Supplier groups based on Friedman�s test
Table 6
ANOVA results on inputs and outputs for supplier groups
Factor Type F -value Significance
QMP Input 1.050 0.369
SA Input 0.440 0.650
PMC Input 0.840 0.446
MGT Input 1.110 0.348
DD Input 0.820 0.454
CR Input 0.990 0.389
Quality Output 5.390 0.013
Price Output 11.320 0.001
Delivery Output 5.850 0.010
CRP Output 17.020 0.000
Other Output 7.050 0.005
S. Talluri, R. Narasimhan / European Journal of Operational Research 154 (2004) 236–250 247
from this analysis that suppliers 15, 22, 7, 23, 4, 6,and 12 are the best (in the sense of the highest
ranked group of) performers. These are the sup-
pliers that management must consider as poten-
tial candidates for SR. These suppliers are the
stars that are excelling with respect to several input
and output dimensions, i.e., capabilities and per-
formance metrics. From a resource allocation
standpoint, management must primarily invest inimproving integration with these suppliers in terms
of implementing systems such as electronic data
interchange (EDI) and web-based procurement for
effective and rapid transactional ability with the
suppliers. Also, as we discuss later, these suppliers
can serve as potential benchmarks for ineffectively
performing suppliers. In essence, management
must find possible ways of transferring their bestpractices to other suppliers.
Suppliers 5, 20, 19, 10, 3, 8, 13, 11, 14, 16, 1, 2,
17, and 21 are in the second category. These are the
suppliers that management should consider as
potential candidates for supplier development
programs and initiatives. While these suppliers
have demonstrated potential, they have scope for
further improvement. The exact supplier develop-ment programs to implement will depend on the
areas in which they are weak, which we address
later in this section by identifying the differences
among the three groups of suppliers in terms of
capabilities and performance metrics. Finally, sup-
pliers 9 and 18 are possible candidates for pruning.
6.3. Identifying differences in performance across
supplier groups
From process improvement and supplier de-
velopment perspectives, we further investigated the
reasons for differences in performance across the
three supplier groups. We analyzed the differences
in their capabilities (inputs) and performance
metrics (outputs). The ANOVA results on inputsand outputs for the three groups are shown in
Table 6. It is interesting to note that there is no
significant difference in terms of inputs or capa-
bilities of the supplier groups, i.e., QMP, SA,
PMC, MGT, DD, and CR levels are not statisti-
cally different. However, the performance metrics
Quality, Price, Delivery, CRP, and Other are all
significantly different at an a ¼ 0:05. In order toinvestigate which groups differ we performed the
Duncan�s multiple range tests on output measures.
These results are summarized in Table 7.
Based on results in Table 7, we can conclude that
lower supplier efficiency groups 2 and 3 are ranked
well below group 1 with respect to several output
variables. It also shows that group 3 is the lowest
ranked with respect to all performance metrics oroutputs. It can be seen that group 1 suppliers� per-formance is vastly superior on ‘‘price’’ and ‘‘CRP’’
compared to groups 2 and 3. Group 2 suppliers who
will be the primary targets of SDI programs could

Table 7
Duncan�s multiple comparison results on supplier group dif-
ferences
Factor/
subsets
1 2 3 Level of
signifi-
cance
0.525 (G2)
Quality 0.764 (G1) 0.560 (G3) 0.1
Price 0.730 (G1) 0.499 (G2) 0.313 (G3) 0.05
Delivery 0.490 (G2) 0.100 (G3) 0.05
0.695 (G1)
CRP 0.572 (G1) 0.000 (G3) 0.05
0.167 (G2)
Other 0.706 (G1) 0.472 (G2) 0.250 (G3) 0.1
248 S. Talluri, R. Narasimhan / European Journal of Operational Research 154 (2004) 236–250
learn from group 1 suppliers on how to reduce theircosts by effectively implementing cost reduction
programs. It is conceivable that group 1 suppliers
might refuse to divulge their best practices to group
2 firms for fear of intensified competition from them
in the future. This can be mitigated by entering into
strategic partnering agreements with group 1 firms
that essentially make them the principal beneficia-
ries of the buying firm�s competitive performance.In summary, the managerial implications are that
group 2 suppliers must improve with respect to
Quality, Price, CRP, and Other. However, they are
categorized as being in the same subset with group 1
suppliers with respect toDelivery. This is the type of
feedback thatmanagement should provide to group
2 suppliers. Since there are no significant differences
in the inputs across the three groups, it implies thatgroups 2 and 3 have all capabilities in place, but are
poor in executing these capabilities and trans-
forming them into high level of performance. Thus,
these groups must benchmark themselves against
group 1 suppliers and identify ways to execute their
capabilities better. The buying firm�s SDI programs
can be targeted at group 2 suppliers and specific
areas of performance improvement. The knowledgetransfer from group 1 suppliers to group 2 suppliers
can be filtered through the buying firm and can be
kept at a level acceptable to the group 1 suppliers.
7. Conclusions
In this paper, we have proposed a frameworkand methodology for strategic sourcing. We uti-
lized a combination of DEA models for effectively
discriminating supplier performance. We utilized
both strategic capabilities and performance met-
rics in evaluating suppliers. Our analysis yielded a
number of managerial insights that could not have
been possible with traditional supplier evaluationmethods. These include the identification of sup-
pliers for strategic partnerships, deployment of
resources for SDI, identifying the factors on which
ineffective suppliers need to improve on, and se-
lecting targets for improvement.
The principal advantages of our methodology
are that: it simultaneously considers supplier ca-
pabilities and performance metrics in evaluat-ing the efficiency of alternative suppliers; it does
not require the decision-maker to select a priori
weights or preferences for the supplier factors; it
overcomes some of the problems associated with
the traditional DEA models, which include unre-
stricted weight flexibility in selection of input and
output weights in supplier evaluation decisions; it
effectively incorporates efficiency variability mea-sures into the analysis in determining homogenous
groups of suppliers; and identifies the key differ-
ences across the supplier groups in terms of per-
formance.
While we have considered the input side of the
DEA model somewhat comprehensively, the out-
put measures might need further examination. In
addition, it should be pointed that although theinput and output dimensions considered in this
paper are generally useful, they are context spe-
cific. Also, in a specific application of this meth-
odology, if in fact the set of ineffective suppliers is
deemed an unacceptable result by management,
the output dimensions of DEA model must be re-
examined for relevant but missing dimensions,
which might cause them to be ineffective. A re-evaluation of the proposed methodology along
these lines would yield additional insights and lead
to a better approach for strategic sourcing.
References
Ansari, A., Modarress, B., 1986. Just-in-time purchasing:
Problems and solutions. Journal of Purchasing and Mate-
rials Management 22 (2), 19–26.

S. Talluri, R. Narasimhan / European Journal of Operational Research 154 (2004) 236–250 249
Banker, R.D., Khosla, I.S., 1995. Economics of operations
management: A research perspective. Journal of Operations
Management 12, 423–425.
Banker, R.D., Charnes, A., Cooper, W.W., 1984. Some models
for estimation of technical and scale efficiencies in data
envelopment analysis. Management Science 30 (9), 1078–
1092.
Barbarosoglu, G., Yazgac, T., 1997. An application of the
analytic hierarchy process to the supplier selection problem.
Production and Inventory Management Journal 38 (1), 14–
21.
Benton, W.C., Krajeski, L., 1990. Vendor performance and
alternative manufacturing environments. Decision Sciences
21, 403–415.
Bernard, P., 1989. Managing vendor performance. Production
and Inventory Management Journal 30, 1–7.
Boussofiane, A., Dyson, R.G., Thanassoulis, E., 1991. Applied
data envelopment analysis. European Journal of Opera-
tional Research 52 (1), 1–15.
Browning, J.M., Zabriskie, N.B., Huellmantle, A.B., 1983.
Strategic purchasing planning. Journal of Purchasing and
Materials Management 19 (1), 19–24.
Burt, D.N., 1984. Proactive Procurement. Prentice-Hall, En-
glewood Cliffs, NJ.
Burton, T.T., 1988. JIT/Repetitive sourcing strategies: Tying
the knot with your suppliers. Production and Inventory
Management Journal (4th Quarter), 38–41.
Chapman, S.N., 1989. Just-in-time supplier inventory: An
empirical implementation model. International Journal of
Production Research 27 (12), 1993–2007.
Chapman, S.N., Carter, P.L., 1990. Supplier/customer inven-
tory relationships under just-in-time. Decision Sciences 21,
35–51.
Charnes, A., Cooper, W.W., Rhodes, E., 1978. Measuring the
efficiency of decision making units. European Journal of
Operational Research 2 (6), 429–444.
Cononver, W.J., 1980. Practical Nonparametric Statistics.
Wiley, New York.
Coughlan, P.D., Wood, A.R., 1992. Getting product designs
right. Business Quarterly 56 (4), 63–67.
De Ron, A.J., 1998. Sustainable production: The ultimate result
of a continuous improvement. International Journal of
Production Economics 56–57 (1–3), 99–110.
Dickson, G., 1966. An analysis of vendor selection systems and
decisions. Journal of Purchasing 2, 28–41.
Dobler, D.W., Burt, D.N., Lee, L., 1990. Purchasing and
Materials Management. McGraw-Hill, New York.
Doyle, J., Green, R., 1994. Efficiency and cross-efficiency in
DEA: Derivations, meanings and uses. Journal of Opera-
tional Research Society 45 (5), 567–578.
Ellram, L.M., 1990. The supplier selection decision in strategic
partnerships. Journal of Purchasing and Materials Man-
agement 26 (4), 8–14.
Ellram, L.M., 1995. Total cost of ownership: An analysis
approach for purchasing. International Journal of Phys-
ical Distribution and Logistics Management 25 (8), 4–
23.
Friedman, M., 1937. The use of ranks to avoid the assumption
of normality implicit in the analysis of variance. Journal of
American Statistical Association 32, 675–701.
Gregory, R.E., 1986. Source selection: A matrix approach.
Journal of Purchasing and Materials Management (Sum-
mer), 24–29.
Hahn, C.K., Pinto, P.A., Bragg, D.J., 1983. Just-in-time
production and planning. Journal of Purchasing and Ma-
terials Management 19 (3), 2–10.
Hill, R.P., Nydick, R.J., 1992. Using the analytic hierarchy
process to structure the supplier selection procedure. Inter-
national Journal of Purchasing and Materials Management
28 (2), 31–36.
Hinkle, C.L., Robinson, P.J., Green, P.E., 1969. Vendor evalu-
ation using cluster analysis. Journal of Purchasing, 49–58.
Jackson, G.C., 1983. Just-in-time production: Implications for
logistics managers. Journal of Business Logistics 4, 1–19.
Kleinsorge, I.K., Schary, P.B., Tanner, R.D., 1992. Data
envelopment analysis for monitoring customer supplier
relationships. Journal of Accounting and Public Policy 11,
357–372.
Koulamas, C., 1992. Quality improvement through product
redesign and the learning curve. OMEGA: The Interna-
tional Journal of Management Science 20 (2), 161–168.
Kralijic, P., 1983. Purchasing must become supply manage-
ment. Harvard Business Review 61, 109–117.
Lamberson, L.R., Diederich, D., Wuori, J., 1976. Quantitative
vendor evaluation. Journal of Purchasing and Materials
Management (Spring), 19–28.
Lederer, P.J., Rhee, S.K., 1995. Economics of total quality
management. Journal of Operations Mangement 12 (3/4),
353–367.
Mandal, A., Deshmukh, S.G., 1994. Vendor selection using
interpretative structural modeling (ISM). International
Journal of Operations and Production Management 14
(6), 52–59.
Mummalaneni, V., Dubas, K.M., Chao, C., 1996. Chinese
purchasing mangers� preferences and trade-offs in supplier
selection and performance evaluation. Industrial Marketing
Management 25 (2), 115–124.
Monczka, R.M., Giunipero, L.C., Reck, R.F., 1981. Perceived
importance of supplier information. Journal of Purchasing
and Materials Management 17, 21–29.
Moriarity, R.T., 1983. Industrial Buying Behavior. Lexington
Books, Lexington, Massachusetts.
Narasimhan, R., 1983. An analytical approach to supplier
selection. Journal of Purchasing and Materials Management
19 (1), 27–32.
Narasimhan, R., Talluri, S., Mendez, D., 2001. Supplier
evaluation and rationalization via data envelopment anal-
ysis: An empirical examination, working paper, Michigan
State University.
Pan, A.C., 1989. Allocation of order quantity among suppliers.
Journal of Purchasing and Materials Management, 36–39.
Patton, W.W., 1996. Use of human judgment models in
industrial buyer�s vendor selection decisions. Industrial
Marketing Management 25, 135–149.

250 S. Talluri, R. Narasimhan / European Journal of Operational Research 154 (2004) 236–250
Petroni, A., Braglia, M., 2000. Vendor selection using principal
component analysis. Journal of Supply Chain Management
(Spring), 63–69.
Sexton, T.R., Silkman, R.H., Hogan, A., 1986. Data envelop-
ment analysis: Critique and extensions, In: Richard H.,
Silkman (Eds.), Measuring Efficiency: An Assessment of
Data Envelopment Analysis, Publication no. 32 in the series
New Directions of Program Evaluation, Jossey Bass, San
Francisco.
Simar, L., Wilson, P., 1998. Sensitivity analysis of efficiency
scores: How to bootstrap in non-parametric frontier models.
Management Science 44, 49–61.
Siying, W., Jinlong, Z., Zhicheng, L., 1997. A supplier-selecting
system using a neural network 1997 IEEE International
Conference on Intelligent Processing Systems, IEEE, New
York, NY, pp. 468–471.
Tulkens, H., 1993. On FDH efficiency analysis: Some method-
ological issues and applications to retail banking, courts,
and urban transit. Journal of Productivity Analysis 4, 183–
210.
Talluri, S., Narasimhan, R., in press. Vendor evaluation with
performance variability: A max–min approach. European
Journal of Operational Research.
Talluri, S., Whiteside, M.M., Seipel, S.J., 2000. A nonpara-
metric stochastic procedure for FMS evaluation. European
Journal of Operational Research 124 (3), 529–538.
Tham, W.S., 1988. Transactions of the American Association
of Cost Engineers R.1.1.
Thanassoulis, E., Allen, R., 1998. Simulating weight restrictions
in data envelopment analysis. Management Science 44, 586–
594.
Timmerman, E., 1986. An approach to vendor performance
evaluation. Journal of Purchasing and Materials Manage-
ment (Winter), 2–8.
Treleven, M., 1987. Single sourcing: A management tool for the
quality supplier. Journal of Purchasing and Materials
Management 23 (1), 19–24.
Tullous, R., Munson, J.M., 1991. Trade-offs under uncertainty:
Implications for industrial purchasers. International Journal
of Purchasing and Materials Management 27, 24–31.
Tummala, R.V.M., Chin, K.S., Ho, S.H., 1997. Assessing
success factors for implementing CE: A case study in Hong
Kong electronics industry. International Journal of Produc-
tion Economics 49 (3), 265–283.
Turner, I., 1988. An independent system for the evaluation of
contract tenders. Journal of Operational Research Society
39 (6), 551–561.
Verma, R., Pullman, M.E., 1998. An analysis of the supplier
selection process. Omega 26 (6), 739–750.
Weber, C.A., Current, J.R., 1993. A multiobjective approach to
vendor selection. European Journal of Operational Re-
search 68, 173–184.
Weber, C.A., Current, J.R., Benton, W.C., 1991. Vendor
selection criteria and methods. European Journal of Oper-
ational Research 50, 2–18.
Weber, C.A., Current, J.R., Desai, A., 1998. Non-cooperative
negotiation strategies for vendor selection. European Jour-
nal of Operational Research 108, 208–223.
Weber, C.A., Desai, A., 1996. Determination of paths to
vendor market efficiency using parallel coordinates repre-
sentation: A negotiation tool for buyers. European Journal
of Operational Research 90, 142–155.
Weber, C.A., Ellram, L.M., 1993. Supplier selection using multi
objective programming: A decision support systems ap-
proach. International Journal of Physical Distribution and
Logistics Management 23 (2), 3–14.
Woodside, A.G., Vyas, N., 1987. Industrial purchasing strat-
egies. Lexington Books, Lexington, Massachusetts.