A Methodology for Risk Analysis Based on Hybrid Bayesian Networks: Application to the Regasification...
23
Risk Analysis DOI: 10.1111/risa.12245 A Methodology for Risk Analysis Based on Hybrid Bayesian Networks: Application to the Regasification System of Liquefied Natural Gas Onboard a Floating Storage and Regasification Unit Marcelo Ramos Martins, 1,∗ Adriana Miralles Schleder, 1 and Enrique L ´ opez Droguett 2 This article presents an iterative six-step risk analysis methodology based on hybrid Bayesian networks (BNs). In typical risk analysis, systems are usually modeled as discrete and Boolean variables with constant failure rates via fault trees. Nevertheless, in many cases, it is not pos- sible to perform an efficient analysis using only discrete and Boolean variables. The approach put forward by the proposed methodology makes use of BNs and incorporates recent devel- opments that facilitate the use of continuous variables whose values may have any proba- bility distributions. Thus, this approach makes the methodology particularly useful in cases where the available data for quantification of hazardous events probabilities are scarce or nonexistent, there is dependence among events, or when nonbinary events are involved. The methodology is applied to the risk analysis of a regasification system of liquefied natural gas (LNG) on board an FSRU (floating, storage, and regasification unit). LNG is becoming an important energy source option and the world’s capacity to produce LNG is surging. Large reserves of natural gas exist worldwide, particularly in areas where the resources exceed the demand. Thus, this natural gas is liquefied for shipping and the storage and regasification process usually occurs at onshore plants. However, a new option for LNG storage and re- gasification has been proposed: the FSRU. As very few FSRUs have been put into operation, relevant failure data on FSRU systems are scarce. The results show the usefulness of the pro- posed methodology for cases where the risk analysis must be performed under considerable uncertainty. KEY WORDS: Bayesian networks; FSRU; LNG regasification; reliability analysis; risk analysis 1. INTRODUCTION Bayesian networks (BNs) provide powerful probabilistic methods to build causal relationships 1 Risk Assessment Laboratory – LabRisk, Naval Architecture and Ocean Engineering Department, University of S ˜ ao Paulo, S˜ ao Paulo, Brazil. 2 Production Engineering Department, Federal University of Per- nambuco, 123 - Cidade Universit ´ aria, PE, 50670-901, Brazil. ∗ Address correspondence to Marcelo Ramos Martins, Naval Ar- chitecture and Ocean Engineering Department, University of S˜ ao Paulo, Av. Professor Mello Moraes, 2231, 05508-030, S ˜ ao Paulo, Brazil; [email protected]. between events and model the failure modes of a sys- tem, facilitating the creation of a rational framework for a decision analysis under risk. This article pro- poses a methodology to perform risk analysis using BNs and, as an application, perform the risk analy- sis of flammable substance leakage in a regasification system on board a floating, storage and regasification unit (FSRU). The risk could be presented as the product of the probability of the occurrence of undesired events and the magnitude of their consequences. Tradition- ally, fault tree analysis (FTA) is used to estimate 1 0272-4332/14/0100-0001$22.00/1 C 2014 Society for Risk Analysis
-
Upload
enrique-lopez -
Category
Documents
-
view
213 -
download
0
Transcript of A Methodology for Risk Analysis Based on Hybrid Bayesian Networks: Application to the Regasification...

Risk Analysis DOI: 10.1111/risa.12245
A Methodology for Risk Analysis Based on Hybrid BayesianNetworks: Application to the Regasification System ofLiquefied Natural Gas Onboard a Floating Storageand Regasification Unit
Marcelo Ramos Martins,1,∗ Adriana Miralles Schleder,1 and Enrique Lopez Droguett2
This article presents an iterative six-step risk analysis methodology based on hybrid Bayesiannetworks (BNs). In typical risk analysis, systems are usually modeled as discrete and Booleanvariables with constant failure rates via fault trees. Nevertheless, in many cases, it is not pos-sible to perform an efficient analysis using only discrete and Boolean variables. The approachput forward by the proposed methodology makes use of BNs and incorporates recent devel-opments that facilitate the use of continuous variables whose values may have any proba-bility distributions. Thus, this approach makes the methodology particularly useful in caseswhere the available data for quantification of hazardous events probabilities are scarce ornonexistent, there is dependence among events, or when nonbinary events are involved. Themethodology is applied to the risk analysis of a regasification system of liquefied natural gas(LNG) on board an FSRU (floating, storage, and regasification unit). LNG is becoming animportant energy source option and the world’s capacity to produce LNG is surging. Largereserves of natural gas exist worldwide, particularly in areas where the resources exceed thedemand. Thus, this natural gas is liquefied for shipping and the storage and regasificationprocess usually occurs at onshore plants. However, a new option for LNG storage and re-gasification has been proposed: the FSRU. As very few FSRUs have been put into operation,relevant failure data on FSRU systems are scarce. The results show the usefulness of the pro-posed methodology for cases where the risk analysis must be performed under considerableuncertainty.
KEY WORDS: Bayesian networks; FSRU; LNG regasification; reliability analysis; risk analysis
1. INTRODUCTION
Bayesian networks (BNs) provide powerfulprobabilistic methods to build causal relationships
1Risk Assessment Laboratory – LabRisk, Naval Architecture andOcean Engineering Department, University of Sao Paulo, SaoPaulo, Brazil.
2Production Engineering Department, Federal University of Per-nambuco, 123 - Cidade Universitaria, PE, 50670-901, Brazil.
∗Address correspondence to Marcelo Ramos Martins, Naval Ar-chitecture and Ocean Engineering Department, University ofSao Paulo, Av. Professor Mello Moraes, 2231, 05508-030, SaoPaulo, Brazil; [email protected].
between events and model the failure modes of a sys-tem, facilitating the creation of a rational frameworkfor a decision analysis under risk. This article pro-poses a methodology to perform risk analysis usingBNs and, as an application, perform the risk analy-sis of flammable substance leakage in a regasificationsystem on board a floating, storage and regasificationunit (FSRU).
The risk could be presented as the product ofthe probability of the occurrence of undesired eventsand the magnitude of their consequences. Tradition-ally, fault tree analysis (FTA) is used to estimate
1 0272-4332/14/0100-0001$22.00/1 C© 2014 Society for Risk Analysis

2 Martins, Schleder, and Droguett
the probability of an event. FTA can be used in bothqualitative and quantitative analyses. Using a quali-tative approach, FTA can determine the logic lead-ing to any event, while the quantitative approach as-sesses the probability of the occurrence of the topand intermediary events. However, FTA has somelimitations: only binary variables are used, condi-tional dependencies are not represented, a diagnos-tic analysis is not possible, and multistate or con-tinuous variables are not properly modeled. SinceBNs do not have these limitations, it is possi-ble to conduct a more realistic analysis using thismethod.(1)
A BN is a direct acyclic graph (DAG) in whichthe nodes are the variables and the arcs representconditional dependencies;(2) thus, the events are notnecessarily independent, as it is assumed when FT isused. The BN qualitative analysis determines the re-lationships between the nodes, and the quantitativeanalysis can be performed in two ways: a predictiveanalysis, in which the probability of any node is cal-culated based on its parent nodes and the conditionaldependencies, or a diagnostic analysis, in which theprobability of any set of variables is calculated basedon some evidence.(3–5)
In addition, the BN can also represent un-certain knowledge, which is important for systemswith no failure history, such as new or recent pro-cesses. Moreover, the BN facilitates the modelingof continuous variables, while FT is only capable todeal with discrete (binary) variables and it is notcomplex to model common cause failures (CCF)using BNs.
As FT is traditionally used to estimate the proba-bility of the occurrence of events, this study proposesthe conversion of FT into BNs to take advantage ofthe familiarity that most analysts have with FT, al-though it is possible to build the BN directly from theanalysis of the system.
To perform the risk analysis of leakage in theliquefied natural gas (LNG) regasification system on-board an FSRU, this article estimates the probabili-ties of the undesired events using a BN and then esti-mates the consequences of the analyzed events. Theconsequence is a measure of the impact of the unde-sired events, and the range of effects might includeharm to people, damage to equipment and land, orfacility contamination; however, in this study, the fo-cus is the harm to people. The consequences of theleakage are quantified using models available in theliterature that evaluate the discharge, pool forma-tion, and its evaporation; dispersion; and the ther-
mal radiation generated through potential fires orexplosions.(6–15)
The first regasification system on board an LNGcarrier was recently introduced in Brazil, and anFSRU has been used as an offshore terminal to storeand regasify the LNG; thus, the analysis of this sys-tem is important. As a pioneering process, regasifica-tion on board an FSRU carries some additional un-certainties and the risk analysis of this system is justi-fied.
LNG is becoming an important energy sourceoption, and the demand for energy of all types has in-creased. In addition, the world’s capacity to produceLNG is surging. Large reserves of natural gas existworldwide, particularly in areas in which there is nomarket or where the resources exceed the demand;this natural gas is liquefied for shipping to areaswhere there is a demand. Thus, the storage and re-gasification process usually occurs at onshore plants,where the LNG is stored in a double-walled storagetank under atmospheric pressure until needed. Sub-sequently, LNG is pumped at a higher pressure andwarmed until it returns to a gas state. A new op-tion for LNG storage and regasification has been pro-posed: the FSRU. The FSRU provides an economicand flexible option for the storage and regasificationprocess, as an FSRU costs less than an onshore fa-cility of a similar capacity, thereby providing a fasterreturn on the capital invested because the time typi-cally used for planning is saved and the constructiontime is reduced, assuming the conversion of an exist-ing LNG carrier. FSRUs are also a flexible solution,as they can be moved from one demand area to an-other, which is an attractive feature in countries withseasonal demand or where there is an unstable mar-ket. Additionally, the FSRU might significantly re-duce the total risk compared with an onshore plant,which considerably impacts neighboring areas andpopulations (this risk might be even worse due to thepossibility of terrorist attacks).
This article proposes a methodology to performquantitative risk analysis based on BNs and exploresthe capabilities of a recently developed extension ofBNs to evaluate risks. This article also applies theproposed methodology to a real case analyzing a re-gasification system onboard an FSRU.
2. COMPARATIVE ANALYSIS BETWEENBNS AND FT
The BN is used in this study to estimate theprobability of the occurrence of undesired events.

Methodology for Risk Analysis Based on Hybrid Bayesian Networks 3
An overview of FT and BN is presented, followedby a brief explanation of the conversion of FT intoBN. Benefits and limitations of both techniques arepresented.
2.1. Fault Tree Analysis (FTA)
FTA is a widely used technique for the de-pendability modeling of large systems. According toABS,(16) FTA is a deductive analysis that graphi-cally models (using Boolean logic) the combinationsof equipment failures, human errors, and externalevents that cause specific mishaps. FTA uses a dia-gram to verify the causes of an event; and knowingthe failure rates, it is possible to calculate the prob-ability of the undesired event (top event) that wasselected for qualitative and quantitative analysis. AnFTA assumes that all events are binary events (work-ing or not working), one event is statistically inde-pendent from all others, and the relationships amongthe events and their causes can be represented usinglogical AND and OR gates. Other gates are formedthrough the association of AND and OR gates, thatis, the NOR gate, which is the negation of an ORgate, where the output occurs if none of the inputsoccur. In addition, although FT provides an efficientmethod for representing the causes of symptomsand simultaneously considers the existence of severalfaults, this method is incapable of determining thesequential ordering of component failures that leadto system failures. Thus, dynamic fault trees (DFT)were developed to address these limitations, in whichthe analytical solution is obtained through conver-sion into the equivalent Markov process, where astate-space model is generated by the combination ofthe occurrence of all possible events and their tran-sition probabilities (defined by the component fail-ure rates). However, this approach has two signifi-cant limitations: the state space grows exponentiallywith the increasing number of modeled events, andit is difficult to model variables that exhibit nonex-ponential failure distributions.(1) Assumptions thatmight limit analyses using FT and DFT are not neces-sary when a BN is used, which facilitates the inclusionof multistates, continuous variables, and local condi-tional dependencies and considers the sequential or-dering of the occurrence of the components’ failures.
2.2. Bayesian Networks (BNs)
Neapolitan(2) defines the BN as a graphicalstructure for representing probabilistic relationships
among a large number of variables and making prob-abilistic inferences using those variables. A BN isa DAG with the nodes representing the variablesand arcs representing their conditional dependen-cies. The BN qualitative analysis determines the re-lationships among the nodes, while the quantitativeanalysis might be performed in two ways: a predic-tive analysis or a diagnostic analysis. The predictiveanalysis calculates the probability of any node basedon parent nodes and conditional dependencies, whilethe diagnostic analysis calculates the probability ofany set of variables given some evidence. The nodesand arcs are the qualitative components of the net-works and provide a set of conditional independenceassumptions that can be represented through a graphnotion called d-separation, where each arc built fromvariable X to Y is directly dependent, that is, a cause-effect relationship.
If the variables are discrete, then the probabilis-tic relationship of each node X with its respectiveparents pa (X) is defined using a conditional prob-ability table (CPT). For continuous variables, theconditional probability distribution (CPD), whichrepresents conditional probability density functions,defines this probabilistic relationship, and the quan-titative analysis is based on a conditional indepen-dence assumption. Considering three random vari-ables X, Y, and Z, X is conditionally independent ofY given Z if P(X,Y|Z) = P(X|Z)P(Y|Z). The jointprobability distribution of a set of variables, based ontheir conditional independence, can be factorized asshown in Equation (1):
P [x1, x2, ..., xn] =n∏
i=1
P [xi |Parent (xi )]. (1)
The graphical representation is the bridging of thegap between (high-level) conditional independencestatements encoded in the model and (low-level)constraints, which enforce the CPD.(3)
Given some evidence, the beliefs are recalcu-lated to indicate their impact on the network. Thepossibility of using evidence from the system to re-assess the probabilities of network events is anotherimportant feature of BNs, which is useful to deter-mine critical points in the system. Classical methodsof inference of a BN for this purpose involve thecomputation of the posterior marginal probabilitydistribution of each component, the posterior jointprobability distribution of subsets of components,and the posterior joint probability distribution ofthe set of all nodes. Jones et al. proposed that the
4 Martins, Schleder, and Droguett
analysis and propagation of evidence, using BN, areuseful to explore or preview system behaviors thatare unknown or require more attention.(4)
In recent years, the number of studies present-ing the use of BNs in risk analysis has increased;(16–22)
traditional models, such as fault trees and block dia-grams, have been replaced with discrete BN. How-ever, the efficient application of BNs in risk as-sessment requires the use of hybrid models formedwith discrete and continuous variables. The evalua-tion of hybrid networks offers a challenge, as infer-ence algorithms have limitations, such as dealing withstate-space explosion and finding an appropriate dis-cretization. However, a new and efficient dynamicdiscretization of the domain and an iterative approxi-mation method to refine discretization in the regionsthat contribute more to the structure of the densityfunctions associated with a robust propagation algo-rithm have been proposed by Marquez et al.(1) In thisapproach, the BN considers any probability distri-bution function, unlike the traditional tools, which,in practice, consider only exponential distributions;these considerations are implemented in the com-mercial BN software package, AgenaRisk,(23) whichis used in this study. There are other commercialtools for the calculation of BNs, such as Netica(24)
and Hugin.(25) However, these tools do not apply thedynamic discretization mentioned above, and thus,the software AgenaRisk was used in this study. It isworth noting that this method is approximate and theaccuracy of the results should be verified accordingto the scenario evaluated. Marquez et al.(1) presenta comparison between numerical and BN results ofeight examples and Neil et al.(26) discuss about the ac-curacy of hybrid BN. Additionally, in the Appendix,an example is presented and discussed to better illus-trate this issue. Moreover, Jensen and Nielsen(27) isan excellent reference for the theoretical aspects ofBNs and algorithms.
Notably, BNs are efficient to model multistatevariables, local dependencies, CCFs, and limited orincomplete knowledge. Multistate variables and lo-cal dependencies are important to generate a morerealistic model, whereas traditional tools typicallyuse only binary variables and are unable to repre-sent local dependencies (e.g., to represent how themalfunction of one piece of equipment affects otherequipment). CCFs affect the reliability system be-cause they cause the failure of more than one compo-nent, which can render redundancy protection use-less (details concerning CCFs have been previouslyreported by Fleming,(28) Smith,(29) and TNO(30)). Oc-
casionally, there are not enough or satisfactory statis-tical data available about the system to perform a re-liability analysis; thus, BN analysts ask relevant ques-tions to a group of specialists and explain the assump-tions that are encoded in the model, and domain ex-perts supply their knowledge to the analysts.(31,32)
The risk analysis presented in this article ex-plores the benefits of the BN, such as modeling withcontinuous variables, the propagation of evidence,and the representation of local dependencies; suchapproach would not be possible with the use of FT,due to the limitations presented in item 0.
2.3. Converting an FT into a BN
Although it is possible to build the BN directlyfrom the analysis of the system, the conversion of anFT into a BN takes advantage of the familiarity thatmost analysts have with FT to build the first versionof the BN of the system under consideration.
Converting FT into a BN is not a complex pro-cess, and any analysis performed using FT can also beperformed with BN inference.(3,7) However, as men-tioned earlier, BNs offer some additional advantages,such as the possibility of including local dependen-cies, multistate variables, uncertainty, and dependen-cies among elements that can be included in the BNafter the conversion.
The first step to translate an FT into a BN isto create a corresponding node(5)for each event andbase elements (primary event/component) in the FT.Even if the same base element is represented morethan once in the FT, only one node must be cre-ated in the BN. The second step is to connect thenodes as the gates are connected in FT. The thirdstep is building a CPT for each node according to thelogic gates in the FT. In Figs. 1 (a) and (b) the CPTis assigned to nodes connected through AND andOR gates. The gates represent deterministic relation-ships; therefore, the entries are either 0 or 1, where 1denotes a failure and 0 denotes working. The otherFT gates must be converted into OR and AND gatesbefore converting FT into BN. Moreover, the logicgates might not be deterministic;(1) if there is un-certainty associated with the event, this uncertaintymight be considered on CPT, as shown in Fig. 1(c).Lampis and Andrews(17) and Martins et al.(20) trans-late an FT into a BN that is used to develop a systemfault diagnostics.
Additionally, BN facilitates the use of continu-ous variables; in this case, the prior probabilities arereplaced with probability density functions, and the

Methodology for Risk Analysis Based on Hybrid Bayesian Networks 5
P(E=1|A=0,B=0)=0P(E=1|A=0,B=1)=0P(E=1|A=1,B=0)=0P(E=1|A=1,B=1)=1
P(E=1|A=0,B=0)=0P(E=1|A=0,B=1)=1P(E=1|A=1,B=0)=1P(E=1|A=1,B=1)=1
P(E=1|A=0,B=0)=0P(E=1|A=0,B=1)=0P(E=1|A=1,B=0)=0P(E=1|A=1,B=1)=0,95
a) AND Gate Conversion c) AND Gate with Uncertainty b) OR Gate
Fig. 1. Converting an FT into a BN.
relationships between components are representedthrough basic constructs, such as the AND and ORgates used in FT.(1) The AND gate, where the outputwill fail when all input components fail, has a proba-bility of output failure in the time interval [0, t], givenby:
P (ζAND ≤ t) = P (ζ1 ≤ t, · · ·..., ζn ≤ t)
= P (max {ζi } ≤ t) , (2)
where ζAND is the time to failure (TTF) of AND gateand ζi is the TTF of component i.
The OR gate, where the output will fail if at leastone input component fails, has a probability of out-put failure in the time interval [0, t], given by:
P (ζOR ≤ t) = 1 − P (ζ1 > t, · · ·..., ζn > t)
= P (min {ζi } ≤ t) , (3)
where ζOR is the TTF of OR gate and ζi is the TTF ofcomponent i.
3. PROPOSED METHODOLOGY
The proposed methodology is a combination ofdifferent techniques based on the proposals of differ-ent authors,(1,3,6,12) which resulted in the formationof an iterative six-step methodology: familiarization,qualitative analysis, probabilsity estimation for unde-sired events, consequences analysis, risk evaluation,and mitigation measures.
Step 1—Familiarization
In this step, the available information concerningthe system and its operation must be collected. Thereview of the existing data (documentation and ex-pert opinion) should be performed and, if possible, a
visit to the site where the system is or will be installedis also recommended.
Step 2—Qualitative analysis
In the second step, the relationship between thesystem components must be identified. The qualita-tive analysis must provide a clear view of the sys-tem and identify the relationships between systemelements; in the proposed methodology, this repre-sentation should be accomplished by building a hy-brid BN. As mentioned in Section 2.3, the BN can bebuilt by the conversion of an FT into a BN or directly.
Step 3—Undesired events probability estima-tion
In the estimation of the probability of undesiredevents, the priori probabilities are included in theBN, the associated conditional probabilities are de-fined, and the joint probability of a set of variablesis evaluated. If there is any evidence, then it is in-cluded in the BN, and the conditional probabilitiesare evaluated. In this step, a criticality analysis and ananalysis of different scenarios may be performed byevaluating the posterior probabilities, which allowsfor an improvement of the analysis through an evalu-ation that is not possible using traditional tools, suchas FT. The criticality analysis aims at finding the setof components or subsystems that have greater influ-ence in the system behavior. The analysis of differentscenarios can be used to model any situation of in-terest, such as the impact of including redundancies,the impact of a component fault, the system behav-ior over time, or any other condition that affects thesystem and can cause a undesired event. It allows, forexample, including information about previous oper-ation time of a piece of equipment that may increase

6 Martins, Schleder, and Droguett
the probability of an undesired event over time (notethat this is not possible in an FT analysis).
Step 4—Consequences analysis
The consequence is the measure of the impactof the undesired events, and this article estimates theconsequences of the leakage of flammable substancesfrom the regasification system onboard an FSRU.The analysis will focus on harm to people due to theeffects of fires that can occur as a consequence of theleakage of propane or natural gas from the regasifi-cation system.
When a flammable liquid is released from a stor-age tank or pipeline, a liquid pool might form. As thepool forms, some of the liquid will evaporate and dis-perse. If the flammable vapor encounters an ignitionsource while its concentration is between the lowerand upper flammability limits (LFLs and UFLs), aflash fire will occur, and the flame can travel backto the spill, resulting in a pool fire. A pool fire in-volves burning of the vapor above the liquid pool asit evaporates from the pool and mixes with air. Thissequence is described by Pitblado et al.(6)
In the case of flash fire, the potential to injureindividuals is restricted within the ignited gas cloud,and for pool fire, the potential for fatalities reflectsthe exposure to heat radiation. To estimate the con-sequences, we will consider whether the vapor cloudencounters an ignition source, which occurs whenthe concentration equals the LFL, and reaches themaximum dispersion area (i.e., the most pessimisticscenario).
At this point, it is important to note that thescenarios described in this study consider that thereis no immediate ignition; however, if an immediateignition occurs and the flammable substance is re-leased in the form of jet, then a jet fire will form.As in the case of the pool fire, the potential for fa-talities reflects the exposure to heat radiation. Dif-ferent consequences models are used to estimate theconsequences according to the scenario. The mod-els used to perform the consequences analysis ofthe real case studied in this article are presented inSection 4.4.
Step 5—Risk evaluation
In the fifth step of the proposed methodology,the product of the probability of the occurrence ofundesired events and the magnitude of their conse-quences is used to calculate the risk. When the focusis on harm to people, the overall risk might be quan-
tified in terms of individual or societal risks. The so-cietal risk represents the risk to the community (thespecific population affected by the consequences an-alyzed), while the individual risk represents the riskto an individual at a specific point.
These values are useful to make decisions aboutthe location of terminals where the FSRU might op-erate. As reported in TNO(33) and Worthington,(34)
in case of a flash fire, the potential of fatalities is re-stricted to the area within the ignited gas cloud butwith a 100% probability, and in the case of a poolfire, the potential for fatalities reflects the exposureto thermal radiation with a 100% probability withinan area with a radiation magnitude greater than orequal to 35 kW/m2. In areas with less than 35 kW/m2
of radiation, the probability of death is evaluated us-ing the Probit function, which converts a dose levelto a probability of death as a function of the radiationlevel and the exposure time (see Worthington(34)).
Step 6—Mitigation measures
Finally, in the last step, the BNs are used toidentify critical components and propose mitigationmeasures. BN facilitates the analysis and propagationof evidence and examination of different scenarios.Given any evidence, such as a system failure, the be-liefs are recalculated to indicate its impact on the net-work. At this point, the process returns to step 3, andthe subsequent steps in the process are repeated untilthe desired level of risk is obtained.
Fig. 2 presents an overview of the methodologysteps, which is divided into two parts: the first enu-merates the tasks performed in each step, and thesecond lists the means suggested for these tasks.
4. APPLICATION OF THE PROPOSEDMETHODOLOGY
In this section, the risk analysis of a leak inthe LNG regasification system onboard an FSRU isperformed using the methodology described in theprevious section. First, information collected aboutthe system is presented. Then, a qualitative analy-sis is performed. Subsequently, the undesired events(leaks) probabilities are estimated for a given mis-sion time using BN, followed by a quantitative con-sequences analysis. Finally, the risk is evaluated,mitigation measures are proposed, and the risk isrevaluated.

Methodology for Risk Analysis Based on Hybrid Bayesian Networks 7
Step 1Familiarization
Step 2Qualitative
Analysis
Step 3Undesired Events
Probability Estimation
Step 4Consequences
Analysis
Step 5Risk
Evaluation
Step 6Mitigation Measures
Task
s
Understand the system and identify possible scenarios to whichthe system will be submitted.
Represent physically and functionally the system;Represent the relationships between system elements.
Complete the BN with quantitative data (priories, CPT and density functions);Estimate the probability density of the undesired events;Include evidence in the BN and evaluate the conditional probabilities.
Estimate the probable consequences of the undesired events.
Evaluate the risk associated with the facility or system analyzed.(This article is focused on the individual risk.)
Identify critical components and then propose mitigation measures.
Mea
ns Data review;Interviews with experts.
Functional tree;Unifilar diagram;Block diagram;Fault tree;Bayesian network.
Bayesian network (inference).
Discharge, pool formation dispersion, flash fire, and pool fire models.
Association of steps 3 and 4.
Bayesian network (inference considering evidence).
Fig. 2. Methodology summary.
4.1. Familiarization
Typically, vessels are used for LNG transporta-tion; however, in recent years, these vessels also be-gan to participate in the regasification and direct sup-ply to net pipes. The regasification process onboardan FSRU creates additional hazards to the opera-tion of LNG vessels because, in addition to LNG,compressed gas and the presence of propane havebeen added to the process. Accidents in this processmight reach the storage tanks, generating severe con-sequences. Natacci et al. report the consequences ofa catastrophic rupture of one, two and three LNGtanks.(35)
In the vessel studied, a cascade system was usedto regasify the LNG. In this system, the LNG isheated in two stages. In the first stage, a propanecompact heat exchanger (HE1) is used to heat theLNG, and its temperature is increased from −162 °Cto −10 °C; at this stage, the natural gas is already va-porized, but this temperature is too low for deliveryto the pipeline. In the next stage, sea water is usedto heat the gas in a shell-and-tube heat exchanger(HE2), and the temperature reaches 15 °C. The firststage uses no water due to the possibility of freezingwhen in direct contact with the LNG. Subsequently,the natural gas passes through an accumulator, and
if there is still a portion of liquid, then this liquid isreturned to the tank through gravity. Next, the gasis compressed and delivered to the gas pipeline. Thepropane used in the first phase works in a closedloop. When the propane leaves the LNG heat ex-changer HE1, its temperature is approximately –5 °C,and it is liquefied (propane at 4.7 bar liquefies at ap-proximately –5 °C). Hence, the propane is pumpedinto a titanium heat exchanger (HE3) and vaporizeswhen heated to 10 °C using sea water at 4.7 bar.The propane is subsequently returned to the LNGexchanger HE1. This system must have an effectivethermal insulation to avoid an unexpected heat gainof the LNG or propane inside the tubing, which couldresult in gas expansion and tubing rupture. Schlederet al. have provided a more detailed description ofthis regasification system.(36) A diagram of the sys-tem is shown in Fig. 3, and the nomenclature used ispresented in Table I. A thermal insulation for eachheat exchanger is also considered (I1, I2, and I3).
4.2. Qualitative Analysis
The qualitative analysis must provide a clearview of the system and identify the relation-ships between system elements, which might be

8 Martins, Schleder, and Droguett
I-10
HE1 HE2
LNG
Ac1
HE3
C
T2
Ac2
P5
P4
V13
V12V11V10
V6
V5V4V3
V9V8V2
V1 P1 V7
P2P3
Pipe1
Pipe
11
Pipe10
Pipe
9
Pipe
6 Pipe5
Pipe4
Pipe3Pipe2
Pipe 12
Pipe 13
Pipe 14
DeliveryPipe
F2
F1
Pipe
7
Pipe 8
Fig. 3. Unifilar diagram of the regasification system studied.
Table I. Unifilar Diagram Nomenclatures
Item Description Item Description
T2 Propane storage tank P2, P3 Propane pumpsV1, V2, V3, V6, V8, V9,
V10, V11, V12, V13Gate valves for liquid P4, P5 Water pumps
V4, V5, V7 Gate valves for gas Pipes 1, 2, 3, 4, 5, 12, 13, 14 Pipes with 8’’P1 LNG supply pump Pipes 6, 7, 8, 9, 10, 11 Pipes with 3’’Ac2 LNG accumulator Delivery pipe Pipe with 12’’HE1 Propane/LNG compact heat
exchangerAc1 Propane accumulator
C Compressor HE2 Sea water/LNG shell-tube heatexchanger
F1 e F2 Water filter HE3 Propane/sea water titanium heatexchanger
accomplished using a block diagram or a faulttree, followed by conversion into BN, as previouslyproposed.(37) A BN might also be generated directlyfrom the system analysis.
Considering the diagram of the system shown inFig. 3, a preliminary hazard analysis(38) showed thatthe major risks associated with this process are ex-plosions and fires as a result of LNG or propaneleaks. Based on this notion, FTs for the top events,“LNG Leak” and “Propane Leak,” were built andconverted into BN using the procedure explained inSection 2.3—“Converting FT into BN.”
In the FT construction, the following assump-tions were considered:
� The components present binary failure modes(fault with leak/no-fault);
� Relationships between events and causes arerepresented through logical AND and ORgates;
� Failures are statistically independent.
Due to the limited amount of information con-cerning failures rates, some assumptions were nec-essary to perform the analysis. First, the leakageswere divided in two types: medium leaks, which as-sumes leaks equivalent to holes with diameters equalto 100 mm or less for natural gas pipes and 50 mm orless for propane pipes, and catastrophic leaks, assum-ing leaks equivalent to holes with diameters greaterthan 100 mm for natural gas pipes and than 50 mmfor propane pipes, which are treated as catastrophicruptures in the pipeline. Because there are no avail-able databases(39,40) concerning significant frequen-cies of occurrence of the total rupture or total lossof containment for the other components of the sys-tem, only the pipelines were considered for the catas-trophic leakages. Thus, an FT was built for each ofthe following top events: natural gas medium leak,natural gas catastrophic leak, propane medium leak,and propane catastrophic leak.
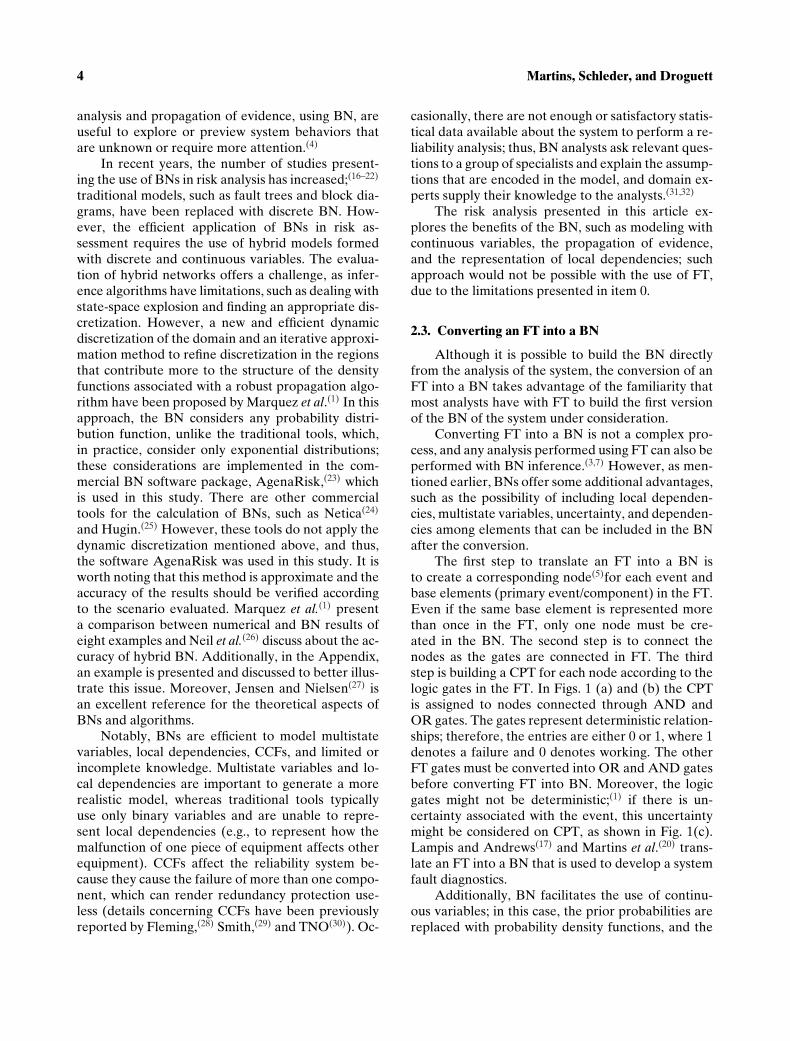
Fig. 4 presents the FT of a natural gas mediumleak that could represent a gas leak, a liquid (LNG)
Methodology for Risk Analysis Based on Hybrid Bayesian Networks 9
Compressionsystem leak Ac2
V7 C
DeliveryPipe Pipe 3Pipe 4
Pipe 5
Gas leak
V4
HE2 V5V1
P1 Pipe 1
HE1
V2
Pipe 2
Liquid leak
V3V6
Pipe 14
Natural gasmedium leak
Liquid and gas leak
Fig. 4. Fault tree representing a natural gas medium leak (leaks equivalent to holes with diameters equal to 100 mm or less).
V11 Pipe 11
Propane gas leak
T2
Ac1P2
Pipe 7
HE1
V8
P3
Propane liquid leak
V10V9
Pipe 8
Propane mediumleak
Propane liquid andgas leak
HE3
Pipe 6Pipe 9
Pipe 10
Fig. 5. Fault tree representing a propane medium leak (leaks equivalent to holes with diameters equal to 50 mm or less).
leak, or the simultaneous leaking of gas and liq-uid (two-phase leak). Not all equipment shown inFig. 3 is present in this FT, as some of thesepieces of equipment did not contribute to the topevent.
Another relevant assumption is that the LNGstorage tanks are outside of the scope of this studybecause the LNG tank is not a component of theregasification system. However, the propane storage
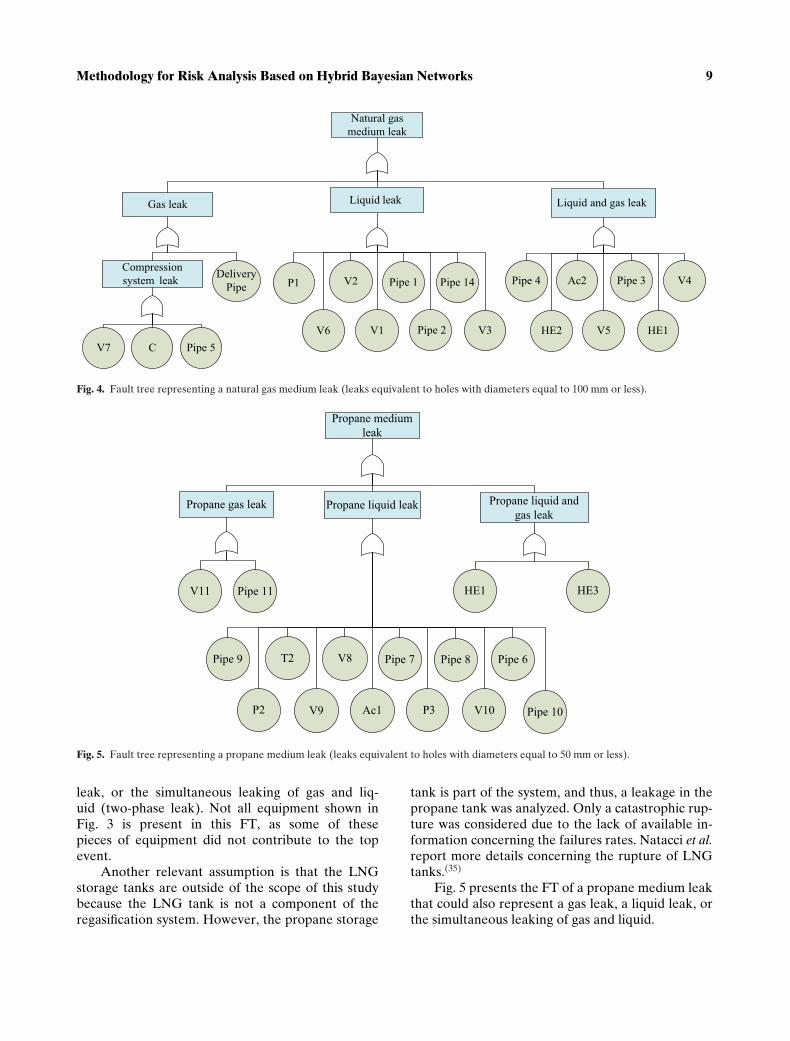
tank is part of the system, and thus, a leakage in thepropane tank was analyzed. Only a catastrophic rup-ture was considered due to the lack of available in-formation concerning the failures rates. Natacci et al.report more details concerning the rupture of LNGtanks.(35)
Fig. 5 presents the FT of a propane medium leakthat could also represent a gas leak, a liquid leak, orthe simultaneous leaking of gas and liquid.

10 Martins, Schleder, and Droguett
DeliveryPipe
Pipe 3Pipe 4Pipe 5
Gas leak
Pipe 1Pipe 2
Liquid leak
Pipe 14
Natural gascatastrophic leak
Liquid and gas leak
Fig. 6. Fault tree representing a natural gas catastrophic leak(leaks equivalent to holes with diameters greater than 100 mm).
Pipe 11
Propane gas leak
Pipe 7
Propane liquid leakfrom pipes
Pipe 8
Propanecatastrophic leak
Pipe 6 Pipe 9Pipe 10
Propane liquid leakfrom tank
T 2
Fig. 7. Fault tree representing a propane catastrophic leak (leaksequivalent to holes with diameters greater than 50 mm).
As previously discussed, it was assumed thatonly the pipelines and the propane storage tank aresubject to catastrophic ruptures and, consequently,Figs. 6 and 7, which present fault trees for catas-trophic leaks, only include pipelines and the propanestorage tank.
4.2.1. Converting Leak FT into BN
The first step to translate an FT into a BN iscreating a corresponding continuous node for eachevent and base element (primary event/component)in the FT, representing the TTF of the basic com-ponents or subsystems. The second step involves thesubsequent connection of the nodes in BN in a man-ner similar to the connection of gates in FT. In ad-dition, discrete nodes might be included to representthe state of the system or subsystem. The BN couldbe generated through the conversion of a previousFT into a BN or directly from the system analysis.Notably, even when the BN is built from a previousFT, the limitations associated with FT, as presented
in Sections 2.1 and 2.2, are not present in the resultingBN. Thus, the BN can be improved after convertingthe FT, facilitating the inclusion of continuous vari-ables and local dependencies.
The regasification system has local depen-dences between heat exchangers and insulators.The failure probability distributions of the nodes“Heat Exchanger LNG/Propane” (HE1), “Heat Ex-changer LNG/Water” (HE2), and “Heat ExchangerPropane/Water” (HE3) change if the their insulationfails. If the insulation fails, then the heat exchangerfailure probability increases. This variable has a con-ditional dependence, which cannot be addressed us-ing traditional approaches, such as FT. Although itis not possible to represent local dependence in FTanalysis, this dependence can be modeled in a simpleway using BNs. To include local dependence in themodel, an arc was built between these nodes. Usingthis approach, it is possible to model how the mal-function of equipment affects other equipment. Inaddition, it is also possible to include the CCF in theBN to obtain a more realistic model.(3,31) However,in the case presented here, failure rates due to CCFare reflected in the failure rates of the components.
Figs. 8–11 illustrate the corresponding BN foreach FT from Figs. 4–7, respectively. Following thesteps presented in Section 2.3 and the considerationsof the preceding two paragraphs, the construction ofthese BNs can be summarized as follows:
� corresponding nodes were created for eachevent and base element in the FT;
� the nodes were connected by arcs as they wereconnected by the gates in FT (the arcs representconditional dependencies among the nodes);
� discrete nodes (“gas leak probability,” “liquidleak probability,” and “liquid and gas leak prob-ability”) were included to represent the leakprobabilities for a specific mission time;
� arcs representing local dependences were in-cluded.
Notably, in BN, there are extra intermediatenodes, which are built to facilitate the quantitativeanalysis in the next step. The top nodes represent aleak in the regasification system. However, as differ-ent types of leaks (gas, liquid, or two-phase leakage)have different consequences, the nodes “gas leakprobability,” “liquid leak probability,” and “liquidand gas leak probability,” considering a given mis-sion time, are the nodes of interest to estimate therisk associated with the regasification system. These

Methodology for Risk Analysis Based on Hybrid Bayesian Networks 11
Fig. 8. BN representing a natural gas medium leak (corresponding to FT from Fig. 4).
probabilities will be multiplied by the correspondingconsequences to estimate the risk associated with theregasification system. Below these nodes are the sub-systems involving the basic components that mightfail and cause leaks.
4.3. Undesired Events Probability Estimation
The BN shown herein was built and executed toevaluate the probability of the undesired events us-ing the commercial tool AgenaRisk, which is avail-able on the Agena site.(23) In BN, quantitative analy-sis begins with the inclusion of the priori probabilitiesof the root nodes, which can be obtained using empir-ical data or expert opinion. Subsequently, the rela-tionships between nodes must be specified accordingto Equations (2) and (3). Finally, the joint probabilityof the network is obtained, which, in this study, facil-itates the determination of the leak probability for agiven mission time.
The root nodes that represent the basic com-ponents are characterized using probability densityfunctions that represent the TTF of each basic com-ponent. Recalling that only the faults that cause leaksare considered, the goal is to calculate the risks as-sociated with leaks. A similar analysis might be per-
formed to evaluate the system reliability through ad-justments in the BN and the probability density func-tions as in Schleder et al.(36)
Although the constructed BN is able to deal withany distribution, it was considered that the compo-nents have constant failure rates (λ) due to the lackof more specific data, which means that the TTF dis-tributions were assumed to be exponential. Thus, theprobability of a component to fail at a given missiontime t is calculated as P(f) = 1 − e−λt, except forthe insulators. The mission time was assumed as 96hours, which is the time required to regasify all thestored gas in the FSRU tanks. In order to define thefailure rates for the basic components, the statisticaldata presented in Refs. 39 and 40 were used, con-sidering only the information for failures associatedwith leakage. Table II presents the obtained failurerates associated with leakage for each basic compo-nent, except for the insulators.
Empirical or field (failure) data were not avail-able for the insulators, but their TTF distribution canbe determined using expert judgment. Thus, BN an-alysts ask relevant questions to a group of specialistsand explain the assumptions that are encoded in themodel, and the domain experts supply knowledge tothe BN analysts. In the current study, as suggested

12 Martins, Schleder, and Droguett
Fig. 9. BN representing a propane medium leak (corresponding to FT from Fig. 5).
by the specialists, for the insulator node, a Weibulldistribution was assumed, with a shape factor of s =6 and a scale factor of β = 1/10,000 hours. This dis-tribution could not be considered if the analysis hadused an FT.
The rupture rate suggested by the Health andSafety Executive (HSE)(40) was used to evaluate theBN for catastrophic leak, which was equal to 6.709 ×10⁻¹⁰/m.hr for pipes with a diameter equal or greaterthan 8 inches and 2.285 × 10⁻¹⁰/m.hr for pipes witha diameter equal or greater than 3 but less than 8inches. Only the catastrophic rupture of the pipesand the propane storage tank were considered in theevaluation of catastrophic leakages.
As discussed in the previous section, local depen-dencies between the heat exchangers and insulationwere considered in the developed BN. To representthese dependencies, the failure rates of the heat ex-changers were adjusted: first, the failure rate of theexchanger was considered with respect to workinginsulation (failure rate showed in Table II), and ahigher failure rate was considered for the heat ex-
changer if the insulation fails. Thus, for the heat ex-changer HE1, the failure rate increased from 1.500× 10⁻⁷ to 1.900×10⁻⁷ when the insulation failed,and similar results were obtained for the other twoheat exchangers. These failure rates are shown inTable III.
When the BNs are completed with all parame-ters, the inference is performed. The top events pro-vide the time distribution to the leak in the regasifica-tion system and the probabilities for the target nodes(which represent leaks probabilities) for a missiontime of 96 hours are obtained. These probabilities arepresented in Table IV. No maintenance actions wereconsidered during this period.
4.4. Quantitative Consequence Analysis
As described in the application case, the regasifi-cation system uses propane to heat the LNG. Ramoset al.(41) reported that the primary hazards associ-ated with LNG are the pool and the flash fires. Sincepropane is also flammable, this article assumes that

Methodology for Risk Analysis Based on Hybrid Bayesian Networks 13
Fig. 10. BN representing a natural gas catastrophic leak (corresponding to FT from Fig. 6).
Fig. 11. BN representing a propane catastrophic leak (corresponding to FT from Fig. 7).
the primary hazards associated with propane are thesame. When LNG mixes with water or comes incontact with a warmer surface, it forms a white va-por that dissipates in air, leaving no lasting residue.LNG vapors might burn when released into the at-mosphere, but they do not release enough energy tocreate overpressures, or forces, associated with ex-
plosions. Propane behaves similarly when mixed withwater.
To evaluate the consequence analysis, thecommercial tool PHASTRISK v6.54(42) was used.PHAST is one of the best-validated consequencecodes, with several validations for each implementedmodel.(6) The program models all the events, in

14 Martins, Schleder, and Droguett
Table II. Failure Rates
Component Failure Rate (λ; hour−1)
Ac1, Ac2 3.000 × 10⁻⁸
P1, P2, P3 2.000 × 10⁻⁸
P4, P5 3.800 × 10⁻⁷
C 1.000 × 10⁻⁸
Filters 1, 2, 3, 4 4.155 × 10⁻⁷
T2 3.120 × 10⁻¹⁰
HE2 1.000 × 10⁻⁷
HE3 4.500 × 10⁻⁷
HE1 1.500 × 10⁻⁷
Pipes 1, 2, 3, 4, 5, 12,13, 14 6.700 × 10⁻⁹a
Pipes 6, 7, 8, 9, 10, 11 2.237 × 10⁻⁸a
V1, V2, V3, V6, V8, V9, V10, V11,V12, V13
3.180 × 10⁻⁷
Delivery pipe 6.267 × 10⁻⁹
V4, V5, V7 3.900 × 10⁻⁸
aThe unit used for the failure rate of the pipes is (m.hour)−1.
Table III. Local Dependencies
State of Insulation Failure Rate (λ; hour−1)
I1 HE1Ok 1.500 × 10⁻⁷
Fault 1.900 × 10⁻⁷
I2 HE2Ok 1.000 × 10⁻⁷
Fault 1.500 × 10⁻⁷
I3 HE3Ok 4.500 × 10⁻⁷
Fault 5.000 × 10⁻⁷
which there is no immediate ignition, as a combi-nation of spillage (leak), pool formation and evap-oration, dispersion cloud to LFL, flash fire back tosource, and finally pool fire.
Following the scenario sequence, the first stepis the modeling of the leakage, which is performedusing the discharge model.(7,8) In this study, twosubmodels were used: the orifice model (mediumleaks) and the instantaneous model (catastrophicruptures). The orifice model simulates a continuousrelease through an orifice and predicts the dischargerate and the discharge duration, considering theavailable inventory. The instantaneous model sim-ulates the release of the entire inventory, resultingfrom a catastrophic rupture and comprising the con-tent substance expansion from initial to atmosphericconditions.
The second step is the modeling of the poolformation and evaporation to predict the pool di-ameter as a function of time, length of the evap-
Table IV. Leak Probabilities
Probability ofUndesired Event Occurrence/Year
Natural Gas Medium leak of gas 5.92 × 10⁻⁶
Medium leak of liquid 1.28 × 10⁻⁴
Medium leak of liquid and gas 3.55 × 10⁻⁵
Catastrophic leak of gas 1.68 × 10⁻⁷
Catastrophic leak of liquid 2.00 × 10⁻⁷
Catastrophic leak of liquid andgas
1.34 × 10⁻⁷
Propane Medium leak of gas 3.25 × 10⁻⁵
Medium leak of liquid 1.11 × 10⁻⁴
Medium leak of liquid and gas 5.73 × 10⁻⁵
Catastrophic leak of gas 2.18 × 10⁻⁸
Catastrophic leak of liquidfrom pipes
1.09 × 10⁻⁷
Catastrophic leak of liquidfrom storage tank
3.00 × 10⁻⁸
oration process, and the maximum quantity of va-por generated. There are different models to exam-ine the pool formation and evaporation, such as themodels presented by Weber,(9) Woodward,(10) andWitlox.(11) The PVAP (pool vaporization) model isimplemented in the software PHAST used in thisstudy. This model simulates the formation and dis-persion of the liquid pool released on the groundor into water and provides an estimation of theevaporation rate from the pool, considering theflow of heat conducted from the surface (soil orwater), convection through the air, radiation, andthe dissolution of the liquid from the pool whenformed over water. Initially, the temperature of thepool is assumed to be equal to the released liq-uid, and during each time step, the thermal balanceof the pool is evaluated through an estimation ofits vaporization, dimension, and temperature. Un-like the GASP and LPOOL models of Webber(9)
and Woodward,(10) respectively, the PVAP modelconsiders a minimum thickness for the pool, whichlimits its dispersion. The data obtained in this stepare used in the next one to evaluate the clouddispersion.
The cloud dispersion model estimates the evo-lution and the features of the cloud, such as con-centration, temperature, velocity, and dimensions,as a function of time and position. In the case offlammable substances, this model facilitates the pre-diction of an area where a fire might occur and thequantity of flammable material in that area. Disper-sion models are typically classified as models that

Methodology for Risk Analysis Based on Hybrid Bayesian Networks 15
Table V. Weather Conditions
Period Wind Speed (m/s) Temperature (°C) Class of Stability (Pasquill) Relative Humidity Wind Direction Pressure (mb)
Day 4.7 26.5 D 76.9 SE 1008.0Night 4.5 26.4 E 77.6 SE 1008.4
Source: Ramos et al.(41)
Table VI. Results of the Consequence Analysis of the Jet Fire Event
Jet Fire
Day Night
Undesired Event 12.5 kW/m2 35 kW/m2 12.5 kW/m2 35 kW/m2
Natural gas Medium leak of gas 71.03 Not reached 70.74 Not reachedMedium leak of liquid 142.63 108.72 143.56 109.49Medium leak of liquid and gas 71.03 Not reached 70.74 Not reachedCatastrophic leak of gas 146.17 98.74 145.54 97.79Catastrophic leak of liquid 173.46 137.16 174.56 138.30Catastrophic leak of liquid and gas 146.17 98.74 145.54 97.79
Propane Medium leak of gas Not reached Not reached Not reached Not reachedMedium leak of liquid 69.57 Not reached 69.98 Not reachedMedium leak of liquid and gas 68.07 Not reached 68.48 Not reachedCatastrophic leak of gas 97.01 61.39 97.58 61.95Catastrophic leak of liquid from pipes 118.42 85.71 119.07 86.34
treat clouds with densities higher than the air den-sity (as SLAB in TNO)(12) or models that treat cloudswith densities equal or lower than the air density(as the Gaussian plume model also presented inTNO).(12) However, the UDM model (unified disper-sion model)(13)is a generic integral model that simu-lates the dispersion of clouds with any density. Ad-ditionally, the UDM model can be used to simulatethe dispersion of a cloud that results from an instan-taneous, continuous, or a finite duration release withor without the presence of a jet and can be coupledwith the PVAP model. This model is available in thePHAST software and was used to perform the anal-ysis in this study.
If the concentration of the cloud reaches be-tween the LFLs and UFLs and then encounters anignition source, a flash fire or an explosion will occur.However, in the case of steady hydrocarbon clouds inan unconfined area, the speed of the flame propaga-tion is between 5 and 30 m/s, which is not enough tocause overpressure. As presented in TNO,(12) in thecase of flash fire, the area covered by the flammablecloud will be subject to a strong heat flux, result-ing in a rate of fatalities equal to 100%; however,this rate of fatality is restricted to the area withinthe ignited gas cloud. Nevertheless, the flame can
travel back to the spillage and cause a pool fire.Thus, it is necessary to determine the area coveredby the flash fire to estimate the consequences toindividuals.
To complete the consequence analysis (thefourth step of the methodology), the pool fire is mod-eled, which results from the burning of the vaporizedmaterial above the pool and not from the mate-rial in the pool. The pool formation and evapo-ration model estimates the pool dimensions thatdirectly affect the flame dimensions and thus thethermal radiation emitted. The thermal effect isthe principal mechanism of damage from a poolfire. TNO(12) compares the characteristics of a pointsource model and a surface emitter model and statesthat the former model presents a precise evalua-tion of distances greater than five times the pooldiameter. For smaller distances, the surface emit-ter model must be used. The POLF model of Okeand Witlox,(14) which is a surface emitter model, pre-dicts the heat flux, facilitating the evaluation of thearea covered by the radiation effects, and it can beused to analyze the consequences of pool fires at anydistance.
In parallel to these scenarios, in which there isno immediate ignition, is the jet fire, which occurs if

16 Martins, Schleder, and Droguett
Table VII. Results of the Consequence Analysis of the FlashFire Event
Flash Fire (LFL)
Undesired Event Day Night
Natural gas Medium leak of gas 63.80 61.26Medium leak of liquid 119.20 113.01Medium leak of liquid
and gas63.81 61.26
Catastrophic leak of gas 112.10 107.31Catastrophic leak of
liquid139.62 136.44
Catastrophic leak ofliquid and gas
112.10 107.31
Propane Medium leak of gas 15.30 15.03Medium leak of liquid 59.23 56.79Medium leak of liquid
and gas58.52 56.01
Catastrophic leak of gas 74.13 72.21Catastrophic leak of
liquid from pipes88.14 80.46
Catastrophic leak ofliquid from storagetank
581.01 645.58
there is immediate ignition at the time of release. Aswith pool fires, the thermal effects are the primarymechanism of damage from a jet fire. To estimate thegeometry and radiation of the flame, TNO(12) pro-poses the model presented by Chamberlain, whichis the original cone model and was developed fornear-vertical vapor-phase releases. Cook et al. modi-fied this model to describe the shape of jets that con-tain liquid.(15) Moreover, Johnson proposed a modelto represent horizontal vapor release, presented byOke.(15)
4.4.1. Defining Parameters for the ConsequenceAnalysis
The leakages considered in the quantitative anal-ysis of the likelihood of the undesired events weredivided in two types: medium leak, which assumesleaks equivalent to holes with diameters of 100 mmor less for natural gas pipes and 50 mm or less forpropane pipes, and catastrophic leak, which assumesleaks equivalent to holes with diameters greater than100 mm for natural gas pipes and holes greater than50 mm for propane pipes (both will be treated ascatastrophic ruptures of the pipeline) and the ruptureof the propane storage tank.
The consequences analysis was performed con-sidering that the regasification is conducted in the
Suape Industrial District, which is the most completecenter for industrial business and trade in northeast-ern of Brazil. The meteorological conditions consid-ered for this study are consistent with those pre-sented in Ramos et al.(41) (see Table V). The diur-nal period corresponds to the conditions between6:00 AM to 6:00 PM, and the nocturnal period cor-responds to the conditions between 6:00 PM to 6:00AM.
The FSRU considered in this application hasa storage tank capacity equal to 145,000 m3, di-vided among five tanks with 29,000 m3, and thepropane storage tank capacity is equal to 500 m3.However, it was assumed that the emergency shut-down system would successfully interrupt the regasi-fication system operation in case of any medium orcatastrophic leakage in 30 seconds (15 seconds forleakage detection and 15 seconds for isolation ofthe failure) and shutdown the system. Therefore, themaximum LNG flow rate in the pipes is 1510 m3/h,and the largest amount of LNG spill will be approx-imately 13 m3. Similarly, the maximum propane flowrate in the pipes was assumed to be 480 m3/h, and thelargest amount of propane spill will be approximately4 m3. The composition of LNG was assumed as 100%methane.
4.4.2. Modeling Consequence Analysis
First, a single ignition outcome is considered,which is assumed to occur when the cloud attains themaximum ground-level footprint area that happenswhen the cloud reaches its LFL concentration limit.This assumption is consistent with the recommen-dation of TNO,(12,43) and the probability of death is100% in the area bounded by the LFL. The same ref-erences suggest that the radiation effects are propor-tional to the distance assuming that for 12.5 kW/m2,the probability of death is equal to 1%, and for 35kW/m2, the probability of death is 100%. Moreover,an immediate ignition at the discharge moment isconsidered.
The results of the consequences analysis, repre-senting the distances (in meters) reached for eachconsequence consistent with the leak and period (dayor night), are presented in Table VI (to immediateignition), Table VII (to ignition at the time when thecloud reaches its LFL), and Table VIII (to ignition atthe time when the pool has maximum radius).
The consequences analysis shows that, if an ig-nition occurs immediately after a leak, the radiationproduced by jets fires might reach significant areas

Methodology for Risk Analysis Based on Hybrid Bayesian Networks 17
Table VIII. Results of the Consequence Analysis of the Pool Fire Event
Pool Fire
Day Night
Undesired Event 12.5 kW/m2 35 kW/m2 12.5 kW/m2 35 kW/m2
Catastrophic leak of liquid from propane tank 449.69 276.42 449.87 275.13
Table IX. Scenarios, Contribution to the Risk
Undesired Event Risk / Average Year Risk Contribution (%)
Natural gas Medium leak of gas − −Medium leak of liquid 1.03E-06 98.53Medium leak of liquid and gas − −Catastrophic leak of gas 1.38E-09 0.13Catastrophic leak of liquid 3.50E-09 0.33Catastrophic leak of liquid and gas 1.10E-09 0.10
Propane Medium leak of gas − −Medium leak of liquid − −Medium leak of liquid and gas - -Catastrophic leak of gas - -Catastrophic leak of liquid 4.32E-10 0.04Catastrophic leak of liquid of the tank 9.04E-09 0.87Total 1.05E-06 100
around the release point. The radiation level equalto 12.5 kW/m2 might reach 174 m (in this area theprobability of death is equal to 1%), and the radia-tion equals to 35 kW/m2 might reach 138 m, causing100% fatalities in this area. In some of the scenar-ios shown in Table VI, it is possible to verify that theradiation level of 35 kW/m2 is not reached becausethe jet fires formed in these scenarios are not capa-ble of producing this level of radiation. Moreover, inpropane scenarios, the effects of liquid leak and gasand liquid leaks are similar. This effect potentially re-flects the fact that in both cases, only liquid leak isexpected, and thus, the conditions of the leak are thesame. However, the temperature is slightly higher inthe liquid and gas leak scenario. A leak of two phasesonly occurs if there is malfunction of the system; thus,the difference between these cases is the probabilityof occurrence. Similar results were observed in natu-ral gas scenarios between the gas leak and liquid andgas leak, in which only gas leak was expected.
As previously discussed, if there is no imme-diate ignition, a single ignition outcome is consid-ered, which is assumed to occur at the time whenthe cloud reaches its LFL. In this case, flash fires andpool fires might result. Table VII shows that the dis-tances achieved by flash fires caused by liquid leaks
are larger than the distances obtained by flash firesresulting from gas leaks. The clouds formed by liquidleaks take longer to reach the LFL, as clouds with liq-uid fractions have much higher concentrations thanthose comprising only steam. In the case of naturalgas and the catastrophic leak of liquid, the LFL of thecloud might reach 139 m from the leakage point, andin the case of a catastrophic rupture of the propanetank, the LFL might reach 645 m, revealing a signif-icant area around the leakage point that can be im-pacted by a flash fire.
Finally, in the analyzed scenarios, the leakagesare not sufficient to form a pool due to the vapor-ization of the entire material leaked before reachingthe water, except for catastrophic leak of liquid fromthe propane tank, where the radiation level equals 35kW/m2 due to a pool fire that reached 276 m, causing100% fatalities in this area.
4.5. Risk Evaluation
The commercial tool PhastRisk(42) was used toevaluate the risk, considering just fatalities and notinjuries, which means that the individual risk will bethe likelihood of an individual, at a given location, toexperience fatal effects.

18 Martins, Schleder, and Droguett
Fig. 12. F-N curve representing the societal risk of the system operation and the acceptable limits.
Fig. 13. Impact of the basic components in the expected time tooccur of a medium leak of liquid of natural gas.
To evaluate the distribution of the risks inthe local area, HSE’s guidelines(44) on tolerabilitylimits suggest the following criteria for individualrisk:
� Maximum tolerable risk for workers: 1 ×10⁻³/year;
� Maximum tolerable risk for the public: 1 ×10⁻⁴/year;
� Broadly acceptable risk: 1 × 10⁻⁶/year.
Determining the risk distribution around thefloating unit is useful to reach a decision about itslocalization. The distance to reach an acceptable in-dividual risk associated with the operation of the re-gasification system is approximately120 m.
The contribution that each event makes to theindividual risk at specific locations might also beobtained. Table IX shows the contribution of eachevent to the risk at 120 m from the release point, in-dicating the events that have potential to cause thehighest risk at a given localization point. At 120 mfrom the release point, the medium leak of liquid ofnatural gas is considered the event that most con-tributes to the total risk. Thus, the mitigation mea-sures should focus on actions to minimize the risk as-sociated with this event.
Considering that an FSRU might operate in sev-eral locations using an offshore terminal to connectto the delivery gas pipeline, it is assumed that thisterminal is located far enough from the coast andthe consequences do not reach the local population.Thus, the societal risk is evaluated considering thecrew (22 persons) as the individuals who might be af-fected by the consequences of the undesired events.
The IMO(45) reports that the tolerable levelof societal risk is usually lower than the tolera-ble level of individual risk. Therefore, consider-ing a graph in which the abscissa represents the

Methodology for Risk Analysis Based on Hybrid Bayesian Networks 19
Fig. 14. F-N curve representing the societal risk of the system operation and the acceptable limits after mitigation measures.
number of fatalities (N) and the ordinate repre-sents frequency (F) of N fatalities, it was assumedthat the minimum risk criterion is limited by theline defined by points with coordinates (1; 1 × 10⁻⁵)and (10; 1 × 10⁻⁷), and the maximum risk criterion islimited by the line defined by points with coordinates(1; 1 × 10⁻⁴) and (10; 1 × 10⁻⁶). Fig. 12 shows theF-N curve, where the yellow line represents the min-imum risk criteria, the green line represents the max-imum risk criteria, and the blue line represents thesocietal risk of the regasification system operation(colors visible in online version). These results showthat the societal risk is above the maximum risk cri-teria. Thus, the operation of the regasification systemis unacceptable. Notably, the failure rates used toperform this study are from the available databasesmentioned earlier(39,40) and refer to similar pieces ofequipment, which are not exactly the same as thoseused in the system. Thus, it is necessary to obtainmore data about the system to perform this analysismore reliably.
4.6. Mitigation Measures
The data concerning the contribution of eachevent to the individual risk at a specific point, as pre-sented in Table IX, might facilitate the design of mit-igation measures. This table shows that natural gasmedium liquid leak is the event that contributes mostto the individual risk at this point. Thus, it is expected
that reducing the risk associated with this event willsignificantly reduce the total risk. The BN analysiscan be used to verify which components contributethe most to this undesired event. It is possible to ana-lyze the criticality of each system component throughevaluations of their posterior probabilities using therelevant inference algorithm, considering the naturalgas medium liquid leak as evidence.
Fig. 13 shows a visual perspective, where thelength of the bars is a measure of the impact of eachnode on the target node (the natural gas medium leakof liquid). The first bar indicates the range betweenthe lowest and highest values for the expected timefor a natural gas medium liquid leak to occur giventhe expected time for a leak to occur in the V3 valve.The initial point of the bar (equal to zero) reflectsthe expected time for the natural gas medium liquidleak given the time expected for a leak to occur in thevalve being near zero. The end point is the expectedtime of the natural gas medium liquid leak given thatthe expected time to leak in the valve significantlyexceeds the mission time, which influences the ex-pected time for the natural gas medium liquid leak.After this point, the expected time for the natural gasmedium liquid leak stabilizes. Even if the valve’s ex-pected time increases, the expected time to naturalgas medium liquid leak does not change. The secondbar represents the expected values for the expectedtime for natural gas medium liquid leak conditionedon the expected time for valve V2. The subsequent

20 Martins, Schleder, and Droguett
bars are plotted using the same concept. The graphshows that the valves V1, V2, V3, and V6 are thecomponents that contribute most to the undesiredevent.
To reduce the risk associated with this event, itis reasonable to consider reducing the failure ratesof the most critical components. Thus, the BN canbe used to verify changes in the frequency of the un-desired event due to the improvement of the criti-cal components. To perform this analysis, it is onlynecessary to include the evidence in the model. Ascenario was created through an assumption that thevalves (V1, V2, V3, and V6) fail only after the mis-sion time, and the beliefs are subsequently recalcu-lated given the evidence. Thus, the probability of oc-currence of the undesired event decreases from 1.28× 10⁻⁴ to 2.79 × 10⁻⁶ and, consequently, the risk ofthe undesired event is reduced from 1.03 × 10⁻⁶ to2.30 × 10−8 and the risk at 120 m from the releasepoint is reduced from 1.05 × 10⁻⁶ to 3.85 × 10⁻⁸. Thisis the greatest possible reduction in the frequency ofthe undesired event “natural gas medium liquid leak”acting on these components. Assuming a mitigationmeasure that improves the reliability of the valves,in which the failure rate decreases from 3.18 × 10⁻⁷
to 3.18 × 10⁻⁸, we can recalculate the risk; the indi-vidual risk at 120 m from the release point decreasesfrom 1.05 × 10⁻⁶ to 1.18 × 10⁻⁷.
The reallocation of the regasification system wasproposed as an additional mitigation measure. Orig-inally, it is allocated amidships. However, the reloca-tion of the system to the bow of the vessel was pro-posed to reduce the effect of the undesired eventson the crew, which is assumed uniformly distributedthroughout the vessel. After the inclusion of thesemitigation measures, the societal risk falls into the ac-ceptable region, as shown in Fig. 14.
5. CONCLUSIONS AND FUTURE WORK
This article presented a methodology to performa risk analysis using hybrid BN and demonstratedhow BN can be useful in performing more compre-hensive risk analysis and it was applied to the riskanalysis of a regasification system of LNG onboardan FSRU. All the steps of the proposed methodol-ogy were evaluated; thus it was possible to estimatethe probabilities of undesired events (using BN), toestimate the consequences of these events, and eval-uate the risk.
As fault trees, BNs are useful to characterizethe interactions between subsystems. However, BNsmight also offer the inclusion of expert opinion andthe use of continuous variables, uncertainties, anddependencies between the components under anal-ysis. These options are significant for the examina-tion of a system that does not have a large amount ofstatistical data, such as the FSRU regasification sys-tem. This analysis could not be accomplished usingfault trees, as it does not facilitate the inclusion oflocal dependencies between insulators and the heatexchanger, the use of continuous variables to repre-sent the TTF of all components and subsystems, theuse of nonexponential distributions to represent theinsulator TTF, and the diagnostic analysis to identifycritical components that contribute to the most prob-able undesired event (the natural gas medium liquidleak).
The possibility of including continuous variablesand dependencies between the components makesthe model more realistic, thereby improving the anal-ysis. To generate a more efficient analysis, it is essen-tial to obtain more information about the system andequipment. Additionally, BN allows the study of theevidence propagation and the behavior system overtime, which allows the analysis of different scenariosand of the conditional reliability by evaluating theposterior marginal probability distribution, as pre-sented by Martins and Schleder(46) and by Schlederet al.(47)
The consequence analysis showed that both theleakages, LNG and propane, could cause undesiredconsequences, which might reach significant areas.The analysis performed in this study considered theleak in the regasification system of the FSRU, whichare not large due to flow restrictions and the emer-gency shutdown system. However, it is important toconsider in future studies the reliability of the emer-gency shutdown system, the total rupture of the LNGtanks that supply the system, and the cascade eventsthat can cause the leakage of all the tanks in theFSRU. Similar events might cause consequences thatwill reach larger areas and subsequently cause moredamage and fatalities.
The individual risk was estimated and the dis-tribution of associated risk to the regasification sys-tem in the local area was verified, confirming thatat a distance of approximately 120 m, the indi-vidual risk associated with the regasification sys-tem is acceptable at approximately 1 × 10⁻⁶/year.However, the societal risk was not acceptable when

Methodology for Risk Analysis Based on Hybrid Bayesian Networks 21
compared to the considered criteria. Using the BN,the undesired event that contributes the most to therisk was identified. Thus, the BN analysis was usedto define mitigation measures through the analysisof the contribution of each component to the occur-rence of the undesired event. Once the critical com-ponents were identified, the reduction of the failurerate of the critical components (valves V1, V2, V3,and V6) and the reallocation of the regasification sys-tem were proposed for the reduction of societal risk.The analysis of only the undesired event that mostcontributed to the risk at a distance of 120 m might beimproved using the BN diagnostic analysis of otherundesired events, thereby contributing to the identi-fication of additional mitigation measures.
ACKNOWLEDGMENTS
This article reports part of the overall resultsobtained in the R&D project number 01.10.0498.00sponsored by FINEP – Studies and Projects Financ-ing Agency, a public institution linked to the Min-istry of Science and Technology in Brazil, whosesupport the authors gratefully wish to acknowledge.The authors also gratefully wish to acknowledgethe Program for Development of Human Resources(PRH19) from the Brazilian National Petroleum,Natural Gas and Biofuels Agency and Petrobras forthe financial support.
APPENDIX: NUMERICAL ACCURACY
As mentioned in Section 2.2, the method used toevaluate the probability of the leaks is not completely
Table A1. Comparison Between Numerical and BN Results.
Reliability Reliability Probability Probability of Probability ofTime Reliability BN Numerical BN Error (%) of Failure BN Failure Numerical Failure BN Error (%)
20 0.99997 0.9995 0.05 3.00E-05 5.00E-04 6.0050 0.99988 0.9980 0.19 1.20E-04 2.00E-03 6.00100 0.99937 0.9941 0.53 6.30E-04 5.90E-03 10.68200 0.99638 0.9828 1.38 3.62E-03 1.72E-02 21.05500 0.96456 0.9828 1.86 3.54E-02 1.72E-02 106.05
accurate; therefore, it is recommendable to verify thenumerical accuracy. In order to exemplify the errorestimation, the error for a simple case of warm sparewas evaluated as in Marquez et al.(1)
Indeed, let us consider two components in awarm standby configuration, in which the main com-ponent has a Weibull failure distribution with a shapefactor of s = 1.5 and a scale factor of β = 1/1,500, thestandby component has also a Weibull failure distri-bution with a shape factor of s = 1.5 and a scale factorof β = 1/1,500 when in active mode and a shape fac-tor of s = 1.5 and a scale factor of β = 1/2,000 whenoperating in standby mode.
Table A1 provides the values for the reliability atdifferent times of operation calculated using numeri-cal integration (performed using the software MAT-LAB) and the values provided for the BN model (ob-tained using AgenaRisk V5.6.0 with 100 iterations).
It is worth to note that the major error esti-mated for the reliability, in this example, is less than2%. However, in scenarios where the value of thefailure probability is critical, the BN error couldbe significantly larger. In these cases, it is essen-tial to consider the error due to the estimation viathe BN.
More information about the numerical accu-racy of this procedure can be found in Marquezet al.,(1) where the comparison between numericaland BN results of eight examples is presented; inChaur and Sou,(48) who perform a reliability analy-sis of hydropower system and compare the resultsobtained by the BN and the FT analysis; and inNeil et al.,(25) in which the accuracy of hybrid BN isdiscussed.

22 Martins, Schleder, and Droguett
REFERENCES
1. Marquez D, Neil M, Fenton N. Improved reliability model-ing using Bayesian networks and dynamic discretization. Reli-ability Engineering & System Safety, 2010; 95(4):412–25. doi:10.1016/j.ress.2009.11.012.
2. Neapolitan RE. Learning Bayesian Networks, 1st ed. UpperSaddle River, NJ: Prentice Hall, 2004.
3. Langseth H, Portinali L. Bayesian networks in reliability.Reliability Engineering &System Safety, 2010; 92(2):92–108.doi:10.1016/j.ress.2005.11.037.
4. Jones B, Jenkinson I, Yang Z, Wang J. The use of Bayesiannetwork modeling for maintenance planning in a manufactur-ing industry. Reliability Engineering & System Safety, 2010;95(3):267–77. doi:10.1016/j.ress.2009.10.007.
5. Hurdle E, Bartlett LM, Andrews JD. System fault diagnos-tics using fault tree analysis. Journal of Risk and Reliability,Proceedings of the Institution of Mechanical Engineers, PartO, 2006; 221(1):43–55. doi:10.1243/1748006XJRR6. Also avail-able at: http://hdl.handle.net/2134/3817.
6. Pitblado R, Baik J, Raghunathan V. LNG decision makingapproaches compared, Journal of Hazardous Materials. 2006;130(1–2):148–54. doi:10.1016/j.jhazmat.2005.07.081. PubMedPMID: WOS:000236437700021.
7. Haper M. ATEX Theory Document. London, UK: DNV Soft-ware, 2005.
8. Haper M. DISC Theory Document. London, UK: DNV Soft-ware, 2005.
9. Webber DM. A model for pool spreading and vaporizationand its implementationin the computer code GASP. UKAEAReport SRD/HSE R507, Safety and Reliability Directorate,Warrington, UK, 1990.
10. Woodward JL. An integrated model for discharge rate, poolspread, and dispersion from punctured process vessels. Jour-nal of Loss Prevention in the Process Industries, 1990; 3(1):33–7. doi:10.1016/0950-4230(90)85020-a.
11. Witlox HWM. PVAP Theory Document. London, UK: DNVSoftware, 2006, 39 p.
12. TNO—The Netherlands Organization of Applied Scien-tific Research. Methods for the Calculation of Physical Ef-fects: Due to Releases of Hazardous Materials (Liquids andGases)—Yellow Book, 3rd rev. ed. Netherlands: Committeefor the Prevention of Disasters, 2005.
13. Haper M. UDM Theory Document. London, UK: DNV Soft-ware, 2009.
14. Oke A, Witlox HWM. POLF Theory Document. London,UK: DNV Software, 2004.
15. Oke A, Witlox HWM. Worthington, D. JFSH (Jet Fire) The-ory Document. London, UK: DNV Software, 2005.
16. ABS—American Bureau of Shipping. Guidance Notes onRisk Evaluations for the Classification of Marine-RelatedFacilities. Houston, Tx: American Bureau of Shipping,2003.
17. Lampis M, Andrews JD. Bayesian belief networks for systemfault diagnostics. Quality and Reliability Engineering Interna-tional, 2009; 25(4):409–26. doi:10.1002/qre.978.
18. Matsuura JP, Yoneyama T. Learning Bayesian networks forfault detection. Pp. 133–142 in IEEE (ed). Proceedings of the14th IEEE International Workshop on Machine Learning forSignal Processing, 2004, Sao Luis, Brazil.
19. Li L, Wang J, Leung H, Jiang C. Assessment of catastrophicrisk using Bayesian network constructed from domain knowl-edge and spatial data. Risk Analysis, 2010; 30(7):1157–1175.doi:10.1111/j.1539-6924.2010.01429.
20. Martins MR, da Silva DF, Maruyama FM, Loriggio FF. TheBayesian networks applied to a steering gear system fault di-agnostics. International Conference on Ocean, Offshore andArctic Engineering—OMAE 2010, Shanghai.
21. Cowell RG, Verrall RJ, Yoon YK. Modeling operational riskwith Bayesian networks. Journal of Risk and Insurance, 2007;74(4): 795–827. doi:10.1111/j.1539-6975.2007.00235.x.
22. Martins MR, Maturana MC. Application of Bayesian beliefnetworks to the human reliability analysis of an oil tanker op-eration focusing on collision accidents. Reliability Engineering& Systems Safety, 2013; 110:89–109.
23. Agena Risk Desktop. Available at: http://www.agenarisk.com/products/desktop.shtml, Accessed September 17, 2012.
24. Netica Software Available at: http://www.norsys.com/, Ac-cessed September 17, 2012.
25. Hugin Software. Available at: http://www.hugin.com, Ac-cessed September 16, 2012.
26. Neil M, Chen X, Fenton N. Optimizing the calculationof conditional probability tables in hybrid Bayesian net-works using binary factorization. IEEE Transactions onKnowledge and Data Engineering. 2012; 24(7): 1306–1312.doi:10.1109/TKDE.2011.87.
27. Jensen FV, Nielsen TD. Bayesian Networks and DecisionGraphs, 3rd rev. ed. New York: Springer, 2001.
28. Fleming KN. A Reliability Model for Common-Mode Failuresin Redundant Safety Systems. General Atomic Report, GA-13284. Pittsburgh, PA: National Institute, December 1974.
29. Smith DJ. Reliability, Maintainability and Risk: PracticalMethods for Engineers, 6th rev. ed. Woburn, UK: ButterworthHeinemann – Elsevier, 2001.
30. TNO—The Netherlands Organization of Applied ScientificResearch. Methods for Determining and Processing Probabil-ities: Red Book. The Netherlands: Committee for the Preven-tion of Disasters, 2005.
31. Charniak E. Bayesian networks without tears. Ai Mag-azine, 1991; 12(4):50–63. Also available at: http://www.aaai.org/ojs/index.php/aimagazine/article/view/918/836.
32. Whittaker J. Graphical Models in Applied Multivariate Statis-tics, 2nd rev. ed. Michigan, USA: Willey, 2009.
33. TNO—The Netherlands Organization of Applied ScientificResearch. Methods for Determination of Possible Damage toPeople and Objects Resulting from Releases of HazardousMaterials: Green Book. Netherlands: Committee for the Pre-vention of Disasters, 1992, 337 p.
34. Worthington D. MPACT Theory Document. London, UK:DNV Software, 2010.
35. Natacci BF, Ikeda NH, Martins MR. Consequence analysis ofa liquefied natural gas leakage. Proceedings of the ASME 201029th International Conference on Ocean, Offshore and Arc-tic Engineering; International Conference on Ocean, Offshoreand Arctic Engineering, 2010, Shangai, China.
36. Schleder AM, Martins MR, Souza GFM. Bayesian networkson risk analysis of a regasification system on an offshore unit.Proceedings of the ASME 2011 30th International Conferenceon Ocean, Offshore and Arctic Engineering, 2011, Rotterdam,Netherlands.
37. Bobbio A, Portinale L, Minichino M, Ciancamerla E. Improv-ing the analysis of dependable systems by mapping fault treesinto Bayesian networks. Reliability Engineering & SystemSafety, 2001; 71(3):249–60. doi:10.1016/s0951-8320(00)00077-6. PubMed PMID: WOS:000166929900003.
38. Schleder AM, Martins MR, Souza GFM. Preliminary riskanalysis of a liquefied natural gas regasification system in anoffshore unit. Proceedings of the International Conference onVulnerability and Risk Analysis and Management, 2011, Col-lege Park, MD. doi:10.1061/41170(400)48.
39. DNV—Det Norske Veritas. OREDA—Offshore ReliabilityData Handbook. 4th ed. Norway: OREDA Participants, 2002.
40. HSE—Health and Safety Executive. Offshore Hydrocar-bon Releases Statistics. Hid Statistics Report HSR 002.London: Health and Safety Executive, 2001. Available at:www.hse.gov.uk/hid/osd/hsr2001/contents.htm.

Methodology for Risk Analysis Based on Hybrid Bayesian Networks 23
41. Ramos MA, Droguett EL, Martins MR, Souza HP. Quanti-tative risk analysis and comparison for onshore and offshoreLNG terminals: The Port of Suape—Brazil case. Proceed-ings of the ASME 2011 30th International Conference onOcean, Offshore and Arctic Engineering, 2011, Rotterdam,Netherlands.
42. DNV—Det Norske Veritas. Phast Risk Software: Version6.54.1. Oslo: Det Norske Veritas, 2009.
43. TNO—The Netherlands Organization of Applied ScientificResearch. Guidelines for Quantitative Risk Assessment—Purple Book. Netherlands: Committee for the Prevention ofDisasters, 2005.
44. HSE—Health and Safety Executive. Reducing Risks, Protect-ing People. Discussion Document, Health and Safety Execu-tive. London: Health and Safety Executive, 1999.
45. IMO—International Maritime Organization. Guidelines forFormal Safety Assessment (FSA) for Use in the IMO Rule-
Making Process. London: International Maritime Organiza-tion, 2002.
46. Martins MR, Schleder AM. Reliability analysis of the regasi-fication system on board of a FSRU using Bayesian networks.Pp. 143–158 in Gupta SB (ed). Natural Gas: Extraction toEnd Use, 1st ed. Pennsylvania, USA: INTECH Open Science,2012.
47. Schleder AM, Martins MR, Modarres M. The use of Bayesiannetworks in reliability analysis of the LNG regasificationsystem on a FSRU under different scenarios. Proceedingsof the Twenty-Second International Offshore and PolarEngineering Conference, 2012. v. 1, pp. 881–888, Rhodes,Greece.
48. Chaur GJ, Sou SL. Bayesian network based hydro-power faultdiagnosis system development by fault tree transformation.Journal of Marine Science and Technology, 2013; 21(4): 367–379. doi:10.6119/JMST-012-0508-3.