A Methodology for Measuring Thermal Properties of …
25
A Methodology for Measuring Thermal Properties of Bearings in Motion Y. R. Takeuchi; [email protected] J. T. Dickey; [email protected] S. M. Demsky; [email protected] K. K. Lue; [email protected] J. J. Kirsch; [email protected] P. P. Frantz; [email protected] The Aerospace Corporation P.O. Box 92957 Los Angeles, CA 90009 Abstract Bearing thermal properties are necessary input parameters for thermal models of rotational spacecraft devices. Current understanding of the thermal properties of bearings in motion is limited. The development of technologies such as high-speed flywheels and momentum wheels could benefit from a better understanding of high-speed bearing thermal conductance. This report describes an experimental methodology developed at The Aerospace Corporation for measuring bearing thermal properties, including thermal conductance and heat generation. These properties characterize the effective heat transferred across the bearing and the heat generated due to ball-to-race friction. The approach started with the thermal energy equations that were derived in terms of measurable quantities. An experimental test rig was then developed to measure bearing thermal properties under controlled conditions. The control variables include speed, axial load, and thermal environment. Thermal conductance and heat generation data were obtained for rotational speeds up to 10,000 rpm for a 104-size steel ball bearing with a 20 mm bore and Nye Pennzane SHF2001 synthetic oil lubricant. Test data show that thermal conductance is sensitive to run-in conditions and speed. 1
Transcript of A Methodology for Measuring Thermal Properties of …

A Methodology for Measuring Thermal Properties of Bearings in Motion
Y. R. Takeuchi; [email protected]
J. T. Dickey; [email protected] S. M. Demsky; [email protected]
K. K. Lue; [email protected] J. J. Kirsch; [email protected] P. P. Frantz; [email protected]
The Aerospace Corporation
P.O. Box 92957 Los Angeles, CA 90009
Abstract Bearing thermal properties are necessary input parameters for thermal models of rotational spacecraft devices. Current understanding of the thermal properties of bearings in motion is limited. The development of technologies such as high-speed flywheels and momentum wheels could benefit from a better understanding of high-speed bearing thermal conductance. This report describes an experimental methodology developed at The Aerospace Corporation for measuring bearing thermal properties, including thermal conductance and heat generation. These properties characterize the effective heat transferred across the bearing and the heat generated due to ball-to-race friction. The approach started with the thermal energy equations that were derived in terms of measurable quantities. An experimental test rig was then developed to measure bearing thermal properties under controlled conditions. The control variables include speed, axial load, and thermal environment. Thermal conductance and heat generation data were obtained for rotational speeds up to 10,000 rpm for a 104-size steel ball bearing with a 20 mm bore and Nye Pennzane SHF2001 synthetic oil lubricant. Test data show that thermal conductance is sensitive to run-in conditions and speed.
1

List of Symbols Gb test bearing conductance Tin temperature of the inner race of the test bearing Tout temperature of the outer race of the test bearing Qin heat entering the inner race of the test bearing Qout heat exiting the outer race of the test bearing Qint total heat generated by friction at the ball to race interfaces of the test bearing Qint1 heat generated between the ball and inner race of the test bearing Qint2 heat generated between the ball and outer race of the test bearing ks thermal conductivity of the shaft As cross sectional area of the shaft Ls distance between the shaft temperature measurements Ts1 temperature measured by the pyrometer on the “inner heat flux meter” closest to
the heat source Ts2 temperature measured by the pyrometer on the “inner heat flux meter” furthest
from the heat source h thickness of the “outer heat flux meter” as shown in Figure 7 khfm conductivity of the “outer heat flux meter” r1 distance from the center of the “outer heat flux meter” to the inner thermocouple
as shown in Figure 7 r2 distance from the center of the “outer heat flux meter” to the outer thermocouple
as shown in Figure 7 Thfm1 temperature measured by the thermocouple mounted on the “outer heat flux
meter” closest to the test bearing Thfm2 temperature measured by the thermocouple mounted on the “outer heat flux
meter” furthest from the test bearing T bearing torque ω rotational speed of the bearing ∂Gb uncertainty in measurement of bearing thermal conductance ∂Qin uncertainty in measurement of heat entering the inner race of the bearing ∂Qout uncertainty in measurement of heat exiting the outer race of the bearing ∂Tin uncertainty in the temperature measurement of the inner bearing race ∂Tout uncertainty in the temperature measurement of the outer bearing race ∂Ts1 uncertainty in the lower shaft pyrometer temperature measurement ∂Ts2 uncertainty in the upper shaft pyrometer temperature measurement ∂Thfm1 uncertainty in the inner thermocouple temperature measurement ∂Thfm2 uncertainty in the outer thermocouple temperature measurement
2

1.0 Introduction In vacuum, bearings provide one of the major paths for heat transfer between the shaft and the housing. Thermal modeling of the rotational components in space requires a good knowledge of bearing thermal properties. However, bearing property information is presently lacking, resulting in difficulties in the prediction of temperatures of some spacecraft components. This is especially true for bearings running at high speeds. Possible consequences of excessive temperatures include poor mechanical performance, reduced life expectancy, lubricant break down, thermal run-away, and catastrophic failure. Current literature provides very limited thermal conductance information for static and low-speed bearings and none for high-speeds. Yovanovich [1,2] developed analytical models to calculated bearing thermal conductance, but his work was focused on static and non-lubricated bearings. The best previous example of experimental work on spacecraft bearings was the research performed by Stevens and Todd [3] who measured bearing thermal conductance and demonstrated that the property is dependent on speed. Stevens and Todd measured thermal conductance for speeds up to 2500 rpm using an experimental setup designed by Delil et al [4-5]. These groundbreaking works were performed during the 1960’s and 1970’s. However, demand on bearing performance has grown and thermal concerns have increased as systems reached higher speeds. Current momentum wheels and control moment gyroscopes typically operate at 6000-9000 rpm [6]. Future wheels, including energy storage flywheels, are envisioned to run at even higher speeds above 15,000 rpm. Even if magnetic levitation is used in some of these concepts, reliable mechanical bearings will be needed for repeated touchdown during development, testing, and emergency shutdown. Thermal modeling is important in the cost effective design and development of rotational components in space. In these systems, bearings provide the major thermal pathway from the shaft to the housing; thus, knowledge of bearing thermal properties is necessary for accurate model predictions. However, thermal conductance information is most notably in short supply. To address these concerns, a method to measure and assess the thermal properties of bearings in vacuum at high speeds was developed. The resulting test method involved an experimental setup that was capable of measuring thermal conductance and heat generation. Studies were conducted by controlling parameters such as axial load, bearing size, thermal environment, and speeds. This document describes the test requirements, conceptual design, and initial results. The test requirements were developed to specify the necessary measurements and control variables. The complex test rig designed to satisfy these requirements is described in detail in this report. Measurements of thermal conductance and heat generation of a 104-size steel ball bearing for speeds up to 10,000 rpm were taken with this experimental setup.
3
2.0 Test Rig Requirements The test rig requirements include: 1. Measure bulk effective thermal conductance of a ball bearing 2. Accommodate bearings of different sizes, namely 101-size, 104-size, and 204-size
ball bearings 3. Operate with various lubricant types and quantities 4. Apply constant axial loads from 9 to 29 lbs 5. Operate in a vacuum environment of 1x10⁻⁵ Torr 6. Vary rotational speeds
- minimum of 0 rpm - maximum of 20,000 rpm
The control variables are: 1. Speed of rotation of the central shaft 2. Test bearing axial load 3. Heat transferred through the test bearing The measured variables are: 1. Temperature of the inner race of the test bearing 2. Temperature of the outer race of the test bearing 3. Heat entering the inner race of the test bearing 4. Heat exiting the outer race of the test bearing Both heat measurements are made with hardware involving both temperature measurements and geometric information. The test was designed so that conductance could be calculated using measured quantities. The next section discusses the theory. 3.0 Testing Theory 3.1 Thermal Conductance Equation The thermal property equations, based on conditions as shown in Figure 1, assumes that the inner race is hotter than the outer race. This thermal condition is representative of momentum wheels, where the inner race is rotating, a motor generates heat (Qin), and the outer race is held stationary in a housing that acts as a heat sink. Figure 1 shows a cross section of a ball bearing and depicts the thermal conditions during operation in the experiment. Heat enters the inner race from the shaft. Heat is generated at the interface between the ball and inner and outer races due to friction. Heat then exits the outer race.
4

Figure 1. Schematic Diagram of a Ball Bearing Cross-Section and Heat Flow
Figure 2. Thermal Model of a Ball
Bearing
An electrical resistance analogy is shown in Figure 2. Conductance, Gb, represents the inverse of the heat transfer resistance, Rb, from inner to outer race. Based on this model, bearing conductance can be calculated from the following equation:
The total heat transferred through the bearing is equal to the inner race friction heat generation and the heat from the shaft. The heat generated due to the outer race friction transfers directly to the housing and does not pass through the ball. Radiation losses are assumed negligible. Equation 1 indicates that the temperature of the inner and outer race and two heat measurements are necessary for the determination of bearing thermal conductance. All variables are measurable, except for Qint1 (heat generated at the first interface). Based on conservation of energy, the heat generation can be described by: Qout = Qint1 + Qint2 + Qin or Qout = Qint + Qin Assuming equal heat generation at the inner and outer races, Equation 1 can be rewritten based on Qin and Qout as follows:
The relationship indicates that bearing thermal conductance is dependent on four variables: temperature of the inner and outer race, heat entering the inner race, and heat exiting the outer race. The heat flows are based on temperature differentials and geometric information. An uncertainty analysis was performed to assess how the individual uncertainty of each measured variable affects the combined uncertainty of the thermal conductance data. This analysis was then used to optimize the performance of the test rig for reasonable measurement errors.
outin
outinb TT
QQG−+
⋅=2
1
Inner race Ball
Outer race Tout Tin
Qout QinQin Qout Rb Qint2 Qint1
Qint1 Qint2
outin
inb TT
QQG−+
= 1int (1)
(2)
(3)
5

3.2 Uncertainty Analysis Bearing thermal conductance is an indirect quantity, meaning it is derived based on multiple direct measurements of temperatures and physical dimensions. Errors in each direct measurement “stack up” resulting in a total uncertainty in thermal conductance. The uncertainty analysis indicated which variables contributed most to the overall bearing conductance uncertainty providing a tool to optimize the test rig design. The analysis was also used to assess the accuracy of the final bearing thermal conductance measurement. The uncertainty analysis method presented by Moffat [7] emphasized that the errors in measured input data (x1, x2, … xn) stack up to affect the uncertainty in a calculated variable, R. For example if the desired quantity, R, is calculated from a set of measured input data, (x1, x2, … xn), then the combined uncertainty in R is expressed as:
2/122
22
2
11
...
∂⋅
∂∂
+
∂⋅
∂∂
+
∂⋅
∂∂
=∂ nn
xxRx
xRx
xRR (4)
The equation assumes that the relation between measured values, xi, to the calculated variable, R, and the uncertainty of each measurement is known. Furthermore, each measurement is considered to be independent and the uncertainty follows a Gaussian distribution. Using the method outlined in Equation 4, the uncertainty in the bearing conductance is:
2/12222
∂⋅
∂∂
+
∂⋅
∂∂
+
∂⋅
∂∂
+
∂⋅
∂∂
=∂ outout
bin
in
bout
out
bin
in
bb T
TG
TTG
QQG
QQG
G (5)
Solving Equation 5 to obtain the uncertainty in bearing conductance assuming equal heat generation between the inner and outer races:
( ) ( )
2/1
2
22
2
22
−
∂+∂+
+
∂+∂⋅=∂
outin
outin
outin
outinbb TT
TTQQ
QQGG (6)
The percent uncertainty is calculated as:
( ) ( )100/%
2/1
2
22
2
22
⋅
−
∂+∂+
+
∂+∂=∂
outin
outin
outin
outinbb TT
TTQQ
QQGG (7)
The equation shows that the uncertainty in the thermal conductance measurement depends on the absolute value of the operational heat and temperatures (Qin, Qout, Tin, and
6

Tout). It also depends on the uncertainty in the measured heat and temperatures (∂Qin, ∂Qout, ∂Tin, and ∂Tout). Errors in temperature measurement were limited by the accuracy of the sensors. But the heat measurements are themselves indirect and based on geometry and temperatures. An analysis was performed to carefully select dimensions that would minimize the uncertainty in the bearing thermal conductance measurement. A more detailed explanation for how heat and its uncertainty were determined will be presented in further detail in the discussion of the hardware. 4.0 System Overview Figure 3 is a cross sectional schematic diagram of the experimental test rig. The rig includes thermal (measurement and control), mechanical (rotational speed and axial load), and vacuum systems that simulate the space environment. The test rig was designed to collect data for the calculation of conductance and to control the necessary variables needed to conduct parametric studies. To isolate and ascertain its thermal environment, a single test bearing was fixed on the end of a shaft. The outer race of the test bearing was encased within an “outer heat flux meter”, a disk-like device similar to that developed by Delil [4, 5]. A lamp radiated thermal energy into the shaft resulting in a heat input, Qin, into the bearing. A cooling channel along the rim of the “outer heat flux meter” provided a thermal sink, absorbing the heat from the shaft and the frictional heat generated by the bearing. With this arrangement, the heat entering the inner race of the test bearing, Qin, was known by taking measurements of the heat transferred up the shaft using the “inner heat flux meter”. In addition, the heat leaving the outer race of the test bearing, Qout, was determined by measuring the heat transferred through the “outer heat flux meter”. Temperature measurements of the inner and outer race complete the information needed to determine the thermal conductance of the test bearing. The mechanical system consisted of the motor and the axial load subsystem. A motor-driven shaft maintains the test bearing’s inner race at a prescribed speed while the outer race is held stationary. Tests were conducted by holding the speed of the inner race constant for the length of time required to collect data at thermal equilibrium. To measure conductance as a function of speed, a series of these tests were conducted at multiple rotational speeds. The test bearing axial load was varied for the purposes of parametric studies. A free weight was used to apply a constant axial load during a given test that was independent of speed and temperature. Changing the weight varies the magnitude of the axial load.
7

Inner Heat Flux Meter Outer Heat Flux Meter
Weight
Heat Lamp
Support Bearing
Support Bearing
Motor
Test Bearing
Shaft
Figure 3. Schematic Cross Section of the Experimental Test Rig The test rig was designed to accommodate three bearing sizes commonly used for high-speed spacecraft applications (101-size, 104-size, and 204-size). These three bearings have two bore and three outer diameter sizes. The shaft was stepped at the end to accommodate the different bore sizes. Several “outer heat flux meters” were manufactured for the multiple bearing outer diameters. The advantage of this design was evident when the test bearing was switched to a different size. The same shaft can be used, and only the “outer heat flux meter” needs to be changed. The entire test rig is enclosed in a vacuum chamber to simulate the space environment. Together, these components comprise the design of the test rig used to measure conductance across a bearing in motion. In the following section, major thermal and mechanical systems are described in further detail. 4.1 Thermal System The thermal system, including controls and measurement hardware, constitutes the core of the experimental test rig.
8

4.1.1 Thermal Controls Figure 4 shows the thermal control subsystem in the test rig, including a heat source and sink. The thermal input into the system comes from a 600 Watt halogen lamp that provides radiation heating to the 304 stainless steel shaft. This was painted black to maximize its absorptance. Output of the lamp is controlled through a variable power supply. Not all the radiation energy is transferred to the test bearing. Some of the heat is lost to the housing surrounding the support bearings and motor, which are cooled. In addition, the support bearings and motor generate additional heat. For our purposes, the total heat input to the test bearing is not determined prior to the experiment. Instead it is held constant and carefully measured. Assuming no radiation losses, the heat entering the test bearing is equal to that transferring through the shaft above the top support bearing. The “inner heat flux meter” design is based on this concept. The heat sink is a cooling channel surrounding the rim of the “outer heat flux meter”. The temperature of the chiller fluid (50% glycol-50% water mixture) pumped through the cooling channel can be varied and maintained from -30°C to 50°C. 4.1.2 Measurement of Heat Entering the Inner Race, Qin The heat entering the inner race of the test bearing, Qin, was determined by taking two temperature measurements on the shaft as shown in Figure 4. The hardware, referred to as the “inner heat flux meter”, consists of two pyrometers with a focused 0.1 inch spot size taking temperature measurements a distance apart on a 1 inch diameter shaft. The assumption behind the operation of the “inner heat flux meter” was that the heat transferred through the portion of the shaft between the pyrometer measurements is one-dimensional and radiation effects were negligible. Above the top support bearing, the only thermal path is to the test bearing. Thus, the heat measured by the “inner heat flux meter” is Qin. Qin is determined from the following equation:
(8) Qin = Gs · (Ts1 –Ts2) where Ts1 and Ts2 are the temperature measurements taken on the shaft and the conductance between the two temperature measurements, Gs, is:
s
sss L
AkG ⋅= (9)
The shaft material was selected to be stainless steel to minimize the CTE mismatch with the bearing. The diameter of the shaft was relatively large (1 inch) to minimize the curvature over the pyrometer focal point.
9
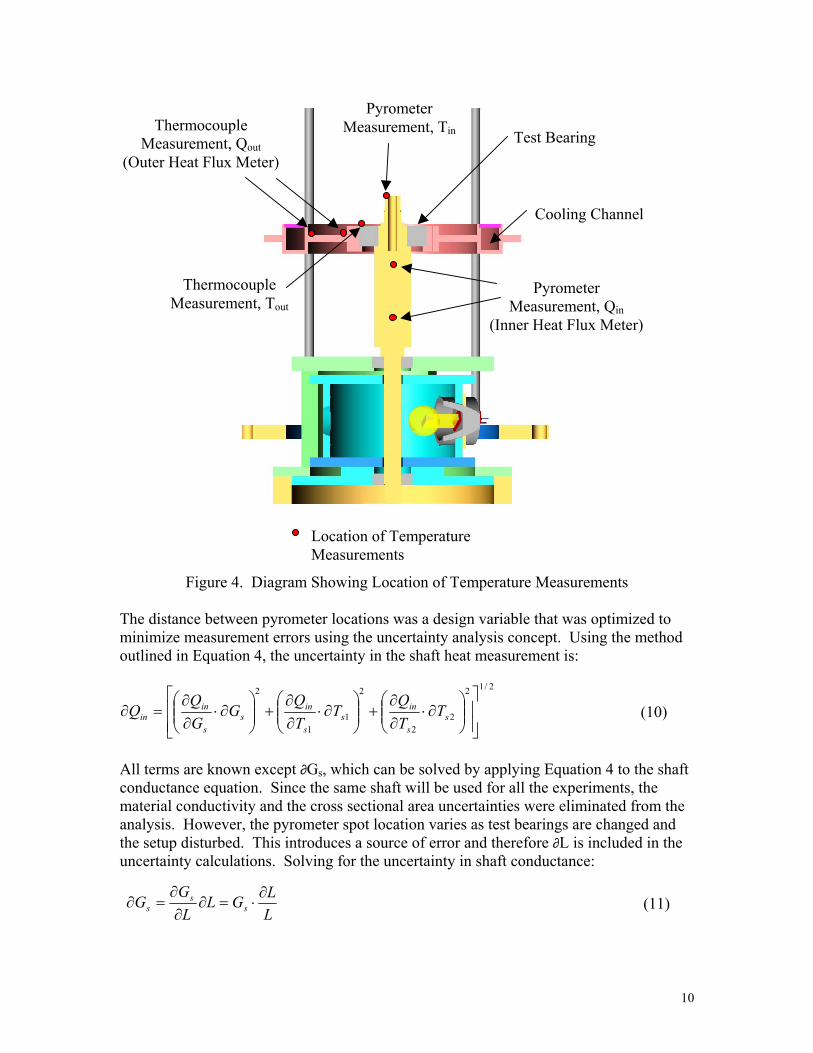
Thermocouple Measurement, Tout
Pyrometer Measurement, Qin
(Inner Heat Flux Meter)
Thermocouple Measurement, Qout
(Outer Heat Flux Meter)
Pyrometer Measurement, Tin
Cooling Channel
Test Bearing
Location of TemperatureMeasurements
Figure 4. Diagram Showing Location of Temperature Measurements The distance between pyrometer locations was a design variable that was optimized to minimize measurement errors using the uncertainty analysis concept. Using the method outlined in Equation 4, the uncertainty in the shaft heat measurement is:
2/12
22
2
11
2
∂⋅
∂∂
+
∂⋅
∂∂
+
∂⋅
∂∂
=∂ ss
ins
s
ins
s
inin T
TQ
TTQ
GGQ
Q (10)
All terms are known except ∂Gs, which can be solved by applying Equation 4 to the shaft conductance equation. Since the same shaft will be used for all the experiments, the material conductivity and the cross sectional area uncertainties were eliminated from the analysis. However, the pyrometer spot location varies as test bearings are changed and the setup disturbed. This introduces a source of error and therefore ∂L is included in the uncertainty calculations. Solving for the uncertainty in shaft conductance:
LLGL
LG
G ss
s∂
⋅=∂∂
∂=∂ (11)
10

Substituting Equation 11 into Equation 10, the uncertainty term for the heat entering the test bearing is:
(12)2/1
221
22
21
2
)(
−∂+∂
+
∂
⋅=∂ss
ssinin TT
TTLLQQ
The percent uncertainty is:
(13)100
)(/%
2/1
221
22
21
2
⋅
−∂+∂
+
∂
=∂ss
ssinin TT
TTLLQQ
From Equation 13, the uncertainty depends on the pyrometer spacing, L, the operational conditions, Ts1 and Ts2, and the measurement uncertainties including ∂L, ∂Ts1 and ∂Ts2. The temperature measurement uncertainties, ∂Ts1 and ∂Ts2, were limited to the available instrumentation, which in this case were pyrometers; however, the pyrometer spacing was a design parameter. Figure 5 shows the results of a parametric study on the effect of pyrometer separation distance on “inner heat flux meter” measurement errors. Several different operational conditions were considered (Qin). With greater pyrometer distance, the measurement accuracy improved. However, the gain decreased with increasing length, and beyond 2 inches became small. Thus, the original plan was to have a separation distance of 2 inches. However, due to pyrometer and housing geometry constraints, a maximum distance of 1.7 inches was established.
0
5
10
15
20
25
30
0.0 1.0 2.0 3.0 4.0
L (in)
Qin=0.5WQin=1WQin=2WQin=3W
%δQ
in/Q
in
Figure 5. Effect of Pyrometer Separation Distance on “Inner Heat Flux Meter “ Measurement Error
11
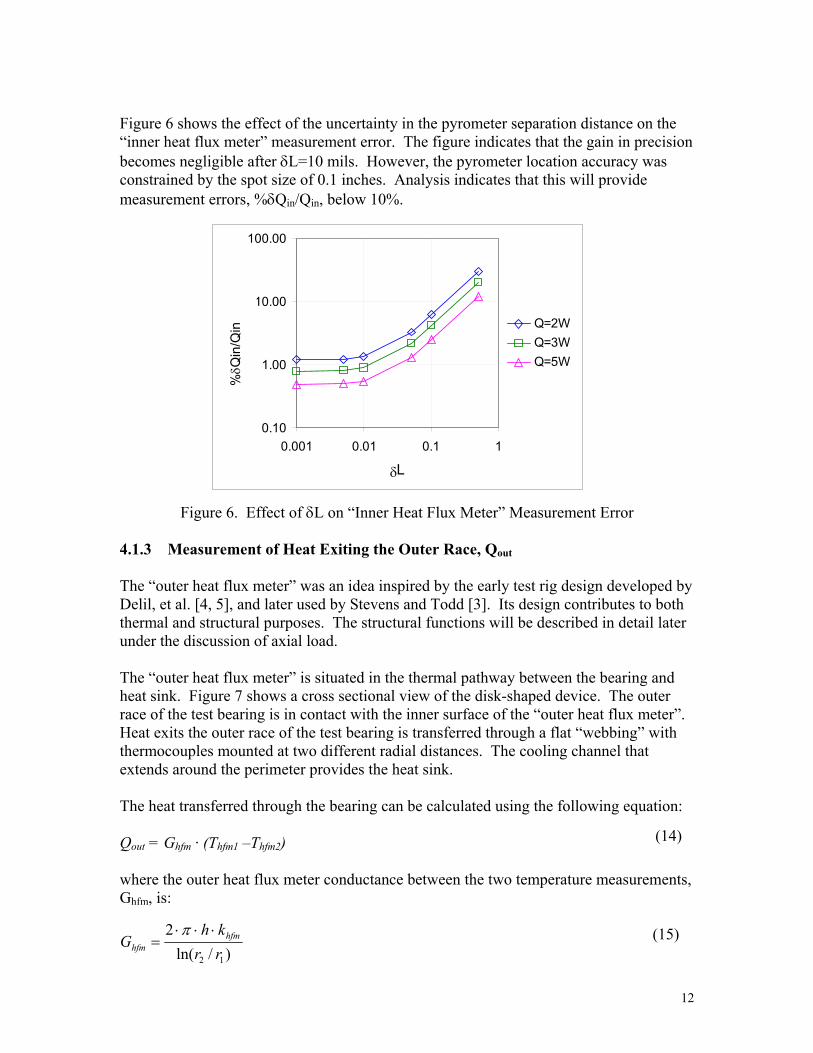
Figure 6 shows the effect of the uncertainty in the pyrometer separation distance on the “inner heat flux meter” measurement error. The figure indicates that the gain in precision becomes negligible after δL=10 mils. However, the pyrometer location accuracy was constrained by the spot size of 0.1 inches. Analysis indicates that this will provide measurement errors, %δQin/Qin, below 10%.
0.10
1.00
10.00
100.00
0.001 0.01 0.1 1
δL
Q=2WQ=3WQ=5W
%δQ
in/Q
in
Figure 6. Effect of δL on “Inner Heat Flux Meter” Measurement Error 4.1.3 Measurement of Heat Exiting the Outer Race, Qout The “outer heat flux meter” was an idea inspired by the early test rig design developed by Delil, et al. [4, 5], and later used by Stevens and Todd [3]. Its design contributes to both thermal and structural purposes. The structural functions will be described in detail later under the discussion of axial load. The “outer heat flux meter” is situated in the thermal pathway between the bearing and heat sink. Figure 7 shows a cross sectional view of the disk-shaped device. The outer race of the test bearing is in contact with the inner surface of the “outer heat flux meter”. Heat exits the outer race of the test bearing is transferred through a flat “webbing” with thermocouples mounted at two different radial distances. The cooling channel that extends around the perimeter provides the heat sink. The heat transferred through the bearing can be calculated using the following equation:
(14)Qout = Ghfm · (Thfm1 –Thfm2) where the outer heat flux meter conductance between the two temperature measurements, Ghfm, is:
(15))/ln(
2
12 rrkh
G hfmhfm
⋅⋅⋅=
π
12

The material of the “outer heat flux meter” itself was chosen to be a 304 stainless steel to minimize the mismatch of thermal coefficient of expansion between the part and bearing race.
Cooling channel
r2r1
0.1
0.1
Bearing
Thermocouples
Thfm2 Thfm1
Cooling channel
r2r1
0.1
0.1
Bearing
Thermocouples
Thfm2 Thfm1
Figure 7. Cross Sectional View of the “Outer Heat Flux Meter” Applying the uncertainty analysis to the “outer heat flux meter”:
2/12
22
2
11
2
∂⋅
∂∂
+
∂⋅
∂∂
+
∂⋅
∂∂
=∂ hh
outh
h
outhfm
hfm
outout T
TQ
TTQ
GGQ
Q(16)
Solving Equation 16:
2/1
221
22
21
2
)(
−∂+∂
+
∂⋅=∂
hh
hh
hfm
hfmoutout TT
TTGG
QQ (17)
Equation 17 indicates that the uncertainty in the “outer heat flux meter” conductance term is needed. The conductance depends on the conductivity and geometry of the “outer heat flux meter”. As with the shaft, the material was chosen to be steel to minimize the CTE mismatch with the bearing. The webbing thickness and thermocouple locations were design variables. Applying the uncertainty analysis to the outer heat flux meter conductance equation:
2/122
22
2
11
∂⋅
∂
∂+
∂⋅
∂
∂+
∂⋅
∂
∂=∂ h
hG
rr
Gr
rG
G hfmhfmhfmhfm
(18)
Solving Equation 18 and substituting into Equation 17, the percent uncertainty in the outer heat transfer calculation is:
13

( ) ( )
2/1
221
22
21
2
2
1
212
221
212
)(ln
/%
−∂+∂
+
∂
+
⋅⋅
∂⋅+∂⋅=∂
hh
hhoutout TT
TThh
rr
rr
rrrrQQ (19)
Figure 8 shows the results of a parametric study on the effect of thermocouple separation distance on “outer heat flux meter” measurement errors. Several different operational conditions were studied (Qout). As the considered thermocouple radial distances were positioned further apart, the measurement accuracy improved. However, the gain decreased with increasing distances, and became negligible beyond 1 inch. Thus, the “outer heat flux meter” was designed to have a thermocouple separation distance of 1 inch.
0
10
20
30
40
50
60
0.0 1.0 2.0 3.0
∆r (in)
Q=2WQ=3WQ=5W
%δQ
out/Q
out
Figure 8. Effect of Thermocouple Separation Distance on “Outer Heat Flux Meter” Measurement Error
Figure 9 shows that there is a linear relationship between the “outer heat flux meter” thickness, h, and measurement uncertainty for all operational conditions considered. A decrease in the thickness minimized the measurement uncertainty due to a greater temperature differential that occurs with a thinner cross section. A thickness of 0.2 inches limits the measurement error to 10% and less. 4.1.4 Bearing Race Temperature Measurement The inner and outer race temperatures complete the necessary set of thermal measurements to calculate conductance. The temperature of the outer race is measured by a thermocouple and that of the inner race is measured with a pyrometer. For the pyrometer, the inner race was not exposed enough for direct measurement. As a result, the shaft temperature was measured and assumed to be approximately equal to that of the
14

inner race, based on an idealized adiabatic boundary condition of the protruding shaft (Figure 4).
0.0
4.0
8.0
12.0
16.0
20.0
0.00 0.10 0.20 0.30 0.40
h (in)
Q=2WQ=3WQ=5WQ=10W
%δQ
out/Q
out
Figure 9. Effect of “Outer Heat Flux Meter” Thickness on Measurement Error 4.2 Mechanical System The mechanical system consists of the vacuum chamber, as well as the speed control and axial load subsystem. 4.2.1 Vacuum Chamber The entire test rig including the motor was enclosed in the vacuum chamber. A pressure of 1x10⁻⁵ Torr was maintained during testing. 4.2.2 Speed Control Subsystem The speed control subsystem consists of a motor, support bearings, and a shaft. The motor drives the shaft and bearing inner race, while the outer race of the test and support bearing is held stationary by the “outer heat flux meter” and housing, respectively. The two 101-size high-speed support bearings are in a double back (DB) configuration with a 14 lb axial spring force. The entire test rig, including the motor, is encased in a vacuum environment. However, the vacuum environment presents numerous challenges to the operation of a motor, including thermal and electrical concerns. The spindle does not have the convection cooling present in an atmospheric environment; consequently, excessive temperatures can be a concern. A cooling jacket was placed around the motor to maintain even
15
temperatures. To mitigate the risk of electrical arcing, a motor designed to operate in a vacuum environment was carefully selected to meet the test requirements. 4.2.3 Axial Load Subsystem A free weight maintains a constant axial load that is independent of speed and temperature. The axial load subsystem includes a free weight, which sits on top of a device that transfers the load to the outer rim of the “outer heat flux meter”. The outer rim extends beyond the cooling channel, preventing any parasitic heat loss or gain due to contact between the test bearing and cooling channel. The vertical load on the “outer heat flux meter” is resisted only by the test bearing itself. Thus, the total axial load on the test bearing is the sum of the free weight and “outer heat flux meter”. Changing the free weight changes the bearing axial load. A hole at the center of the dead weight allows a pyrometer access to the inner race of the test bearing.
16
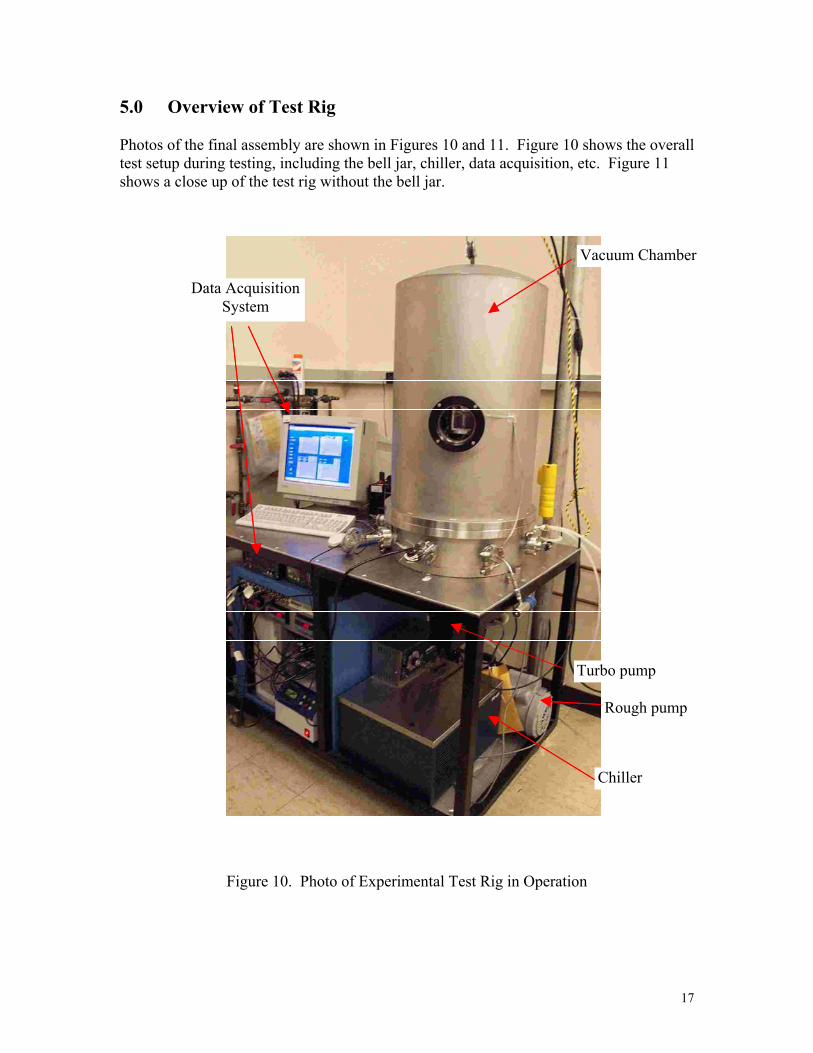
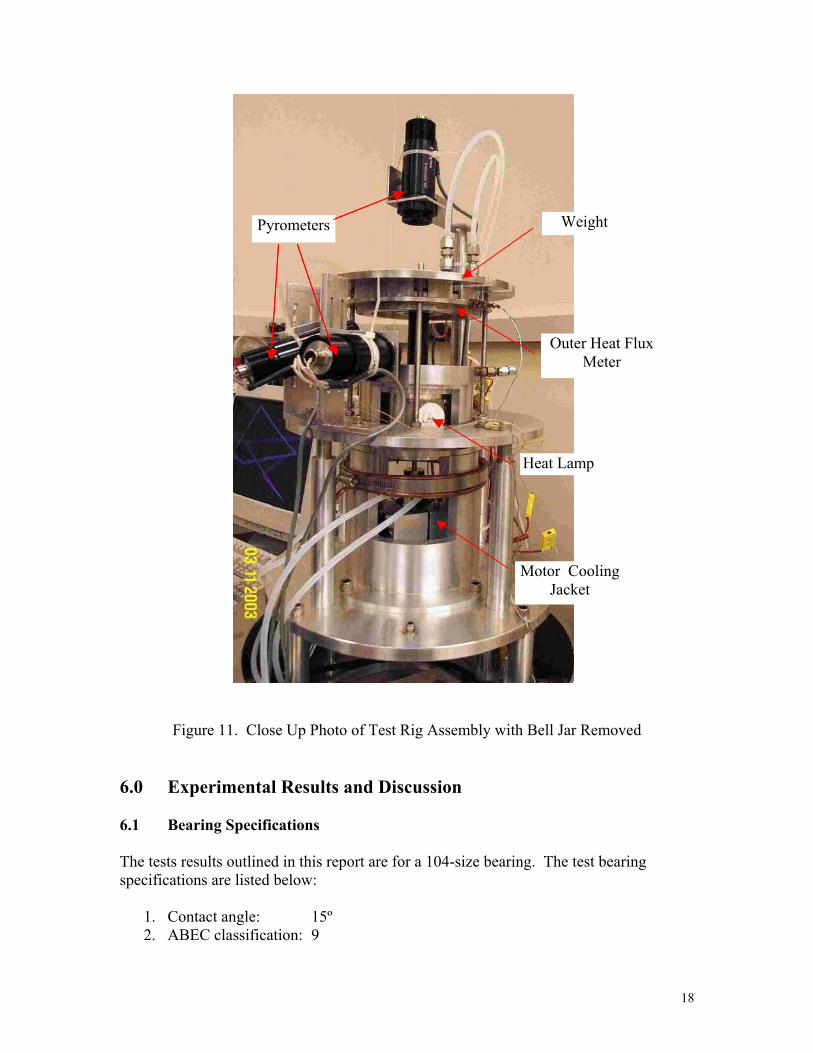
5.0 Overview of Test Rig Photos of the final assembly are shown in Figures 10 and 11. Figure 10 shows the overall test setup during testing, including the bell jar, chiller, data acquisition, etc. Figure 11 shows a close up of the test rig without the bell jar.
Rough pump
Turbo pump
Chiller
Vacuum Chamber
Data Acquisition System
Figure 10. Photo of Experimental Test Rig in Operation
17
Pyrometers Weight
Motor Cooling Jacket
Heat Lamp
Outer Heat Flux Meter
Figure 11. Close Up Photo of Test Rig Assembly with Bell Jar Removed 6.0 Experimental Results and Discussion 6.1 Bearing Specifications The tests results outlined in this report are for a 104-size bearing. The test bearing specifications are listed below:
1. Contact angle: 15º 2. ABEC classification: 9
18

3. Ball diameters: 0.25 inch 4. Bore diameter: 20 mm 5. O.D.: 42 mm 6. Number of balls: 11 7. Race material: 52100 Steel 8. Ball material: 52100 Steel 9. Cage material: Cotton phenolic 10. Cage type: H type, non-separable 11. Cage land: Outer land
6.2 Lubricant The method used to prepare the bearing is straightforward, but the precise amount of oil was not clearly established. The test bearing was soaked in Pennzane for at least a month to ensure that the cage was saturated. The bearing was then allowed to drain and centrifuged until no further weight change could be detected. The bearing had an adequate amount of oil to ensure that it would run smoothly during the shakedown testing of the rig, neither failing due to starvation nor dripping with oil to generate torque instabilities. The thermal conductance and heat generation data included in this report reflect initial test results. The test bearing was not new, but had previously been used to shakedown the test rig. Reports will be published at a later time on additional tests of bearings that have not been previously run-in and where lubricant quantity was better known. 6.3 Test Conditions All of the tests in this report were conducted under a constant axial load of 9 lb. Measurement of conductance and heat generation was performed at a constant speed and at thermal equilibrium. A series of these tests were performed to evaluate the effect of rotational speed on bearing thermal conductance in the range of 0 to 10,000 rpm. 6.4 Bearing Thermal Conductance The effect of speed on bearing thermal conductance is shown in Figure 12. Five sets of tests were conducted. The overall trend shows that there is an increase in conductance with an increase in speed, except at 0 rpm. For instance, the first set of tests indicated a drop in thermal conductance from 0 to 3000 rpm, followed by a rise in thermal conductance with speed. Figure 12 also shows that, with each subsequent set of tests, the conductance at 0 rpm dropped, an attribute associated with a run-in effect, where excess lubricant was being displaced from the ball path. Between the 4th and 5th runs, the change was insignificant, suggesting that the bearing had reached a fully run-in state. At the fully run-in condition, the thermal conductance increased from 0.092 W/ºC to 0.18 W/ºC. The calculated uncertainty bounds, shown in the figure, range from ±0.008 W/ºC to ±0.011 W/ºC.
19

The influence of run-in on thermal conductance was distinctly different at static vs. dynamic conditions. In all 5 sets of experiments, run-in affected the conductance at 0 rpm. By contrast, under dynamic conditions of 3000 rpm and above, the run-in state did not affect the conductance. This difference indicates that the mode of heat transfer is different between static and dynamic conditions.
0.06
0.08
0.10
0.12
0.14
0.16
0.18
0.20
0 2000 4000 6000 8000 10000
Speed (RPM)
Con
duct
ance
(W/K
)
First runSecond runThird runFourth runFifth run
Figure 12. Effect of Speed and Run-In on Bearing Thermal Conductance In the static state, the heat transfer mode is conduction through the Hertzian contact area and lubricant meniscus. As the bearing becomes run-in, excess oil is pushed out of the ball path way and the meniscus between the ball and race becomes smaller, decreasing thermal conductance when the bearing returns to its static state. Under dynamic conditions, the heat transfer mode is more complex. It is hypothesized that the heat transfer mode consists mostly of mass transport of the lubricant from the inner to outer race, and that the heat is absorbed into the ball and lubricant. The dominance of the mass transport effect implies that the lubricant film thickness around the ball dominates thermal behavior rather than the meniscus size (Figure 13).
Ball lubricant film thickness influences dynamic conditions
Lubricant Meniscus
Footprint governs conductance at 0 RPM
Figure 13. Lubricant on Bearing Ball
20

In this case, it seems that the ball lubricant film thickness is not significantly affected by the run-in condition. It is important to keep in mind that this bearing had been previously run-in and lubricant film thickness was probably already established by surface tension properties. With a bearing that has never been operated, the effect of run-in on conductance of a dynamic bearing will be different. This will be discussed in more detail in a later report. As the speed increases, the capacity to transport lubricant and energy from the inner to outer race increases. This is evident in the data, which show thermal conductance increasing with increasing speeds at the fully run-in condition. This increase is linear from 0 to 6000 rpm, but the slope changes slightly from 6000 to 10,000 rpm. The reason for this change is not yet known. 6.5 Bearing Heat Generation Friction between the ball and race interfaces during operation generates heat. The measured heat generation is shown in Figure 14. The figure shows that each set of experiments result in a decrease in heat generation for any given speed until fully run-in conditions are reached by the 4th and 5th set. It is expected that a run-in condition would result in a decrease in torque.
0.00
0.50
1.00
1.50
2.00
2.50
3.00
0 2000 4000 6000 8000 10000
Speed (RPM)
Tota
l Hea
t Gen
erat
ion
(W)
First runSecond runThird runFourth runFifth run
Figure 14. Effect of Speed and Run-In on Bearing Heat Generation
Measurements also indicate that for the bearing and the given test conditions, the heat generation increases at higher speeds. However, the first set of experiments shows that the relation is highly non-linear, with a decline in slope with increasing speeds. This is due to two competing effects. The first is an increase in energy with speed, which is expected to increase heat generation. The second is a run-in effect, where excess
21
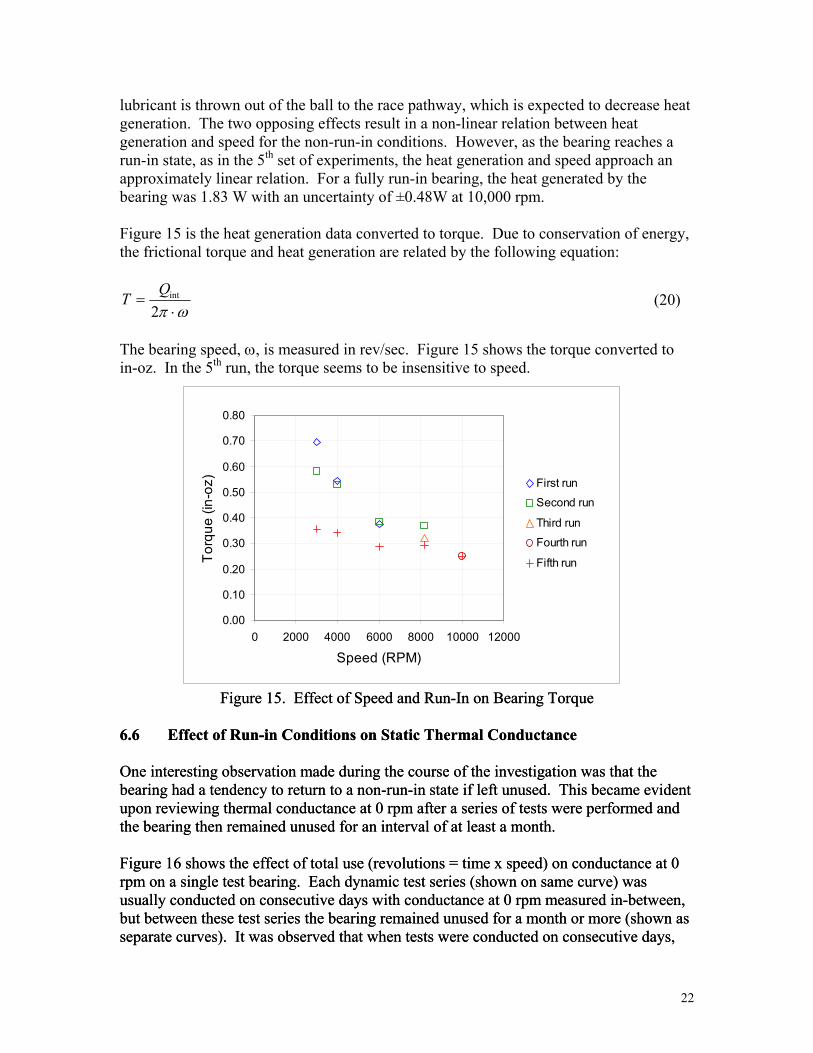
lubricant is thrown out of the ball to the race pathway, which is expected to decrease heat generation. The two opposing effects result in a non-linear relation between heat generation and speed for the non-run-in conditions. However, as the bearing reaches a run-in state, as in the 5th set of experiments, the heat generation and speed approach an approximately linear relation. For a fully run-in bearing, the heat generated by the bearing was 1.83 W with an uncertainty of ±0.48W at 10,000 rpm. Figure 15 is the heat generation data converted to torque. Due to conservation of energy, the frictional torque and heat generation are related by the following equation:
ωπ ⋅=
2intQT (20)
The bearing speed, ω, is measured in rev/sec. Figure 15 shows the torque converted to in-oz. In the 5th run, the torque seems to be insensitive to speed.
0.00
0.10
0.20
0.30
0.40
0.50
0.60
0.70
0.80
0 2000 4000 6000 8000 10000 12000
Speed (RPM)
Torq
ue (i
n-oz
) First run
Second run
Third run
Fourth run
Fifth run
Figure 15. Effect of Speed and Run-In on Bearing Torque Figure 15. Effect of Speed and Run-In on Bearing Torque 6.6 Effect of Run-in Conditions on Static Thermal Conductance 6.6 Effect of Run-in Conditions on Static Thermal Conductance One interesting observation made during the course of the investigation was that the bearing had a tendency to return to a non-run-in state if left unused. This became evident upon reviewing thermal conductance at 0 rpm after a series of tests were performed and the bearing then remained unused for an interval of at least a month.
One interesting observation made during the course of the investigation was that the bearing had a tendency to return to a non-run-in state if left unused. This became evident upon reviewing thermal conductance at 0 rpm after a series of tests were performed and the bearing then remained unused for an interval of at least a month. Figure 16 shows the effect of total use (revolutions = time x speed) on conductance at 0 rpm on a single test bearing. Each dynamic test series (shown on same curve) was usually conducted on consecutive days with conductance at 0 rpm measured in-between, but between these test series the bearing remained unused for a month or more (shown as separate curves). It was observed that when tests were conducted on consecutive days,
Figure 16 shows the effect of total use (revolutions = time x speed) on conductance at 0 rpm on a single test bearing. Each dynamic test series (shown on same curve) was usually conducted on consecutive days with conductance at 0 rpm measured in-between, but between these test series the bearing remained unused for a month or more (shown as separate curves). It was observed that when tests were conducted on consecutive days,
22
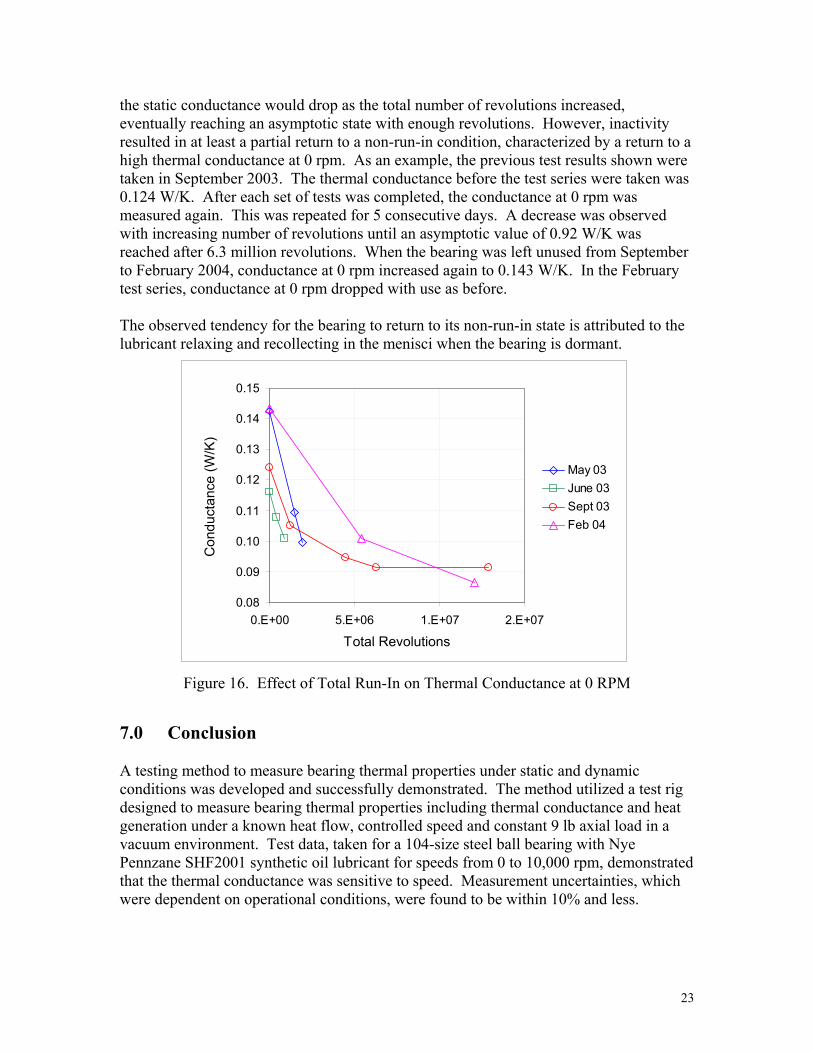
the static conductance would drop as the total number of revolutions increased, eventually reaching an asymptotic state with enough revolutions. However, inactivity resulted in at least a partial return to a non-run-in condition, characterized by a return to a high thermal conductance at 0 rpm. As an example, the previous test results shown were taken in September 2003. The thermal conductance before the test series were taken was 0.124 W/K. After each set of tests was completed, the conductance at 0 rpm was measured again. This was repeated for 5 consecutive days. A decrease was observed with increasing number of revolutions until an asymptotic value of 0.92 W/K was reached after 6.3 million revolutions. When the bearing was left unused from September to February 2004, conductance at 0 rpm increased again to 0.143 W/K. In the February test series, conductance at 0 rpm dropped with use as before. The observed tendency for the bearing to return to its non-run-in state is attributed to the lubricant relaxing and recollecting in the menisci when the bearing is dormant.
0.08
0.09
0.10
0.11
0.12
0.13
0.14
0.15
0.E+00 5.E+06 1.E+07 2.E+07
Total Revolutions
Con
duct
ance
(W/K
)
May 03June 03Sept 03Feb 04
Figure 16. Effect of Total Run-In on Thermal Conductance at 0 RPM 7.0 Conclusion A testing method to measure bearing thermal properties under static and dynamic conditions was developed and successfully demonstrated. The method utilized a test rig designed to measure bearing thermal properties including thermal conductance and heat generation under a known heat flow, controlled speed and constant 9 lb axial load in a vacuum environment. Test data, taken for a 104-size steel ball bearing with Nye Pennzane SHF2001 synthetic oil lubricant for speeds from 0 to 10,000 rpm, demonstrated that the thermal conductance was sensitive to speed. Measurement uncertainties, which were dependent on operational conditions, were found to be within 10% and less.
23
The experiment yielded interesting results. Tests showed that thermal conductance increased with increasing speeds for a fully run-in bearing. Thermal conductance ranged from 0.092 W/ºC at 0 rpm to 0.18 W/ºC at 10,000 rpm with an average uncertainty ±0.009 W/ºC for a fully run-in bearing. However, this trend was sensitive to the run-in state of the bearing. Specifically, it was found that thermal conductance for a non-run-in bearing was high at 0 rpm compared with that at some speeds but decreased with use until reaching a minimum when fully run-in conditions were established. At that point, the static conductance no longer diminished with increased bearing use. Conductance at elevated speeds behaved quite differently. For the bearing tested, the dynamic conductance did not change with use. The contrast in thermal behavior between static and dynamic conditions was attributed to differences in heat transfer modes. In the static state, conduction through the ball and lubricant meniscus determined the bearings thermal characteristics, while the mass transport of the lubricant dominated the heat transfer mode under dynamic conditions. The influence of speed on heat generation was found to be highly non-linear at non-run-in conditions, but became approximately linear at a fully run-in state. Finally it was observed that when the bearing was left unused in excess of 30 days, the Pennzane oil lubricated bearing had a tendency to return to a partial non-run-in state. The testing method developed in this report lays the groundwork for future activities in the investigation of heat transfer characteristics of spacecraft bearings. The test rig is also capable of measuring the influence of rotational speed and axial load on a 101-size and 204-size bearing. More extensive parametric studies can be performed with this setup and will be presented in later reports.
24

25
References
1. Yovanovich, M. M., “Analytical and Experimental Investigation on the Thermal Resistance of Angular Contact Instrument Bearings”, Instrumentation Laboratory, E-2215, Massachusetts Institute of Technology, Cambridge, Massachusetts, Dec. 1967.
2. Yovanovich, M. M., “Thermal Constriction Resistance Between Contacting Metallic Paraboloids: Application to Instrument Bearings”, Proceedings of Heat Transfer and Spacecraft Thermal Control, M.I.T , Cambridge, MA, 1971, pp. 337-58.
3. K. T. Stevens, and M. J. Todd, “Thermal Conductance Across Ball Bearings in Vacuum”, National Centre of Tribology, Risley (England), Report Number: ESA-ESTL-25, Feb 77, 51p.
4. A. A. M. Delil, J. F. Heemskerk, and J. P. B. Vreeburg, “Design Report on the ESRO Test Rig to Measure the Thermal Conductance and Friction Torque of Rotating Bearings in Vacuum”, Report Number: NLR-TR-74069-U, May 74, 90p, NTIS Accession Number: N75-20743/1/XAB.
5. J. F. Heemskerk, A. A. M. Delil, J. P. B. Vreeburg,, “A Test Rig to Measure the Thermal Conductance and Friction Torque of Bearings in Vacuum”, European Space Tribology Symposium, Frascati, Italy, 1975, 18p, NTIS Accession Number: N75-24001/0/XAB.
6. P. D. Fleischauer and M. R. Hilton, "Assessment of the Tribological Requirements of Advanced Spacecraft Mechanisms", Mat. Res. Soc. Symp. Proc., 140 (1989) pp. 9-20.
7. R. J. Moffat, “Using Uncertainty Analysis in the Planning of an Experiment”, Journal of Fluid Engineering, Vol. 107, June 1985, pp. 173-177.
Acknowledgements
This work was funded by The Aerospace Corporation Independent Research and Development (IRAD) program. The authors would like to thank our management, in particular, Dr. Michael R. Hilton and Dr. Stephen V. Didziulis. Their outstanding support made this research possible.