A Method for Using Global MODIS VCF Data to Evaluate Land ... · This Dissertation...
72
King’s College London, MSc Dissertation: Global Environmental Change Henry Brittlebank KING’S COLLEGE LONDON A Method for Using Global MODIS VCF Data to Evaluate Land-Cover and Land-Use Change in Protected Areas Throughout the Western Ghats, India. Henry Brittlebank 8/30/2013 This dissertation is submitted as part of a MSc degree in Global Environmental Change at King’s College London.
Transcript of A Method for Using Global MODIS VCF Data to Evaluate Land ... · This Dissertation...

King’s College London, MSc Dissertation: Global Environmental Change Henry Brittlebank
KING’S COLLEGE LONDON
A Method for Using Global MODIS VCF Data to Evaluate Land-Cover and Land-Use Change in
Protected Areas Throughout the Western Ghats, India.
Henry Brittlebank
8/30/2013
This dissertation is submitted as part of a MSc degree in Global Environmental Change at King’s College London.
King’s College London, MSc Dissertation: Global Environmental Change Henry Brittlebank
KING’S COLLEGE LONDON
UNIVERSITY OF LONDON
DEPARTMENT OF GEOGRAPHY
MA/MSc DISSERTATION
I, ………Henry Brittlebank…………………
hereby declare (a) that this Dissertation is my own original
work and that all source material used is acknowledged
therein; (b) that it has been specially prepared for a degree of
the University of London; and (c) that it does not contain any
material that has been or will be submitted to the Examiners of
this or any other university, or any material that has been or
will be submitted for any other examination.
This Dissertation ………………11,888………………words.
Signed: …………………………………………...…………….
Date: …………….30/08/13………………………………….

King’s College London, MSc Dissertation: Global Environmental Change Henry Brittlebank
Abstract
Post-classification analysis of Landsat data provides evidence of deforestation, with increases in
SWG and Agriculture at the expense of Dense Forest land cover in Mudumalai NP and increases of
Degraded Forest cover in Silent Valley NP, 1973 – 2012. Landscape characterisation of Mudumalai
and Silent Valley NP was then achieved using Global MODIS VCF data aided by high-resolution
Landsat classifications, with classification accuracies of 76.47% and 84.62% respectively. LUCC
detection between 2000 - 2008 using MODIS VCF data also showed trends of deforestation with
increases of SWG, Agriculture and Degraded Forest cover in the National Parks. The new
methodology using Global MODIS VCF data was then applied to map land-cover of 27 PAs in the WG
biodiversity hotspot. LUCC detection from VCF data provides evidence of afforestation throughout
PAs in the WG of 768,351,070.60 m2 and PAs in the NBR of 208,699,048.03 m2 with decreases in
SWG and Agriculture land-cover.
Acknowledgments I would like thank my dissertation supervisor and course tutor Nick Drake for all his support and
advice on this research project and during my Masters at King’s College London. I would also like to
thank the Geography department at King’s for their assistance over the year.
Finally I would like to thank my parents, friends and GH for all their support throughout, I could not
have done it without them.
King’s College London, MSc Dissertation: Global Environmental Change Henry Brittlebank
List of Abbreviations and Acronyms
WG - Western Ghats
NBR – Nilgiri Biosphere Reserve
PA – Protected Area
NP – National park
WS – Wildlife Sanctuary
TR – Tiger Reserve
RF – Reserve Forest
FR – Forest Range
LUCC – Land Use and Cover Change
SWG – Sparsely Wooded Grassland
NWFP – Non-Wood Forest Product
GLCD – Global Land Cover Data
IUCN – International Union for Conservation of Nature
mm – Millimetres
m – Metres
km – Kilometres
µm – Micrometre
C – Celsius
DOS – Dark Object Subtraction
Lλ – Spectral Radiance
λ - Wavelength
Key Words
Land-Use, Afforestation, Protected Area, Western Ghats, MODIS VCF
King’s College London, MSc Dissertation: Global Environmental Change Henry Brittlebank
Table of Contents 1. Introduction .................................................................................................................................... 1
2. Literature Review ........................................................................................................................... 2
2.1. Global Land Use and Land Cover Change ............................................................................... 2
2.2. Advances in Remote Sensing of Land Use and Land Cover Change ....................................... 5
2.3. Land Use and Land Cover Change: A Case Study of India ....................................................... 7
2.4. Land Use and Land Cover Change in the Western Ghats, India ............................................. 9
2.5. LUCC in Protected Areas of the Western Ghats and the Nilgiri Biosphere Reserve. ............ 11 2.6 Research Questions and Hypotheses ………………………………………………………………………………14
3. Study Area .................................................................................................................................... 14
3.1. Western Ghats and the Nilgiri Biosphere Reserve ................................................................ 14
3.2. Silent Valley National Park .................................................................................................... 15
3.3. Mudumalai National Park and Wildlife Sanctuary ................................................................ 16
4. Data ............................................................................................................................................... 19
4.1. Landsat Data ......................................................................................................................... 19
4.1.1. Pre-processing and Scene Selection ............................................................................. 20
4.1.2. Reflectance Values from Digital Numbers .................................................................... 20
4.1.3. Data Concatenation and Layer Stacking ....................................................................... 21
4.1.4. Geo-registration of Landsat MSS Data ....................................................................... 21
4.1.5. Atmospheric Correction ................................................................................................ 22
4.1.6. Landsat 7 ETM+ Scan-Line Correction Failure and Gap-Filling ............................... 23
4.2. Classification ........................................................................................................................ 23
4.2.1. National Park Boundaries and Image Masking ......................................................... 23
4.2.2. Regions of Interest and Transform Divergence ........................................................ 24
4.2.3. Classification and Post Classification ......................................................................... 25
4.2.4. Accuracy Assessment .................................................................................................. 25
4.3. MODIS Vegetation Continuous Field (VCF) Data .............................................................. 26
4.3.1. Generating regional MODIS VCF 250m Land-Cover Maps ....................................... 27
4.3.2. VCF Land-Cover Maps Across the Western Ghats..................................................... 28
15 15

King’s College London, MSc Dissertation: Global Environmental Change Henry Brittlebank
5. Results ........................................................................................................................................... 29
5.1. Landsat 1973 – 2012Mudumalai National Park Maximum Liklehood Classified Data ......... 29
5.2. Landsat 1973 – 2012 Silent Valley National Park Maximum Liklehood Classified Data ....... 33
5.3. Accuracy Assesment – Confusion Matricies of Landsat MLC Images ................................... 36
5.4 MODIS VCF Classified Data of Mudumalai National Park, 2000 - 2008 ................................ 37
5.5. MODIS VCF Classified Data of Silent Valley National Park, 2000 – 2008. ............................. 38
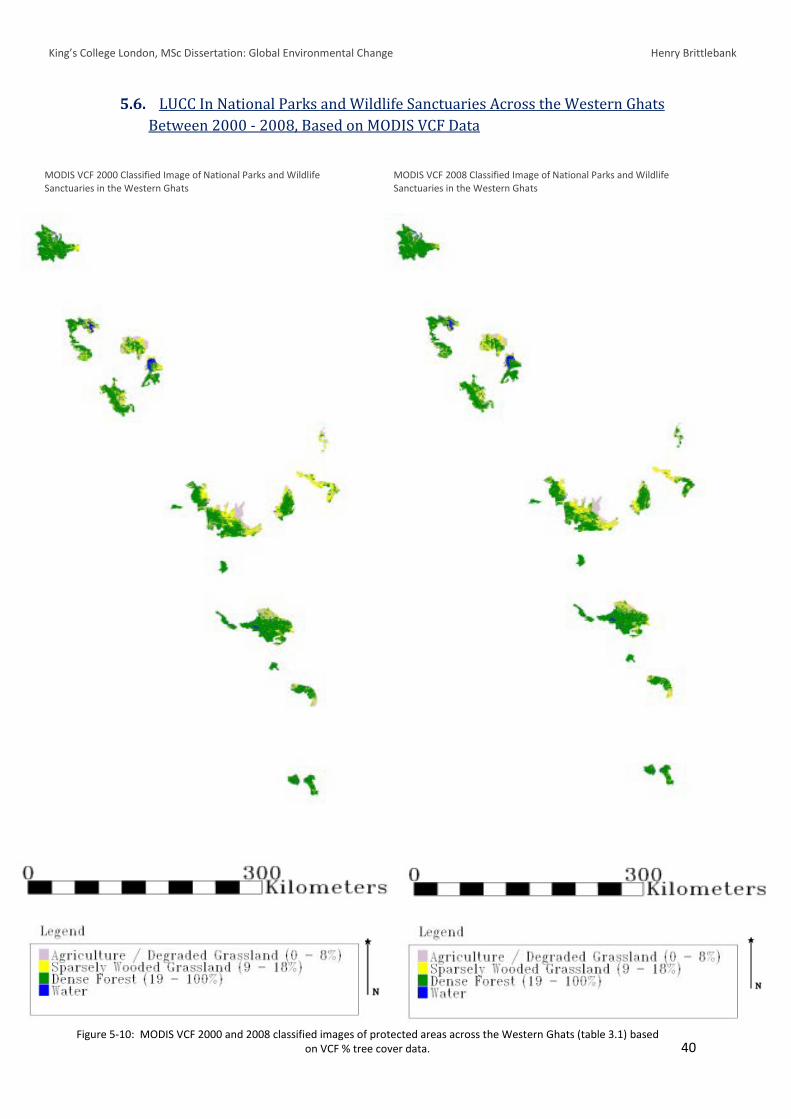
5.6. LUCC In National Parks and Wildlife Sanctuaries Across the Western Ghats Between 2000 - 2008, Based on MODIS VCF Data .................................................................................................... 40
5.7. LUCC In National Parks and Wildlife Sanctuaries Across the Nilgiri Biosphere Reserve Between 2000 - 2008, Based on MODIS VCF Data ........................................................................... 43
5.8. Accuracy Assesment – Confusion Matricies of MODIS VCF MLC Images ............................. 45
6. Discussion ..................................................................................................................................... 46
6.1. LUCC in Mudumalai National Park ........................................................................................ 46
6.2. LUCC in Silent Valley National Park ....................................................................................... 47
6.3. LUCC in the Buffer Zones of Mudumalai and Silent Valley National Park ............................ 48
6.4. MODIS VCF Classified Data of Mudumalai and Silent Valley National Park ......................... 49
6.5. LUCC in PAs of the Western Ghats and Nilgiri Biosphere Reserve using MODIS VCF GLCD. 50
7. Project Limitations and Future Research .................................................................................... 52 7.1. Project Limitations................................................................................................................52 7.2. Future Research....................................................................................................................52
8. Conclusion .................................................................................................................................... 53
References…………………………………………………………………………………………………………………………………….....i Appendix A………………………………………………………………………………………………………………………………………xii
King’s College London, MSc Dissertation: Global Environmental Change Henry Brittlebank
Figure 2-0: Definitions of land-use and land-cover………………………………………………………………………….2 Figure 2-1: Transitions of Land-Use. ................................................................................................... 3 Figure 2-2: Worldwide Extent of Land-Cover. .................................................................................... 4 Figure 2-3: Global MODIS VCF Product - Global % Tree Cover. .......................................................... 6 Figure 2-4: The Western Ghats and Sri Lanka Biodiversity Hotspot. .................................................. 9 Figure 2-5: IUCN Category Status’s ................................................................................................... 11 Figure 2-6: Panel a) Existing Protected Areas and Site Irreplaceabilities in the Western Ghats. ..... 13 Figure 2-7: PAs in Nilgiri Biosphere Reserve………………………………………………………………………………….14 Figure 3-1: Protected Areas in Kerala and Tamil Nadu, India.. ......................................................... 16 Figure 4-1: Landsat 2003 False Colour Composite…………………………………………………………………………21 Figure 4-2: Landsat Geo-Referenced Image of Silent Valley National Park ……………………………………22 Figure 4-3: Landsat Mudumalai National Park……………………………………………………………………………….24 Figure 4-4: Ground Truth ROIs…………………………………………………………………………………….…………………26 Figure 4-5: MODIS VCF 2008 Mudumalai National Park…………………………………………………………………27 Figure 5-1: Landsat MLC Images of Mudumalai National Park 1973 – 2012.………………………………….30 Figure 5-2: Landsat MLC Images of Mudumalai National Park and 5km Buffer Zone.…………………….31 Figure 5-3: Graph of Landsat Class Data, Mudumalai National Park………………………………………….…..32 Figure 5-4: Landsat MLC, Silent Valley National Park……………………………………………………………….…….33 Figure 5-5: Landsat MLC, Silent Valley National Park and 5km Buffer Zone…………………………….…….34 Figure 5-6: Graph of Landsat Class Data, Silent Valley National Park……………………………………….…….35 Figure 5-7: Landsat MLC Accuracy Assessments.……………………………………………………………….... ………36 Figure 5-8: MODIS VCF Classifications, Mudumalai National Park……………………………………… …………37 Figure 5-9: MODIS VCF Classifications, Silent Valley National Park……………………………………… ……….38 Figure 5-10: MODIS VCF Classifications, Protected Areas in the Western Ghats…… …………….……….40 Figure 5-11: Graph of MODIS VCF Classification Data for Protected Areas in the Western Ghats ..41 Figure 5-12: MODIS VCF Classifications, Protected Areas in the NBR…………………………………………….43 Figure 5-13: Graph of MODIS VCF Classification Data for Protected Areas in the NBR…………………..44 Figure 5-14: MODIS VCF Accuracy Assessments…………………………………………………………………………….45
Table 2-1: Species Richness and Endemicity in the Western Ghats and Sri Lanka ............................. 10 Table 2-2: Land-Use and Deforestation rates in the southern region of the Western Ghats ............ 10 Table 2-3: Protected Areas in the Western Ghats and Sri Lanka. ....................................................... 12 Table 3-1: Protected Areas in the Western Ghats .............................................................................. 18 Table 4-1: Landsat Data used in the Study.........................................................................................20 Table 5-1: Landsat Class Area Data for Mudumalai National Park ..................................................... 32 Table 5-2: Landsat Class Area Data for Silent Valley National Park .................................................... 34 Table 5-3: MODIS VCF Class Area Data for Mudumalai National Park………………………………………………37 Table 5-4: MODIS VCF Class Area Data for Silent Valley National Park…………………………………………....38 Table 5-5: MODIS VCF Class Area Data for Protected Areas in the Western Ghats……………………..…..41 Table 5-6: MODIS VCF Class Area Data for Protected Areas in the NBR……………………………………………43 Equation 1: Conversion of Digital Numbers to Ground Surface Reflectance Values……………………….20 Equation 2: Chosen Digital Number Value used for Dark Object Subtraction…………………………………23
List of Figures
List of Equations
List of Tables
King’s College London, MSc Dissertation: Global Environmental Change Henry Brittlebank
1
1. Introduction
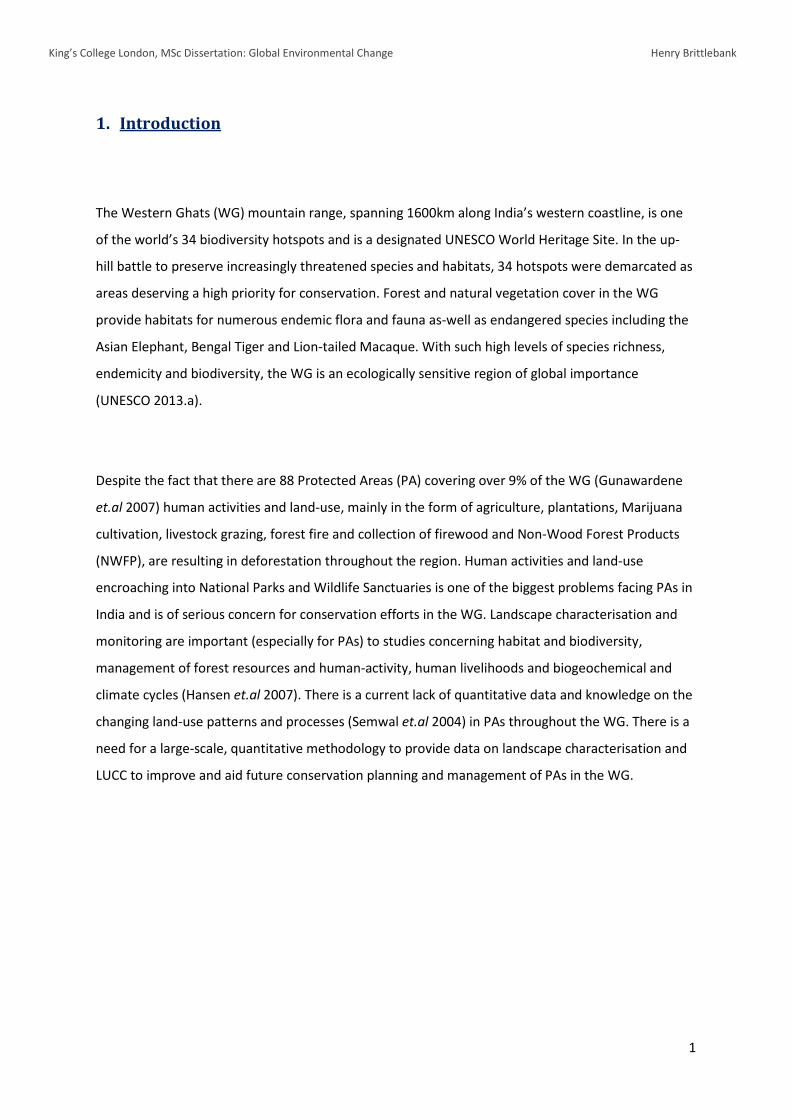
The Western Ghats (WG) mountain range, spanning 1600km along India’s western coastline, is one
of the world’s 34 biodiversity hotspots and is a designated UNESCO World Heritage Site. In the up-
hill battle to preserve increasingly threatened species and habitats, 34 hotspots were demarcated as
areas deserving a high priority for conservation. Forest and natural vegetation cover in the WG
provide habitats for numerous endemic flora and fauna as-well as endangered species including the
Asian Elephant, Bengal Tiger and Lion-tailed Macaque. With such high levels of species richness,
endemicity and biodiversity, the WG is an ecologically sensitive region of global importance
(UNESCO 2013.a).
Despite the fact that there are 88 Protected Areas (PA) covering over 9% of the WG (Gunawardene
et.al 2007) human activities and land-use, mainly in the form of agriculture, plantations, Marijuana
cultivation, livestock grazing, forest fire and collection of firewood and Non-Wood Forest Products
(NWFP), are resulting in deforestation throughout the region. Human activities and land-use
encroaching into National Parks and Wildlife Sanctuaries is one of the biggest problems facing PAs in
India and is of serious concern for conservation efforts in the WG. Landscape characterisation and
monitoring are important (especially for PAs) to studies concerning habitat and biodiversity,
management of forest resources and human-activity, human livelihoods and biogeochemical and
climate cycles (Hansen et.al 2007). There is a current lack of quantitative data and knowledge on the
changing land-use patterns and processes (Semwal et.al 2004) in PAs throughout the WG. There is a
need for a large-scale, quantitative methodology to provide data on landscape characterisation and
LUCC to improve and aid future conservation planning and management of PAs in the WG.

King’s College London, MSc Dissertation: Global Environmental Change Henry Brittlebank
2
2. Literature Review
2.1. Global Land Use and Land Cover Change
Alterations and contemporary change of the Earth’s land surface and vegetation cover are
increasingly being dominated by human activities. Human actions are currently altering the
terrestrial environment at unprecedented rates, magnitudes and spatial scales (Lambin et.al 2001).
Current change in many realms of the biosphere are largely the product of human activities, the
sources of which lie in two clusters of production and consumptions activities (Meyer & Turner
1994); 1) The world’s industrial metabolism, flow of energy and materials through processes of
resource extraction, processing, use and disposal. 2) Global Land-Use and Land-Cover Change
(Turner 1994).
Land-use and land-cover change (LUCC) stemming from human land-users, represents a major
source of global environmental change (Lambin et.al 2001). Patterns of landscape modification are
the results of complex interactions between physical, biological and social forces (Petit et.al 2001)
that involve site-specific interactions and a large number of factors at different spatial and temporal
scales (Lambin et.al 2003). However, settlement and urban extension, agriculture and plantation
expansion and wood extraction are considered the main, proximate causes (figure 1.1. Humans have
only recently been recognised as a dominant force in global environmental change (Turner 2003)
with LUCC being seen as an important facet only in the last few decades (Vitousek et.al 1997). While
research suggests that humans have been altering land-cover since pre-historic times, through
methods such as fire to flush out game and clearance of small patches for agriculture and livestock
(De Sherbinin 2002) it is really only in the past few centuries that humans have had the technology
to impact land-use and land-cover on a truly global scale (figure 2.1).
Land-Use – is the term used to describe human uses of the land, or activities, arrangements and
impacts people have undertaken on a land-cover type to produce, change or maintain it
Land-Cover – refers to the natural vegetative cover types that are characteristic of a particular area,
defined as the observed bio-physical cover on the Earth’s terrestrial surface.
Figure 2.0: Definitions of land-use and land-cover (Sherbinin 2002, Herold et.al 2009).
King’s College London, MSc Dissertation: Global Environmental Change Henry Brittlebank
3
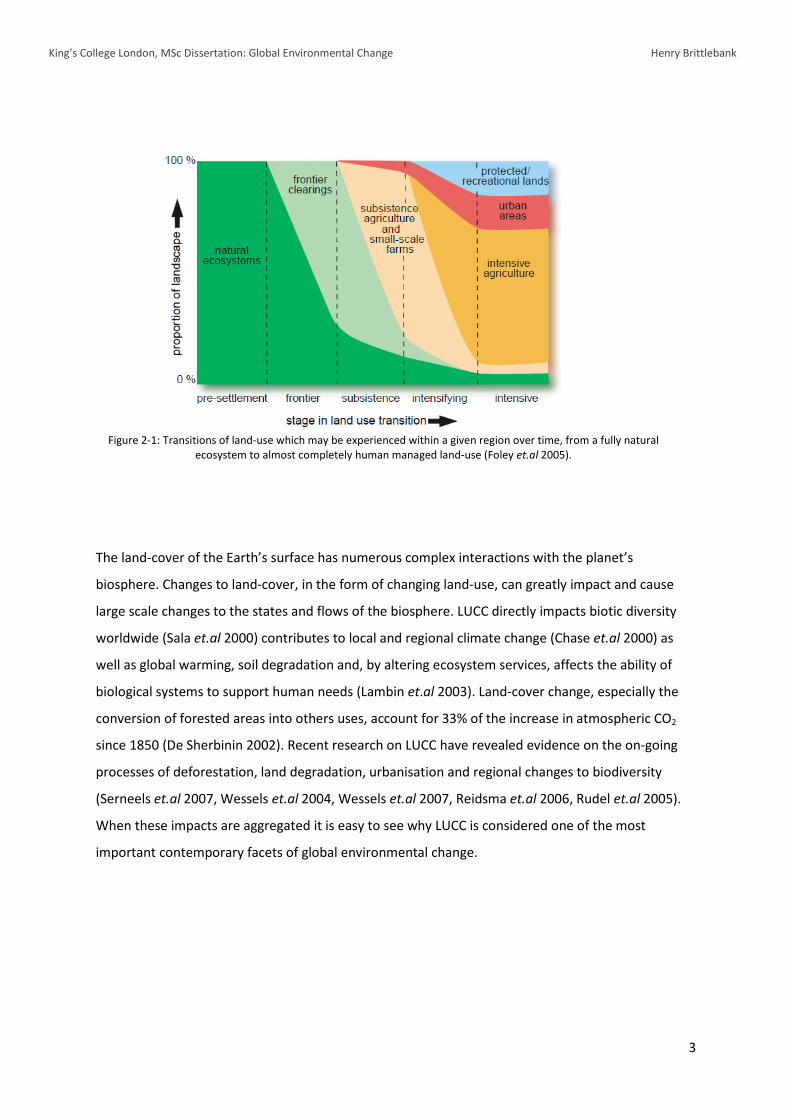
The land-cover of the Earth’s surface has numerous complex interactions with the planet’s
biosphere. Changes to land-cover, in the form of changing land-use, can greatly impact and cause
large scale changes to the states and flows of the biosphere. LUCC directly impacts biotic diversity
worldwide (Sala et.al 2000) contributes to local and regional climate change (Chase et.al 2000) as
well as global warming, soil degradation and, by altering ecosystem services, affects the ability of
biological systems to support human needs (Lambin et.al 2003). Land-cover change, especially the
conversion of forested areas into others uses, account for 33% of the increase in atmospheric CO2
since 1850 (De Sherbinin 2002). Recent research on LUCC have revealed evidence on the on-going
processes of deforestation, land degradation, urbanisation and regional changes to biodiversity
(Serneels et.al 2007, Wessels et.al 2004, Wessels et.al 2007, Reidsma et.al 2006, Rudel et.al 2005).
When these impacts are aggregated it is easy to see why LUCC is considered one of the most
important contemporary facets of global environmental change.
Figure 2-1: Transitions of land-use which may be experienced within a given region over time, from a fully natural ecosystem to almost completely human managed land-use (Foley et.al 2005).
King’s College London, MSc Dissertation: Global Environmental Change Henry Brittlebank
4
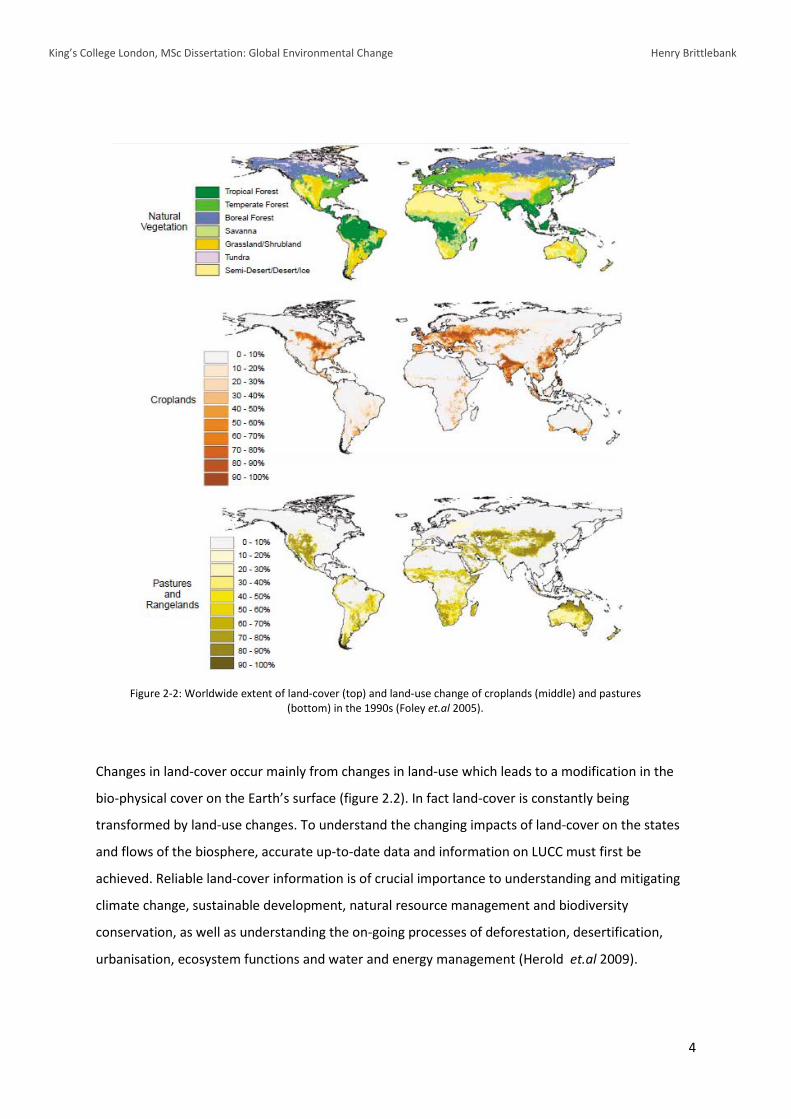
Changes in land-cover occur mainly from changes in land-use which leads to a modification in the
bio-physical cover on the Earth’s surface (figure 2.2). In fact land-cover is constantly being
transformed by land-use changes. To understand the changing impacts of land-cover on the states
and flows of the biosphere, accurate up-to-date data and information on LUCC must first be
achieved. Reliable land-cover information is of crucial importance to understanding and mitigating
climate change, sustainable development, natural resource management and biodiversity
conservation, as well as understanding the on-going processes of deforestation, desertification,
urbanisation, ecosystem functions and water and energy management (Herold et.al 2009).
Figure 2-2: Worldwide extent of land-cover (top) and land-use change of croplands (middle) and pastures (bottom) in the 1990s (Foley et.al 2005).
King’s College London, MSc Dissertation: Global Environmental Change Henry Brittlebank
5
2.2. Advances in Remote Sensing of Land Use and Land Cover Change
Because LUCC is the result of numerous complex interactions over different spatial and temporal
scales, it is very difficult to accurately measure and observe. Ground observations can provide
accurate data on land-cover but cannot be used extensively over large areas to map change over
time, due to cost and time limitations. Remote sensing has emerged as the most useful data source
for quantitatively measuring land-cover changes and can provide precise and accurate LUCC analysis
through temporal series of satellite data (Petit et.al 2001). Satellite data provides the resources to
analyse multi-temporal land-cover data over large spatial areas. When analysing LUCC a remote
sensing approach allows for: 1) Quantification of land-cover changes in terms of percentage of area
affected and rates of change; 2) To qualify the nature of changes in terms of impact on natural
vegetation; 3) To map the spatial pattern of land-cover change (Petit et.al 2001). Recent advances in
remote sensing technology has allowed for an increase in accuracy in land-cover and use detection,
as well as improved efficiency providing and ‘economical’ means to map and analyse LUCC (Yuan
2005).
A majority of early work using remote sensing techniques analysed temporal series of multiple
spectral data to evaluate land-cover change. Numerous change detection methods have been
created, including; image differencing, vegetative index differencing, selective principle components
analysis and post classification change differencing (Mas 1999). Post classification methods are
currently the most widely used technique and are considered the most accurate procedures while
also indicating the nature of the changes (Petit 2001, DeFries et.al 2000). Post-classification analysis
of multi temporal data sets provide relatively detailed information and statistics on LUCC, including
the location, nature and rate of change.
Along with the developing understanding that land-cover change impacts global processes, remote
sensing land-cover change detection capabilities have evolved to allow the application of
classification models at regional, continental and global scales (Muchoney et.al 2000). In the past
decade data sources and methodologies for creating global land-cover maps from remote sensing
have evolved rapidly (Friedl et.al 2010). A majority of early global land-cover maps have used high
resolution data sets to interpret a coarse-resolution data set, which can then be used in a division
tree structure to classify global data sets into a range of pre-defined classes (Hansen et.al 2000).
Some of the most developed global land-cover datasets (GLCD) include: a 1km resolution GLCD from
King’s College London, MSc Dissertation: Global Environmental Change Henry Brittlebank
6
the International Geosphere Biosphere Programme – Data Information Systems (IGBD-DIS) trained
using 1km AVHRR data (Loveland et.al 2000); GLCD Global Land Cover 2000, co-ordinated by the
EU’s Joint Research Centre based on daily data from the VEGETATION sensor on-board SPOT-4
(Bartholomé & Belward 2005); a MODIS GLCD based on 1km AVHRR data (Hansen et.al 2000); and ,
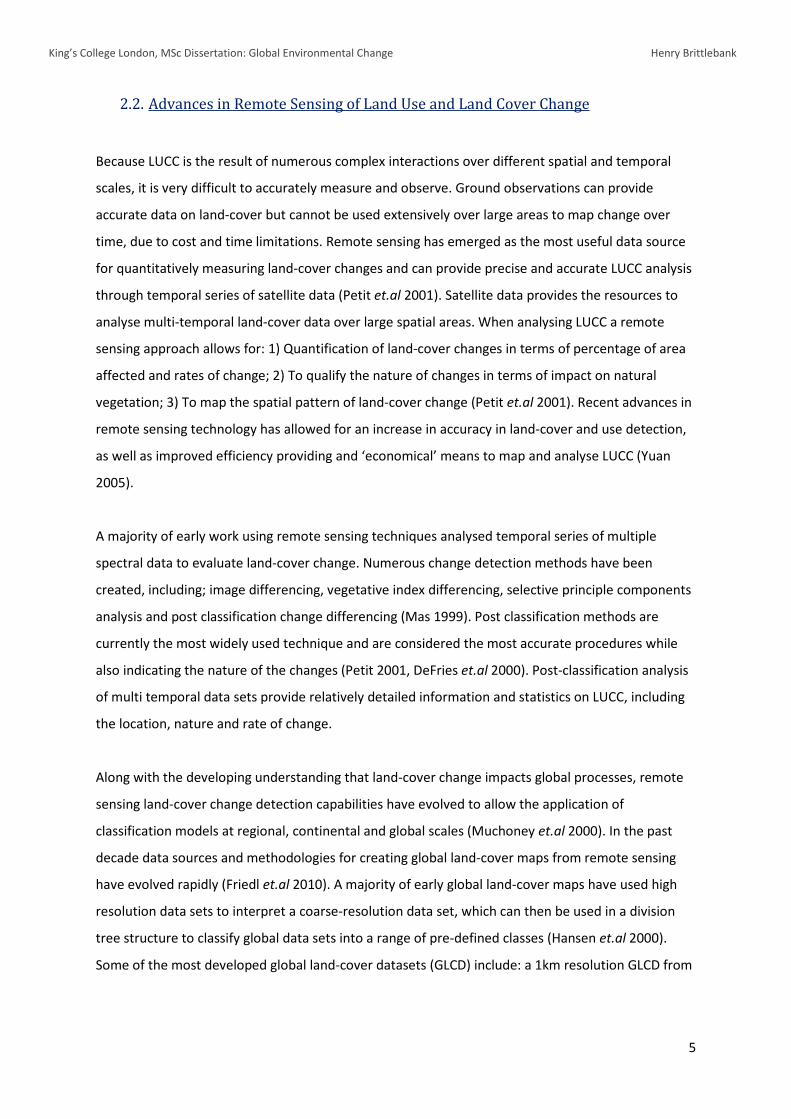
more recently, the MODIS VCF product derived from all 7 bands of the MODIS sensor. MODIS VCF
data (figure 2.3) contains proportional estimates for vegetative cover types including; woody
vegetation, herbaceous vegetation and bare ground, allowing for better classification of
heterogeneous land-cover than discrete classification schemes (GLCF 2013). The VCF product has
been designed to continuously represent the Earth’s terrestrial surface as a proportion of basic
vegetation traits and provides continuous and quantitative data on land surface cover (USGS
2013.b).
Despite improvements in land-cover classification made possible by earth observing satellites, global
and regional land covers and uses are still relatively poorly enumerated (Loveland et.al 2000).
Vegetation diversity, interspersion and homogenous characteristics provide problems for remote
sensing classification (Friedl & Brodley 1997, Carpenter et.al 1997). Pixel mixing arises in
heterogeneous ground surfaces as the materials are so closely associated, and the complexity of the
relation between at surface spectral reflectance and land-cover attributes (Wang et.al 2007)
Figure 2-3: MODIS VCF product showing global % tree cover representing the Earth’s land surface as a proportion of basic vegetation traits (USGS 2013.b).

King’s College London, MSc Dissertation: Global Environmental Change Henry Brittlebank
7
negatively impact the accuracy and usefulness of global land-cover products. There is an obvious
need for good inventory data and statistics on land-cover and LUCC at sub-national, national and
global scales (Lepers et.al 2005) which requires increased accuracy of land-cover characteristics as
well as better methods for the analysis of global land-cover data sets LUCC detection.
2.3. Land Use and Land Cover Change: A Case Study of India
Pre-colonial India was mainly a nation of people who relied on their immediate surroundings for
resources with a variety of cultural practises and prudent resource use (Gadgil et.al 1993). After
British colonisation (Raj rule - 1858] there was an exponential increase in resource exploitation and
deforestation leading to LUCC (Richards & Tucker 1988). Under British rule huge amounts of Indian
land was acquired as state property, resources were exported out of the locality, new agricultural
practises and improved transport links such as railways massively increased agricultural output and a
new economy was brought to India (Guha & Gadgil 1989, Sivaramakrishnan 1995). Colonialism,
modernity and development were not exclusively responsible for the land degradation in India
(Sinha et.al 1997) but early years of British rule where characterised by completely unregulated
exploitation of environmental services and resources, with the process of non-sustainable forest use
being intensified after independence, resulting in the contemporary large scale increase in land
degradation and LUCC throughout India (Gadgil et.al 1993).
India’s forests and biodiverse natural environments, mainly tropical and sub-tropical in nature,
constitute 64m hectares and such vegetation cover is predominant in the four major ecological
zones; Himalayas, Vindhyans, Eastern and Western Ghats (NRSA 2005). The wide-ranging and varied
vegetation cover with such a high biodiversity is the product of monsoon regimes, high precipitation
and humidity levels as well as spatial variability in climate. In the past few decades natural
environments and forested landscapes have been over exploited in the name of development, for
mineral resources, real estate interests and more recently tourism (Giriraj et.al 2011). Recent
research on land degradation and land-cover change in India has estimated an increase of over 263%
in timber requirements to 181,270 million tonnes by 2025, fuel wood stands (the main energy
resource for 70% of the Indian population) cause 125 million tonnes to be extracted annually and
over half the livestock population (270m) depend on forest for grazing resources (NRSA 2005). The
ministry of Environment and Forest in 1999 classified 43% of India’s 329m hectares of land as under
cropping while 23% were classified as forests. A majority of these forests however, have significantly
been disturbed through activities such as logging, clear-felling, grazing, fire and collection of fuel
King’s College London, MSc Dissertation: Global Environmental Change Henry Brittlebank
8
wood, fodder and NWFPs (Bhat et.al 2001). There is a consensus in current literature that British
colonisation increased resource exploitation which Independent India has expanded to cause rapid
land degradation, deforestation and LUCC in the 20th Century.
While a majority of research focuses on resource exploitation and LUCC from natural vegetation
cover to human land-uses, recent research has suggested that there has been an increase in forest
cover throughout India in the past few decades. Large scale plantation and rehabilitation
programmes undertaken in the recent past allow for natural regeneration and have resulted in an
increase in the area of rehabilitated secondary forests (Bhat et.al 2001). Recent research by Rudel
et.al (2005) suggest that the loss of forests during agricultural expansion creates a countervailing
tendency, continued decreases in forest cover spur increases in the prices of forest products, and
the price increases induce land owners to plant trees, thereby re-foresting areas, explaining the
recent trend of increasing forest cover in India. Data analysis of national household survey data,
census data and satellite images of land-use in rural India provide evidence that increases in the
demand for forest products associated with income and population growth has led to forest growth
in the past few decades (Foster & Rosenzwig 2003).
While a majority of research (Richards & Tucker 1988, Sivaramakrishnan 1995, Sinha et.al 1997,
Gadgil et.al 1993) suggests that India has been experiencing multiple decades of resource
exploitation and land degradation, recent research (Rudel et.al 2005, Foster & Rosenzwig 2003, Bhat
et.al 2001) provides evidence of forest growth in the past few decades. Semwal et.al (2004) implies
that knowledge of recent changes in land-use in India, driving forces and implications of change are
limited. According to a survey on LUCC in India, by the Indian Government (NRSA 2005), information
on LUCC in the form of quantitative data are inadequate and do not provide up-to-date information
on the changing land-use patterns and processes. This supports Pandit et.al (2007) who suggests
that inaccurate reporting of forest cover by governments can result in underestimates of the rates
and biological impacts of deforestation and land-cover change. While there is consensus on LUCC
and degradation up until and a few decades after Indian Independence, there is little consensus or
agreement on forest cover and LUCC in India during the last few decades and into the 21st Century.

King’s College London, MSc Dissertation: Global Environmental Change Henry Brittlebank
9
2.4. Land Use and Land Cover Change in the Western Ghats, India
The Western Ghats, older than the Himalaya Mountains, represents a geomorphic region of
immense importance with unique biophysical and ecological processes, an exceptionally high level of
biological diversity and endemism, and is one of the world’s eight ‘hottest hotspots’ (UNESCO
2013.a) (figure 2.4). The WG is officially one of the 34 biodiversity hotspots (Malcolm et.al 2006)
combined with the vegetation and biodiversity of Sri Lanka. The original total combined primary
vegetation cover of the region was 182,500 km2 (Gunawardene et.al 2007) however limited biotic
interchange between these areas has created two distinct flora and fauna endemic areas (Bossuyt
et.al 2004) (table 2.1). The WG flora is largely influenced by the Indian Monsoon and the abundance
and distribution of precipitation this brings. The high Montane Forest ecosystems influence the
Indian Monsoon, this moderates the tropical climate of the region and provides on of the best
examples of the monsoon system on the planet (UNESCO 2013.a). The western side of the WG is on
the threshold of the south west monsoon and receives a rainfall of 203 – 254 cm, while the eastern
side lies in the rain shadow of the Peninsula creating many diverse soil types.Despite not being as
well known for its biodiversity as the Tropical Andes, Mediterranean Basin or the forests of
Madagascar, the WG with its endemic flora and fauna (table 2.1), high biodiversity and forest cover
is an ecologically sensitive region of global importance.
Figure 2-4: A map of India with the Western Ghats and Sri Lanka biodiversity hotspot highlighted (Conservation International 2013.a).

King’s College London, MSc Dissertation: Global Environmental Change Henry Brittlebank
10
While the original extent of the WG biodiversity hotspot was 182,500 km2 of primary vegetation,
research suggests only 12,450 km2 (6.8%) remains (Gunawardene et.al 2007). This is an estimated
change of disruption to natural vegetation cover of 93%, a drastic decrease throughout the region
and rapid forest loss. Many areas of the WG Mountain Range are inaccessible, hard to cultivate and
have such dense forest cover that such forest loss and land-cover change is hard to comprehend.
However, over the last few decades, due to indiscriminate and unscientific exploitation of these
forests, particularly for agriculture, construction of hydro-electric projects, raising monoculture
plantations and other activities, huge areas of the region have been disrupted and felled
(Chandrashekara & Ramakrishnan 1994). Research by Jha et.al (2000) covering the southern stretch
of the WG (approximately 40,000 km2) provides evidence of forest cover loss of 2279 km2,
amounting to 25.6% of total forest area, with an annual rate of deforestation at 1.16% from 1973 –
1995 (table 2.2).
Table 2-2: Changes in land-use and deforestation rates in the southern region of the Western Ghats, 1973 – 1995 (Jha et.al 2000).
Table 2-1: A overview and comparison of species richness and endemicity in the Western Ghats and Sri Lanka (Gunawardene et.al 2007).
King’s College London, MSc Dissertation: Global Environmental Change Henry Brittlebank
11
With continued increases of resource requirement, increased population pressures and continued
LUCC, more and more natural virgin forests are being encroached upon. The disruption of natural
vegetated land-cover in the WG has also led to an increase in land degradation from water induced
soil erosion (Singh et.al 1992). The mountainous geomorphology, intense precipitation levels during
monsoon season, decreasing rates of forest cover and increasing use of irrigation for agriculture all
add to increases of soil erosion causing land degradation. Despite numerous research and analysis of
general LUCC for the whole of the WG, there is actually very little quantitative data on LUCC, the
rate of such loss and spatial patterns of LUCC (Giriraj et.al 2011). The natural ecosystems of this
biodiversity hotspot are however clearly under threat and require urgent conservation action,
especially in augmenting the PA network (Gunawardene et.al 2007).
2.5. LUCC in Protected Areas of the Western Ghats and the Nilgiri Biosphere Reserve.
20 of the planet’s 34 biodiversity hotspots lie in tropical countries, areas that face the gravest
threats to their natural resources and have the most limited resources for conservation (Das et.al
2006). The increasing demand for natural resources in these areas combined with the lack of
resources for conservation, puts huge pressure on the natural environments, habitats, flora and
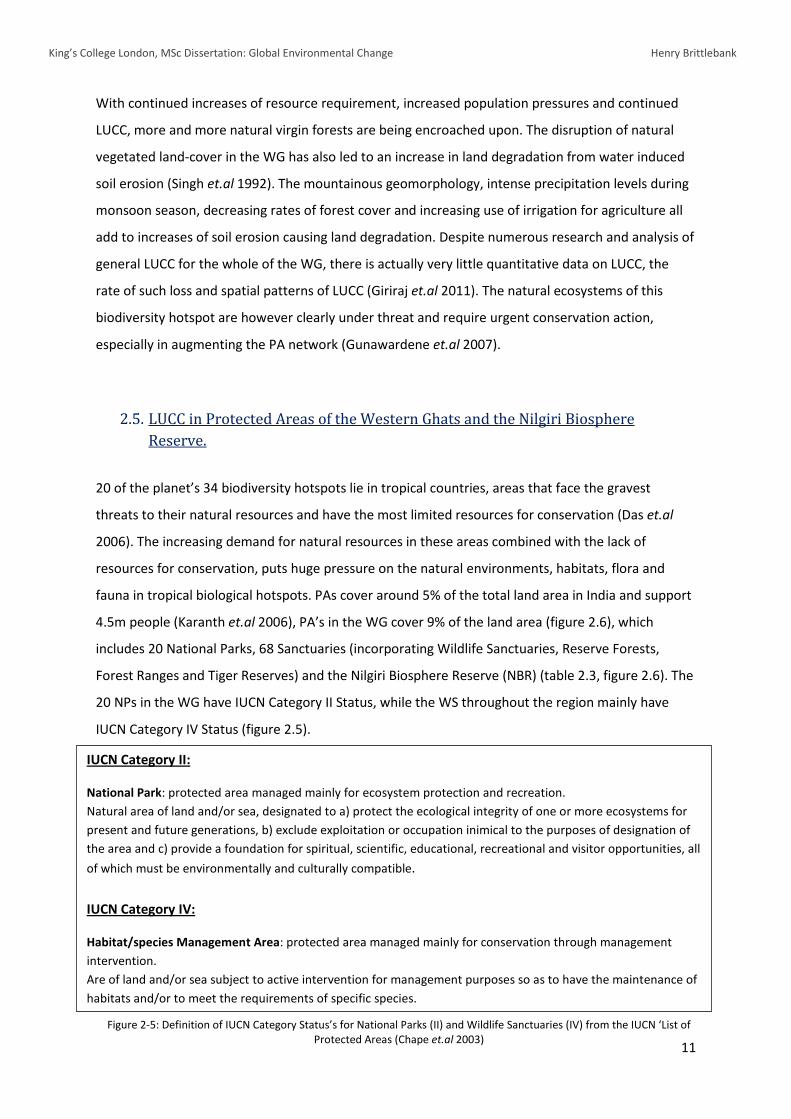
fauna in tropical biological hotspots. PAs cover around 5% of the total land area in India and support
4.5m people (Karanth et.al 2006), PA’s in the WG cover 9% of the land area (figure 2.6), which
includes 20 National Parks, 68 Sanctuaries (incorporating Wildlife Sanctuaries, Reserve Forests,
Forest Ranges and Tiger Reserves) and the Nilgiri Biosphere Reserve (NBR) (table 2.3, figure 2.6). The
20 NPs in the WG have IUCN Category II Status, while the WS throughout the region mainly have
IUCN Category IV Status (figure 2.5).
IUCN Category II:
National Park: protected area managed mainly for ecosystem protection and recreation. Natural area of land and/or sea, designated to a) protect the ecological integrity of one or more ecosystems for present and future generations, b) exclude exploitation or occupation inimical to the purposes of designation of the area and c) provide a foundation for spiritual, scientific, educational, recreational and visitor opportunities, all
of which must be environmentally and culturally compatible. IUCN Category IV:
Habitat/species Management Area: protected area managed mainly for conservation through management intervention. Are of land and/or sea subject to active intervention for management purposes so as to have the maintenance of habitats and/or to meet the requirements of specific species.
Figure 2-5: Definition of IUCN Category Status’s for National Parks (II) and Wildlife Sanctuaries (IV) from the IUCN ‘List of Protected Areas (Chape et.al 2003)
King’s College London, MSc Dissertation: Global Environmental Change Henry Brittlebank
12
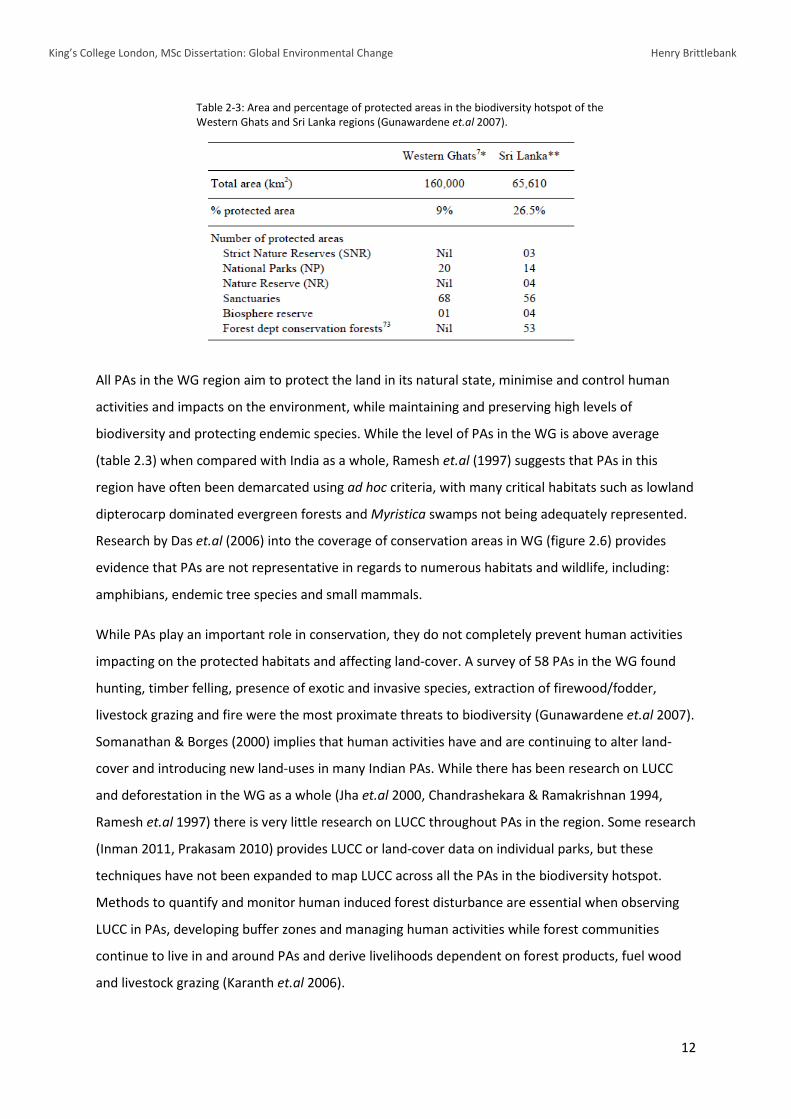
All PAs in the WG region aim to protect the land in its natural state, minimise and control human
activities and impacts on the environment, while maintaining and preserving high levels of
biodiversity and protecting endemic species. While the level of PAs in the WG is above average
(table 2.3) when compared with India as a whole, Ramesh et.al (1997) suggests that PAs in this
region have often been demarcated using ad hoc criteria, with many critical habitats such as lowland
dipterocarp dominated evergreen forests and Myristica swamps not being adequately represented.
Research by Das et.al (2006) into the coverage of conservation areas in WG (figure 2.6) provides
evidence that PAs are not representative in regards to numerous habitats and wildlife, including:
amphibians, endemic tree species and small mammals.
While PAs play an important role in conservation, they do not completely prevent human activities
impacting on the protected habitats and affecting land-cover. A survey of 58 PAs in the WG found
hunting, timber felling, presence of exotic and invasive species, extraction of firewood/fodder,
livestock grazing and fire were the most proximate threats to biodiversity (Gunawardene et.al 2007).
Somanathan & Borges (2000) implies that human activities have and are continuing to alter land-
cover and introducing new land-uses in many Indian PAs. While there has been research on LUCC
and deforestation in the WG as a whole (Jha et.al 2000, Chandrashekara & Ramakrishnan 1994,
Ramesh et.al 1997) there is very little research on LUCC throughout PAs in the region. Some research
(Inman 2011, Prakasam 2010) provides LUCC or land-cover data on individual parks, but these
techniques have not been expanded to map LUCC across all the PAs in the biodiversity hotspot.
Methods to quantify and monitor human induced forest disturbance are essential when observing
LUCC in PAs, developing buffer zones and managing human activities while forest communities
continue to live in and around PAs and derive livelihoods dependent on forest products, fuel wood
and livestock grazing (Karanth et.al 2006).
Table 2-3: Area and percentage of protected areas in the biodiversity hotspot of the Western Ghats and Sri Lanka regions (Gunawardene et.al 2007).

King’s College London, MSc Dissertation: Global Environmental Change Henry Brittlebank
13
While NP’s, WS’s and recognised PAs play an important role in wildlife conservation and habitat
protection, informal PAs such as sacred groves and private wildlife sanctuaries are also an extremely
important part of Indian conservation efforts (Bhagwat et.al 2005). These areas along with semi-
protected areas such as Forests Reserves and Forests Ranges (IUCN Category VI) have a strong
influence on and support the ecosystems and biodiversity of the NPs and WSs that form the core of
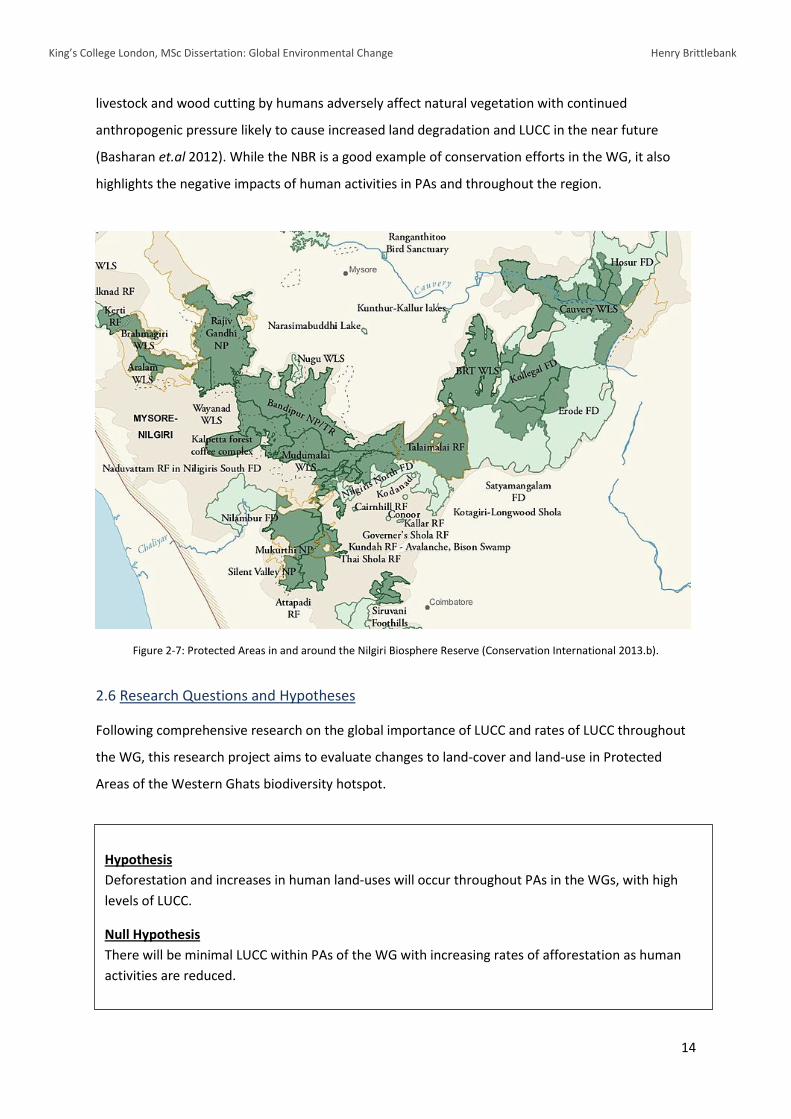
the Indian conservation strategy. The Nilgiri Biosphere Reserve (figure 2.7) is a perfect example of
the combination of multiple PAs with varying protection statuses to try and provide comprehensive
levels of conservation. The NBR is spread over the states of Kamatika, Kerala and Tamil Nadu, the
forested areas of the reserve cover 5520km2, supporting all the major vegetation types of peninsular
India including; tropical ever-green and semi-evergreen forests, tropical moist deciduous and
tropical dry deciduous, with characteristic patches of tropical montane forests above 1800m and
extensive grassland on hill slopes (Kodandapani et.al 2004). The NBR, as a UNESCO biosphere
reserve, aims to promote sustainable development based on local community efforts and
conservation knowledge, reconciling conservation of biological and cultural diversity and economic
and social development through partnerships between people and nature (UNESCO 2013.b). While
there are numerous PAs in the NBR, the region is under immense human pressures. Grazing of
Figure 2-6: Panel a) site irreplaceabilities for achieving minimal reserve network targets in the WG, b) minimal reserve scenarios, c) minimal reserve network with existing protected areas highlighted and accounted for (Das et.al 2006).
King’s College London, MSc Dissertation: Global Environmental Change Henry Brittlebank
14
livestock and wood cutting by humans adversely affect natural vegetation with continued
anthropogenic pressure likely to cause increased land degradation and LUCC in the near future
(Basharan et.al 2012). While the NBR is a good example of conservation efforts in the WG, it also
highlights the negative impacts of human activities in PAs and throughout the region.
3. Study Area
3.1. Western Ghats and the Nilgiri Biosphere Reserve
Figure 2-7: Protected Areas in and around the Nilgiri Biosphere Reserve (Conservation International 2013.b).
2.6 Research Questions and Hypotheses
Following comprehensive research on the global importance of LUCC and rates of LUCC throughout
the WG, this research project aims to evaluate changes to land-cover and land-use in Protected
Areas of the Western Ghats biodiversity hotspot.
Hypothesis Deforestation and increases in human land-uses will occur throughout PAs in the WGs, with high levels of LUCC.
Null Hypothesis There will be minimal LUCC within PAs of the WG with increasing rates of afforestation as human activities are reduced.

King’s College London, MSc Dissertation: Global Environmental Change Henry Brittlebank
15
This study focuses on the PAs of the WG (figure 2.6, table 3.1). NPs and WSs in the WG preserve and
maintain a variety of environments, habitats, flora and fauna, many of which are endemic to one of
the most biodiverse hotspots on the planet. The PAs in this region represent some of the only
protected areas in the WG and as such are extremely important to conservation efforts. PAs
represent a majority of the vegetation cover in the WG, including; tropical ever and semi-green
forests, full and semi deciduous forests, scrub forests, shola and other grasslands and montane
forests at high altitudes, while a majority of land outside the parks contain agriculture, plantations
and degraded forests (Tewari 1995). Particular attention is paid to PAs in the NBR as it provides a
corridor of natural vegetation and forest habitats (figure 2.7) providing seasonal migration routes
and facilitating habitat supplementation (Bennett & Mulongoy 2006), which has come under
increasing pressure from human activities.
3.2. Silent Valley National Park
Silent Valley NP is located in the north of Kerala state, 76025’_-_76029’_E and 1104’_-_11013’_N, with
a core area of 89.52 km2 (KFWD 2013.a). Silent Valley forest cover mainly consists of tropical ever-
green forest and sub-tropical broad leaved hill forest while also containing patches of endemic
montane wet temperate forest. The park also contains hundreds of endemic plant species and is
home to one of the largest populations of the endangered loin-tailed Macaque (Manoharan 1999).
The park sits on the lower side of the Nilgiri plateau, which ranges from 500-2,000m in elevation,
annual rainfall averages around 5,000mm with temperatures ranging from 8-140C (min) – 23-290C
(Singh et.al 1984). The park is surrounded by ridges and steep escapements providing protection
against anthropogenic impacts, preserving one of the few tracts of virgin forest left in the WG and
one of the most complex and diverse vegetation communities on earth (Balakrishnan 1984). While
Silent Valley has mainly been bereft of human settlement due to its inaccessible location, human
interferences in the form of tree-felling, burning/fires and pre-dam1 construction have impacted
vegetation cover in the past (Singh et.al 1984).
1 A hydro-dam project was approved in 1978, before the area was given NP status (1984). This would have caused numerous detrimental impacts to the forested area including large amounts of flooding and forest cover loss (Singh et.al 1984). After wide-spread environmental protests the hydro-dam project was indefinitely postponed, however the growing demands for energy in India mean that dam construction in the park still remains a threat.
3. Study Area 3.1. Western Ghats and the Nilgiri Biosphere Reserve

King’s College London, MSc Dissertation: Global Environmental Change Henry Brittlebank
16
a) b)
3.3. Mudumalai National Park and Wildlife Sanctuary
Mudumalai NP and WS extends over 321km2 within the Nilgiri plateau (11023’_–_11043’_N,_76022_
–_76045’_E) at an altitude of 850-1250m in the Indian state of Tamil Nadu (Sukumar et.al 1992).
Mudumalai is considered one of the most important PAs in the NBR, creating an extensive forest
cover with three other parks (Nagrahole and Bandipur NP and Wynaad WS) between the Western
and Eastern Ghats (Silori & Mishra 2001), critical for the migration of Indian Elephants and the
Bengal Tiger. The park has a distinct rainfall gradient from west (average 1800mm annually) to east
(800mm annually) giving rise to its distinctive vegetation cover; moist deciduous forests in the west
gradually give way to dry deciduous forests which ultimately become dry-thorn forests and wooded
grassland (Ganesan 1993). The importance of Mudumalai was officially realised in 1942 when it was
Figure 3-1: The states of Kerala (a) and Tamil Nadu (b) with the locations of wildlife protected areas including NPs and WS, as well as Silent Valley and Mudumalai, highlighted below (WII 2013, Federparchi 2013).
King’s College London, MSc Dissertation: Global Environmental Change Henry Brittlebank
17
declared a wildlife sanctuary, in 1990 a large area of Mudumalai was given NP status and in 2007
was declared a tiger reserve (Tamil Nadu Forest Department 2013). While these all offer varying
levels of protection status, Mudumalai will be referred to as Mudumalai NP in this study, referring to
all areas of Mudumalai which are protected.
Mudumalai has been influenced by human activities and settlements, with tribes such as the
Kunumbas and Indas present in the area for several centuries (Hegde & Enters 2000). The human
population in Mudumalai NP have a high dependence on the land and forests for their livelihood
needs. Construction of a series of hydroelectric power stations around Masinagudi village has led to
a rapid increase in the parks population, a 143% increase between 1961 – 1991 (Silori & Mishra
2001) which is expected to continue on the near future.
King’s College London, MSc Dissertation: Global Environmental Change Henry Brittlebank
18
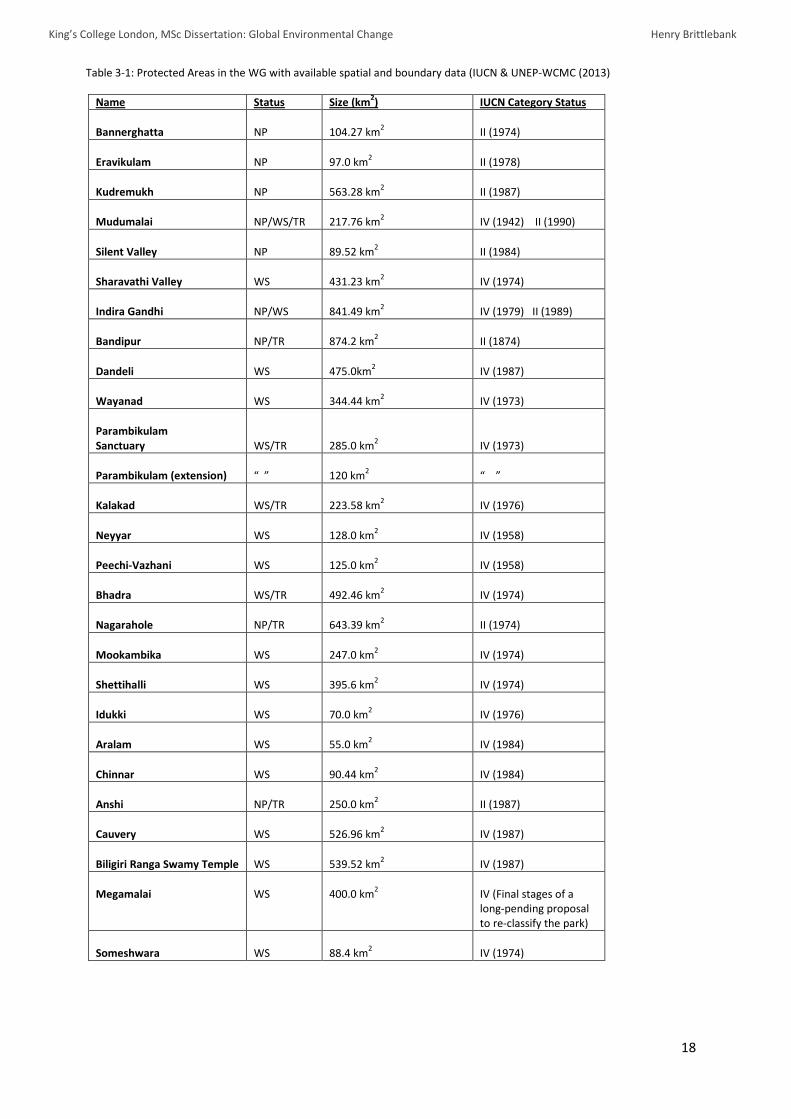
Name Status Size (km2) IUCN Category Status Bannerghatta
NP
104.27 km2
II (1974)
Eravikulam
NP
97.0 km2
II (1978)
Kudremukh
NP
563.28 km2
II (1987)
Mudumalai
NP/WS/TR
217.76 km2
IV (1942) II (1990)
Silent Valley
NP
89.52 km2
II (1984)
Sharavathi Valley
WS
431.23 km2
IV (1974)
Indira Gandhi
NP/WS
841.49 km2
IV (1979) II (1989)
Bandipur
NP/TR
874.2 km2
II (1874)
Dandeli
WS
475.0km2
IV (1987)
Wayanad
WS
344.44 km2
IV (1973)
Parambikulam Sanctuary
WS/TR
285.0 km2
IV (1973)
Parambikulam (extension)
“ ”
120 km2
“ ”
Kalakad
WS/TR
223.58 km2
IV (1976)
Neyyar
WS
128.0 km2
IV (1958)
Peechi-Vazhani
WS
125.0 km2
IV (1958)
Bhadra
WS/TR
492.46 km2
IV (1974)
Nagarahole
NP/TR
643.39 km2
II (1974)
Mookambika
WS
247.0 km2
IV (1974)
Shettihalli
WS
395.6 km2
IV (1974)
Idukki
WS
70.0 km2
IV (1976)
Aralam
WS
55.0 km2
IV (1984)
Chinnar
WS
90.44 km2
IV (1984)
Anshi
NP/TR
250.0 km2
II (1987)
Cauvery
WS
526.96 km2
IV (1987)
Biligiri Ranga Swamy Temple
WS
539.52 km2
IV (1987)
Megamalai
WS
400.0 km2
IV (Final stages of a long-pending proposal to re-classify the park)
Someshwara
WS
88.4 km2
IV (1974)
Table 3-1: Protected Areas in the WG with available spatial and boundary data (IUCN & UNEP-WCMC (2013)

King’s College London, MSc Dissertation: Global Environmental Change Henry Brittlebank
19
4. Data
Remote sensing data from numerous satellite platforms and instruments were evaluated to find the
most comprehensive and useful imaging data of Mudumalai and Silent Valley National Park. Remote
sensing images over India, specifically the WG, are extremely limited, especially before 1999. The
restricted amount of data sources for this region is most likely an influencing factor in regards to the
lack of research into one of the most biodiverse regions in World (Bava et.al 2007). Landsat data was
used to observe LUCC in and around Mudumalai NP and Silent Valley NP, while MODIS Vegetation
Continuous Field (VCF) (MOD44b) product data was used to analyse vegetation change across the
WG, incorporating numerous PAs.
4.1. Landsat Data
Landsat data is available in 185km x 170km scenes defined in a worldwide reference system (WRS-2)
of path and row co-ordinates (Hansen et.al 2008). The Landsat series provides one of the most
comprehensive remote sensing data sets providing relatively continuous global data since 1972. Five
Landsat datasets, including Landsat 1, 3 and 7 data from 1973 to 2012, covering 2 scenes (Path/Row
TM_1-3_155/52, TM-7 _144/53) were acquired (table 3.1). Multi-sensor approaches are most useful
when the variable of interest can only be measured infrequently and for limited areas (Lambin &
Linderman 2006) and so was the preferred approach when analysing LUCC of PAs in the WG.
The dry season across the WG occurs from January – June (IMD 2013) which is the most useful time
period for data on land-use classification (Xie et.al 2008) while also generally providing images with
low cloud cover(cloud-free optimum season) and less atmospheric interference (Jha et.al 2000).
Therefore Landsat data was acquired between January and May for each of the 5 scenes (table 3.1).
The Landsat acquisitions were chosen to provide a comprehensive temporal range while providing
accurate data for classification and analysis.

King’s College London, MSc Dissertation: Global Environmental Change Henry Brittlebank
20
4.1.1. Pre-processing and Scene Selection
For all Landsat scenes (table 3.1) level 1b product data was downloaded from GLOVIS, Earth Explorer
(GLOVIS 2013.a), providing geo-referenced images of Mudumalai and Silent Valley NPs and the
surrounding areas. Landsat level 1b product provides systematic radiometric and geometric accuracy
which is derived from data collected by the sensor and spacecraft (GLOVIS 2013.b).
4.1.2. Reflectance Values from Digital Numbers
The Digital Numbers (DN) for each scene were converted to ground surface reflectance values (using
Eq. 1) to normalize the remotely sensed images. Absolute radiometric correction was applied to the
Landsat images using reasonable estimations of atmospheric optical depth, solar zenith angle and
satellite status (Chen et.al 2005) from specific data provided by Landsat with each data file.
).255(max).1(min.
...:
LMIN + QCALMIN)-(QCAL * ] QCALMIN)-)/(QCALMAXLMIN - [(LMAX = L 1) Eq.
=======
typicallyvaluepixelcalibratedquantizedimumtheQCALMAXtypicallyvaluepixelcalibratedquantizedtheQCALMINQCALMAXtoscalesradiancespectralLMAX
QCALMINtoscalesradiancespectralLMINnumberdigitalQCALradianceasvaluecelltheisLWhere
λ
λλ
λλλλ
Date
Platform Sensor Image
10.02.1973
Landsat 1 MSS LM11550521973005AAA02
23.05.1981 Landsat 3 MSS LM31550521981143AAA03
21.02.2003 Landsat 7
ETM+ LE71440522003052SGS00
18.01.2008
02.01.2008 (Mosaic Overlay)
Landsat 7
Landsat 7
ETM+
ETM+
LE71440522008018ASN00
LE71440522008002SGS00
01.03.2012
18.04.2012 (Mosaic Overlay)
Landsat 7
Landsat 7
ETM+
ETM+
LE71440522012061PFS00
LE71440522012109PFS00
Table 4.1: Landsat data used in this study
Eq. 1) Equation for conversion to ground surface reflectance values using specific data which accompanies each Landsat scene (Chen et.al 2005).

King’s College London, MSc Dissertation: Global Environmental Change Henry Brittlebank
21
4.1.3. Data Concatenation and Layer Stacking
To aid further processing the individual spectral band files of each Landsat scene were concatenated
and written out into a multi-band data files. Landsat MSS bands 2-4 and Landsat ETM+ reflectance
bands 1-5 and 7-8 were used, while thermal band 6 (10.4-12.5 um) was excluded (figure 4.1). Each
scene could then be loaded as a ‘true colour composite’ as well as numerous ‘false colour
composites’ for detailed analysis and accurate land classification (figure 4.1).
4.1.4. Geo-registration of Landsat MSS Data
Landsat ETM+ data from 2003-2012 were all accurately geo-referenced and no geo-registration was
required. Landsat MSS data from 1973 and 1981 were geo-registered to the Landsat 2003 scene,
chosen as this was the only non-mosaic ETM+ dataset. In order to geometrically correct the satellite
data each Landsat MSS scene was geo-registered to the 2003 Landsat ETM+ image. Ground Control
Points (GCPs) were generated from common points (Jha et.al 2000) in the 2003 image and over 60
GCPs were created for both the MSS scenes with an RMS error of: 1973 – 0.462132, 1981 –
0.449332. Both MSS scenes were then warped (figure 4.2) using the resampling, scaling and
translation (RST) function with a nearest neighbour resampling method. Geo-registration of MSS
data provided geo-referenced Landsat scenes from 1973 and 1981 which could be accurately
compared with Landsat ETM+ data (figure 4.2).
Figure 4.1: Landsat 2003 multi-band file with a false colour composite (bands 4,3,2) image
displayed, WRS-2: path-144 row-53.
King’s College London, MSc Dissertation: Global Environmental Change Henry Brittlebank
22
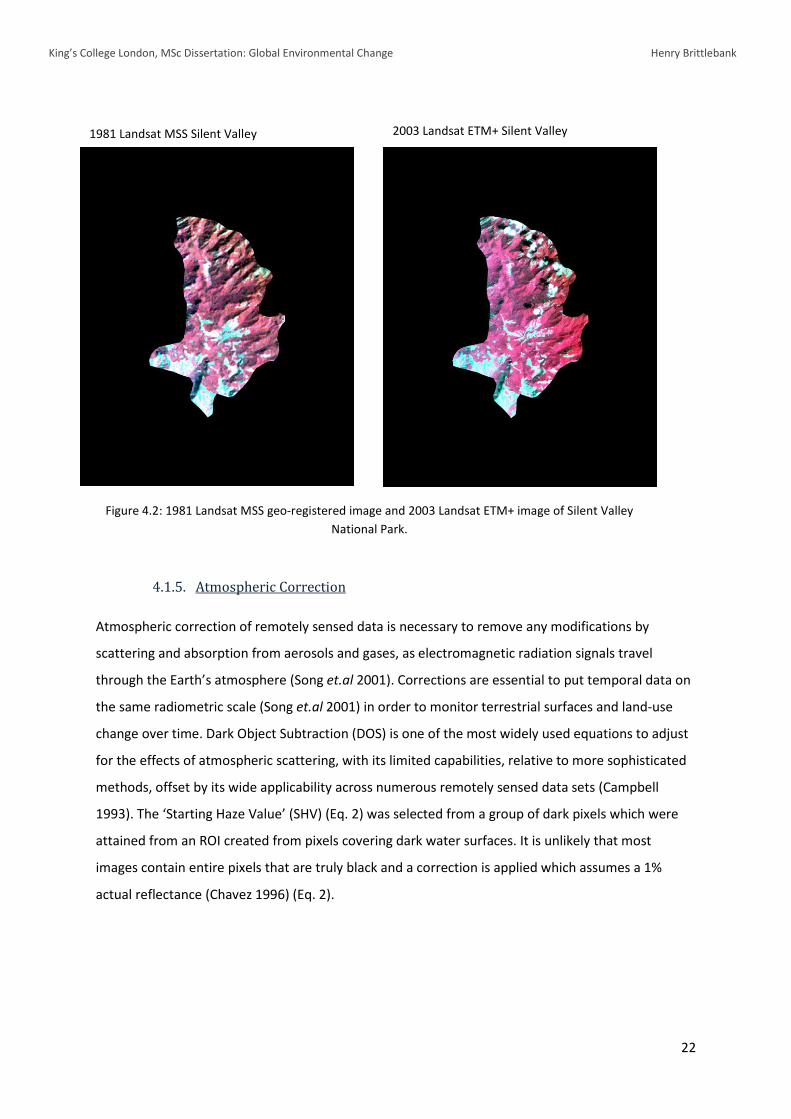
4.1.5. Atmospheric Correction
Atmospheric correction of remotely sensed data is necessary to remove any modifications by
scattering and absorption from aerosols and gases, as electromagnetic radiation signals travel
through the Earth’s atmosphere (Song et.al 2001). Corrections are essential to put temporal data on
the same radiometric scale (Song et.al 2001) in order to monitor terrestrial surfaces and land-use
change over time. Dark Object Subtraction (DOS) is one of the most widely used equations to adjust
for the effects of atmospheric scattering, with its limited capabilities, relative to more sophisticated
methods, offset by its wide applicability across numerous remotely sensed data sets (Campbell
1993). The ‘Starting Haze Value’ (SHV) (Eq. 2) was selected from a group of dark pixels which were
attained from an ROI created from pixels covering dark water surfaces. It is unlikely that most
images contain entire pixels that are truly black and a correction is applied which assumes a 1%
actual reflectance (Chavez 1996) (Eq. 2).
Figure 4.2: 1981 Landsat MSS geo-registered image and 2003 Landsat ETM+ image of Silent Valley National Park.
2003 Landsat ETM+ Silent Valley 1981 Landsat MSS Silent Valley
King’s College London, MSc Dissertation: Global Environmental Change Henry Brittlebank
23
DOS converts the calculated LHaze value to at-sensor reflectance’s and subtracts it from the entire
image (Goslee 2011). This method was applied to every Landsat scene, for each spectral band, to
correct for any atmospheric impacts and allow for accurate comparisons of LUCC over time.
%1
22
%1
)
cos01.0))2.
LradSHVLb
d
ELaEq
haze
sun
−=
=π
θ
4.1.6. Landsat 7 ETM+ Scan-Line Correction Failure and Gap-Filling
On the 31st May 2003 the Landsat 7 ETM+ SLC failed causing line gaps in all Landsat scenes (Maxwell
et.al 2007). For the 2008 and 2012 datasets other Landsat scenes were acquired (table 3.1) to create
composite mosaics, providing consistent Landsat data that could be used to derive land-cover for
detailed regional assessment (Roy et.al 2010). The secondary scenes for gap-filling were selected as
close to the primary scene as possible to provide accurate and reflectively similar remote sensing
data, while also covering as much of the ‘absent’ pixels as possible. The Landsat USGS ‘Gap Phase
Statistic Calculator’ was used to calculate each scenes gap filling potential (USGS 2013.a) with over
95% mosaic image completion for both 2008 and 2012.
4.2. Classification
4.2.1. National Park Boundaries and Image Masking
The location and boundaries of Mudumalai and Silent Valley NP were acquired from ‘Protected
Planet’ (IUCN and UNEP-WCMC 2013), part of the ‘World Database on Protected Areas (WDPA) a
joint programme between the UN World Conservation Monitoring Centre (WCMC) and the
International Union for Conservation of Nature. The WDPA is the most complete dataset on the
world’s terrestrial PAs, providing freely accessible spatial and boundary data in the form of GIS
electronic maps (UNEP-WCMC 2013).
Eq. 2) a) 1% actual reflectance correction for SHV. b) the chosen DN value (SHV) used for DOS (Goslee 2011).
King’s College London, MSc Dissertation: Global Environmental Change Henry Brittlebank
24
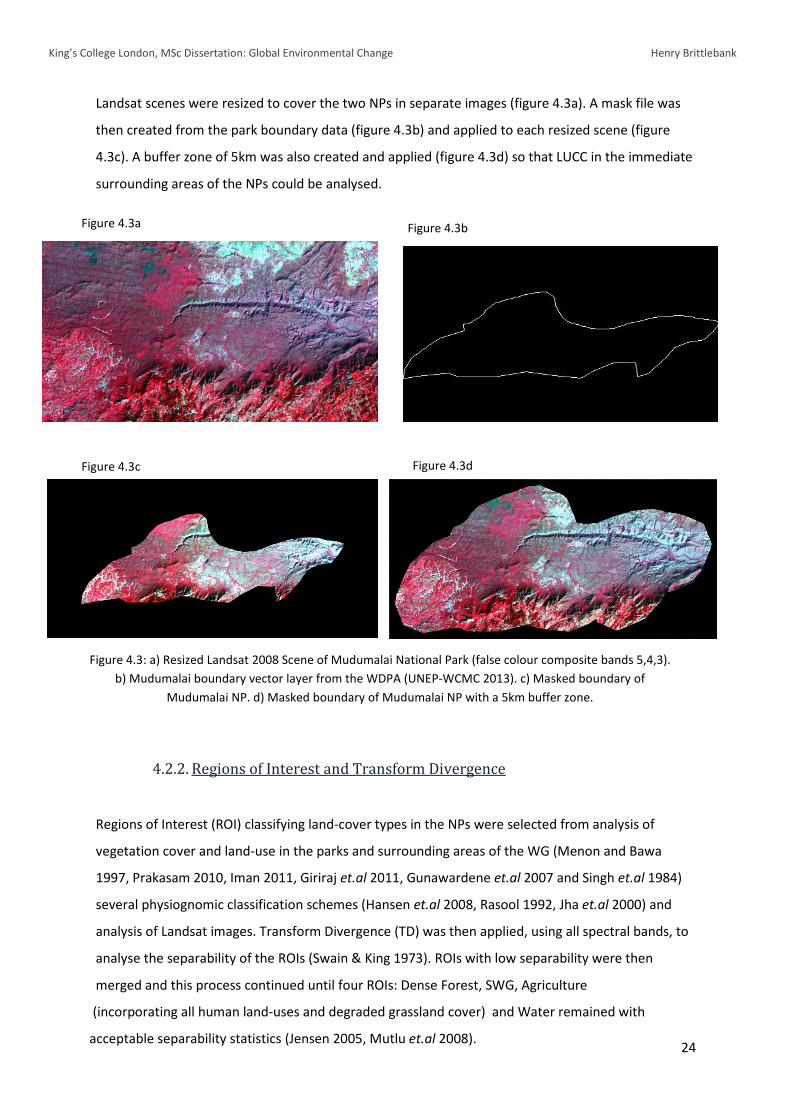
Landsat scenes were resized to cover the two NPs in separate images (figure 4.3a). A mask file was
then created from the park boundary data (figure 4.3b) and applied to each resized scene (figure
4.3c). A buffer zone of 5km was also created and applied (figure 4.3d) so that LUCC in the immediate
surrounding areas of the NPs could be analysed.
4.2.2. Regions of Interest and Transform Divergence
Regions of Interest (ROI) classifying land-cover types in the NPs were selected from analysis of
vegetation cover and land-use in the parks and surrounding areas of the WG (Menon and Bawa
1997, Prakasam 2010, Iman 2011, Giriraj et.al 2011, Gunawardene et.al 2007 and Singh et.al 1984)
several physiognomic classification schemes (Hansen et.al 2008, Rasool 1992, Jha et.al 2000) and
analysis of Landsat images. Transform Divergence (TD) was then applied, using all spectral bands, to
analyse the separability of the ROIs (Swain & King 1973). ROIs with low separability were then
merged and this process continued until four ROIs: Dense Forest, SWG, Agriculture
Figure 4.3a
Figure 4.3c Figure 4.3d
Figure 4.3b
Figure 4.3: a) Resized Landsat 2008 Scene of Mudumalai National Park (false colour composite bands 5,4,3). b) Mudumalai boundary vector layer from the WDPA (UNEP-WCMC 2013). c) Masked boundary of
Mudumalai NP. d) Masked boundary of Mudumalai NP with a 5km buffer zone.
(incorporating all human land-uses and degraded grassland cover) and Water remained with
acceptable separability statistics (Jensen 2005, Mutlu et.al 2008).

King’s College London, MSc Dissertation: Global Environmental Change Henry Brittlebank
25
4.2.3. Classification and Post Classification
Mudumalai and Silent Valley NP were then classified (figure 5.1, 5.4) using all spectral bands for each
of the Landsat scenes between 1973 and 2012. MLC provides a probabilistic method for recognizing
similarities between individual measurements and pre-defined standards (classes), these classes are
characterised by a vector of means on measurement variables and a variance-covariance matrix
which define the interrelationships among variables characteristic of the class (Strahler 1980).The
MLC algorithm processes large amounts of information on class membership characteristics for each
pixel (Foody et.al 1992) providing thematic classification maps for purposes such as land-use/land-
cover determination (Strahler 1980) and is widely used when there are few spectral bands available,
as for example with Landsat MSS and TM data (Jia & Richards 1994). Majority_Minority (M_M) post-
classification analysis was applied to 2008 and 2012 classified images, using a 3x3 kernel majority
value on SWG and Dense Vegetation. M_M analysis was used to minimise the effects of stripping
(Qian et.al 2005) due to the mosaicking of two scenes.
4.2.4. Accuracy Assessment
An Accuracy assessment in the form of a confusion matrix was applied to the 2012 classification
images to assess class accuracy. Random stratified sample regions were selected for each class,
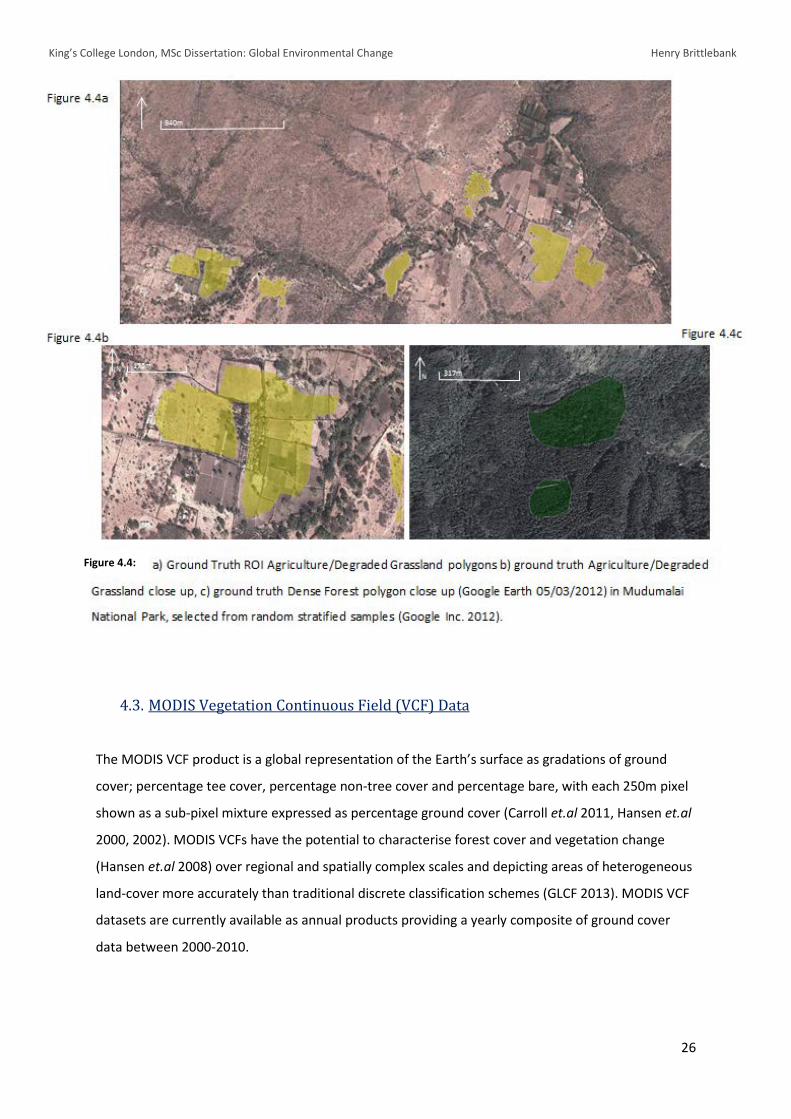
these points were imported into Google Earth and ground truth ROIs were created (figure 4.4) from
a 05/03/2012 Google Earth image file (Google Inc. 2012). Each ground truth polygon was then
imported into a GIS software, formatted into a geo-referenced shapefile which could be imported as
a ground truth ROI. A Confusion Matrix was then created for both Silent Valley and Mudumalai NPs,
from ground truth ROIs from 05/03/2012 compared with 01/03/2012 Landsat classified images.
King’s College London, MSc Dissertation: Global Environmental Change Henry Brittlebank
26
4.3. MODIS Vegetation Continuous Field (VCF) Data
The MODIS VCF product is a global representation of the Earth’s surface as gradations of ground
cover; percentage tee cover, percentage non-tree cover and percentage bare, with each 250m pixel
shown as a sub-pixel mixture expressed as percentage ground cover (Carroll et.al 2011, Hansen et.al
2000, 2002). MODIS VCFs have the potential to characterise forest cover and vegetation change
(Hansen et.al 2008) over regional and spatially complex scales and depicting areas of heterogeneous
land-cover more accurately than traditional discrete classification schemes (GLCF 2013). MODIS VCF
datasets are currently available as annual products providing a yearly composite of ground cover
data between 2000-2010.
Figure 4.4:

King’s College London, MSc Dissertation: Global Environmental Change Henry Brittlebank
27
4.3.1. Generating regional MODIS VCF 250m Land-Cover Maps
MODIS VCF geotiff data files were acquired from the Global Land-Cover Facility Database (DiMiceli
et.al 2011) providing geo-referenced ground cover data for Southern India (figure 4.5a) between
2000-1010. Each VCF file was resized and masked to Mudumalai and Silent Valley NPs boundaries
(figure 4.5b,c) as well as a 5km buffer boundary for each of the National Parks, from the WGCD
(IUCN and UNEP-WCMC 2013). Each ‘percentage tree cover’ map for the NPs were then thresholded
into ground cover classes. VCF pixel classification was based on several physiognomic classification
schemes (Hansen et.al 2008, Rasool 1992, Jha et.al 2000) while also allowing for seasonal vegetation
and tree cover changes and comparisons with Landsat classification images. For Mudumalai National
Park, VCF pixels with 19% tree cover and above were classified as Dense Forest , 9-18% tree cover
was classified as SWG and 0-8% tree cover as Agriculture (figure 4.5d). Water pixels were included in
classification (VCF value of 200), but were treated as a non-land surface so were excluded from LUCC
analysis. For Silent Valley National Park VCF pixels were categorized into the same two classes as the
Silent Valley Landsat classification images, with 40-100% tree cover classified as Dense Forest and 0-
40% tree cover classified as Degraded Forest.
Figure 4.5: a) MODIS VCF 2008 % tree cover image file of South India. b) MODIS VCF 2008 Silent Valley NP masked image. c) MODIS VCF 2008 Mudumalai NP masked image. d) MODIS VCF 2008 Mudumalai masked classification.
Figure 4.5a Figure 4.5c
Figure 4.5b Figure 4.5d

King’s College London, MSc Dissertation: Global Environmental Change Henry Brittlebank
28
To analyse ground cover change and LUCC using VCF data, two separate VCF datasets were selected.
VCF data are annual composites and so are affected by annual variations in precipitation which can
influence vegetation cover (Krishnakumar et.al 2009, Pal & Al-Tabbaa 2011). Precipitation data from
the Indian Meteorological Department (IMD 2013) was used to analyse annual precipitation
variations which could be compared with the VCF files. The VCF data of Southern India during 2000
and 2008 were selected based on their similar annual precipitation values and VCF accuracy
compared with Landsat data. The 2000 and 2008 VCF classified images of Mudumalai and Silent
Valley NPs were then used to observe LUCC based on the MODIS VCF, over the 8 year period.
A Confusion Matrix for the 2008 VCF classifications of Mudumalai and Silent Valley NP provided
accuracy assessments of classifications. Ground Truth ROIs were selected using the same method for
Landsat Accuracy Assessments using the same Google Earth 05/03/2012 image file so that confusion
matrixes of Landsat and VCF data could be compared, and the differences in class accuracies
assessed.
4.3.2. VCF Land-Cover Maps Across the Western Ghats
To analyse LUCC in NPs and PAs throughout the Western Ghats, data from PAs in the region (table
3.1) with spatial boundary data was acquired from the WGCD (IUCN and UNEP-WCMC 2013). This
included 9 National Parks, 20 Wildlife Sanctuaries and 8 Tiger Reserves, with a total of 27 Protected
Areas, covering 2,349,952,603,326.93 meters2. The PAs were masked from the 2000 and 2008 VCF
files of Southern India. Pixels were thresholded into 4 ground cover classes, taken from the VCF
Mudumalai classifications and applied to all PAs. This provided LUCC and ground/vegetation cover
changes in PAs in the biodiversity hotspot region of the WG between 2000 and 2008 based on
MODIS VCF data.
King’s College London, MSc Dissertation: Global Environmental Change Henry Brittlebank
29
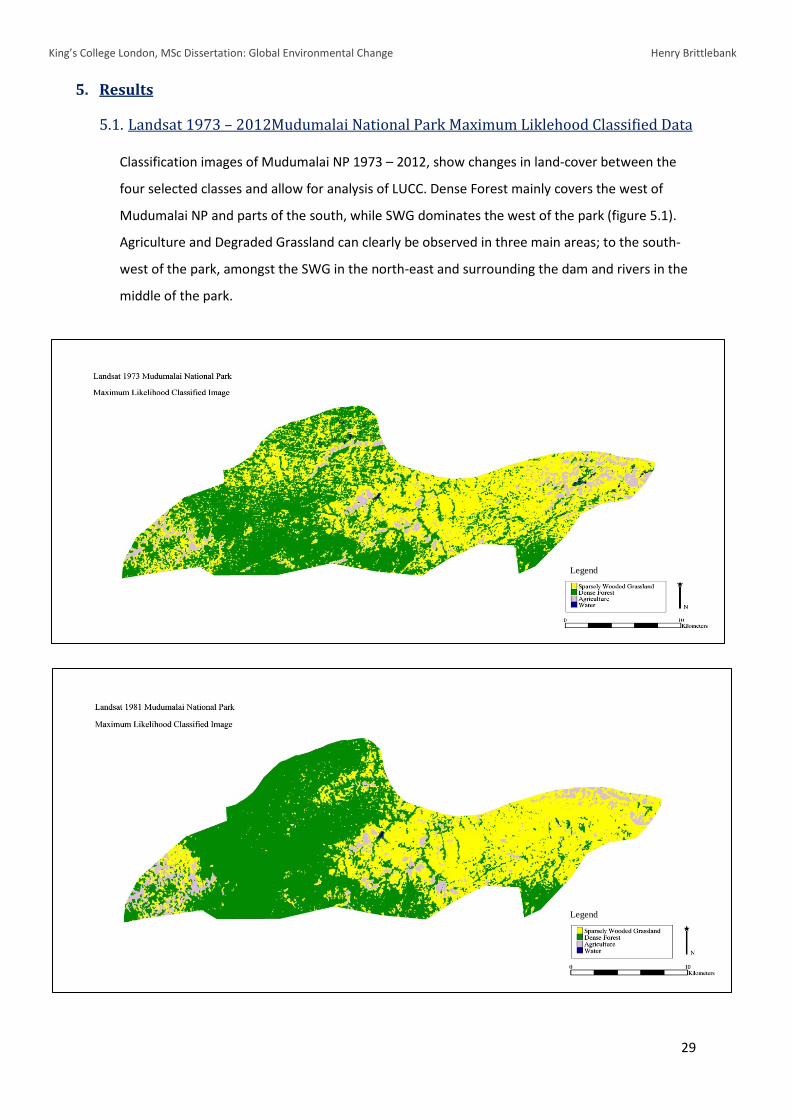
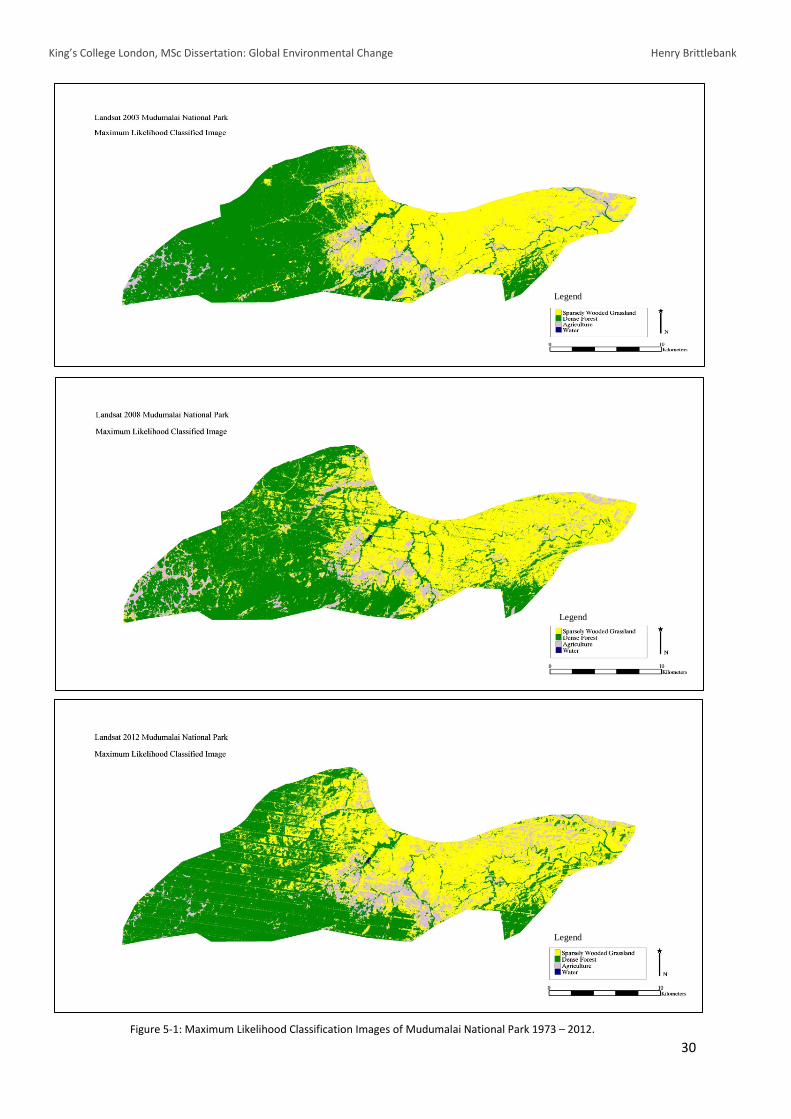
Classification images of Mudumalai NP 1973 – 2012, show changes in land-cover between the
four selected classes and allow for analysis of LUCC. Dense Forest mainly covers the west of
Mudumalai NP and parts of the south, while SWG dominates the west of the park (figure 5.1).
Agriculture and Degraded Grassland can clearly be observed in three main areas; to the south-
west of the park, amongst the SWG in the north-east and surrounding the dam and rivers in the
middle of the park.
Legend
5. Results
5.1. Landsat 1973 – 2012Mudumalai National Park Maximum Liklehood Classified Data
Legend
King’s College London, MSc Dissertation: Global Environmental Change Henry Brittlebank
30
Legend
Legend
Legend
Figure 5-1: Maximum Likelihood Classification Images of Mudumalai National Park 1973 – 2012.

King’s College London, MSc Dissertation: Global Environmental Change Henry Brittlebank
31
Land-use classification of the 5km buffer zone around Mudumalai NP shows the extension of
Agriculture from the surrounding unprotected areas and into the national park (figure 5.2). There
are also sections of Agriculture in the south of the buffer zone and a large agricultural area in the
north of the buffer zone, close to the park boundary. Dense Forest dominates throughout the south
and south-west within the park and buffer zone. SWG is found in the north-east of the park and
buffer zone which contains sporadic areas of Agriculture close to the park boundary. SWG is also
found in intermittent patches in the south and south-west amongst large areas of Dense Forest.
Figure 5-2: Landsat 1973 and 2012 MLC images of Mudumalai National Park and 5km buffer zone with the park boundary highlighted in red.

King’s College London, MSc Dissertation: Global Environmental Change Henry Brittlebank
32
-
10.00
20.00
30.00
40.00
50.00
60.00
70.00
1973 1981 2003 2008 2012
Prec
enta
ge T
otal
Lan
d Co
ver
Clas
s (%
)
Date of Landsat Data Collection
LUCC in Mudumalai National Park and 5km Buffer Zone Between 1973 - 2012 Based on Landsat MLC Data.
Dense Forest
Sparsely Wooded Grassland
Agriculture
Water
Figure 5-3: Chart showing class data of Mudumalai NP and 5km buffer zone for each Landsat classified image 1973 – 2012.
Table 5-1: Landsat class area data (m2) for Mudumalai NP.
King’s College London, MSc Dissertation: Global Environmental Change Henry Brittlebank
33
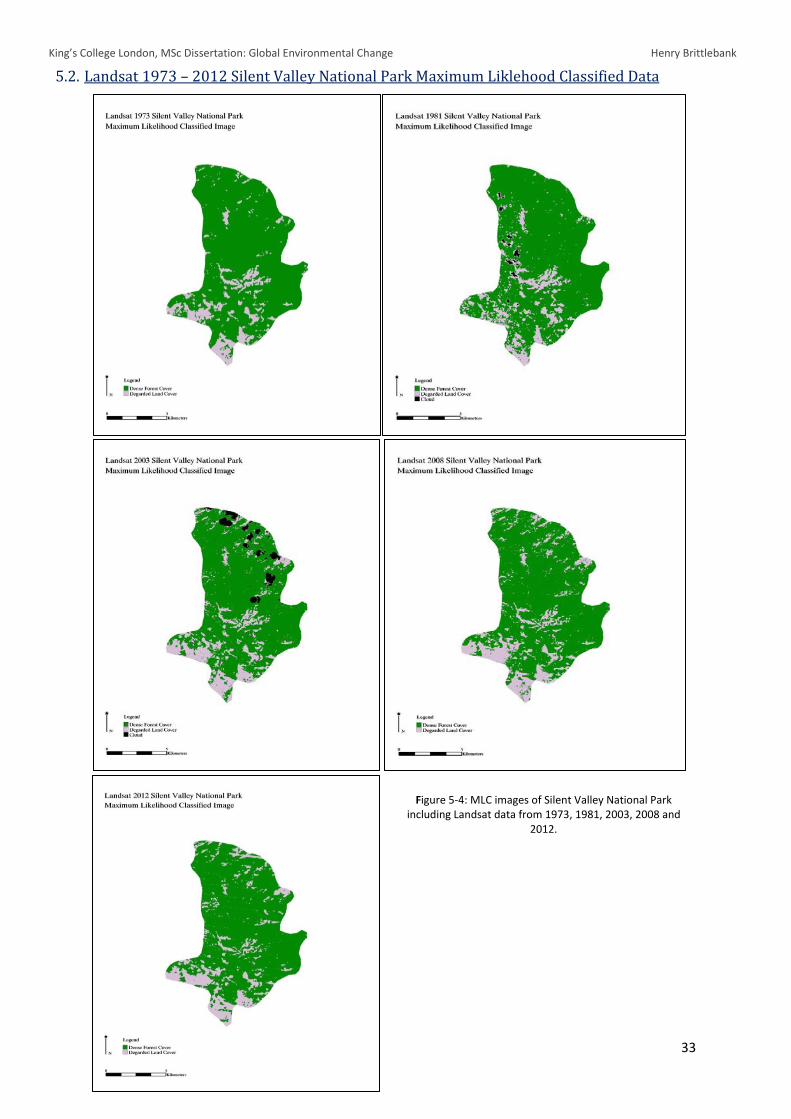
5.2. Landsat 1973 – 2012 Silent Valley National Park Maximum Liklehood Classified Data
Figure 5-4: MLC images of Silent Valley National Park including Landsat data from 1973, 1981, 2003, 2008 and
2012.
King’s College London, MSc Dissertation: Global Environmental Change Henry Brittlebank
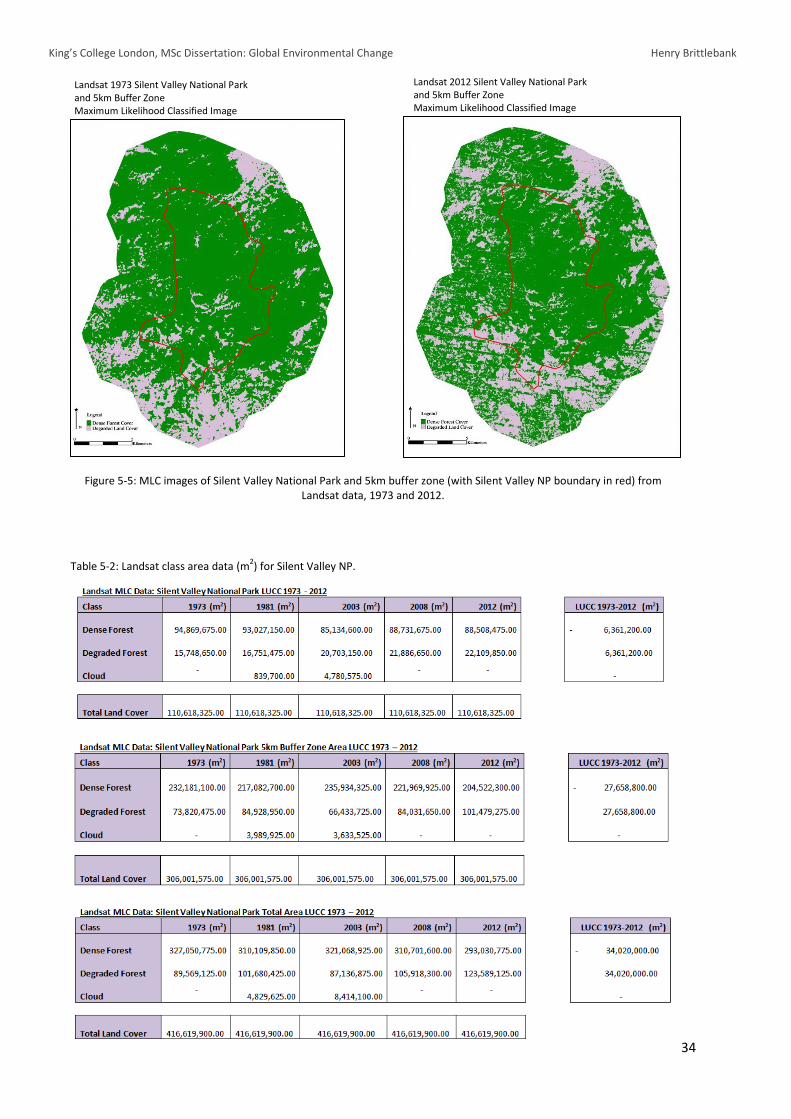
34
Landsat 1973 Silent Valley National Park and 5km Buffer Zone Maximum Likelihood Classified Image
Landsat 2012 Silent Valley National Park and 5km Buffer Zone Maximum Likelihood Classified Image
Figure 5-5: MLC images of Silent Valley National Park and 5km buffer zone (with Silent Valley NP boundary in red) from Landsat data, 1973 and 2012.
Table 5-2: Landsat class area data (m2) for Silent Valley NP.

King’s College London, MSc Dissertation: Global Environmental Change Henry Brittlebank
35
Classifications of Silent Valley NP provide evidence of degraded forest cover, focused in the centre
and to the south of the park with smaller and more intermitent patchs of degraded forest in the
north. (figure 5.4). Classification of Silent Valley’s buffer zone shows Degraded Forest cover focused
in the south with patchs in the north encroaching into the park. There is a decrease of Dense Forest
cover within the total classified area of -34,020,000.00 m2 between 1973 and 2012. Degarded forest
occurs more in the buffer zone (101,479,275.00 m2 / 33.16%) than within the park (22,109,850.00 m2
/ 199.98%) with a majority of degraded forest located near the park boundary. While cloud cover
does occur in the 1981 and 2003 Landsat images, these are seperately classified and statistcially
cover less than 2.1% in both images (figure 5.6).
-
10.00
20.00
30.00
40.00
50.00
60.00
70.00
80.00
90.00
1973 1981 2003 2008 2012
Perc
enta
ge T
otal
Lan
d Co
ver
Clas
s (%
)
Date of Landsat Data Collection
LUCC in Silent Valley National Park and 5km Buffer Zone Between 1973 - 2012 Based on Landsat MLC Data
Dense Forest
Degraded Forest
Cloud
Figure 5-6. Chart showing classification data of Landsat MLC images of Silent Valley National Park with a 5km buffer zone 1973 – 2012.

King’s College London, MSc Dissertation: Global Environmental Change Henry Brittlebank
36
5.3. Accuracy Assesment – Confusion Matricies of Landsat MLC Images
Accuracy assesments of both Mudumalai and Silent Valley NP 2012 classified images produce very
high classification accuracies. Classification data accurately portrays land-cover in both NPs and can
be used to evalute LUCC from 1973 to 2012. For Mudumalai NP Agriculture classed pixels have the
lowest accuracy (Users Acc. 86.45%) with a 13.55% error of comission. The rest of the Users Acc. and
Producers Acc. are over 90% with classification of Dense Forest and Water classes being especially
high, with a total Overall Acc. of 93.44% (figure 5.7).
Silent Valley NP has a very high Overall Acc. of 97.29%. Degraded Forest class pixels have a Users
Acc. of 99.57% (figure 5.7). Such a high classification accuracy is most likely due to the use of only
two classes, the high spectral sperability of the two classes and accurate ROI selection.
Figure 5-7: Accuracy Assessment for 2012 Maximum Likelihood Classification images of Mudumalai and Silent Valley National Parks.

King’s College London, MSc Dissertation: Global Environmental Change Henry Brittlebank
37
MODIS VCF 2000 Mudumalai National Park Classified Image
MODIS VCF 2008 Mudumalai National Park Classified Image
5.4 MODIS VCF Classified Data of Mudumalai National Park, 2000 - 2008
Figure 5-8: MODIS VCF 2000 and 2008 classified images of Mudumalai National Park based VCF %
tree cover data.
Table 5-3: MODIS VCF class area data (m2) for Mudumalai NP.

King’s College London, MSc Dissertation: Global Environmental Change Henry Brittlebank
38
5.5. MODIS VCF Classified Data of Silent Valley National Park, 2000 – 2008.
Figure 5-9: MODIS VCF 2000 and 2008 classified images of Silent Valley National Park based on VCF % tree cover data.
Table 5-4: MODIS VCF class area data (m2) for Silent Valley NP.

King’s College London, MSc Dissertation: Global Environmental Change Henry Brittlebank
39
MODIS VCF classifications show land-cover in Mudumalai and Silent Valley NP with LUCC between
2000-2008. Classification results use each pixels value of % tree cover to designate it to a pre-
classified class based on Landsat classification. Agriculture cover (0-8% tree cover) can be observed
mainly in the centre of the park and to the north-east mainly located in and amongst SWG. Dense
Forest (19-100%) and SWG 9-18% dominate the west and east areas of Mudumalai respectively with
the forest/grassland boundary located in the middle of the park, close to the only water pixel and
large areas of Agriculture. There is a decrease in Dense Forest between 2000-2008 of -47,061,858.70
m2 in the park, with increases of SWG and Agriculture at 41,879,295.84 m2 and 5,182,562.86 m2
respectively.
VCF classifications of Silent Valley highlight Degraded Forest cover in the south with smaller patches
throughout the north of the park. Between 2000-2008 there is an increase of Degraded Forest of
6,868,303.21 m2 to a total of 17,878,560.27 m2. There is even greater LUCC and increases in
Degraded Forest (48,707,280.02 m2) in the buffer zone of Silent valley NP with a total of
109,211,264.03 m2 in 2008.
King’s College London, MSc Dissertation: Global Environmental Change Henry Brittlebank
40
5.6. LUCC In National Parks and Wildlife Sanctuaries Across the Western Ghats Between 2000 - 2008, Based on MODIS VCF Data
Figure 5-10: MODIS VCF 2000 and 2008 classified images of protected areas across the Western Ghats (table 3.1) based on VCF % tree cover data.
MODIS VCF 2000 Classified Image of National Parks and Wildlife Sanctuaries in the Western Ghats
MODIS VCF 2008 Classified Image of National Parks and Wildlife Sanctuaries in the Western Ghats

King’s College London, MSc Dissertation: Global Environmental Change Henry Brittlebank
41
0.00
10.00
20.00
30.00
40.00
50.00
60.00
70.00
2000 2008
Perc
enta
ge T
otal
Lan
d Co
ver
Clas
s (%
)
Year of MODIS VCF Product
LUCC In National Parks and Wildlife Sanctuaries Across the Western Ghats Between 2000 - 2008, Based on MODIS VCF Data
Dense Forest (19-100% Forest Cover)
Sparsely Wooded Grassland (9-18% Forest Cover)
Agriculture (0-8% Forest Cover)
Water
Table 5-5: MODIS VCF class area data (m2) for protected areas across the Western Ghats (table 3.1).
Figure 5-11: Chart of MODIS VCF classification data with percentage land-cover class values for NP’s and WS’s across the Western Ghats, 2000 – 2008.

King’s College London, MSc Dissertation: Global Environmental Change Henry Brittlebank
42
LUCC in the selected NPs and WSs of the WG is contradictory to what would be expected based on
LUCC in Mudumalai and Silent Valley NP. For the total classified area in the WG between 2000 –
2008, LUCC of 768,351,070.60 m2 of Dense Forest, - 146,644,806.37 m2 of SWG and –
621,706,263.23 m2 of Agriculture occurred (table 5.5). This equates to an increase of Dense Forest
cover by 3.26% and a decrease of SWG and Agriculture/Degraded Grassland of 0.63% and 2.64%
respectively over the 8 year period (figure 5.11). Conversion of land-cover for SWG and Agriculture
to Dense Forest land-cover also occurred in the 5km buffer zone - 426,603,073.08 m2 compared with
341,747,997.53 m2 within the PAs.

King’s College London, MSc Dissertation: Global Environmental Change Henry Brittlebank
43
5.7. LUCC in National Parks and Wildlife Sanctuaries Across the Nilgiri Biosphere Reserve Between 2000 - 2008, Based on MODIS VCF Data
Table 5-6: MODIS VCF class area (m2) data for protected areas in the Nilgiri Biosphere Reserve.
Figure 5-12: MODIS VCF 2000 and 2008 classified images of protected areas in the NBR, based on VCF % tree cover data.
MODIS VCF 2000 Classified Image of National Parks and Wildlife Sanctuaries in the Nilgiri Biosphere Reserve
MODIS VCF 2008 Classified Image of National Parks and Wildlife Sanctuaries in the Nilgiri Biosphere Reserve
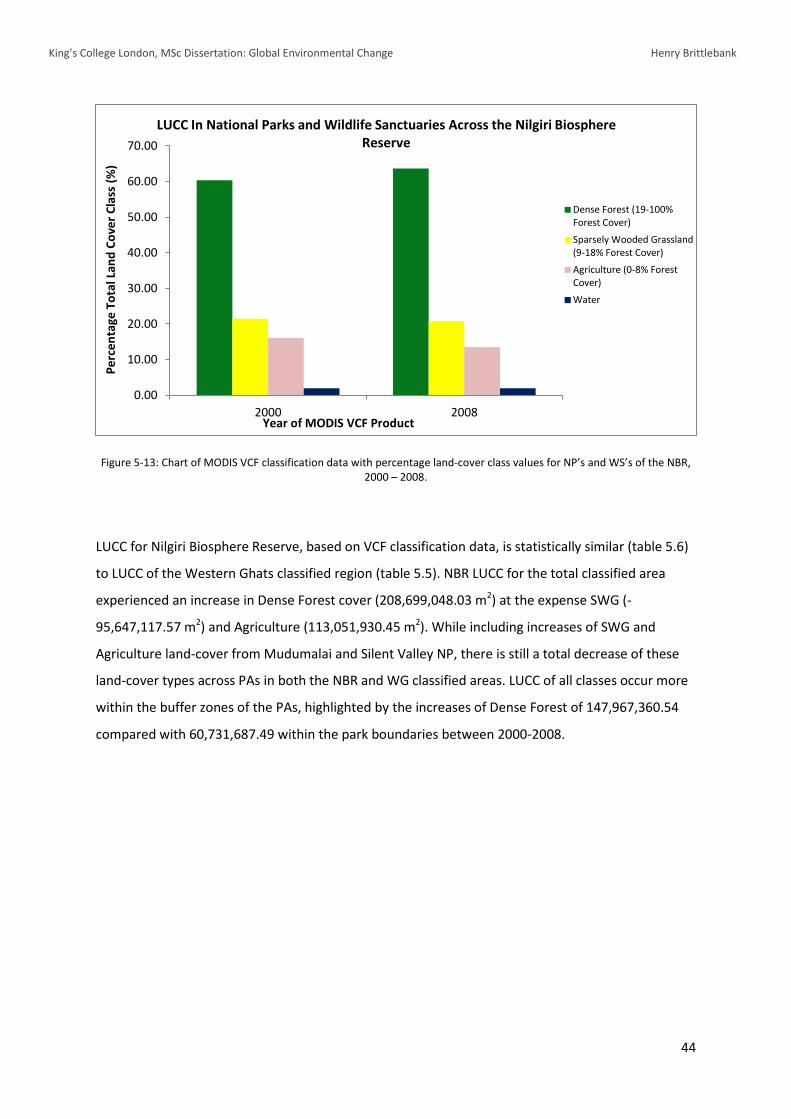
King’s College London, MSc Dissertation: Global Environmental Change Henry Brittlebank
44
Figure 5-13: Chart of MODIS VCF classification data with percentage land-cover class values for NP’s and WS’s of the NBR, 2000 – 2008.
LUCC for Nilgiri Biosphere Reserve, based on VCF classification data, is statistically similar (table 5.6)
to LUCC of the Western Ghats classified region (table 5.5). NBR LUCC for the total classified area
experienced an increase in Dense Forest cover (208,699,048.03 m2) at the expense SWG (-
95,647,117.57 m2) and Agriculture (113,051,930.45 m2). While including increases of SWG and
Agriculture land-cover from Mudumalai and Silent Valley NP, there is still a total decrease of these
land-cover types across PAs in both the NBR and WG classified areas. LUCC of all classes occur more
within the buffer zones of the PAs, highlighted by the increases of Dense Forest of 147,967,360.54
compared with 60,731,687.49 within the park boundaries between 2000-2008.
0.00
10.00
20.00
30.00
40.00
50.00
60.00
70.00
2000 2008
Perc
enta
ge T
otal
Lan
d Co
ver
Clas
s (%
)
Year of MODIS VCF Product
LUCC In National Parks and Wildlife Sanctuaries Across the Nilgiri Biosphere Reserve
Dense Forest (19-100% Forest Cover)
Sparsely Wooded Grassland (9-18% Forest Cover)
Agriculture (0-8% Forest Cover)
Water

King’s College London, MSc Dissertation: Global Environmental Change Henry Brittlebank
45
5.8. Accuracy Assesment – Confusion Matricies of MODIS VCF Classified Images
While Users Accuracy is high for most classes in both parks (SWG in Mudumalai is the anomaly with 58.33% accuracy), Producers Accuracies in the parks are varied with Agriculture and SWG at 70% accuracy in Mudumalai and Degraded Forest at 33.33% accuracy in Silent Valley. Total classification accuracies however are high for both parks, with accuracies of 76.47% for Mudumalai NP and 84.62% for Silent Valley NP.
Figure 5.14: Accuracy Assessment for 2008 MODIS VCF classified images of Mudumalai and Silent Valley National Parks.

King’s College London, MSc Dissertation: Global Environmental Change Henry Brittlebank
46
6. Discussion
6.1. LUCC in Mudumalai National Park
Classifications of Mudumalai NP (figure 5.1) accurately depict the distinctive vegetation cover from
dense (moist deciduous) forest to SWG (Gansen 1993) which is created by the strong rainfall
gradient from west to east. Land-use created by the small human population in the park has also
been clearly depicted (Agriculture Class) especially around the hydro-electric power stations near
Masinagudi village. One of the most noticeable LUCCs in Mudumalai NP is the expansion of
agriculture and human land-use around the river networks, small settlements and hydro-electric
power stations near the centre of the park (figure 5.1) with a total net increase of 10,937,025 m2
since 1973 (table 5.1). The increases in population suggested by Silori and Misha (2001) with the
combined pressures of tourism and agriculture in the 1970s and 80s are still currently causing LUCC
to a more human dominated landscape within the park. LUCC to agriculture in the north-east of the
park is more sporadic and spatially varied, symptomatic of land degradation caused by the impacts
of livestock grazing, fire and collection of NWFPs. Agriculture and Degraded-Grassland can also be
observed encroaching into the Dense Forest vegetation in the south-west of the park, with
significant LUCC in 2008 (figure 5.1). This trend of encroachment is not well represented in the 2012
classified image, partly affected by line stripping in the classification and by pixel mixing due to
vegetation diversity, interspersion and seasonal changes to forest tree cover shadowing the small
tracts of agricultural land (Friedl & Brodley 1997), underestimating agricultural land-cover in this
area. Classification accuracy for Mudumalai NP was high (total acc. 93.44%) however the Agriculture
class had a 13.55% error of commission, mainly from SWG pixels potentially leading to a slight over-
estimation of human land-use change. Despite the possibility of over-estimation there is still a clear
and continuous trend of agricultural expansion in Mudumalai NP providing evidence of growing
human activities and land uses within the park.
Another noticeable trend in Mudumalai NP is the continuous and steady state at which LUCC occurs.
Post-classification analysis shows a relatively continuous decrease in Dense Forest with increases in
Agriculture and SWG for each of the Landsat classified images (table 5.1). There are some
irregularities in LUCC between 1973 and 1981 such as an increase in Dense Forest of 17,668,350 m2
and a decrease in Agriculture of 2,090,250 m2, most likely due to the coarse and imprecise data from
the Landsat MSS Sensor. This is generally an accepted limitation when assessing LUCC from remote
sensing data as early as 1973. The expansion of SWG since 1981 (table 5.1) is mainly at the expense
King’s College London, MSc Dissertation: Global Environmental Change Henry Brittlebank
47
of Dense Forest vegetation cover to the west of the park (figure 5.1) with a total increase of
7,191,450 m2. LUCC trends in Mudumalai NP focus around the increase in Agriculture and human
land-uses mainly at the expense of SWG, which itself encroaches into the Dense Forests causing
decreases in Dense Forest cover. These trends are relatively constant and continuous in nature
providing strong evidence that such LUCC will continue in the future unless intervening action is
taken.
6.2. LUCC in Silent Valley National Park
Landsat classification images of Silent Valley NP highlight the expansion of degraded forest cover,
focused in the south and to the north/north-east, encroaching along park boundaries (figure 5.4).
Between 1973 – 2012 there was an overall increase of degraded forest cover of 6,361,200 m2. This
equates to a total of 5.75% in LUCC throughout the NP. Similar to the LUCC in Mudumalai NP, Silent
Valley LUCC is relatively consistent with constant increases in degraded forest for each Landsat
classified image. This provides evidence that forest disturbance and degradation has not occurred
due to any particular event or large change within the park but is a continuous process degrading
the forest vegetation gradually over time.
There is a distinctive isolated patch of degraded forest cover in the middle of the park, unlike any
other section of degraded forest as it does not clearly change in size or extent over time. It is
possibly a result of pre-dam construction which has been indefinitely postponed since 1984 (Singh
et.al 1984) or it may also be the result of increasing tourism in Silent Valley (KFWD 2013.b), however
the lack of spatial change suggests the former. Degraded forest encroaching in the north/north-east
of the park occurs sporadically, providing evidence of impermanent and un-systematic human land-
use such as livestock grazing, fires and collection of NTFP (KFWD 2013.b). To the south of the park
there are large sections of degraded forest cover, with LUCC and forest disturbance appearing more
systematic with large areas of change, indicative of plantations, cultivation, tourism and more
permanent land uses. While there are only two classes for the classifications of Silent Valley
providing less statistical data than Mudumalai, there is still clear evidence of LUCC and forest
disturbance within the park. The governments of India and the state of Kerala should take note on
not only the direct but in-direct impacts of hydro-electric power stations on LUCC and land
degradation in PAs, such as Mudumalai NP. Pre-dam construction has already caused forest
degradation in Silent Valley and a hydro-electric dam/power station in the park will only increase the
rate of LUCC and forest disturbance, which are already at significant levels.

King’s College London, MSc Dissertation: Global Environmental Change Henry Brittlebank
48
6.3. LUCC in the Buffer Zones of Mudumalai and Silent Valley National Parks
Land-cover and LUCC in the buffer zones around Mudumalai and Silent Valley are significantly
different than within the park boundaries. In 1973 degraded forest covered 24.12% of Silent Valley’s
buffer zone while Agriculture accounted for 12.00% of Mudumalai’s buffer zone, much higher levels
of human land-use than within the parks. In Silent Valley 27,658,800 m2 (9.04%) of land has changed
from Dense to Degraded Forest in the buffer area compared with 5.75% within the park boundary
since 1973. In 2012 29.66% of the total classified area around Silent Valley NP was degraded forest
(figure 5.6). Classification image stripping in 2012 (caused by Landsat’s SLC failure) (figure 5.5) causes
an under-estimation of degraded forest in the south, not fully highlighting the comprehensive areas
of degraded forest cover and slightly limiting the accuracy of LUCC detection in the park.
The most evident LUCC in Mudumalai NP buffer zone between 1973 and 2012 is the increase of SWG
(41,898,600 m2) mainly at the expense of Dense Forest (table 5.1, figure 5.3). Agriculture land-use
expands dramatically through the north-east section of the buffer zone, with smaller areas of
expanding Agriculture and SWG to the south and south-west of the buffer zone, encroaching into
Dense Forested areas. In 2012 14.39% of the buffer zone was classed as agriculture and while there
was only an increase of 2.3% over the 39 year period, agricultural land-cover still represents a large
proportion of the buffer zone. The increase of Agriculture and SWG have come at the expense of
Dense Forest which has decreased by 61,100,325 m2 in the buffer zone since 1973, covering 48.94%
of the total classified area in 2012 (figure 5.3).
Analysis of land-cover and LUCC within the PAs and in the surrounding buffer zones show that the
NPs are limiting development activities and human land-use expansion with the park boundaries.
Mudumalai is experiencing more LUCC than Silent Valley, which is to be expected due to parts of the
PA having WS protection status, human settlements and hydro-electric power stations. LUCC in
Mudumalai NP shows that the protection status of neighbouring Bandipur NP (to the north-west of
Mudumalai) is providing conservation support for natural vegetation cover and habitats in the NBR,
while the bordering PAs of Talaimalai FR, Nilgiri North FD and Wayanard WS are experiencing large
amounts of LUCC and deforestation rates along the borders of Mudumalai NP impacting on the
natural vegetation cover (figure 5.2). While there is less LUCC within the PAs than their
corresponding buffer zones, highlighting the conservation impacts PAs have, rates of LUCC with
increases in Agriculture and Degraded Forests along with decreases in Dense Forest cover are still
high. In the total classified areas, Silent Valley has experienced an increase of 34,020,000 m2 (8.17%)
in degraded forest while Mudumalai experienced an increase of 41,898,600 m2 (4.18%) and
King’s College London, MSc Dissertation: Global Environmental Change Henry Brittlebank
49
25,421,400 m2 (2.53%) in SWG and Agriculture respectively. An improved conservation effort,
management of human activity and land-use and continued monitoring of these NPs is essential to
maintain and improve the protection that the parks offer to the natural vegetation, habitats and
biodiversity within their boundaries.
6.4. Analysis of MODIS VCF Classified Data; Mudumalai and Silent Valley National Parks
Classifications using VCF data have accurately depicted land-cover and land-use in Mudumalai and
Silent Valley NP (figure 5.8, 5.9). By using Landsat high resolution classifications to aid and interpret
MODIS VCF data, land-cover has been accurately demarcated and provides similar land-cover spatial
characteristics to Landsat classifications (figure 5.1, 5.4). In Mudumalai NP the VCF 2008
classification shows the distinctive vegetation gradient of Dense Forest to Forest boundaries and
eventually SWG from west to east, and accurately highlights Agriculture and human land-use
(Landsat 2008 Mudumalai NP Agriculture = 36,033,975 m2, VCF 2008 Mudumalai NP Agriculture =
34,445,720 m2). Silent Valley NP VCF classification data (figure 5.9) also has similar spatial depictions
of land-use compared with Landsat classifications with Degraded Forest cover predominantly found
to the south, with patches in the north and a distinctive area in the centre of the park. There are also
significant statistical similarities between the two different classification datasets; Degraded Forest –
21,886,650 m2 (Landsat) and 17,878,560.27 m2 (VCF), Dense Forest cover of 88,731,675 m2 (Landsat)
and 93,482,325.38 m2 (VCF). LUCC detection of Mudumalai and Silent Valley using VCF data
between 2000 – 2008 also show trends that strongly correlate with Landsat classifications. The most
distinctive trends being decreases in Dense Forest (-47,061,858.70 m2) and increases in SWG
(41,879,293.84 m2) and Agriculture (5,182,562.86 m2) in Mudumalai and an increase of Degraded
Forest cover (6,868,303.21 m2) in Silent Valley.
Accuracy assessments in the form of a Confusion Matrix for Mudumalai and Silent Valley (figure
5.14) show a total accuracy for classification of land-cover at 76.47% and 84.62% respectively. While
these accuracies are significantly lower than Landsat classifications and can be seen as a clear
limitation, accuracies above 75% when analysing small areas (NPs) using global land-cover products,
are relatively high. In fact, accuracies of 76.47% and 84.62% show the ability of VCF GLCD to analyse
land-cover and LUCC. The accuracy in land-cover classification of Mudumalai and Silent Valley NPs
and the surrounding areas using VCF data, shows they have the ability to detect LUCC in NPs and
therefore can be used to accurately observe LUCC in numerous PAs over a much larger spatial scale,
such as the whole of the WG.
King’s College London, MSc Dissertation: Global Environmental Change Henry Brittlebank
50
6.5. LUCC in PAs of the Western Ghats and Nilgiri Biosphere Reserve using MODIS VCF Data.
LUCC between 2000-2008 in and around 9 NPs and 20 WSs across the WG provide evidence of
afforestation with increases of Dense Forest cover throughout the region. Within the PAs there is a
total increase in Dense Forest cover of 341,747,997.53 m2 at the expense of both SWG and
Agriculture, with even greater increases (426,603,073.08 m2) in the buffer zone creating a total
increase in Dense Forest of 768,351,070.60 m2. MODIS VCF data on LUCC when focused on the NBR
(figure 5.12) also shows an increase of Dense Forest 208,699,048.03 m2, with deceases in SWG
-95,647,117.57 m2 and Agriculture -113,051,930.45 m2 (table 5.6). Both Mudumalai and Silent Valley
NP show trends of deforestation with increases of SWG and Agriculture when using both Landsat
(1973-2012) and MODIS VCF (2000-2008) data. This supports research (Gunawardene et.al 2007, Jha
et.al 2000 and Chandrashekara & Ramakrishnan 1994) which provides evidence of deforestation and
increasing human land-uses in the WG. This is in stark contrast however to LUCC trends for the total
area of PAs in the region. LUCC detection from MODIS VCF classifications (figure 5.10, 5.12) provides
contradicting evidence of trends in afforestation and decreases in SWG and Agriculture for the total
land-cover in and around the PAs of the WG between 2000-2008.
While the majority of research on LUCC in India provides evidence of deforestation, most of this
research occurs before 2000, with Jha et.al (2000) providing one of the most comprehensive
datasets, still only for LUCC until 1995. More recent research (Bhat et.al 2001, Rudel et.al 2005)
provide evidence of LUCC in the form of afforestation in the past decade. VCF data on LUCC in the
WG and NBR supports recent research that suggests increasing demands for forest products
associated with income, population growth and previous rapid agricultural expansion has led to
increases in large scale plantations and rehabilitation programmes resulting in forest growth (Foster
& Rosenzwig 2003). Rudel et.al (2005) suggests that plantation and rehabilitation programmes are
mainly implemented by land-owners and farmers planting trees on their agricultural land. This
corroborates with LUCC data for both the WG and NBR where a majority of increases in Dense
Forest come from decreases in Agriculture and human land-uses (WG -621,706,264,23 m2, NBR -
113,051,930.00 m2) rather than SWG land-cover. Providing evidence that afforestation is coming
from changes in agricultural land and therefore most likely from plantations and re-forestation
programmes. Some errors in classification may occur when using VCF data as they are annual
composites and therefore affected by seasonal/annual variations in tree cover. There may also be
some inaccuracies caused from the designation of classes, for example anything above 19% tree

King’s College London, MSc Dissertation: Global Environmental Change Henry Brittlebank
51
cover was classified as Dense Forest. While these may provide limitations to the LUCC data from VCF
classifications and impact on the high levels of afforestation, trends of increasing Dense Forest cover
with decreases in SWG and Agriculture are clearly evident and appear too large to be the result of
any limitations from the use of MODIS VCF data.
While LUCC in the form of afforestation means that there are decreases in Agriculture land-cover in
and around many of the PAs in the WG, total Agriculture land-cover is relatively high for PAs with
IUCN II, IV statuses. For PAs in the NBR alone there is a total of 1,625,207,466.26 m2 (20.38%) of
Agriculture land-cover in 2008. Agriculture covers 3,177,198,333.67 m2 (13.50%) in and around the
PAs of the WG, despite recent levels of afforestation this is still a large proportion of total land-
cover. While afforested areas in the WG (figure 5.10) are classified as Dense Forest, it is very
important that these areas are not mistaken for natural vegetation cover. A majority of these
afforested areas are most likely plantations and secondary forests (Bhat et.al 2001) and therefore
under human management and created for the production of forested goods rather than
conservation. LUCC in the form of afforestation between 2000-2008 (figure 2.10) is positive for
conservation efforts in the WG and PAs throughout the region. However such trends are driven by
the increasing demand for forest products due to income and population growth which are
continuing to increase the pressure on natural vegetation cover and forests in the WG. Current
trends of afforestation are part of a much larger economic trend of increasing commercial demands
for resources throughout India which is resulting in large increases of human land-use. Plantations
and secondary forests themselves can be seen as a negative impact of human land-use on
biodiversity, natural/virgin vegetation cover and the natural habitats of numerous endemic flora and
fauna in the WGs.

King’s College London, MSc Dissertation: Global Environmental Change Henry Brittlebank
52
7. Project Limitations and Future Research
7.1. Project limitations
While post-classification analysis of multi-temporal data provides detailed and relatively accurate
statistics on LUCC and is one of the most popular methods of LUCC detection, there are still a
number of limitations impacting on the accuracy of results. Accuracy assessments for both
Mudumalai and Silent Valley 2012 Landsat classifications have a total classification accuracy of
93.44% and 97.29% respectively. While these are high for classification accuracies, miss-classified
pixels still represent 6.56% and 2.71% for Landsat classifications. The impacts of image stripping
resulting from methods to remove the impacts of Landsat 7 SLC failure after 2003, and the relatively
poor quality of MSS Sensor data, provide inherent limitations. These are however expected when
using Landsat remote sensing data and methods to mitigate these negative impacts on classifications
have been implemented. The use of only four land-cover classes for Mudumalai and two for Silent
Valley also limits analysis of LUCC, for example there is no distinction between human land-uses. The
use of a select number of classes was chosen however, so that classification accuracies would be
high and that the most apparent trends of LUCC would be clearly highlighted for further analysis and
interpretation.
The use of MODIS VCF data provides a number of limitations which are inherent when using GLCD,
most of which have been mentioned in the discussion of the MODIS VCF classifications. As a product
of a GLCD with a 250m spatial resolution, VCF classifications are less accurate than Landsat
classifications of Mudumalai and Silent Valley NP (figure 5.7, 5.14). Confusion Matrixes on MODIS
VCF classifications show the limitations in class accuracy, specifically of Degraded Forest in Silent
Valley NP.MODIS VCF accuracy assessments were also affected by the low number ground truth
pixels which was a result of MODIS VCFs low spatial resolution (250m). MODIS VCF classes were
based on the select few classes from Landsat data of the two parks. While this allows for analysis of
the most apparent and significant LUCC trends, natural vegetation cover present in other NPs in the
WG, such as Wetlands and Shola Grasslands will have been wrongly depicted as one of the four
classes from Mudumalai NP.
7.2. Future Research
A number of changes and improvements to future research could provide increased and more
detailed evidence of LUCC in PAs across the WGs. An increased buffer zone of 10 or 20km would
provide a more comprehensive overview of LUCC in the surrounding areas of the PAs. Further
King’s College London, MSc Dissertation: Global Environmental Change Henry Brittlebank
53
analysis of vegetation cover types in PAs other than Mudumalai and Silent Valley would create a
more inclusive set of land-cover classes for MODIS VCF data. Improved accuracies of VCF
classifications will also occur in the near future with the incorporation of areal proportions of life
form, leaf type and leaf longevity layers in VCF data in future product releases. While a majority of
PAs were accounted for a number of NPs and WSs were omitted as no spatial and boundary data
could be obtained. While this is not a direct limitation on the accuracy or validity of the project’s
results, incorporation of all PAs would provide a more comprehensive dataset and analysis of LUCC
in PAs of the WG.
The most unexpected trend in LUCC was that of the large levels of afforestation for the total
classified area of the 27 PAs. Further analysis into LUCC in specific parks where there are high levels
of afforestation would provide important research on a contentious topic of LUCC and deforestation
rates in the WG biodiversity hotspot. The spatial patterns of afforestation in PAs and their buffer
zones, the types of land-cover or land-use which are being afforested and the vegetation cover/tree
types which cover the afforested areas pose important questions for future research on LUCC in the
biodiversity hotspot.
8. Conclusion
Landsat and MODIS VCF classification data provides evidence of deforestation, with LUCC to SWG
and areas of Agriculture and human land-uses in Mudumalai NP and Degraded Forest cover in Silent
Valley NP. Increases of Agriculture particularly have led to the fragmentation of natural vegetation
cover which is negatively affecting the wildlife corridor of the NBR.
This project presents a methodology to map land-cover and detect LUCC in PAs of the WG region
using Global MODIS VCF data. The method demonstrates the ability of VCF data to provide accurate
detection of LUCC in selected areas from a much larger region, PAs in the WG. Post-classification
analysis of VCF data highlights the current trend of afforestation in a majority of the PAs. While
MODIS VCF classification data is currently less accurate than high-resolution Landsat classifications
and provides a simplified version of land-cover in the PAs, it allows for a relatively easy, quick, cost-
effective and accurate analysis of LUCC over vastly larger areas than a single Landsat scene could
provide. With new advancements and layers in VCF data providing more accurate and detailed land-
cover depictions, LUCC detection from MODIS VCF data will continue to develop, providing valuable
information and improving our understanding of land-cover changes to the Earth’s surface.

King’s College London, MSc Dissertation: Global Environmental Change Henry Brittlebank
i
References
Balakrishnan, M. (1984) The larger mammals and their endangered habitats in the Silent Valley forests of south India. Biological conservation, Vol. 29(3), pp. 277-286.
Bartholomé, E & Belward, A. (2005) GLC2000: a new approach to global land cover mapping from Earth observation data. International Journal of Remote Sensing, Vol. 26(9), pp. 1959-1977.
Bava, S. Das, A. Krishnaswamy, J. Karanth, K. Kumar, N & Rao, M. (2007) Ecosystem profile Western Ghats and Srilanka Biodiversity hotspots Western Ghats region. Critical Ecosystem Partnership Fund.
Bennett, G & Mulongoy, K. (2006) Review of experience with ecological networks, corridors and buffer zones. In Secretariat of the Convention on Biological Diversity, Montreal, Technical Series. No. 23, pages: 100.
Bhagwat, S. Kushalappa, C. Williams, P & Brown, N. (2005) The role of informal protected areas in maintaining biodiversity in the Western Ghats of India. Ecology and Society, Vol. 10(1) pp. 1 - 40.
Bhat, D. Murali, K & Ravindranath, N. (2001) Formation and recovery of secondary forests in India: a particular reference to Western Ghats in South India. Journal of Tropical Forest Science, Vol. 13(4), pp. 601-620.
Bossuyt, F. Meegaskumbura, M. Beenaerts, N. Gower, D. Pethiyagoda, R. Roelants, K & Milinkovitch, M. (2004) Local endemism within the Western Ghats-Sri Lanka biodiversity hotspot. Science, Vol. 306(5695), pp. 479-481.
Campbell, J. (1993) Evaluation of the dark-object subtraction technique for adjustment of multispectral remote-sensing data. Applications in Optical Science and Engineering, Vol. 176, pp. 176-188.
Carpenter, G. Gjaja, M. Gopal, S & Woodcock, C. (1997) ART neural networks for remote sensing: vegetation classification from Landsat TM and terrain data. Geoscience and Remote Sensing, Vol. 35(2), pp. 308-325.
Carroll, M. Townshend, J. Hansen, M. DiMiceli, C. Sohlberg, R & Wurster, K. (2011) Vegetative cover conversion and vegetation continuous fields. Land Remote Sensing and Global Environmental Change: NASA’s Earth Observing System and the Science of ASTER and MODIS. Springer-Verlag, Germany.

King’s College London, MSc Dissertation: Global Environmental Change Henry Brittlebank
ii
Chandrashekara, U & Ramakrishnan, P. (1994) Vegetation and gap dynamics of a tropical wet evergreen forest in the Western Ghats of Kerala, India. Journal of Tropical Ecology, Vol. 10(03), pp. 337-354.
Chape, S. Blyth, S. Fish, L. Fox, P & Spalding, M. (2003) United Nations list of protected areas. United Nations Environmental Programme, UK.
Chase, T. Pielke, R. Kittel, T. Nemani, R & Running, S. (2000) Simulated impacts of historical land cover changes on global climate in northern winter. Climate Dynamics, Vol. 16(2-3), pp. 93-105.
Chavez, P. (1996) Image base Atmospheric Correction Revisited and Improved. Photogrammetric Engineering & Remote Sensing, Vol. 62 (9), pp. 1025-1036.
Chen, X. Vierling, L. & Deering, D. (2005) A simple and effective radiometric correction method to improve landscape change detection across sensors and across time. Remote Sensing of Environment, Vol. 98, pp. 63–79.
Conservation International (2013.a) Western Ghats and Sri Lanka biodiversity hotspot. (Available at: http://www.cepf.net) [Accessed on: 18/08/2013).
Conservation International (2013.b) Conservation outcomes: Western Ghats (Available at: http://www.cepf.net) [Accessed on: 21/08/2013).
Das, A. Krishnaswamy, J. Bawa, K. Kiran, M. Srinivas, V. Kumar, N & Karanth, K. (2006) Prioritisation of conservation areas in the Western Ghats, India. Biological Conservation, Vol. 133(1), pp. 16-31.
DeFries, R. Hansen, M & Townshend, J. (2000) Global continuous fields of vegetation characteristics: a linear mixture model applied to multi-year 8 km AVHRR data. International Journal of Remote Sensing, Vol. 21(6-7), pp. 1389-1414.
DeSherbinin, A. (2002) A CIESIN thematic guide to land-use and land-cover change (LUCC). Centre for International Earth Science Information Network, Columbia University, USA.
DiMiceli, C. Carroll, M. Sohlberg, R. Huang, C Hansen, H & Townshend, J. (2011) Annual Global Automated MODIS Vegetation Continuous Fields (MOD44B) at 250 m Spatial R Mutli resolution for Data Years Beginning Day 65, 2000 - 2010, Collection 5 Percent Tree Cover, University of Maryland, College Park, MD, USA.
King’s College London, MSc Dissertation: Global Environmental Change Henry Brittlebank
iii
Federparchi (2013) Parks, Reserves, and other Protected Areas in India. (Available at: http://www.parks.it/world/IN/) [Accessed on: 5/08/2013].
Foley, J. DeFries, R. Asner, G. Barford, C. Bonan, G. Carpenter, S & Snyder, P. (2005) Global consequences of land use. Science, Vol. 309(5734), pp. 570-574.
Friedl, M & Brodley, C. (1997) Decision tree classification of land cover from remotely sensed data. Remote Sensing of Environment, Vol. 61(3), pp. 399-409.
Friedl, M. Sulla-Menashe, D. Tan, B. Schneider, A. Ramankutty, N. Sibley, A & Huang, X. (2010) MODIS Collection 5 global land cover: Algorithm refinements and characterization of new datasets. Remote Sensing of Environment, Vol. 114(1), pp. 168-182.
Foody, G. Campbell, N. Trodd, N & Wood, T. F. (1992) Derivation and applications of probabilistic measures of class membership from the maximum-likelihood classification. Photogrammetric Engineering and Remote Sensing, Vol. 58(9), pp. 1335-1341.
Foster, A & Rosenzweig, M. (2003) Economic growth and the rise of forests. The Quarterly Journal of Economics, Vol. 118(2), pp. 601-637.
Gadgil, M. Berkes, F & Folke, C. (1993) Indigenous knowledge for biodiversity conservation. Ambio, Vol. 22(2/3), pp. 151-156.
Ganesan, B. (1993) Extraction of non-timber forest products, including fodder and fuelwood, in Mudumalai, India. Economic Botany, Vol. 47(3), pp. 268-274.
Giriraj A. Murthy M and Basanta, S. (2011) Chapter 7: Evaluating Biodiversity and Spatial Simulation of Land-Cover Change in the Tropical Region of Western Ghats, India. In: Research in Biodiversity - Models and Applications, (Ed. Igor Ya.Pavlinov), InTech, USA.
GLCF, Global Land Cover Facility (2013) MODIS Vegetation Continuous Fields. (Available at: http://glcf.umd.edu/data/vcf/) [Accessed on: 15/07/2013].
GLOVIS (2013.a) USGS Global Visualisation Viewer. (Available at: http://glovis.usgs.gov/) [Accessed on: 25/05/2013].

King’s College London, MSc Dissertation: Global Environmental Change Henry Brittlebank
iv
GLOVIS (2013.b) USGS Global Visualisation Viewer: User Guide (Available at: http://glovis.usgs.gov/ ImgViewerHelp.shtml) [Accessed on: 29/05/2013].
Google Inc. 7.0.2.8415 (2012) Google Earth (Available through: http://www.google.co.uk/intl/ en_uk/earth /index.html) [Accessed on: 12/07/2013].
Goslee, S. (2011) Analyzing remote sensing data in R: the Landsat package. Journal of Statistical Software, Vol. 43(4), pp. 1-25.
Guha, R & Gadgil, M. (1989) State forestry and social conflict in British India. Past & Present, Vol. 123, pp. 141-177.
Gunawardene, N. Daniels, D. Gunatilleke, I. Gunatilleke, C. Karunakaran, P. Nayak, G & Vasanthy, G. (2007) A brief overview of the Western Ghats–Sri Lanka biodiversity hotspot. Current Science, Vol. 93(11), pp. 1567-1572.
Hansen, M. DeFries, R. Townshend, J and Sohlberg, R. (2000) Global land cover classification at 1km spatial resolution using a classification tree approach. International Journal of Remote Sensing, Vol.21, pp. 1331-1364.
Hansen, M. Sohlberg, R. Dimiceli, C. Carroll, M. DeFries, R and Townshend, J. (2002). Towards an operational MODIS continuous field of percent tree cover algorithm: Examples using AVHRR and MODIS data. Remote Sensing of Environment, Vol. 83(1-2), pp. 303-319.
Hansen, M. DeFries, R. Townshend, J. Carroll, M. Dimiceli, C and Sohlberg, R. (2003) Global Percent Tree Cover at a Spatial Resolution of 500 Meters: First results of the MODIS Vegetation Continuous Fields Algorithm. Earth Interactions, Vol. 7(10) pp. 1–15.
Hansen, M. Roy, D. Lindquist, E. Adusei, B. Justice, C & Altstatt, A. (2008) A method for integrating MODIS and Landsat data for systematic monitoring of forest cover and change in the Congo Basin. Remote Sensing of Environment, Vol. 112 (5), pp. 2495-2513.
Hegde, R & Enters, T. (2000) Forest products and household economy: a case study from Mudumalai Wildlife Sanctuary, Southern India. Environmental Conservation, Vol. 27(03), pp. 250-259.
Herold, M. Woodcock, C. Cihlar, M. Wulder, M. Arino, O. Achard, F & Sessa, R. (2009). Assessment of the status of the development of the standards for the Terrestrial Essential Climate Variables: T9 Land Cover. FAO, GTOS report. Italy.
King’s College London, MSc Dissertation: Global Environmental Change Henry Brittlebank
v
India Meteorological Department IMD (2013) India, Ministry of Erath Science, Government of India. (Available at: http://www.imd.gov.in/) [Accessed on: 10/06/2013].
Imam, E. (2011) Mapping of landscape cover using remote sensing and GIS in Chandoli National Park, India. Momona Ethiopian Journal of Science, Vol. 3(2) pp. 78-92.
ITM, Institute of tropical Meteorology (2013) Instrumental Rainfall Series of the Indian Regions (1813-2006) (Available at: http://www.tropmet.res.in) [Accessed on: 5/7/2012].
IUCN and UNEP-WCMC (2013) The World Database on Protected Areas (WDPA) [Online]. Cambridge, UK: UNEP-WCMC. (Available at: www.protectedplanet.com) [Accessed on: 24/06/2013].
Jensen, R. (2005) Introductory digital image processing: A remote sensing perspective (3rd ed.). Prentice Hall. New Jersey.
Jha, C. Dutt, C & Bawa, K. (2000) Deforestation and land use changes in Western Ghats, India. Current Science – Bangalore, Vol. 79(2), pp. 231-237.
Jia, X & Richards, J. (1994) Efficient maximum likelihood classification for imaging spectrometer data sets. IEEE Transactions on Geoscience and Remote Sensing, Vol. 32(2), pp. 274-281.
Karanth, K. Curran, L & Reuning-Scherer, J. (2006) Village size and forest disturbance in Bhadra Wildlife Sanctuary, western Ghats, India. Biological Conservation, Vol. 128(2), pp. 147-157.
Kerala Forests and Wildlife Department (KFWD.a) (2013) Silent Valley National Park. (Available at: http://forest.kerala.gov.in) [Accessed on 12/07/2013].
Kerala Forests and Wildlife Department (KFWD.b) (2013) Threats to the forests of Kerala. (Available at: http://web.archive.org) [Accessed on 15/07/2013].
Kodandapani, N. Cochrane, M & Sukumar, R. (2004) Conservation threat of increasing fire frequencies in the Western Ghats, India. Conservation Biology, Vol. 18(6), pp. 1553-1561.

King’s College London, MSc Dissertation: Global Environmental Change Henry Brittlebank
vi
Krishnakumar, K. Prasada Rao, G & Gopakumar, C. (2009) Rainfall trends in twentieth century over Kerala, India. Atmospheric environment, Vol. 43(11), pp. 1940-1944.
Lambin, E. Turner, B. Geist, H. Agbola, S. Angelsen, A. Bruce, J & Xu, J. (2001) The causes of land-use and land-cover change: moving beyond the myths. Global environmental change, Vol. 11(4), pp. 261-269.
Lambin, E. Geist, H & Lepers, E. (2003) Dynamics of land-use and land-cover change in tropical regions. Annual review of environment and resources, Vol. 28(1), pp. 205-241.
Lambin, E. & Linderman, M. (2006) Time series of remote sensing data for land change science. Geoscience and Remote Sensing, Vol. 44 (7), pp. 1926-1928.
Lepers, E. Lambin, E. Janetos, A. DeFries, R. Achard, F. Ramankutty, N & Scholes, R. (2005). A synthesis of information on rapid land-cover change for the period 1981–2000. BioScience, Vol. 55(2), pp. 115-124.
Lillesand, T. & Kiefer, R. (2004) (ed. 5). Remote sensing and image interpretation. John Wiley and Sons, USA.
Loveland, T. Reed, B. Brown, J. Ohlen, D. Zhu, Z. Yang, L & Merchant, J. W. (2000) Development of a global land cover characteristics database and IGBP DISCover from 1 km AVHRR data. International Journal of Remote Sensing, Vol. 21(6-7), pp. 1303-1330.
Malcolm, J. Liu, C. Neilson, R. Hansen, L & Hannah, L. (2006) Global warming and extinctions of endemic species from biodiversity hotspots. Conservation Biology, Vol. 20(2), pp. 538-548.
Manoharan, T. (1999) Silent valley: whispers of reason. Dept. in association with Kerala Forest Research Institute. India.
Mas, J. (1999) Monitoring land-cover changes: a comparison of change detection techniques. International Journal of Remote Sensing, Vol. 20(1), pp. 139-152.
Maxwell, S. Schmidt, G & Storey, J. (2007) A multi‐scale segmentation approach to filling gaps in Landsat ETM+ SLC‐off images. International Journal of Remote Sensing, Vol. 28(23), pp. 5339-5356.

King’s College London, MSc Dissertation: Global Environmental Change Henry Brittlebank
vii
Menon, S. and Bawa, K. (1997) Applications of geographic information systems, remote sensing, and a landscape ecology approach to biodiversity conservation in the Western Ghats. Current Science, Vol. 73, pp. 134-145.
Meyer, W & Turner, B. (1994). Changes in land use and land cover: a global perspective (Vol. 4). Cambridge University Press. UK.
Muchoney, D. Borak, J. Chi, H. Friedl, M. Gopal, S. Hodges, J. Morrow, N & Strahler, A. (2000) Application of the MODIS global supervised classification model to vegetation and land cover mapping of central America. International Journal of Remote Sensing, Vol. 21(6 – 7), pp. 1115 – 1138.
Mutlu, M. Popescu, S. Stripling, C & Spencer, T. (2008) Mapping surface fuel models using lidar and multispectral data fusion for fire behavior. Remote Sensing of Environment, Vol. 112(1), pp. 274-285.
National Remote Sensing Agency (NRSA) (2005) Natural Resources Census, National Landuse and Land Cover Mapping Using Multitemporal AWiFS Data (LULC – AWiFS), Project Manual, Remote Sensing & GIS Applications Area, National Remote Sensing Agency, Department of Space, Government of India, Hyderabad.
Pal, I. & Al-Tabbaa, A. (2011) Assessing seasonal precipitation trends in India using parametric and non-parametric statistical techniques. Theoretical and Applied Climatology, Vol. 103(1), pp. 1-11.
Pandit, M. Sodhi, N. Koh, L. Bhaskar, A & Brook, B. W. (2007) Unreported yet massive deforestation driving loss of endemic biodiversity in Indian Himalaya. Biodiversity and Conservation, Vol. 16(1), pp. 153-163.
Petit, C. Scudder, T & Lambin, E. (2001) Quantifying processes of land-cover change by remote sensing: resettlement and rapid land-cover changes in south-eastern Zambia. International Journal of Remote Sensing, Vol. 22(17), pp. 3435-3456.
Prakasam, C. (2010) Land use and land cover change detection through remote sensing approach: A case study of Kodaikanal taluk, Tamil nadu. International Journal of Geomatics and Geosciences, Vol 1(2), pp. 150-158.
Puyravaud, J. (2007) Forest degradation in the Western Ghats biodiversity hotspot: resource collection, livelihood concerns and sustainability. Current Science, Vol. 93(11), pp. 1573 - 1578.
Qian, Y. Zhang, K & Qiu, F. (2005) Spatial contextual noise removal for post classification smoothing of remotely sensed images. In: Proceedings of the 2005 ACM symposium on Applied computing pp. 524-528. ACM.
King’s College London, MSc Dissertation: Global Environmental Change Henry Brittlebank
viii
Ramesh, B. Menon, S and Bawa, K. (1997) A vegetation-based approach to biodiversity gap analysis in Agasthyamalai region, Western Ghats, India. Ambio, Vol. 28, pp. 529–536.
Rasool, S. (1992) Requirements for terrestrial biospheric data for IGBP CoreProjects. IGBP-DIS Working Paper #2, International Geosphere-Biosphere Programme — Data and Information Systems, Paris, France.
Reidsma, P. Tekelenburg, T. Van den Berg, M & Alkemade, R. (2006) Impacts of land-use change on biodiversity: An assessment of agricultural biodiversity in the European Union. Agriculture, ecosystems & environment, vol. 114(1), pp. 86-102.
Roy, D. Ju, J. Kline, K. Scaramuzza, P. Kovalskyy, V. Hansen, M & Zhang, C. (2010) Web-enabled Landsat Data (WELD): Landsat ETM+ composited mosaics of the conterminous United States. Remote Sensing of Environment, Vol. 114(1), pp. 35-49.
Richards, J & Tucker, R. P. (1988). World deforestation in the twentieth century. Duke University Press. USA.
Rudel, T. Coomes, O. Moran, E. Achard, F. Angelsen, A. Xu, J & Lambin, E. (2005) Forest transitions: towards a global understanding of land use change. Global Environmental Change, vol. 15(1), pp. 23-31.
Sala, O. Chapin, F. Armesto, J. Berlow, E. Bloomfield, J. Dirzo, R. Huber-Sanwald, E. Huenneke, L. Jackson, R. Kinzig, A. Leemans, R. Lodge, D. Mooney, H. Oesterheld, M. Poff, N. Sykes, M. Walker, B. Walker, M & Wall, D. (2000) Biodiversity: global biodiversity scenarios for the year 2100. Science, Vol. 287, pp. 1770–1774.
Semwal, R. Nautiyal, S. Sen, K. Rana, U. Maikhuri, R. Rao, K & Saxena, K. G. (2004) Patterns and ecological implications of agricultural land-use changes: a case study from central Himalaya, India. Agriculture, Ecosystems & Environment, Vol. 102(1), pp. 81-92.
Serneels, S. Linderman, M. & Lambin, E. (2007) A multilevel analysis of the impact of land use on interannual land-cover change in East Africa. Ecosystems, Vol. 10 (3), pp. 402-418.
Silori, C & Mishra, B. (2001) Assessment of livestock grazing pressure in and around the elephant corridors in Mudumalai Wildlife Sanctuary, south India. Biodiversity & Conservation, Vol. 10(12), pp. 2181-2195.
Sinha, S. Gururani, S & Greenberg, B. (1997) The ‘new traditionalist’ discourse of Indian environmentalism. The Journal of Peasant Studies, Vol. 24(3), pp. 65-99.
King’s College London, MSc Dissertation: Global Environmental Change Henry Brittlebank
ix
Singh, S. Saxena, A. Rawat, Y & Singh, J. S. (1984) India's Silent Valley and its threatened rain-forest ecosystems. Environmental Conservation, Vol. 11(3), pp. 223-233.
Singh, G, Babu, R. Narain, P. Bhushan, L & Abrol, I. (1992) Soil erosion rates in India. Journal of Soil and Water Conservation, Vol. 47(1), pp. 97-99.
Sivaramakrishnan, K. (1995) Colonialism and forestry in India: imagining the past in present politics. Comparative Studies in Society and History, Vol. 37(01), pp. 3-40.
Somanathan, H & Borges, R. (2000) Influence of exploitation on population structure, plant spacing and reproductive success in dioecious tree species within a fragmented cloud forest in India. Biological Conservation, Vol. 94, pp. 243–256.
Song, C. Woodcock, C. Seto, K. Lenney, M. and Macomber, S. (2001) Classification and Change Detection Using Landsat TM Data: When and How to Correct Atmospheric Effects? Remote Sensing Of Environment, Vol. 75, pp. 230-244.
Strahler, A. (1980) The use of prior probabilities in maximum likelihood classification of remotely sensed data. Remote Sensing of Environment, Vol. 10(2), pp. 135-163.
Sukumar, R. Dattaraja, H. Suresh, H. Radhakrishnan, J. Vasudeva, R. Nirmala, S & Joshi, N. (1992) Long term monitoring of vegetation in a tropical deciduous forest in Mudumalai, southern India. Current Science, Vol. 62(9), pp. 608-616.
Swain, P and King, R. C. (1973) Two Effective Feature Selection Criteria for Multispectral Remote Sensing. LARS Technical Reports. Paper 39. (Available at: http://docs.lib.purdue.edu/larstech/39).
Tamil Nadu Forest Department (2013) Wildlife Biodiversity: Mudumalai National Park and Wildlife Sanctuary. (Available at: http://www.forests.tn.nic.in) [Accessed on 1/08/2013]
Tewari, D. (1995) Western Ghats ecosystem. International Book Distributors, Dehra Dun, India.
Turner, B. Meyer, W & Skole, D. L. (1994) Global land-use/land-cover change: towards an integrated study. AMBIO-STOCKHOLM, Vol. 23, pp. 91-91.

King’s College London, MSc Dissertation: Global Environmental Change Henry Brittlebank
x
Turner, B. (2003) Toward integrated land-change science: Advances in 1.5 decades of sustained international research on land-use and land-cover change. Challenges of a Changing Earth pp. 21-26. Springer Berlin Heidelberg.
UNEP-WCMC (2013) Our Work, Protected Areas, World Database on Protected Areas. (Available at: http://www.unep-wcmc.org/world-database-on-protected-areas) [Accessed on: 24/06/2013)
UNESCO (2013.a) Western Ghats. (Available at: http://whc.unesco.org) [Accessed on: 03/08/2013].
UNESCO (2013.b) Biosphere Reserves – Learning Sites for Sustainable Development. (Available at: http://www.unesco.org) [Accessed on: 18/08/2013].
USGS (2013.a) Gap Phase Statistic Calculator (Available at: https://landsat.usgs.gov/gap_phase_tool.php) [Accessed on: 29/06/2013].
USGS (2013.b) Vegetation Continuous Fields Yearly L3 Global 250m - MOD44B. (Available at: https://lpdaac.usgs.gov/products/modis_products_table/mod44b) [Accessed on: 12/08/2013].
Vitousek, P. Mooney, H. Lubchenco, J & Melillo, J. (1997) Human domination of Earth's ecosystems. Science, Vol. 277(5325), pp. 494-499.
Wang, C. Menenti, M. Stoll, M. Belluco, E & Marani, M. (2007) Mapping mixed vegetation communities in salt marshes using airborne spectral data. Remote Sensing of Environment, Vol. 107(4), 559-570.
Wessels, K. Prince, S. Frost, P & Van Zyl, D. (2004) Assessing the effects of human-induced land degradation in the former homelands of northern South Africa with a 1 km AVHRR NDVI time-series. Remote Sensing of Environment, Vol. 91(1), pp. 47-67.
Wessels, K. Prince, S. Malherbe, J. Small, J. Frost, P & VanZyl, D. (2007) Can human-induced land degradation be distinguished from the effects of rainfall variability? A case study in South Africa. Journal of Arid Environments, Vol. 68(2), pp. 271-297.
Wildlife Institute of India (WII) (2013) Wildlife Protected Areas in Kerala State/Tamil Nadu State. (Available at: http://www.wii.gov.in) [Accessed on: 12/08/2013].
King’s College London, MSc Dissertation: Global Environmental Change Henry Brittlebank
xi
Xie, Y. Sha, Z. & Yu, M. (2008) Remote sensing imagery in vegetation mapping: a review. Journal of Plant Ecology, Vol. 1 (1), pp. 9-23.
Young, O. Lambin, E. Alcock, F. Haberl, H. Karlsson, S. McConnell, W & Verburg, P. (2006) A portfolio approach to analysing complex human-environment interactions: institutions and land change. Ecology and Society, vol. 11(2), pp. 31.
Yuan, F. Sawaya, K. Loeffelholz, B & Bauer, M. (2005) Land cover classification and change analysis of the Twin Cities (Minnesota) Metropolitan Area by multi-temporal Landsat remote sensing. Remote sensing of Environment, Vol. 98(2), pp. 317-328.
King’s College London, MSc Dissertation: Global Environmental Change Henry Brittlebank
xii
Appendix A.
Ethics and Risk Forms - Please see Attached.