
A Method for Evaluating Battery State of Charge...
46
A Method for Evaluating Battery State of Charge Estimation Accuracy Master’s Thesis in the Master Degree Programme, Systems, Control and Mechatronics FREDDY TRINH Department of Signals and Systems Division of Automatic Control CHALMERS UNIVERSITY OF TECHNOLOGY Gothenburg, Sweden 2012 Master’s Thesis EX080/2012
Transcript of A Method for Evaluating Battery State of Charge...
A Method for Evaluating Battery State of Charge Estimation Accuracy
Master’s Thesis in the Master Degree Programme, Systems, Control and Mechatronics
FREDDY TRINH
Department of Signals and Systems Division of Automatic Control CHALMERS UNIVERSITY OF TECHNOLOGY Gothenburg, Sweden 2012 Master’s Thesis EX080/2012

MASTER’S THESIS EX080/2012
A method for evaluating battery State of Charge Estimation accuracy
FREDDY TRINH
Department of Signals and Systems
Division of Automatic Control
CHALMERS UNIVERSITY OF TECHNOLOGY
Gothenburg, Sweden 2012

A method for evaluating battery State of Charge estimation accuracy
Freddy Trinh
© FREDDY TRINH, 2012
Master’s Thesis EX080/2012
Department of Signals and Systems
Division of Automatic Control
CHALMERS UNIVERSITY OF TECHNOLOGY
SE-412 96 Gothenburg
Sweden
Telephone +46(0)31-772 1000
Chalmers Reproservice
Gothenburg, Sweden 2012


A method for evaluating battery State of Charge estimation accuracy
FREDDY TRINH
Chalmers University of Technology
Department of Signals and Systems
Division of Automatic Control
ABSTRACT Battery State of Charge estimation is one of the key procedures in battery management
systems. An accurate State of Charge estimation can enhance the performance of the
battery and increase the security of the electric vehicle. The goal of this thesis was to
propose a method to evaluate the State of Charge estimation accuracy of an estimator
developed by Volvo Group Trucks Technology. The method is designed in such a way that
it can be adapted to any battery system. This thesis also describes the various
measurement errors and their effects on the proposed method and the overall State of
Charge estimation accuracy. Various tests and simulations in virtual test bench are
examined. In conclusion the proposed method works satisfactorily.
Keywords: battery, State of Charge, SoC, Open Circuit Voltage, OCV, estimator, evaluation
method, Kalman filter, electric vehicle


TABLE OF CONTENTS 1. Introduction .................................................................................................................................................. 1
1.1. Background .......................................................................................................................................... 1
1.2. Goal .......................................................................................................................................................... 1
1.3. Limitations ........................................................................................................................................... 2
1.4. Thesis Outline ..................................................................................................................................... 2
2. Basic Theory .................................................................................................................................................. 3
2.1. Energy Storage Systems ................................................................................................................. 3
2.2. Battery System .................................................................................................................................... 4
2.3. State of Charge .................................................................................................................................... 5
2.4. Equivalent Circuit Model ................................................................................................................ 6
3. Literature Survey ........................................................................................................................................ 7
4. Load Cycles .................................................................................................................................................... 9
4.1. Types of Load Profile ....................................................................................................................... 9
4.2. Hybrid Electric Vehicle .................................................................................................................. 10
4.3. Plug-In Hybrid Electric Vehicle .................................................................................................. 11
5. Measure For Determining The SoC Estimation Accuracy......................................................... 13
6. Virtual Test Bench..................................................................................................................................... 15
6.1. Battery Model .................................................................................................................................... 15
6.2. SoC Estimation Model .................................................................................................................... 15
6.3. Sensor Model ..................................................................................................................................... 16
6.4. Virtual Test Rig ................................................................................................................................. 17
6.5. Evaluation of SoC Estimates in A Test Rig ............................................................................. 18
7. The Proposed Method to Determine in A Battery system ...................................... 19
7.1. Finding an Accurate ....................................................................................................... 19
7.1.1. Error due to the voltage sensor ....................................................................................... 21
7.1.2. Error due to the temperature sensor ............................................................................ 23
7.1.3. Integration error due to the current sensor ............................................................... 24
8. Test Result in Virtual Test Bench ....................................................................................................... 27
8.1. Evaluation of The Proposed Method ....................................................................... 27
8.2. Evaluation of The SoC Estimator in A Virtual Test Rig .................................................... 30
9. Discussion and Conclusion .................................................................................................................... 33
10. Bibliography ........................................................................................................................................... 35

Appendix ................................................................................................................................................................ 37
A. Battery model specification ............................................................................................................. 37
B. K-curve...................................................................................................................................................... 38

1 Introduction
1. INTRODUCTION This Master’s thesis has been proposed and carried out at Volvo Group Trucks Technology
(Volvo GTT) in Gothenburg, Sweden. This chapter gives the background to why Volvo GTT
decided to initiate this thesis work.
1.1. BACKGROUND Batteries have benefited greatly from the technological advancement, enabling sufficient
power density for use in electric drive vehicles such as Hybrid Electric vehicles and Plug-
In electric vehicles. When compared to other battery technologies, lithium-ion (Li-Ion)
batteries has several advantages in various aspects, such as higher energy densities and
longer lifetimes. One of the key parameter that represents the available capacity in a
battery is the battery State-of-Charge (SoC). There are basically two main methods used in
SoC determination, i.e. measuring the battery open circuit voltage (OCV) and integrating
the current flow into and out of the battery pack (known as Coulumb Counting (CC)).
However, due to the driving conditions in electric drive vehicles SoC is relatively difficult
to determine accurately with the conventional methods mentioned above. In recent years,
many researchers and companies have therefore been working to improve the accuracy of
SoC estimates.
For this purpose Volvo GTT has developed a prototype battery system (BS). The system
consists of a battery management unit (BMU) and a number of Li-Ion batteries. The main
task of the BMU is to estimate and control the battery SoC using Extended Kalman Filters
(EKF). As the cell technology is very sensitive to overcharging, an incorrect estimation
could in the worst case lead to cell damage or even a fire. On the other hand, an accurate
estimation will provide advantages such as prolonged battery life and enhanced
performance, as well as increased vehicle efficiency.
Despite an extensive research on SoC estimation, there is little work reported on methods
to evaluate the SoC estimation accuracy for a real battery system. Most of the SoC
estimation accuracy evaluation methods found in the reports and technical releases are
more suited for a virtual test bench than for a real system.
1.2. GOAL The goal of this thesis project was to develop a general method for evaluating the SoC
estimation accuracy of an estimator developed by Volvo GTT.

State-of-Charge Estimation of Li-ion Batteries: Evaluation Methods 2
1.3. LIMITATIONS This thesis project will not consider the development of the software and algorithms, i.e.
the SoC estimator and the cell balancing algorithm, nor the selection and construction of
the BS. Additional factors during the evaluation such as ageing of the cells, ambient
temperature, BS-fatigue etc. are also excluded.
The thesis project considers only electrochemical energy storage technologies, as lithium
ion batteries, that are compatible with the BS.
1.4. THESIS OUTLINE In Chapter 2 the basic theory for the components in a battery system are presented. This
chapter provides the background material required for the readers to understand the
work carried out in this thesis
Chapter 3 presents three papers relevant for this thesis. The purpose is to compile the
different ideas behind the measures/methods that have been used to evaluate SoC
estimators. A brief summary of the discussed ideas in terms of the pros and cons are also
listed in the form of a table in Chapter 5.
Chapter 4 presents three different load cycles that are used to evaluate the developed SoC
estimator.
The proposed evaluation method is presented in Chapter 7 and the test simulations are
presented in Chapter 8.
Finally the conclusions are presented in Chapter 9.

3 Basic Theory
2. BASIC THEORY This section presents the basic theory of the contents of a BS. The first subsection presents
an overview of the different energy storage technologies for PHEVs and HEVs. The second
subsection gives an overview of a battery system while the final two subsections present
briefly the theory of battery state of charge (known as SoC) and the equivalent circuit
battery model
2.1. ENERGY STORAGE SYSTEMS An overview of different energy storage devices for HEV applications has been presented
by Conte, F. (2006). The studied devices consist of lead acid batteries, nickel metal hybrid
batteries (NiMH), lithium based batteries, and electric double layer capacitors. Figure 2.1
shows a plot of the above mentioned devices. It gives the specific energy and the specific
power relationship, and helps to identify the optimal operative range for each technology
(Gelso, 2012).
Commonly used battery technologies, such as lead acid batteries, suffer of problems of low
energy density. The adoption of such batteries for alternative vehicles like HEV is
therefore limited. As a result of this, Li-Ion batteries with higher energy density and
specific energy are more suitable (Conte, 2006).
FIGURE 2.1 DIFFERENT ENERGY STORAGE TECHNOLOGIES IN TERMS OF SPECIFIC ENERGY
AND POWER.

State-of-Charge Estimation of Li-ion Batteries: Evaluation Methods 4
2.2. BATTERY SYSTEM A Battery system, as shown in Figure 2.2, monitors the battery pack operations and
performs the safety steps in case of a hazardous event. First, the system measures the
voltage, current and temperature, and in some cases other quantities such as the pressure.
These parameters are processed and used as input parameters to the BMU, which relies on
mathematical models based on differential/difference equations and lookup tables. These
models are developed to estimate the state of battery in terms of the State of Charge, State
of Health, the State of Function etc. (Conte, 2006). A BMU also communicates with the
vehicle systems to control the charging/discharging, cell balancing, battery temperature,
etc.
FIGURE 2.2 A BLOCK DIAGRAM OF A BATTERY SYSTEM.
Acquisition:
v,i,T, etc.
Parameter
Estimation:
SoC, SoH, SoF
𝑉𝑚𝑎𝑥 𝑉𝑚𝑖𝑛
𝑇𝑚𝑎𝑥 𝑇𝑚𝑖𝑛
Battery Safety Supervisor:
Internal Short Circuit
etc.
Communication and other
systems
Battery management unit
5 Basic Theory
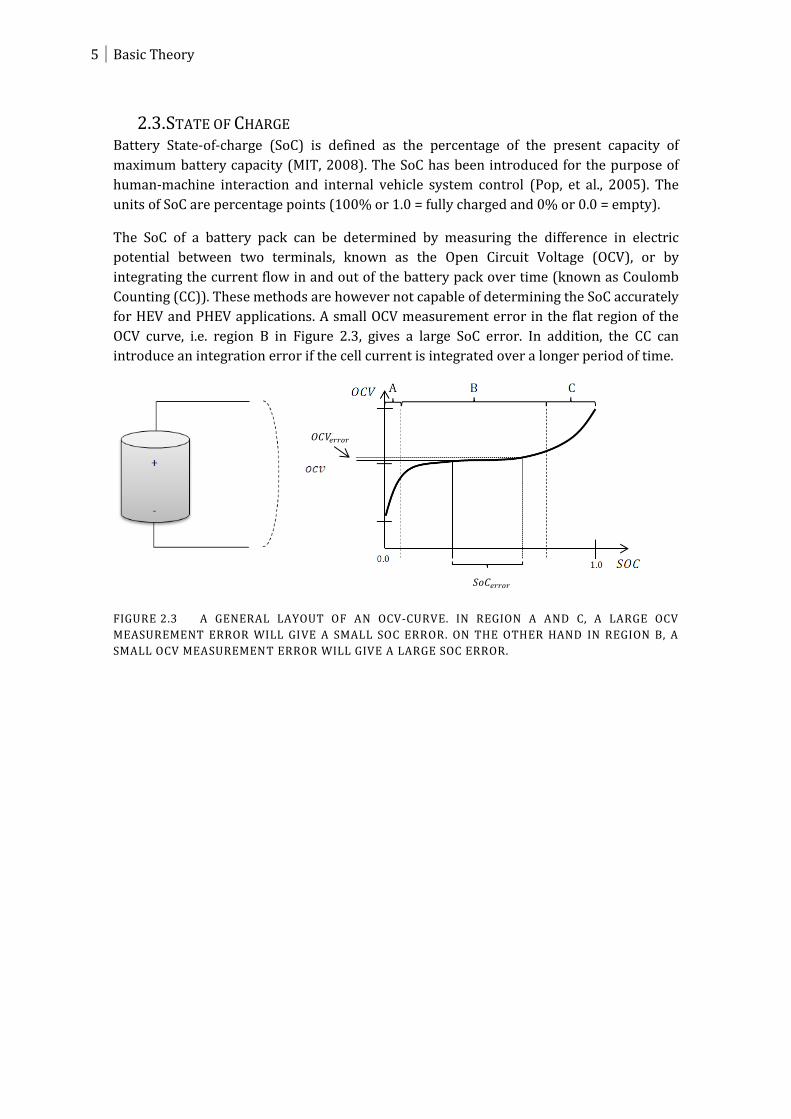
2.3. STATE OF CHARGE Battery State-of-charge (SoC) is defined as the percentage of the present capacity of
maximum battery capacity (MIT, 2008). The SoC has been introduced for the purpose of
human-machine interaction and internal vehicle system control (Pop, et al., 2005). The
units of SoC are percentage points (100% or 1.0 = fully charged and 0% or 0.0 = empty).
The SoC of a battery pack can be determined by measuring the difference in electric
potential between two terminals, known as the Open Circuit Voltage (OCV), or by
integrating the current flow in and out of the battery pack over time (known as Coulomb
Counting (CC)). These methods are however not capable of determining the SoC accurately
for HEV and PHEV applications. A small OCV measurement error in the flat region of the
OCV curve, i.e. region B in Figure 2.3, gives a large SoC error. In addition, the CC can
introduce an integration error if the cell current is integrated over a longer period of time.
FIGURE 2.3 A GENERAL LAYOUT OF AN OCV-CURVE. IN REGION A AND C, A LARGE OCV
MEASUREMENT ERROR WILL GIVE A SMALL SOC ERROR. ON THE OTHER HAND IN REGION B, A
SMALL OCV MEASUREMENT ERROR WILL GIVE A LARGE SOC ERROR.
𝑆𝑜𝐶𝑒𝑟𝑟𝑜𝑟
𝑂𝐶𝑉𝑒𝑟𝑟𝑜𝑟
State-of-Charge Estimation of Li-ion Batteries: Evaluation Methods 6
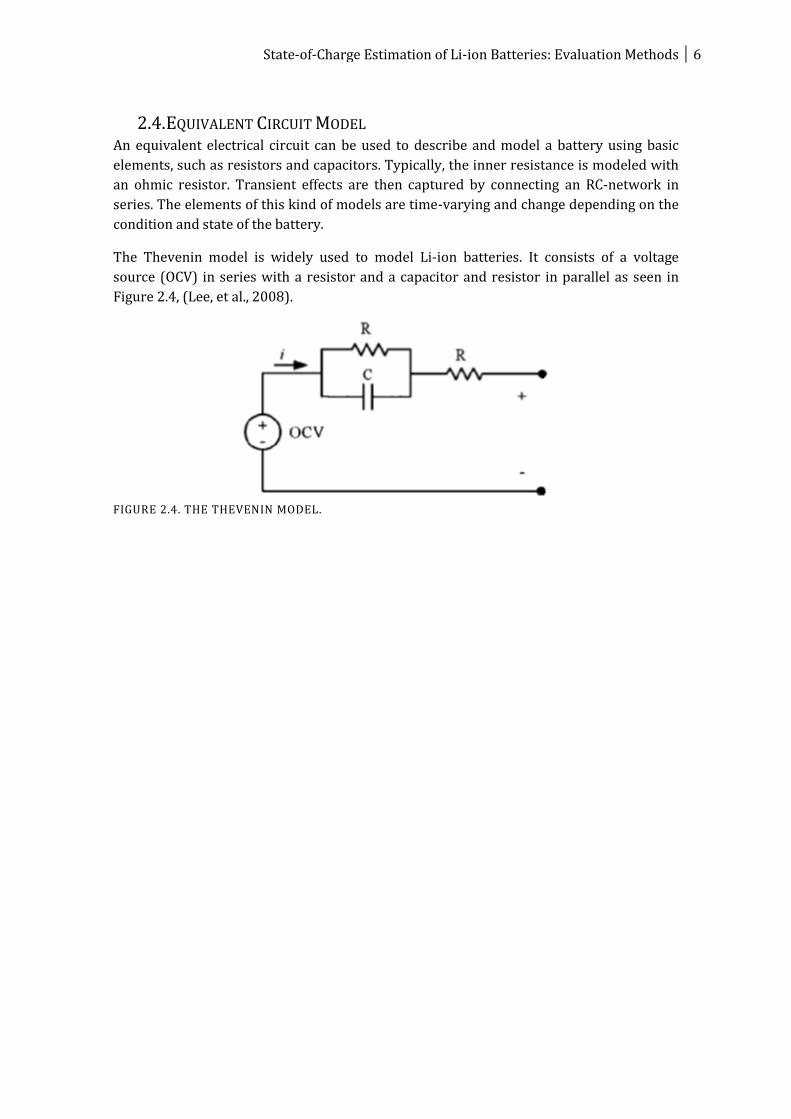
2.4. EQUIVALENT CIRCUIT MODEL An equivalent electrical circuit can be used to describe and model a battery using basic
elements, such as resistors and capacitors. Typically, the inner resistance is modeled with
an ohmic resistor. Transient effects are then captured by connecting an RC-network in
series. The elements of this kind of models are time-varying and change depending on the
condition and state of the battery.
The Thevenin model is widely used to model Li-ion batteries. It consists of a voltage
source (OCV) in series with a resistor and a capacitor and resistor in parallel as seen in
Figure 2.4, (Lee, et al., 2008).
FIGURE 2.4. THE THEVENIN MODEL.

7 Literature Survey
3. LITERATURE SURVEY This section presents three different references surveyed. The literature survey was done
to compile different ideas behind the methods that have been used to evaluate the SoC
estimator.
LITHIUM-ION BATTERY PARAMETER ESTIMATION FOR STATE-OF-
CHARGE
The objective of this paper (Mao, et al., 2011) is to develop and evaluate an onboard
adaptive observer that estimates battery parameters such as State-of-Charge. The paper
presents also an evaluation procedure which is carried out by simulating the estimator in
parallel with a battery model as reference. The results of the simulation are shown in the
presented paper. They are found to be satisfactory despite the presence of noise. It can
also be seen in the figures that the comparison of the SoCs is carried out after a rest period
at the end of each run. The purpose of the rest period is to acquire a more accurate
reference value, since it allows the OCV to converge to a steady state level.
THE COMPARATIVE STUDY OF STATE-OF-CHARGE ESTIMATION ON
EXTENDED KALMAN FILTER AND ADAPTIVE NEURO-FUZZY
ALGORITHMS
Another method to analyze the accuracy of an estimator is discussed by Wang Z. et al.
(2011). Two developed SoC estimators, the Extended Kalman Filter (EKF) and the
Adaptive Neuro-Fuzzy Inference System (ANFIS)1, are validated and run in parallel with a
generic battery model, which is used as a reference. The cell current test profile was
designed by the U.S. Department of Energy National Laboratory (Howell, 2010) , and is
called the Hybrid Pulse Power Characterization Test2.
However, Wang Z. et al. (2011) presented a method to measure the SoC estimation error of
the estimator. The measure is known as the average SoC estimation error and is defined
by,
EQUATION 3.1 ∑ | ( ) ( )|
∑
1 ANFIS is a combination of the Takagi_Sugeno fuzzy inference system and neural networks. 2 The purpose of Hybrid Pulse Power Characterization Test profile is to evaluate the total dynamic power and the energy capability over a device, e.g. PHEV or HEV.

State-of-Charge Estimation of Li-ion Batteries: Evaluation Methods 8
EVALUATION AND TEST OF A BMU FOR HYBRID ELECTRIC VEHICLES
In a thesis by Nejedly (2012) various test procedures to evaluate the SoC estimator are
discussed. One of the test procedures that is presented in the thesis is so called State-of-
Charge Accuracy. The procedure developed is used to determine the error of the estimated
SoC of an estimator at the end of a test drive without using the battery model as a
reference.
As shown in Figure 3.1, the procedure starts with a fully charged cell which is then cycled
using a given cell current profile as depicted in the figure. After a predefined time, , the
cell discharges with a constant current until the estimated SoC merges with the assumed
“true” SoC. The current is integrated in parallel. The merging occurs when the battery SoC
is closed to the end-point of the OCV curve, region A in Figure 2.3. In this region the
estimator can simply estimate SoC accurately by measuring the OCV. The difference
between the estimated SoC and the true SoC can accurately be calculated,
EQUATION 3.2 ( ) | ( ) ( )| | |
|( ( ) ( )) ∫
|
FIGURE 3.1 EVALUATION PROCEDURE DEPICTED IN (NEJEDLY, 2011), WHERE IS THE TIME
THE CONSTANT DISCHARGE PROCEDURE STARTS AND IS THE TIME THE ESTIMATED SOC
INTERSECTS THE TRUE SOC.
9 Load Cycles
4. LOAD CYCLES This chapter presents the load cycles used to evaluate the estimator in a virtual test bench.
The cycles have been selected with respect to the intended application of the system. The
cycles are shown later in this section. Note that load cycles differ between countries,
operators, vehicle configurations, etc. and there is no standard load cycle defined
(Hellgren, 2012).
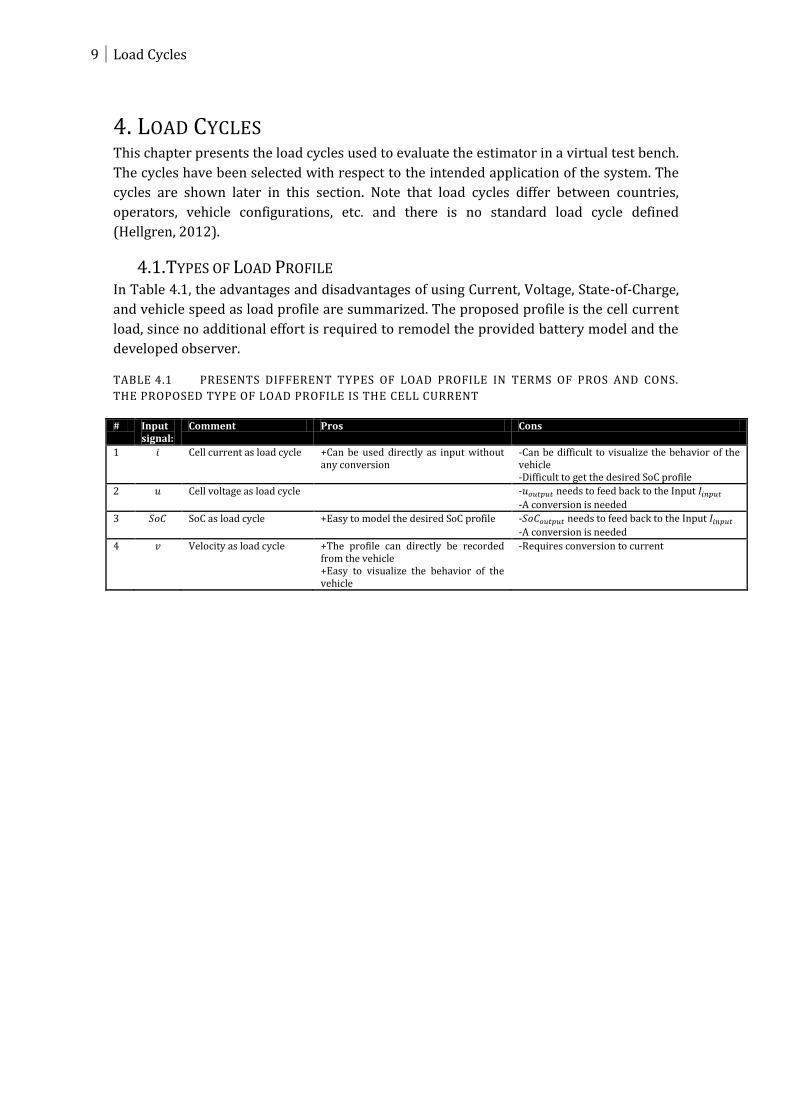
4.1. TYPES OF LOAD PROFILE In Table 4.1, the advantages and disadvantages of using Current, Voltage, State-of-Charge,
and vehicle speed as load profile are summarized. The proposed profile is the cell current
load, since no additional effort is required to remodel the provided battery model and the
developed observer.
TABLE 4.1 PRESENTS DIFFERENT TYPES OF LOAD PROFILE IN TERMS OF PROS AND CONS.
THE PROPOSED TYPE OF LOAD PROFILE IS THE CELL CURRENT
# Input signal:
Comment Pros Cons
1 Cell current as load cycle +Can be used directly as input without any conversion
-Can be difficult to visualize the behavior of the vehicle -Difficult to get the desired SoC profile
2 Cell voltage as load cycle - needs to feed back to the Input
-A conversion is needed
3 SoC as load cycle +Easy to model the desired SoC profile - needs to feed back to the Input
-A conversion is needed
4 Velocity as load cycle +The profile can directly be recorded from the vehicle +Easy to visualize the behavior of the vehicle
-Requires conversion to current
State-of-Charge Estimation of Li-ion Batteries: Evaluation Methods 10
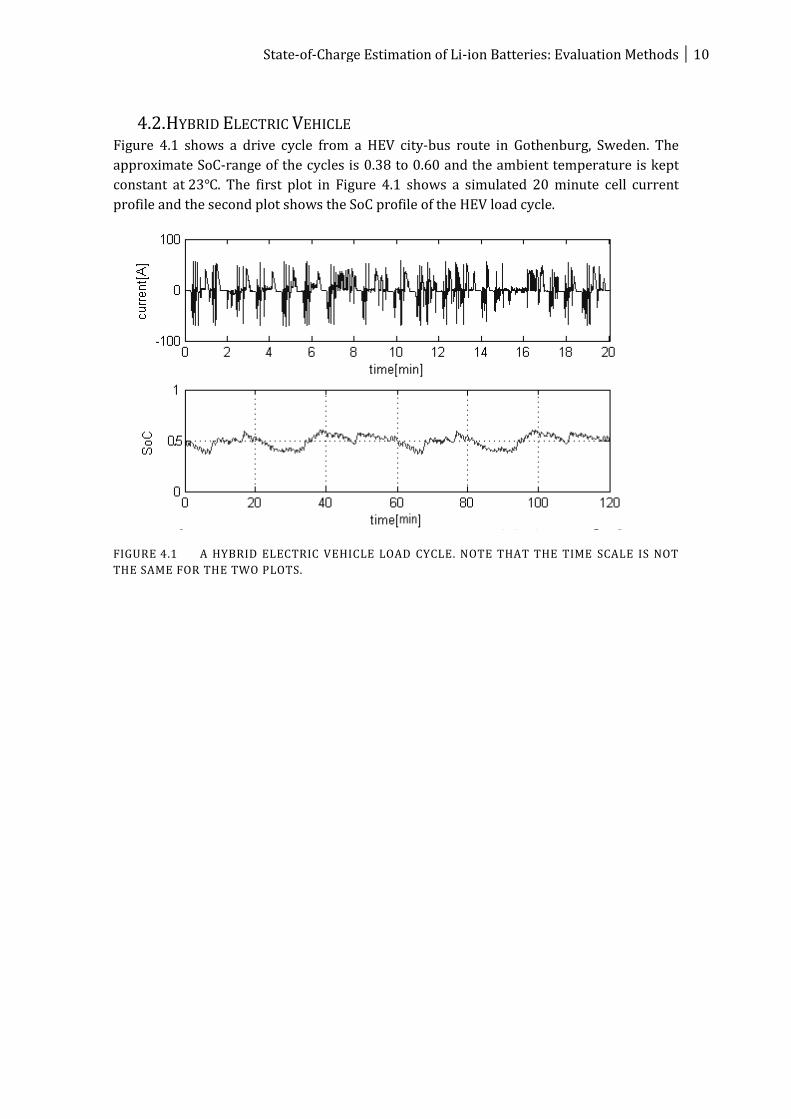
4.2. HYBRID ELECTRIC VEHICLE Figure 4.1 shows a drive cycle from a HEV city-bus route in Gothenburg, Sweden. The
approximate SoC-range of the cycles is 0.38 to 0.60 and the ambient temperature is kept
constant at . The first plot in Figure 4.1 shows a simulated 20 minute cell current
profile and the second plot shows the SoC profile of the HEV load cycle.
FIGURE 4.1 A HYBRID ELECTRIC VEHICLE LOAD CYCLE. NOTE THAT THE TIME SCALE IS NOT
THE SAME FOR THE TWO PLOTS.
11 Load Cycles
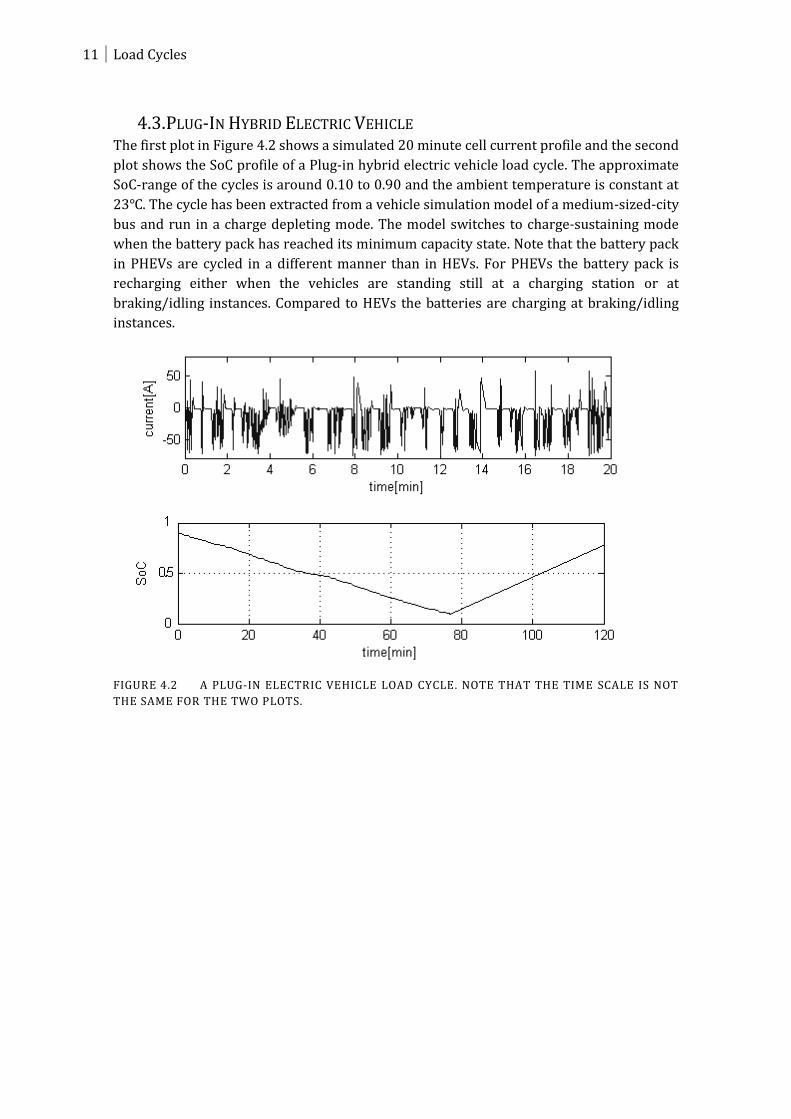
4.3. PLUG-IN HYBRID ELECTRIC VEHICLE The first plot in Figure 4.2 shows a simulated 20 minute cell current profile and the second
plot shows the SoC profile of a Plug-in hybrid electric vehicle load cycle. The approximate
SoC-range of the cycles is around 0.10 to 0.90 and the ambient temperature is constant at
. The cycle has been extracted from a vehicle simulation model of a medium-sized-city
bus and run in a charge depleting mode. The model switches to charge-sustaining mode
when the battery pack has reached its minimum capacity state. Note that the battery pack
in PHEVs are cycled in a different manner than in HEVs. For PHEVs the battery pack is
recharging either when the vehicles are standing still at a charging station or at
braking/idling instances. Compared to HEVs the batteries are charging at braking/idling
instances.
FIGURE 4.2 A PLUG-IN ELECTRIC VEHICLE LOAD CYCLE. NOTE THAT THE TIME SCALE IS NOT
THE SAME FOR THE TWO PLOTS.

State-of-Charge Estimation of Li-ion Batteries: Evaluation Methods 12

13 Measure For Determining The SoC Estimation Accuracy
5. MEASURE FOR DETERMINING THE SOC ESTIMATION
ACCURACY Table 5.1 presents four different SoC estimation error measures, denoted as .
is measured either as the mean with standard deviation, max error, final error or
root mean square error, and is carried out after each test run.
Note from the table that only the final error measure (the third measure) that does not
require a battery model to be applied. This measure makes use of the measured battery
OCV to determine the reference SoC at the end of a test run, see Figure 2.3.
The other three measures presented in the table, require a good battery model as
reference. If not, the result can be unreliable.
TABLE 5.1 METHODS TO MEASURE THE .
# Measure Comment Pros Cons
1
∑ | ( ) ( )|
Average
standard deviation (Sun, et al., 2011)
+Good to remove the outliers. + Gives the accuracy and precision of the estimator
-Only possible in a virtual environment, where the reference SoC is available at every time step -Requires many data points and the reference
2 | | Maximum error +Good to find the worst SoC estimate of a test run.
-The max error can be an outlier. -The reference SoC needs to be known at every time step - Is only efficient in virtual test bench
3 | ( ) ( )| Presented in (Mao, et al., 2011) The reference SoC ( ) is
determined by measuring the OCV of the battery after the rest time, see Section 3.
+Good when there is a bias in the estimate (the error either increases or decreases monotonically) +Need only the reference at the end of the test run.
-Can give an inaccurate
measurement in the linear part of the OCV
4
√
(( ( ) ( ))
( ( ) ( ))
)
RMSE, is a frequently used measure of the differences between an estimator and the actually observed value.
+Good when the variates are positive and negative
-Only possible for virtual environment, where the reference SoC is available at every time step -Requires many data points

State-of-Charge Estimation of Li-ion Batteries: Evaluation Methods 14
The measured errors (which are determined after a number of tests) can then be
weighted as the presented SoC estimation accuracy measures in Table 5.2. The SoC
estimation accuracy is denoted as and is
TABLE 5.2 THE SOC ESTIMATION ACCURACY MEASURES.
# Measure Comment Pros Cons
1 ∑
Calculates the mean and the
associated confidence interval, where the standard deviation is calculate using s
+Good when the standard deviation/accuracy of are the same or unknown
-Does not indicate the max error -Does not consider the standard deviation of the calculated .
2
∑
∑
√
∑
Calculates the weighted mean and the weighted standard deviation using the individual standard deviation Each has difference standard deviation
+This measure consider also the standard deviaton/accuracy of the , +Good when the standard deviation/accuracy of each SoC error is not the same
-Does not indicate the max error
3 ( ) Largest error +Indicates the worst -The value can be a outlier

15 Virtual Test Bench
6. VIRTUAL TEST BENCH Sections 6.1-6.3 present the battery and sensor models. These models are used in the
thesis to evaluate the SoC estimator, which is presented in section 6.2. The last section
discusses a procedure to evaluate the SoC estimation accuracy in different test rigs.
6.1. BATTERY MODEL A Li-Ion battery model, developed by Volvo GTT, is extensively used to elaborate the
method for evaluating the SoC estimation accuracy. The model is developed to predict the
response of the cell voltage to the cell current in the battery pack. It is designed to work
for both NiMH and Li-Ion batteries and the parameters are determined from a set of well-
defined measurements taken in-house at Volvo GTT (Groot & Lunden, 2006). The
specifications of the battery model are provided in Appendix A.
However, after several tests it is found that there is an error in the OCV curve (somewhere
at 0.75 SoC) of the battery model and can bias the evaluation.
6.2. SOC ESTIMATION MODEL A SoC estimator based on Extended Kalman Filters (EKF) is used to estimate the true SoC
in a battery cell. The EKF uses cell current, cell voltage and the cell temperature as input
variables (Gelso, 2012).
A Kalman Filter is a well-known method to estimate the state variables of dynamic
systems by means of a set of recursive equations, and it is optimal if the system is linear
and the noise is white and Gaussian. There are two main steps, first “Time Update”, and
then “Measurement Update”. In the time update, the states at the current time step are
estimated based on the states and their covariances from the previous time step. In the
measurement update, the measurement information at the current time step is considered
to refine the estimated states (Plett, 2004). The procedure is illustrated in Figure 6.1.
Due to the nonlinearities in the battery models, a nonlinear version of the Kalman Filter,
the so called Extended Kalman Filter, is used. The EKF linearizes the system at every time
step to approximate the nonlinear system (Plett, 2004).
FIGURE 6.1 THE ONGOING DISCRETE KALMAN FILTER CYCLE.
Time Update
(“Predict”)
Measurement Update
(“Correct”)
State-of-Charge Estimation of Li-ion Batteries: Evaluation Methods 16
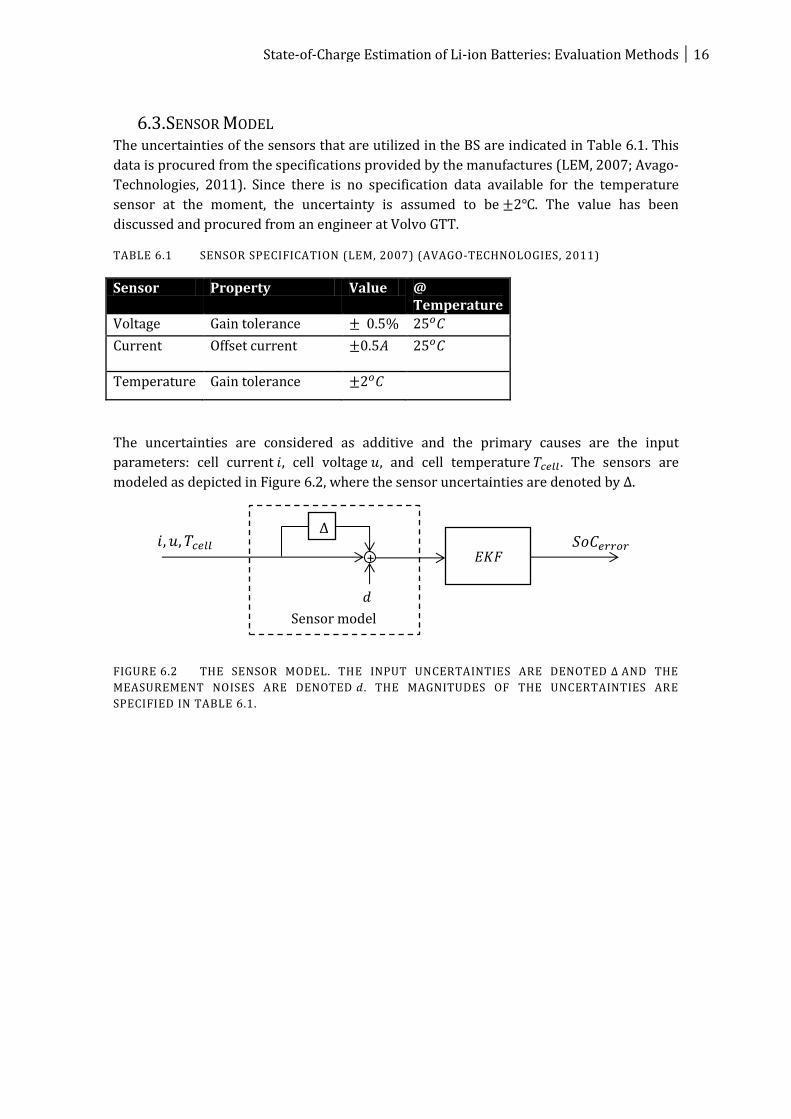
6.3. SENSOR MODEL The uncertainties of the sensors that are utilized in the BS are indicated in Table 6.1. This
data is procured from the specifications provided by the manufactures (LEM, 2007; Avago-
Technologies, 2011). Since there is no specification data available for the temperature
sensor at the moment, the uncertainty is assumed to be . The value has been
discussed and procured from an engineer at Volvo GTT.
TABLE 6.1 SENSOR SPECIFICATION (LEM, 2007) (AVAGO-TECHNOLOGIES, 2011)
Sensor Property Value @ Temperature
Voltage Gain tolerance
Current Offset current
Temperature Gain tolerance
The uncertainties are considered as additive and the primary causes are the input
parameters: cell current , cell voltage , and cell temperature . The sensors are
modeled as depicted in Figure 6.2, where the sensor uncertainties are denoted by .
FIGURE 6.2 THE SENSOR MODEL. THE INPUT UNCERTAINTIES ARE DENOTED AND THE
MEASUREMENT NOISES ARE DENOTED . THE MAGNITUDES OF THE UNCERTAINTIES ARE
SPECIFIED IN TABLE 6.1.
+ 𝐸𝐾𝐹 𝑖 𝑢 𝑇𝑐𝑒𝑙𝑙 𝑆𝑜𝐶𝑒𝑟𝑟𝑜𝑟
𝑑
Sensor model

17 Virtual Test Bench
Figure 6.3 presents the simulated result of the OCV measurement error at different SoC
due to the voltage sensor. From the figure, the OCV measurement error can be assumed to
be constant at a value of . In fact, the difference between the minimum and
maximum error is very small, and thus the average is used.
FIGURE 6.3 THE VOLTAGE ERROR DUE TO THE FAULT TOLERANCE. THE SOLID BLUE LINE IS
THE ORIGINAL . THE DOTTED BLUE LINE REPRESENTS IS THE AVERAGED ERROR .
6.4. VIRTUAL TEST RIG The virtual test rig/virtual battery system is set up as depicted in Figure 6.4. Where ̅( ) is
a set of output variables from the battery model, for instance the cell temperature, cell
voltage and the battery states. ̂( ) is the estimate of ̅( )based on the input ( ).
FIGURE 6.4 A BLOCK DIAGRAM OF THE VIRTUAL TEST BENCH.
P
EKF
𝑛
𝑑
𝑑𝑛
𝑖(𝑡) 𝒚 (𝑡)
𝑦𝑛(𝑡)
Sensor models Observer
Battery model
𝑆𝑜𝐶𝑟𝑒𝑓(𝑡)
𝑆𝑜𝐶𝑒𝑠𝑡(𝑡)
𝑆𝑜𝐶𝑒𝑟𝑟𝑜𝑟(𝑡)
𝒚 (𝑡)
+
+

State-of-Charge Estimation of Li-ion Batteries: Evaluation Methods 18
6.5. EVALUATION OF SOC ESTIMATES IN A TEST RIG This section presents three different test rigs that can be used to evaluate the SoC
estimation accuracy. The setup of the test rig is depicted in Figure 6.5.
The top part of the figure depicts a real battery test rig where the estimator and battery
model is implemented in the system and run in parallel. The middle part of the figure
depicts a virtual test rig where a virtual battery system is used. To utilize this virtual test
rig a good battery model is required. This means that the battery model has a good mimic
of a real battery pack and provides reliable SoC reference.
Due to some problems in the provided battery model ,as discussed in section 6.1 and 7.1, a
second virtual test rig is presented and is used in the simulation tests in section 8. This test
rig is depicted in the bottom part of the figure and is similar to the above mentioned test
rig. The main difference is that the SoC simulated by the battery model is considered
unknown/unreliable and the evaluation is only carried out at the end of the test run.
Disturbances ( ) in the form of measurement noise and sensor uncertainties
( ) are then introduced to the test rig by utilizing the additional sensor models to
mimic the real battery system. The measurement noise is assumed to be white Gaussian
noise.
FIGURE 6.5 TOP: REAL TEST RIG, MIDDLE: VIRTUAL TEST RIG ( KNOWN), AND BOTTOM:
VIRTUAL TEST RIG ( IS UNKNOWN)
Load Cycle
Load Cycle Real Test Rig Processing of logged data
Virtual battery system Continuous processing of
simulated data (i, u, T, 𝑆𝑜𝐶𝑟𝑒𝑓 , etc.)
Load Cycle Virtual battery system Post processing of simulated data
(i, u, T, (𝑆𝑜𝐶𝑟𝑒𝑓), etc.)

19 The Proposed Method to Determine in A Battery system
7. THE PROPOSED METHOD TO DETERMINE IN A
BATTERY SYSTEM This section proposes a method to determine an accurate reference SoC, denoted as
, based on the discussions in Section 2-6. The main idea of this method is to make
use of the end regions of the OCV curve and CC. The procedure is described in Table 7.1
and Figure 7.1 on page 20. The purpose of this method is to acquire a more accurate
than directly measure the OCV.
The evaluation tests of this proposed method are presented in Section 8. It is found that
the proposed method works satisfactorily.
The following subsection discusses different error scenarios that can occur due to the
measurement errors.
7.1. FINDING AN ACCURATE
This subsection presents different error scenarios that can occur when the presented
method is used in a real battery system. The battery voltage, temperature, and discharge
current are considered. As seen later from these subsections, the main error source
appears to be the voltage measurement.
First, the error from each sensor is identified and discussed. Next, discussion follows
regarding a procedure to set the parameters ( ( ), discharge current and cell
temperature) such that an accurate ( ) can be found.

State-of-Charge Estimation of Li-ion Batteries: Evaluation Methods 20
TABLE 7.1 THE PROPOSED METHOD TO DETERMINE THE REFERENCE SOC. SEE ALSO FIGURE
7.1.
Step: Comment 1 Start with a fully charged battery.
2 Discharge the battery until the cycling region is reached, then cycle it for a given application profile.
3
After a predefined time1 , as shown in Figure 7.1, start the discharge-sustaining mode and Coulomb Counting (CC) in parallel. Discharge the battery until ( ) is reached 2 (how to determine ( ) is discussed in the text). The purpose of discharging the battery is to acquire a more accurate SoC measurement from the OCV curve.
4
At ( ), stop the discharge-sustaining mode and CC. Keep the battery in steady state mode (no current enters and leaves the battery). The purpose of keeping the battery in this mode is to allow the OCV to reach the true OCV, which is a transition that can take hours (Nejedly, 2011). This causes the estimated SoC to converge to a constant value, as denoted ( ) in Figure 7.1.
5
( ) can be determined by first drawing a horizontal line at ( ) and backtracking it to
the stopping instance . From , a linear line (blue solid line in the figure) between and can be drawn, as shown in the figure. The slope of the line is calculated by using the integrated current procured in step 3 as,
(∫
)
Thus, ( ) is now found and at can be calculated as,
( ) | ( ) ( )| | ( ) ( ) ∫
( )|
FIGURE 7.1 COMPLEMENTED WITH TABLE 7.1,
1 The cycling time is predefined by the tester and can be of any value. 2 The estimate ( ) depends mainly on the required tolerance/accuracy of ( ). If it is
required an accuracy of 0.01 (1%), then the battery has to discharge until ( ) ( ), see Section 7.1 for explanation.
1
2
3
4
5

21 The Proposed Method to Determine in A Battery system
7.1.1. ERROR DUE TO THE VOLTAGE SENSOR Figure 7.2 shows the lower part of the OCV curve of the battery cell and the errors due to
the OCV measurement error. Normally this curve is used to read the SoC from a measured
OCV of the battery. The SoC is then used as a reference to validate the estimator(which is
the third measure in Table 5.1). However, an OCV measurement error can give a
very inaccurate , especially when the battery SoC is somewhere in the middle
region of the OCV curve, see Figure 2.3. For instance, if the measured OCV is
, then the corresponding SoC is .
FIGURE 7.2 THE OCV CURVE AND THE OCV MEASUREMENT ERROR. THE PLOT SHOWS ONLY
THE LOWER REGION OF THE OCV CURVE.
Due to this accuracy problem a method is proposed in Table 7.1. As described in the table,
first the battery is cycled for a predefined time and stopped, for instance at 3.3V (SoC
0.50). The battery is then discharged until the OCV reaches the endpoint. The purpose of
discharging the battery is to acquire a more accurate reference SoC measurement than
that what is available in the middle region of the OCV curve.
The amount by which the battery has to be discharged in step 3 and 4 in Table 7.1 (the
value of ( )) is determined from
EQUATION 7.1
and the k-curve1 shown in Figure 7.3. For example, to find ( ) that gives a
( ) with maximum absolute error , a k-value has to be
determined first
where is the averaged (see Section 6.3). Using the calculated k, ( ) can
be read from the plot in Figure 7.3,
1 The k-curve is used to determine the ( ). The deduction of the curve is presented in Appendix B.

State-of-Charge Estimation of Li-ion Batteries: Evaluation Methods 22
( )
This means that the battery has to be discharged until ( ) . Note that the
temperature and current sensor error are not considered.
FIGURE 7.3 -CURVE.
0.0163
K

23 The Proposed Method to Determine in A Battery system
7.1.2. ERROR DUE TO THE TEMPERATURE SENSOR Figure 7.4 shows the k-curve and the corresponding simulated error due to the
temperature sensor uncertainty at 20 . Since there is no specification for the sensor the
uncertainty is assumed to be . The value has been discussed and procured from
Andersson (2012) at Volvo GTT. The figure illustrates that the temperature measurement
error has no significant effect on the curve and can therefore be ignored.
FIGURE 7.4 K-CURVE WITH ERROR. THE SOLID LINE IS THE K-CURVE AND THE DOTTED RED
AND BLUE LINES ARE THE UNCERTAINTY OF K-CURVES DUE TO THE TEMPERATURE SENSOR. IT
IS SHOWN HERE THAT THE ERROR IS VERY SMALL AND CAN BE IGNORED.

State-of-Charge Estimation of Li-ion Batteries: Evaluation Methods 24
7.1.3. INTEGRATION ERROR DUE TO THE CURRENT SENSOR One problem with the proposed method is the usage of the integral of the cell current flow
between and . The current integration is subject to several causes of errors that
accumulate over time. Because of the errors the selection of discharge current is
considered as an optimization problem. The model is stated in Table 7.3. The purpose of
the optimization is to find the optimal discharge current that maximizes the accuracy of
the reference SoC at time (known as ( )).
The local optimum of the problem is shown in Table 7.2 and the corresponding discharge
cell current is found be 3C-rate1 ( ). Furthermore, it can be seen in the table that the
cell temperature during the discharge instance is within the allowed range. Note that the
cell temperature model has a validity of in the optimized region and in the
extended region, see Appendix A. In the worst case scenario the true temperature can vary
between 29-45 .
However, after extensive tests it was found that the provided cell temperature model is
not reliable, since the cell temperature never exceeds 40 regardless the cell current.
Hence, the presented optimization model and acquired discharged current are not
considered as final due to the invalid cell temperature model.
As seen from the results in Table 7.2, the accuracy of is primarily due to the voltage
sensor error, hence also the current integration can be ignored
TABLE 7.2 RESULTS OF THE OPTIMIZATION PROBLEM.
( ) Max cell temp. [ ] Comment
0.0012 0.80 38.7 The ambient temperature and the initial cell temperature are set to 23 . The ( ) is set to
0.02.
0.0011 0.70 38.3
0.0009 0.60 37.7
0.0007 0.50 37
0.0006 0.40 36.3
0.0004 0.30 35.5
1 Nominal current = 1 C- rate (complete discharge in 1 hour)

25 The Proposed Method to Determine in A Battery system
Variables
Discharge current Cell temperature The time when discharge instance starts The time when intersects ( ), see Figure 7.5
The time | | , see Figure 7.1
TABLE 7.3 OPTIMIZATION MODEL
Optimization model Comment
| |
Objective function.
| |
| ( )
|
Cell current constraint
Cell temperature constraint
| | The steady state time should be less then , see Figure 7.1
( ) The parameter , and T is calculated using the provided battery model in Simulink
Time constraints
is natural numbers
FIGURE 7.5 ILLUSTRATE AND . THE SOLID BLACK AND BLUE
LINES ARE THE REFERENCE SOCS WITH AND WITHOUT THE ERROR, RESPECTIVELY.
𝑆𝑜𝐶𝑐𝑢𝑟𝑟𝑒𝑛𝑡 𝑖𝑛𝑡𝑒𝑔𝑟𝑎𝑡𝑖𝑜𝑛 𝑒𝑟𝑟𝑜𝑟
𝑆𝑜𝐶𝑟𝑒𝑓(𝑡𝐴)
𝑡𝐴
𝑆𝑜𝐶𝑒𝑠𝑡(𝑡𝐵)
𝑆𝑜𝐶𝑟𝑒𝑓 𝑐𝑢𝑟𝑟𝑒𝑛𝑡 𝑖𝑛𝑡𝑒𝑔𝑟𝑎𝑡𝑖𝑜𝑛 𝑒𝑟𝑟𝑜𝑟(𝑡𝐴)
𝑡𝐵
𝑇𝑖𝑚𝑒
𝑆𝑜𝐶

State-of-Charge Estimation of Li-ion Batteries: Evaluation Methods 26
27 Test Result in Virtual Test Bench
8. TEST RESULT IN VIRTUAL TEST BENCH This section presents the test results that are carried out in the virtual test rig. The test rig
is set up as discussed in Section 6 where the developed estimator and the provided battery
model are simulated in parallel with and without measurement noise.
8.1. EVALUATION OF THE PROPOSED METHOD
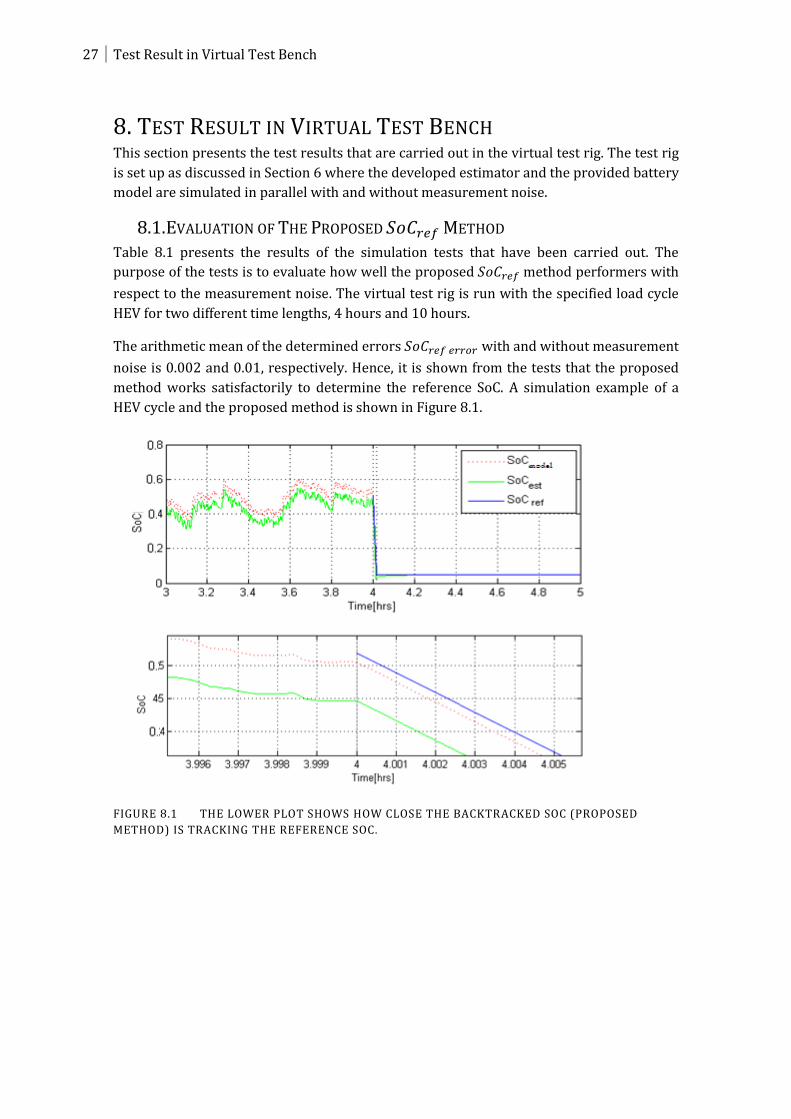
Table 8.1 presents the results of the simulation tests that have been carried out. The
purpose of the tests is to evaluate how well the proposed method performers with
respect to the measurement noise. The virtual test rig is run with the specified load cycle
HEV for two different time lengths, 4 hours and 10 hours.
The arithmetic mean of the determined errors with and without measurement
noise is 0.002 and 0.01, respectively. Hence, it is shown from the tests that the proposed
method works satisfactorily to determine the reference SoC. A simulation example of a
HEV cycle and the proposed method is shown in Figure 8.1.
FIGURE 8.1 THE LOWER PLOT SHOWS HOW CLOSE THE BACKTRACKED SOC (PROPOSED
METHOD) IS TRACKING THE REFERENCE SOC.

State-of-Charge Estimation of Li-ion Batteries: Evaluation Methods 28
TABLE 8.1 SIMULATION TESTS OF THE PROPOSED METHOD.
HEV Comment
Settings: =0.75 Simulation time = 4hrs Discharge current =3C ( )=0.08 Result without measurement noise:
Result with measurement noise:
Settings: =0.5 Simulation time = 4hrs Discharge current =3C ( )=0.08 Result without measurement noise:
Result with measurement noise:
Settings: =0.25 Simulation time = 4hrs Discharge current =3C ( )=0.08 Result without measurement noise:
Result with measurement noise:

29 Test Result in Virtual Test Bench
Settings: =0.75 Simulation time = 10hrs Discharge current =3C ( )=0.08 Result without measurement noise:
Result with measurement noise:
Settings: =0.50 Simulation time = 10hrs Discharge current =3C ( )=0.08 Result without measurement noise:
Result with measurement noise:
Settings: =0.25 Simulation time = 10hrs Discharge current =3C ( )=0.08 Result without measurement noise:
Result with measurement noise:
State-of-Charge Estimation of Li-ion Batteries: Evaluation Methods 30
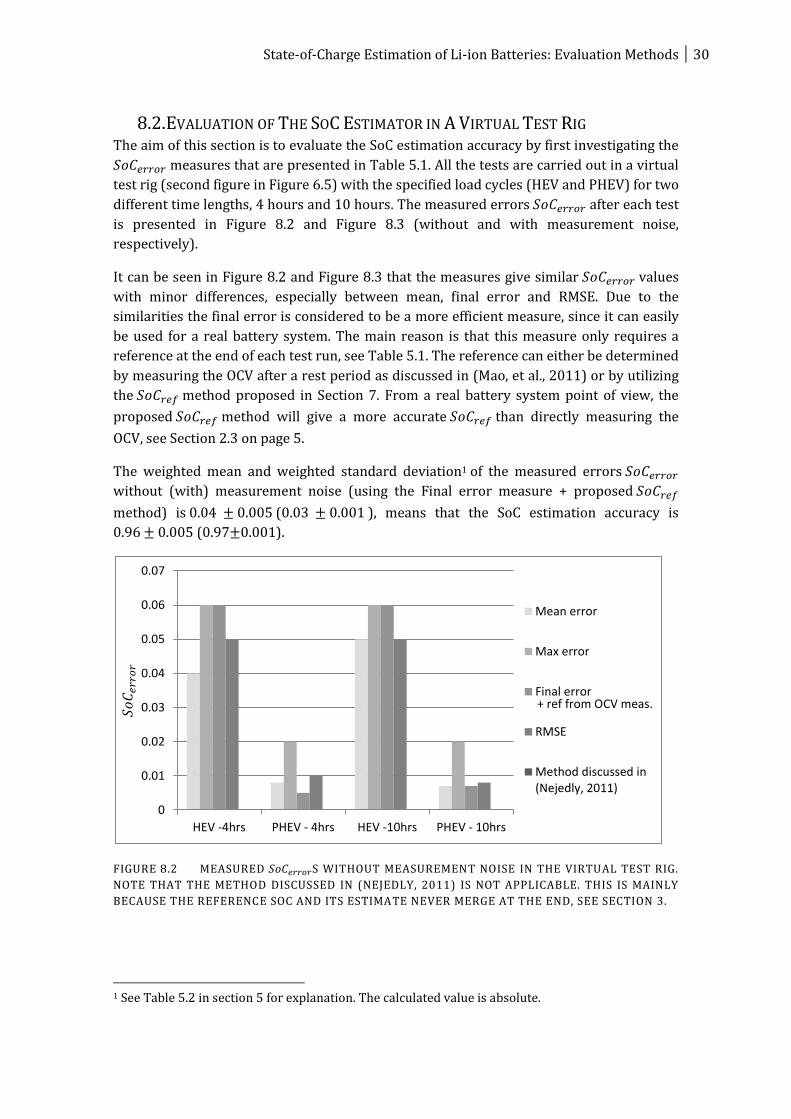
8.2. EVALUATION OF THE SOC ESTIMATOR IN A VIRTUAL TEST RIG The aim of this section is to evaluate the SoC estimation accuracy by first investigating the
measures that are presented in Table 5.1. All the tests are carried out in a virtual
test rig (second figure in Figure 6.5) with the specified load cycles (HEV and PHEV) for two
different time lengths, 4 hours and 10 hours. The measured errors after each test
is presented in Figure 8.2 and Figure 8.3 (without and with measurement noise,
respectively).
It can be seen in Figure 8.2 and Figure 8.3 that the measures give similar values
with minor differences, especially between mean, final error and RMSE. Due to the
similarities the final error is considered to be a more efficient measure, since it can easily
be used for a real battery system. The main reason is that this measure only requires a
reference at the end of each test run, see Table 5.1. The reference can either be determined
by measuring the OCV after a rest period as discussed in (Mao, et al., 2011) or by utilizing
the method proposed in Section 7. From a real battery system point of view, the
proposed method will give a more accurate than directly measuring the
OCV, see Section 2.3 on page 5.
The weighted mean and weighted standard deviation1 of the measured errors
without (with) measurement noise (using the Final error measure + proposed
method) is ( ), means that the SoC estimation accuracy is
0. (0.97 ).
FIGURE 8.2 MEASURED S WITHOUT MEASUREMENT NOISE IN THE VIRTUAL TEST RIG.
NOTE THAT THE METHOD DISCUSSED IN (NEJEDLY, 2011) IS NOT APPLICABLE. THIS IS MAINLY
BECAUSE THE REFERENCE SOC AND ITS ESTIMATE NEVER MERGE AT THE END, SEE SECTION 3.
1 See Table 5.2 in section 5 for explanation. The calculated value is absolute.
0
0.01
0.02
0.03
0.04
0.05
0.06
0.07
HEV -4hrs PHEV - 4hrs HEV -10hrs PHEV - 10hrs
Mean error
Max error
Final error
RMSE
Method discussed in(Nejedly, 2011)
𝑆𝑜𝐶𝑒𝑟𝑟𝑜𝑟
+ ref from OCV meas.

31 Test Result in Virtual Test Bench
FIGURE 8.3 MEASURED S WITH MEASUREMENT NOISE IN THE VIRTUAL TEST RIG.
NOTE THAT THE METHOD DISCUSSED IN (NEJEDLY, 2011) IS NOT APPLICABLE. THIS IS MAINLY
BECAUSE THE REFERENCE SOC AND ITS ESTIMATE NEVER MERGE AT THE END, SEE SECTION 3.
0
0.01
0.02
0.03
0.04
0.05
0.06
0.07
0.08
HEV -4hrs PHEV - 4hrs HEV -10hrs PHEV - 10hrs
Mean error
Max error
Final error
RMSE
Method discussed in(Nejedly, 2011)
𝑆𝑜𝐶𝑒𝑟𝑟𝑜𝑟
+ ref from OCV meas.

State-of-Charge Estimation of Li-ion Batteries: Evaluation Methods 32

33 Discussion and Conclusion
9. DISCUSSION AND CONCLUSION It has been shown that the proposed method works satisfactorily in the tests with,
and without, measurement noise and sensor uncertainties. From the tests presented in
previous section, it can be concluded that the method is robust to measurement noise and
gives a very accurate . However, it cannot be concluded that the method is the best
one, due to the limited testing data available, such as load cycles. On the other hand, it has
been shown here that the method performs well.
It has also been concluded in the thesis that the weighted mean is the most suitable
measure to weight the determined errors , see Table 5.2.
The proposed evaluation method for the battery system is as uses the final error measure,
presented in Table 5.1, in combination with the proposed to determine the
after each test run. In addition, to determine the SoC estimation accuracy,
denoted , using the weighted mean and standard deviation.

State-of-Charge Estimation of Li-ion Batteries: Evaluation Methods 34

35 Bibliography
10. BIBLIOGRAPHY Andersson, B., 2012. Internal [Interview] 2012.
Avago-Technologies, 2011. Automotive High Precision DC Voltage Isolation Sensor, United
States: AvagoTech (Specification).
Ceraolo, M., 2011. Modeling Test Matrices for Li Batteries and SC cells, Italy: Universita Pisa,
Hybrid Commercial Vehicle (Report No: D.3100.5).
Chiang, Y.-H., Sean, W.-Y. & Ke, J.-C., 2011. Online Estimation of Internal Resistance and
Open-Circuit Voltage of Lithiu-Ion Batteries in Electric Vehicles. Journal of Power Sources,
196(8), pp. 3921-3932.
Conte, F., 2006. Battery and Battery Management For Hybrid Electric Vehicle: A Review.
Elektrotechnik & Informationstechnik 123, 10(10), pp. 424-431.
Gelso, E., 2012. Li-ion Battery Demonstrator p2 - Algorithm Development, Gothenburg,
Sweden: Volvo Group Truck Technology (Internal Report).
Groot, J., 2012. State-of-Health Estimation of Li-ion Batteries: Cycle Life Test Methods,
Göteborg: Chalmers University of Technology (Licentiate Thesis).
Groot, J. & Lunden, M., 2006. Energy Storage Project, Restarted Program A, Gothenburg,
Sweden: Volvo Group Truck Technology (Internal Report).
Hellgren, J., 2012. Internal [Interview] 2012.
Howell, D., 2010. Battery Test Manual For Plug-In Hybrid Electric Vehicles: Revision 2,
(Manual No: INL/EXL-07-12536). [Online]
Available at: http://avt.inl.gov/energy_storage_lib.shtml
[Accessed 12 Oct 2012].
Lee, S.-J., Kim, J.-h., Lee, J. & Cho, B., 2008. State-of-Charge and Capacity Estimation of
Lithium-ion Battery Using A New Open-Circuit Voltage Versus State-of-Charge. Journal of
Power Sources, 185(2), pp. 1367-1373.
LEM, 2007. Automotive Current Sensor (Specification). [Online]
Available at: http://www.lem.com/
[Accessed 12 Oct 2012].
Mao, X., Tang, X., Lin, J. & Koch, B., 2011. Li-Ion Battery Parameter Estimation For State of
Charge. San Francisco, CA, USA, AACC, pp. 941-946.
MIT, 2008. A Guide to Understanding Battery Specifications - MIT Electric Vehicle Team.
[Online]
Available at: http://mit.edu/evt/summary_battery_specifications.pdf
[Accessed 29 07 2012].

State-of-Charge Estimation of Li-ion Batteries: Evaluation Methods 36
Nejedly, A., 2011. Evaluation and Test of A Battery Management Unit for Hybrid Electric
Vehicles. Stockholm, Sweden: Royal Institute of Technology (Master's Thesis).
Plett, G. L., 2004. Extended Kalman Filtering For Battery Management Systems of LiPB-
based HEV Battery Packs - Part1. Journal of Power Sources, 134(2), pp. 252-261.
Pop, V., Bergveld, H. J., Notten, P. P. & Regtien, P. P., 2005. State-of-Art Of Battery State-of-
Charge Determination. Measurement Science and Technology, 16(12), p. 12.
Wang Z et al, 2011. The Comparative Study of SoC Estimation Based on EKF and ANFIS
Algorithm IPCSIT vol.4. Singapore, IACSIT.
37 Appendix
APPENDIX
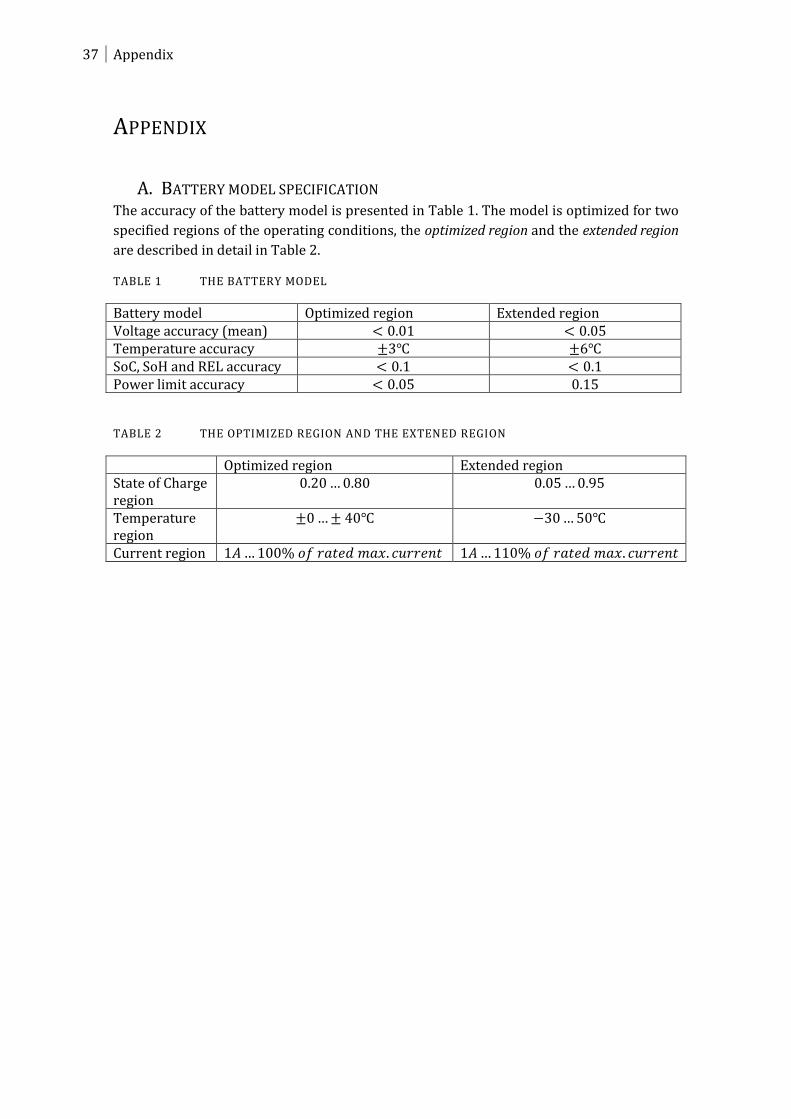
A. BATTERY MODEL SPECIFICATION The accuracy of the battery model is presented in Table 1. The model is optimized for two
specified regions of the operating conditions, the optimized region and the extended region
are described in detail in Table 2.
TABLE 1 THE BATTERY MODEL
Battery model Optimized region Extended region Voltage accuracy (mean) Temperature accuracy SoC, SoH and REL accuracy Power limit accuracy
TABLE 2 THE OPTIMIZED REGION AND THE EXTENED REGION
Optimized region Extended region State of Charge region
Temperature region
Current region
State-of-Charge Estimation of Li-ion Batteries: Evaluation Methods 38
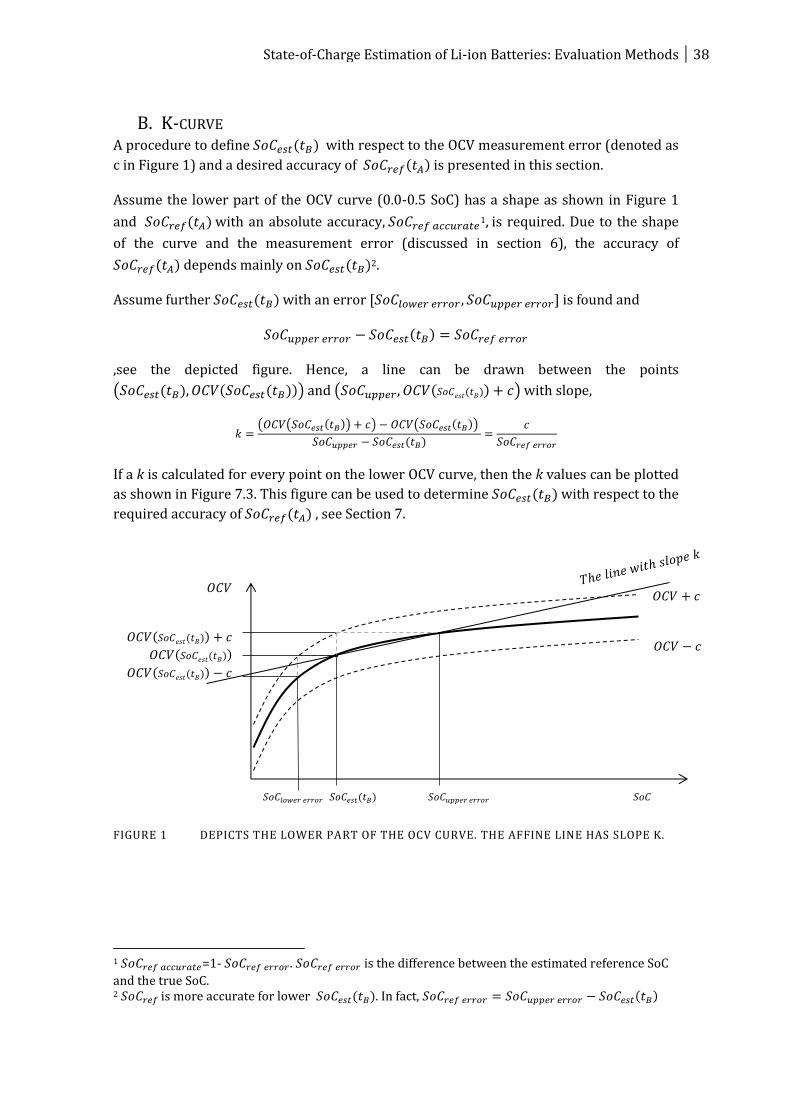
B. K-CURVE A procedure to define ( ) with respect to the OCV measurement error (denoted as
c in Figure 1) and a desired accuracy of ( ) is presented in this section.
Assume the lower part of the OCV curve (0.0-0.5 SoC) has a shape as shown in Figure 1
and ( ) with an absolute accuracy, 1 is required. Due to the shape
of the curve and the measurement error (discussed in section 6), the accuracy of
( ) depends mainly on ( )2.
Assume further ( ) with an error [ ] is found and
( )
,see the depicted figure. Hence, a line can be drawn between the points
( ( ) ( ( ))) and ( ( ( )) ) with slope,
( ( ( )) ) ( ( ))
( )
If a k is calculated for every point on the lower OCV curve, then the k values can be plotted
as shown in Figure 7.3. This figure can be used to determine ( ) with respect to the
required accuracy of ( ) , see Section 7.
FIGURE 1 DEPICTS THE LOWER PART OF THE OCV CURVE. THE AFFINE LINE HAS SLOPE K.
1 =1- . is the difference between the estimated reference SoC
and the true SoC. 2 is more accurate for lower ( ). In fact, ( )
𝑆𝑜𝐶𝑙𝑜𝑤𝑒𝑟 𝑒𝑟𝑟𝑜𝑟 𝑆𝑜𝐶𝑒𝑠𝑡(𝑡𝐵) 𝑆𝑜𝐶𝑢𝑝𝑝𝑒𝑟 𝑒𝑟𝑟𝑜𝑟 𝑆𝑜𝐶
𝑂𝐶𝑉 𝑐
𝑂𝐶𝑉 𝑐 𝑂𝐶𝑉(𝑆𝑜𝐶𝑒𝑠𝑡(𝑡𝐵)) 𝑐
𝑂𝐶𝑉(𝑆𝑜𝐶𝑒𝑠𝑡(𝑡𝐵))
𝑂𝐶𝑉(𝑆𝑜𝐶𝑒𝑠𝑡(𝑡𝐵)) 𝑐
𝑂𝐶𝑉