A Meta-Analysis of the Five-Factor Model of Personality and Academic Performance
68
A Meta-Analysis of … 1 Running head: PERSONALITY AND ACADEMIC PERFORMANCE META-ANALYSIS A Meta-Analysis of the Five-Factor Model of Personality and Academic Performance Arthur E. Poropat Griffith University Nathan, Australia
-
Upload
kring-kring-k-kringers -
Category
Documents
-
view
216 -
download
2
description
A Meta-Analysis of the Five-Factor Model of Personality and Academic Performance
Transcript of A Meta-Analysis of the Five-Factor Model of Personality and Academic Performance
A Meta-Analysis of … 1
Running head: PERSONALITY AND ACADEMIC PERFORMANCE META-ANALYSIS
A Meta-Analysis of the Five-Factor Model of Personality and Academic Performance
Arthur E. Poropat
Griffith University
Nathan, Australia
A Meta-Analysis of … 2
Abstract
This article reports a meta-analysis of personality-academic performance relationships, based on
the Five-Factor Model (FFM), with cumulative sample sizes ranging to over 70,000. Most
analyzed studies came from the tertiary level of education, but there were similar aggregate
samples from secondary and tertiary education. There was a comparatively smaller sample
derived from studies at primary level. Academic performance was found to significantly
correlate with Agreeableness, Conscientiousness and Openness to Experience. Where tested,
correlations between Conscientiousness and academic performance were largely independent of
intelligence. When secondary academic performance was controlled for, Conscientiousness
added as much to the prediction of tertiary academic performance as did intelligence. Strong
evidence was found for moderators of correlations. Academic level (primary, secondary or
tertiary), average age of participant, and the interaction between academic level and age
significantly moderated correlations with academic performance. Possible explanations for these
moderator effects are discussed and recommendations for future research are provided.
Key-words: Personality; Intelligence; Academic Performance; Meta-Analysis; Moderation

A Meta-Analysis of … 3
A Meta-Analysis of the Five-Factor Model of Personality and Academic Performance
Research on personality and its relationships to important personal, social and economic
constructs is as vibrant and influential as ever (Funder, 2001) and has been credited with
prompting many of the major advances in fields such as organizational behavior (Hough, 2001).
Much of this contribution can be linked directly to theoretical and statistical reviews of the role
of personality, such as the pivotal meta-analyses of correlations between personality and work
performance (Barrick & Mount, 1991; Hough, Eaton, Dunnette, Kamp, & McCloy, 1990). Such
integrations of research have allowed researchers to assess the major features of these
relationships, providing guidance for future studies. It is therefore surprising that, to date, there
has been no comparable review of the relationship between personality and academic
performance. This article reports on an attempt to provide just such an exhaustive statistical
review.
A brief history of research on personality and academic performance
One of the earliest applications of trait-based personality assessment was the prediction
of academic performance. Webb (1915) proposed the existence of a construct he labelled w,
representing a will factor, which Spearman (1927) later argued sat alongside the general
intelligence factor g as a contributor to academic ability. Consistent with this, research by Webb
and others (e.g., Flemming, 1932) found that personality measures were correlated with
academic performance. Unfortunately, early research was beset by inconsistent research findings
and methodological problems. In one of the earliest reviews of the field, Harris (1940) expressed
the view that personality contributed to academic performance, but acknowledged that this was
unsupported by evidence because research up to that point was marred by inconsistent and
flawed methodologies. Later, Stein (1963) emphasized the difficulty of making sense of research

A Meta-Analysis of … 4
based on diverse theories and measures, while Margrain (1978) noted much creativity in
methodology, but findings that showed no clear trends. The next major review of the field (De
Raad, & Schouwenburg, 1996) still highlighted the scattered nature of this research and its lack
of an overarching framework or paradigm, while Farsides and Woodfield (2003) concluded that
findings had been “erratic” (p. 1229). In brief, reviews of research on the relationship between
personality and academic performance have generally presented equivocal conclusions, largely
due to the use of variable research methodologies and theoretical bases.
Just as with academic performance, early research on links between personality and work
performance found variable results, leading to the conclusion that general dimensions of
personality were largely unrelated to work performance (Guion & Gottier, 1965). Two
methodological advances helped reverse that conclusion: the advent of meta-analytical
techniques for effectively combining results from previous research (e.g., Hunter, Schmidt, &
Jackson, 1982) and the growing acceptance of broad factorial models of personality, which
provided a framework for comparing personality studies. In particular, the Five-Factor Model
(FFM) of personality, which is made up of the dimensions of Agreeableness (reflecting
likeability and friendliness), Conscientiousness (dependability and will-to-achieve), Emotional
Stability (adjustment versus anxiety), Extraversion (activity and sociability), and Openness
(imaginativeness, broad-mindedness and artistic sensibility), has been important in this regard.
The value of the FFM is that it encompasses most of the variance in personality description in a
simple set of dimensions, thus bringing order to the previous “chaotic plethora” of personality
measures (Funder, 2001, p. 200). Barrick and Mount (1991) used the FFM to organize their
meta-analysis, thus providing one of the first broad-ranging estimates of the relationship between
personality and work performance. Since then, a series of meta-analyses, culminating in Barrick,

A Meta-Analysis of … 5
Mount and Judge’s (2001) second-order meta-analysis, have provided a largely consistent picture
— personality measures, especially Conscientiousness, are associated with a range of workplace
performance criteria.
Given the long-standing interest in the relationship between personality and academic
performance, it is surprising that no similarly authoritative meta-analyses have been reported. A
thorough meta-analysis using the FFM framework would effectively address many of the
concerns raised by earlier reviewers regarding inconsistent personality theories and scales. To
date, there have been several meta-analyses of the relationship between personality and academic
performance; however each of these is limited in range or suffer from methodological problems.
Beginning with measurement issues, the meta-analysis reported by Hough (1992) was based on a
broad set of personality measures that had within-category correlations ranging from .33 to .46
(average of .39), casting doubt on the homogeneity and hence the interpretability of these
categories. Similar criticisms can be made of the meta-analysis reported by Trapmann, Hell, Hirn
and Schuler (2007), which used a variety of measures of personality that had not been designed
to assess the FFM (e.g., early versions of the 16PF and the California Psychological Inventory).
Hough also included both grades and college attendance as measures of academic performance,
but these measures are far from synonymous. For example, Farsides and Woodfield (2003)
reported a correlation of -.36 between absenteeism and final-year percentage. In contrast, the
meta-analyses reported by Poropat (2005) and O’Connor and Paunonen (2007) addressed these
measurement problems by using only FFM-based measures and restricting themselves to
measures of grade and grade point average (GPA). However, O’Connor and Paunonen (2007),
like Poropat (2005) and Trapmann et al. (2007) restricted their meta-analyses to post-secondary
A Meta-Analysis of … 6
academic performance. Hough (1992) did include correlations with secondary school
performance but aggregated these with correlations with post-secondary academic performance.
One of the main strengths of meta-analysis is that it allows researchers to test for the
presence of moderators, rather than accepting a single, over-arching estimate. However, neither
Hough (1992) nor the meta-analyses by Poropat (2005) and O’Connor and Paunonen (2007)
reported estimates of homogeneity for their samples, which is the first step in looking for
moderators. Trapmann et al. (2007) did look for moderators and found heterogeneity in their
sample of correlations, but their search for moderators was limited by application of a restrictive
significance level (p < .00455) and the use of the unreliable method of hierarchical sub-group
analysis (Steel & Kammeyer-Mueller, 2002: moderator analysis is discussed in more detail in the
Results section). A further problem is that, apart from Hough (1992), each of these meta-
analyses restricted its surveys to published studies, with O’Connor and Paunonen (2007) using
what they referred to as “the major papers available on the topic” (p.974). This form of sampling
can lead to biased estimates due to selective publication (Rosenthal & DiMatteo, 2001). Finally,
none of these meta-analyses assessed whether correlations between personality and academic
performance were confounded with underlying relationships with intelligence. As one reviewer
noted, there is a long-standing speculation that all positively evaluated traits, such as personality
and intelligence, are associated (Thorndike, 1940) so any links between personality and
academic performance may be due to this. These various flaws have limited the interpretability
of earlier meta-analyses, so the current research was undertaken to provide reliable estimates
based on a literature search that was relatively exhaustive, while investigating the impact of
various moderators and controlling for the influence of intelligence.

A Meta-Analysis of … 7
Academic performance
Apart from its theoretical value, there is considerable practical value in being able to
statistically predict academic performance. Among the member countries of the Organisation for
Economic Cooperation and Development (OECD), an average of 6.2% of gross domestic
product is spent on educational activities, while the average young person in these countries will
stay in education until the age of 22 (OECD, 2007). Clearly, the academic performance of
students is highly valued within these advanced economies, such that any increments in
understanding of academic performance have substantial implications.
The dominant measures of academic performance are grades and especially GPA, as
attested by their frequent use as criterion variables in research (Kuncel, Crede, & Thomas, 2005).
Despite their common use, the reliability and validity of grades and GPA have been questioned
because of factors such as grade inflation, which is the tendency to provide higher grades for the
same substantive performance at different levels of study, or at different periods in time
(Johnson, 1997). Grade inflation can be problematic when it reduces comparability between
grades that are subsequently integrated into GPA (Johnson, 1997) or produces ceiling effects
(i.e., grades crowding into the upper limit of the grading range), resulting in range restriction and
disrupted rank-ordering (LeBreton, Burgess, Kaiser, Atchley, & James, 2003), as well as non-
normal distributions. These effects will tend to reduce observed correlations. If, however, grade
inflation leads only to a constrained spread of grades (e.g., a standard deviation based on an
effective rating scale of 6 to 10 versus 1 to 10), without changing rank ordering, that will not of
itself affect correlations because they are computed on standardized variables.
It is reassuring then that when it is treated as a scale with grades as the component items,
the internal reliability of GPA is relatively good. For example, Bacon and Bean (2006) reported
an average intraclass correlation coefficient of .94 for four-year tertiary-level GPA, which is

A Meta-Analysis of … 8
substantially higher than the average Cronbach’s alpha of .746 for measures of work
performance (Viswesvaran, Ones, & Schmidt, 1996). Problems with the reliability of GPA
would tend to affect the temporal stability of the measure as well as its correlations with other
variables. Yet, meta-analytic correlations have been reported between GPA at secondary and
tertiary levels of education (corrected r = .54: Kobrin, Patterson, Shaw, Mattern, & Barbuti,
2008; corrected r = .46: Schuler, Funke, & Baron-Boldt, 1990) indicating that GPA is reliable
over time. GPA is consistently correlated with other variables such as intelligence (corrected r =
.56: Strenze, 2007) and is a significant predictor of occupational criteria such as work
performance (corrected r = .35: Roth, BeVier, Schippman, & Switzer III, 1996), and
occupational status and prestige (corrected r = .37: Strenze, 2007), demonstrating criterion
validity. Thus, although there are problems with grades and GPA, they remain useful measures
of academic performance, making them appropriate for use in this meta-analysis.
Why should personality be related to academic performance?
At this juncture, it is important to consider why personality should be expected to be
correlated with academic performance when most measures of personality, including the FFM,
were not designed to predict academic performance (Ackerman & Heggestad, 1997). This
contrasts with intelligence, the early empirical refinement of which was based partly on analyses
of academic performance (Spearman, 1904), while many intelligence tests were specifically
constructed to predict academic success or failure (Brown & French, 1979). There are,
nonetheless, good reasons to expect that the FFM dimensions should predict academic
performance, based on the theoretical position that guided its initial development. The theoretical
basis for the FFM was provided by the lexical hypothesis (Allport & Odbert, 1936), the idea that
there is an evolutionary advantage in being able to identify valuable differences between people

A Meta-Analysis of … 9
and that natural languages will therefore have developed in ways that would aid this
identification (Saucier & Goldberg, 1996). A corollary of the lexical hypothesis is that the more
valued the feature of personality, the more descriptors for that feature will be found within
natural languages. This in turn implies that it should be possible to determine which features of
personality are most valued and important by finding the largest groups of personality
descriptors that have similar meanings.
The lexical hypothesis inspired factor analyses of comprehensive sets of personality
descriptors, first in English and subsequently in other languages, resulting in the development
and validation of the FFM (Saucier & Goldberg, 1996). The fact that the FFM has also been
obtained from analyses of varied item-sets (e.g., Costa & McCrae, 1988; Goldberg & Rosolack,
1994; Goldberg, Sweeney, Merenda, & Hughes, 1996) and confirmed within different cultures
(e.g., Hendriks et al., 2003) provides evidence not only for the FFM but also for the lexical
hypothesis. Admittedly, other models of personality have been developed on the basis of the
lexical hypothesis (e.g., Ashton et al., 2004; Saucier, 2003), but these models do not contradict
the FFM – rather, they add to and, in the case of Saucier (2003), re-orient the FFM dimensions.
The FFM remains by far the most widely researched personality model based on the lexical
hypothesis, and hence forms the basis for the meta-analysis reported here.
If the lexical hypothesis is correct, then dimensions of the FFM should be related to
behaviors and outcomes that have independently been recognized as important. Performance at
work, mortality and divorce are all socially important outcomes, so the findings that the FFM
dimensions are linked to work performance (Barrick et al., 2001) and have similar or stronger
links with mortality and divorce than do either intelligence or socioeconomic status (Roberts,
Kuncel, Shiner, Caspi, & Goldberg, 2007) are consistent with this reasoning. The substantial
A Meta-Analysis of … 10
investments in education by societies and individuals demonstrate the high value placed on
educational performance, so it should also be associated with the FFM.
The idea that intelligence, socioeconomic status and personality each affect socially-
valued behaviors is consistent with the proposal that performance in both work and academic
settings is determined by factors relating to capacity to perform, opportunity to perform and
willingness to perform (Blumberg & Pringle, 1982; Traag, van der Valk, van der Velden, de
Vries, & Wolbers, 2005). Capacity incorporates knowledge, skills and intelligence; opportunity
to perform is affected by environmental constraints and resources, including socioeconomic
resources (Traag et al., 2005); while willingness to perform reflects motivation, cultural norms
and personality (Blumberg & Pringle, 1982). Recent meta-analyses have provided evidence that
both capacity and opportunity to perform are correlated with academic performance. For
example, Strenze (2007) found a corrected correlation of .56 between intelligence and academic
performance, while Sirin’s (2005) meta-analysis obtained a corrected correlation of .32 between
socioeconomic status and academic performance. Factors associated with willingness to perform,
such as attendance, initiative, involvement in non-academic activities, and attitudes to study,
have been shown to provide additional prediction of academic performance beyond that provided
by mental ability (Willingham, Pollack, & Lewis, 2002). With respect to willingness to perform,
the dimensions of the FFM may contribute directly but have been indirectly linked through their
associations with motivation. For example, Judge & Ilies (2002) found that FFM measures
provided a multiple correlation when statistically predicting goal-setting motivation. Therefore, it
is reasonable to expect that — like other aspects of willingness to perform — personality, as
measured by the FFM, should be correlated with academic performance.

A Meta-Analysis of … 11
Given these arguments, it is tempting to assume that correlations of personality with
academic performance should mirror those with work performance. Some authors have argued
that the two types of performance can be considered to be largely the same (e.g., Lounsbury,
Gibson, Sundstrom, Wilburn, & Loveland, 2004), in part because schools prepare students for
work “by structuring social interactions and individual rewards to replicate the environment of
the workplace” (Bowles & Gintis, 1999, p. 3). However, there is also little evidence that what is
learnt during formal education is actually transferred to the workplace (Haskell, 2001) and
although tertiary level academic performance is correlated with job performance, this is not at a
level that would imply they are the same (corrected r = .35: Roth, et al., 1996). Therefore, the
similarities between academic and work performance may suggest similar relations with
personality, but they are not strong enough to assume this conclusion.
Other arguments for linking personality with academic performance are based on
previously observed correlations between these measures and various additional variables. As
mentioned previously, personality and academic performance may be associated due to common
links with intelligence. Consistent with this, Chamorro-Premuzic and Furnham (2006) argued
that correlations between academic performance and personality measures would mirror
corresponding correlations of intelligence with personality. Yet the relationship of intelligence
with personality is complex with, for example, the strength of correlations between intelligence
and Extraversion varying with participant age and research methodology (Wolf & Ackerman,
2005). Consequently, it is difficult to be confident on this basis about corresponding
relationships with academic performance. Nonetheless, given the reliable associations of
intelligence with academic performance, it would be difficult to interpret the relationship
between personality and academic performance without considering the role of intelligence.

A Meta-Analysis of … 12
In summary, the strongest arguments for expecting that measures of personality based on
the FFM should be correlated with academic performance relate to the evidence supporting the
importance of personality factors for predicting socially valued behaviors and on the recognition
of personality as a component of an individual’s willingness to perform. At the same time,
intelligence should be considered in order to adequately assess these relationships. This meta-
analysis should be seen as a test of these positions.
Relationships of individual FFM dimensions with academic performance
Apart from the general arguments for expecting academic performance to be associated
with personality, a range of independent arguments has been forwarded linking it with individual
FFM measures. Many of these were reviewed by De Raad and Schouwenburg (1996), so the
following discussion largely summarizes their work. De Raad and Schouwenburg (1996) argued
that Agreeableness may have some positive impact on academic performance by facilitating
cooperation with learning processes. This is consistent with later research that found
Agreeableness was linked to compliance with teacher instructions, effort and staying focused on
learning tasks (Vermetten, Lodewijks, & Vermunt, 2001). Conscientiousness as the FFM
dimension most closely linked to will to achieve (Digman, 1989) — the w factor described by
Webb (1915) — has often been linked to academic performance (De Raad & Schouwenburg,
1996). This factor is associated with sustained effort and goal-setting (Barrick, Mount, &
Strauss, 1993), both of which contribute to academic success (Steel, 2007), as well as
compliance with and concentration on homework (Trautwein, Ludtke, Schnyder, & Niggli,
2006), and learning-related time management and effort regulation (Bidjerano & Dai, 2007).
People who are low on Emotional Stability are more anxious and tend to focus on their
emotional state and self-talk, thus interfering with attention to academic tasks, thereby reducing

A Meta-Analysis of … 13
performance (De Raad & Schouwenburg, 1996). More positively, Emotional Stability is
associated with self-efficacy (Judge & Bono, 2002), which is positively correlated with academic
performance (Robbins et al., 2004), indicating that Emotional Stability should similarly be
correlated. De Raad and Schouwenburg (1996) argued that students who are high on
Extraversion will perform better academically because of higher energy levels, along with a
positive attitude leading to a desire to learn and understand. On the other hand, they cited
Eysenck (1992) who suggested that these same students would be more likely to socialize and
pursue other activities rather than studying, leading to lower levels of performance.
Unfortunately, it is not clear from De Raad and Schouwenburg which of these effects is more
likely to affect academic performance. Finally, De Raad and Schouwenburg (1996) stated that
Openness appears to reflect “the ideal student” (p. 327), because of its association with being
foresighted, intelligent and resourceful. Correspondingly, Openness is positively correlated with
approach to learning (Vermetten, et al., 2001), learning motivation (Tempelaar, Gijselaers, van
der Loeff, & Nijhuis, 2007) and critical thinking (Bidjerano & Dai, 2007), but it also has the
strongest negative correlation with absenteeism (Lounsbury, Steel, Loveland, & Gibson, 2004)
of the FFM factors.
In summary, a range of arguments supports associations between academic performance
and each of the FFM dimensions. Most of these arguments depend on correlations between FFM
measures and other constructs that have been associated with academic performance. Although
suggestive, such arguments are inconclusive because the correlations cited in the various studies
are not strong enough to definitively establish the corresponding FFM–academic performance
relationships. This emphasizes the importance of directly testing the relationships between the
FFM dimensions and academic performance.
A Meta-Analysis of … 14
Potential Moderators of Academic Performance–Personality Correlations
Although meta-analysis is a useful tool for integrating research findings, one of its major
advantages is that it allows an examination of the extent to which findings are due to either
random sampling error or systematic variations (heterogeneity) between studies (Hunter &
Schmidt, 2004). Such heterogeneity indicates the presence of moderators of observed
relationships and it is valuable to identify both the existence and the nature of these moderators
(Steel & Kammeyer-Mueller, 2002). Two potential moderators of the relationship between
personality and academic performance were examined in this research. Previous researchers have
found that as academic level rose from primary to tertiary education, correlations of academic
performance with intelligence declined (Jensen, 1980), correlations with gender rose (Hyde,
Fennema, & Lamon, 1990), and correlations with socioeconomic status (Sirin, 2005) and
measures of self-concept (Hansford & Hattie, 1982) first rose, then fell. The increasing diversity
of educational and assessment practices at higher levels of education (Tatar, 1998) could help to
explain this. Such diversity may result in changes in the constructs being measured by grades and
GPA, leading to changes in correlations with other variables. Alternatively, the moderating effect
of academic level may be due to the presence of methodological artifacts. Reduced participation
in education at higher academic levels can lead to range restriction (Chamorro-Premuzic &
Furnham, 2006; Jensen, 1980). This is likely to reduce observed correlations, but would not
account for rising correlations with gender, or the more complex relationships with
socioeconomic status and self-concept. Regardless of the explanation, the previously-observed
potency of academic level as a moderator of correlations with academic performance means it
should be examined as a potential moderator of correlations between academic performance and
personality.

A Meta-Analysis of … 15
Farsides and Woodfield (2003) argued that age also moderates personality–academic
performance correlations; however, these authors did not specifically test this. Increasing age is
associated with reduced correlations between academic performance and intelligence (Laidra,
Pullman, & Allik, 2007), but has also been observed to moderate other relationships with
academic performance. For example, the relationship between Emotional Stability and academic
performance has been observed to become more positive with older students, at least in primary
education (De Raad & Schouwenburg, 1996), and it has been suggested that age produces a
stronger negative correlation between Extraversion and academic performance among secondary
education students (Eysenck & Eysenck, 1985). Yet, the effect of age on these correlations has
not been systematically examined, so its true effect remains an open question. Academic level
and age are associated, but age has different consequences at different educational levels:
cognitive performance is significantly more amenable to practice effects at younger ages
(Lindenberger, Li, Lövdén, & Schmiedek, 2007) and a year of aging produces different
outcomes for students in primary, secondary or tertiary education. Consequently, an effective
analysis of the moderating effects of age and academic level requires an examination of the
interaction of these variables.
In summary, this meta-analysis was undertaken to thoroughly review the relationship
between measures of the FFM and academic performance. This allowed a test of the extent to
which the FFM dimensions, as components of students’ willingness to perform academically,
were linked to academic performance, as well as testing the lexical hypothesis, and the extent to
which these relationships mirrored relationships between intelligence and academic performance.
At the same time, it provided the opportunity to examine the moderating influence of academic
level and age upon academic performance-personality correlations.

A Meta-Analysis of … 16
Method
Sample
A search of the following databases was conducted in order to identify relevant articles
for this review: PsycINFO (a database referencing psychology research); ISI Web of Science
databases (referencing science, social science, and arts and humanities publications); MEDLINE
(lifesciences and biomedical research); ERIC (education publications); and ProQuest
Dissertations and Theses database (unpublished doctoral and thesis research). The database
searches used the following terms and Boolean operators: (academic OR education OR
university OR school) AND (grade OR GPA OR performance OR achievement) AND
(personality OR temperament). All articles that had been published and all dissertations that had
been presented prior to the end of 2007 were considered for inclusion within the meta-analysis.
Abstracts of the studies identified with this search were then reviewed in order to identify articles
that may be relevant. Copies of these articles were obtained then examined to determine whether
at least one or more measures that had been designed to assess the FFM had been correlated with
measures of academic performance. Unusual inclusions were the studies by Duff, Boyle,
Dunleavy, and Ferguson (2004) and Moseley (1998), which used a version of the 16PF that had
been specifically revalidated to assess the FFM. Although restricting the meta-analysis to FFM
measures excluded correlations with comparable measures, such as the Extraversion and
Neuroticism scales of the Eysenck Personality Questionnaire (Eysenck & Eysenck, 1975), it had
the advantage of ensuring that all studies used measures that had been validated as assessing the
FFM dimensions.
Articles that only reported on measures that were not specifically related to academic
outcome were excluded from the meta-analysis. For example, Stewart (2001) used a measure of
past performance that actually assessed participants’ reactions to their performance, rather than
A Meta-Analysis of … 17
their academic performance per se, while Hogan and Holland (2003) reported a meta-analytic
correlation with a measure called “school success”, which in fact is a personality measure.
Correlations with measures of class attendance or course completion were also excluded.
Care was taken to exclude studies that were based on the same data-set as a study that
had already been included in the meta-analysis. For example, a research team based at the
University of Tennessee has published a series of articles that presented correlations between
FFM measures and GPA in school students (Barthelemy, 2005; Dunsmore, 2006; Friday, 2005;
Lounsbury, Gibson, & Hamrick, 2004; Lounsbury, Gibson, Sundstrom, Wilburn, & Loveland,
2004; Lounsbury, Steel, Loveland, & Gibson, 2004; Lounsbury, Sundstrom, Loveland, &
Gibson, 2003a, 2003b; Loveland, Lounsbury, Welsh, & Buboltz, 2007; Perry, 2003). The most
inclusive of these samples appears to be that reported by Perry (2003), so that was used in this
study. However, the data reported by Perry (2003) did not cover samples of primary level
students, so these were obtained from the relevant articles (Lounsbury, Gibson, & Hamrick,
2004; Lounsbury, Gibson, Sundstrom, et al., 2004; Lounsbury, et al., 2003a, 2003b). Similarly,
although Lounsbury et al., (2003a; 2003b) and Loveland, et al., (2007) addressed different
research questions, the correlations reported by Loveland et al., (2007) that were relevant to this
meta-analysis appear to based on samples used in the other articles, so the Loveland et al.
correlations were excluded. Other studies that were excluded from the meta-analysis because
they had been covered elsewhere were the studies by Loveland (2004) and Rogers (2005). At the
end of this process, a list of 80 research reports (63 published articles and 17 unpublished
dissertations) had been compiled.
A Meta-Analysis of … 18
Coding
In some cases, more than one set of correlations was reported from the same sample (e.g.,
Marsh, Trautwein, Lüdtke, Köller, & Baumert, 2006 present correlations with grades in several
courses as well as with GPA). When these correlations were with academic performance criteria
at different educational levels (e.g., Woodfield, Jessop, & McMillan, 2006 present correlations
with both secondary and tertiary education performance), both correlations were included in the
sample. However, when these correlations were each based on measures at the same academic
level (e.g., tertiary education), the correlations with the most broadly–based academic
performance measure were used (i.e., course grade was used in preference to individual
assessments and GPA used in preference to course grade). An exception to this was if the more
broadly–based measure was obtained using self-report (e.g., Conard, 2006; and Ridgell &
Lounsbury, 2004 used both self-reported GPA and a course assessment). For these cases, the
independently assessed measure was used in order to minimize common-method bias. Only three
sets of correlations based on self-reported academic performance were used (i.e., Day,
Radosevich, & Chasteen, 2003; Gray & Watson, 2002; and Lounsbury, Huffstetler, Leong, &
Gibson, 2005).
One study (Schmit, Ryan, Stierwalt, & Powell, 1995) reported correlations using multiple
administration variations for the FFM, only one of which was directly comparable to that used in
the other studies. Specifically, Schmit et al. (1995) requested students to rate their personality
using either standard instructions or using a specific frame–of–reference, such as “at work.”
Only the results obtained using standard administration procedures were used in this meta-
analysis. When articles included multiple relevant correlations from the same sample(s),
averages of the correlations with the various performance measures were calculated for use in the
meta-analysis. Another issue related to FFM measures is the use of diverging labels for the same

A Meta-Analysis of … 19
scales. Apart from taking care when coding, this becomes most important with respect to the
Emotional Stability dimension, which is often called Neuroticism, reflecting the opposite pole of
the same measure. In this case, all correlations between Neuroticism and academic performance
had their arithmetic sign reversed (e.g., minus to plus) when coding results, to allow
comparability. Many of the articles in the database also reported correlations with measures of
intelligence. For the purposes of the analyses presented here, scores on the SAT and the ACT
were used as measures of intelligence because both have been found to be valid measures of this
factor (Frey & Detterman, 2004; Jackson & Rushton, 2006; Koenig, Frey, & Detterman, 2008).
Some studies did not report conventional correlations. For example, Cucina and
Vasilopoulos (2005) only reported standardized regression weights, but Hunter and Schmidt
(2004) claimed that standardized regression weights could be validly used in meta-analyses in
place of correlations. By contrast, Wu (2004)’s regression weights were unstandardized, so they
were converted using standard deviations of predictor and criterion variables (Bring, 1994).
Standard deviations for the FFM scales used by Wu (2004) were obtained from Wu, Lindsted,
Tsai, and Lee (2008), but the standard deviation for the academic performance measure was
calculated from the average of the 95% confidence intervals reported by Wu (2004).
Wherever possible, studies were coded with respect to the proposed moderators by using
data from the original report. Unfortunately, several studies did not report information on age,
but among studies that did so there was a strong correlation (over .9) between year of study (e.g.,
grade 10 of secondary education, or second year of tertiary education) and age. Consequently, if
average age was not directly reported, it was estimated on the basis of the year of study, with the
estimated age based on the average ages in other studies that used students in a similar year.

A Meta-Analysis of … 20
Statistical Corrections
For nearly two-thirds of the studies in this meta-analysis, FFM standard deviations were
unavailable for either the study sample, the original validation sample for the scales used, or
both. This precluded accurate assessment of range restriction on the FFM scales. Compulsory
education at primary and secondary level in the countries from which the studies were drawn
reduces the amount of selection bias with respect to academic performance, although this may
become more of an issue at ages that exceed the minimum school-leaving age. Tertiary education
is different, with many tertiary institutions restricting access based on prior academic
performance, thereby creating range restriction. However, none of the studies reported the
selection ratios used by the participating tertiary institutions. There do not appear to be valid
methods for estimating this form of range restriction, so no correction was used for range
restriction with academic performance. Although unsatisfactory, this is at least consistent with
many previous meta-analyses in which GPA was a criterion variable (e.g., Kuncel, Crede, &
Thomas, 2005; Kuncel, Hezlett, & Ones, 2001, 2004).
Estimates of Cronbach’s alpha provided by each study were used wherever possible to
correct correlations. Where studies did not report an estimate of alpha, estimates were obtained
from the original validating studies for the relevant personality scale. If no validating study was
available, an estimate of alpha derived from Viswesvaran and Ones’s (2000a) meta-analysis of
FFM reliabilities was used. Only three studies reported estimates of alpha for academic
performance (Bartone, Snook, & Tremble Jr., 2002; Ferguson, Sanders, O’Hehir, & James, 2000;
Lievens & Coetsier, 2002); however, Farsides and Woodfield (2003) reported sufficient data to
allow it to be calculated. For other studies, GPA was corrected using estimates of alpha obtained
from Bacon and Bean (2006), who provided estimates of GPA for periods ranging from one to
four years of study, while, self-reported GPA was corrected with Kuncel et al.’s (2005) estimate

A Meta-Analysis of … 21
of measurement reliability for self-reported college GPA (.90). For studies that relied on single
academic assessments, the estimates of alpha reported by Chamorro-Premuzic, Furnham and
Ackerman (2006) were used. In all cases, correlations were corrected for scale reliability prior to
combining the correlations into overall estimates.
Results
Substantial aggregated sample sizes were obtained for correlations with each FFM
dimension (from 58,522 for correlations with Agreeableness to 70,926 for correlations with
Conscientiousness). In comparison, Barrick et al.’s (2001) second-order meta-analysis included a
larger number of independent workplace samples (total k = 976) but their aggregated sample
sizes were substantially less (ranging from N = 23,225 to N = 48,100). Thus, this meta-analysis
provides a high level of power for statistically predicting academic performance.
After coding the statistics, an initial meta-analysis was conducted with all correlations for
each FFM dimension and intelligence. This initial analysis was conducted using the Hunter and
Schmidt (2004) random-effects method, in order to estimate population values for r and ρ, as
well as credibility values for the distribution of ρ and Cochran’s Q as an estimate of sample
heterogeneity. Credibility values and Q were calculated on the basis of correlations that were
corrected for internal reliability (alpha). Although Cochran’s Q is commonly reported, I2
(Higgins & Thompson, 2002) has been recommended as a supplement to Q when assessing
heterogeneity (Huedo-Medina, Sánchez-Meca, Marín-Martínez, & Botella, 2006) because,
unlike Q, I2 allows researchers to quantify heterogeneity and to compare the degree of
heterogeneity within different analyses. Thus an I2 value of 25% indicates that one quarter of the
variation between studies reflects systematic or heterogeneous variation, rather than random
sampling error.
A Meta-Analysis of … 22
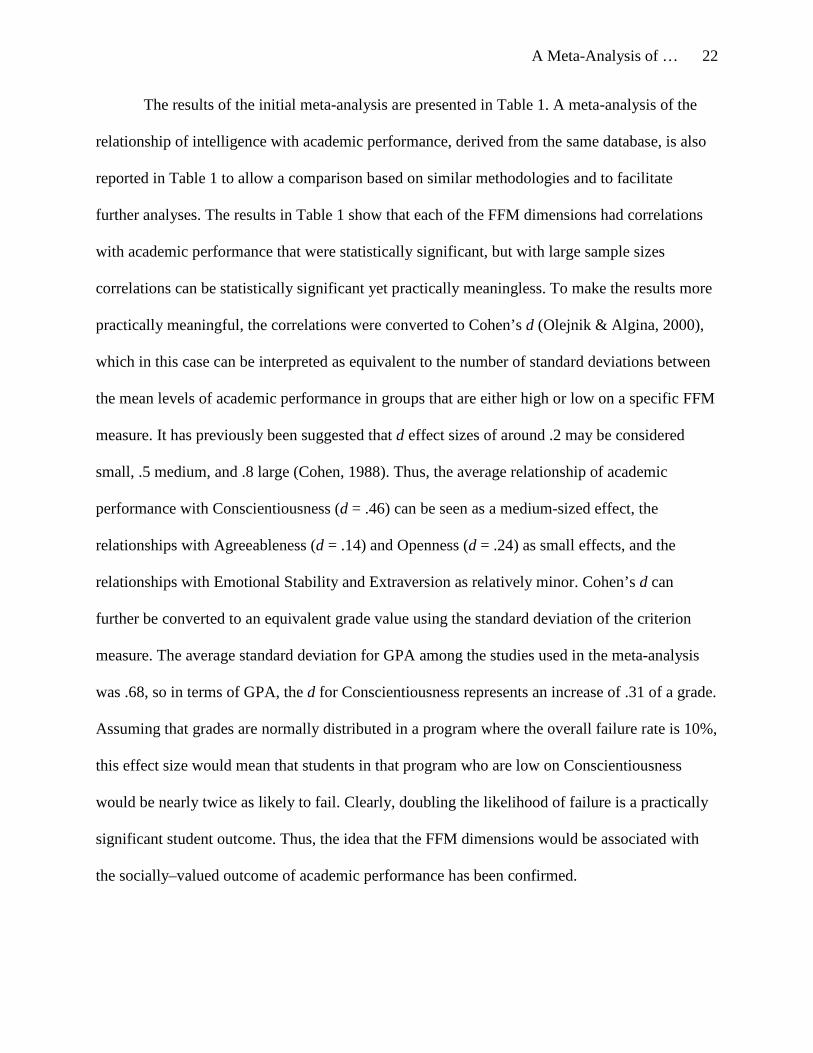
The results of the initial meta-analysis are presented in Table 1. A meta-analysis of the
relationship of intelligence with academic performance, derived from the same database, is also
reported in Table 1 to allow a comparison based on similar methodologies and to facilitate
further analyses. The results in Table 1 show that each of the FFM dimensions had correlations
with academic performance that were statistically significant, but with large sample sizes
correlations can be statistically significant yet practically meaningless. To make the results more
practically meaningful, the correlations were converted to Cohen’s d (Olejnik & Algina, 2000),
which in this case can be interpreted as equivalent to the number of standard deviations between
the mean levels of academic performance in groups that are either high or low on a specific FFM
measure. It has previously been suggested that d effect sizes of around .2 may be considered
small, .5 medium, and .8 large (Cohen, 1988). Thus, the average relationship of academic
performance with Conscientiousness (d = .46) can be seen as a medium-sized effect, the
relationships with Agreeableness (d = .14) and Openness (d = .24) as small effects, and the
relationships with Emotional Stability and Extraversion as relatively minor. Cohen’s d can
further be converted to an equivalent grade value using the standard deviation of the criterion
measure. The average standard deviation for GPA among the studies used in the meta-analysis
was .68, so in terms of GPA, the d for Conscientiousness represents an increase of .31 of a grade.
Assuming that grades are normally distributed in a program where the overall failure rate is 10%,
this effect size would mean that students in that program who are low on Conscientiousness
would be nearly twice as likely to fail. Clearly, doubling the likelihood of failure is a practically
significant student outcome. Thus, the idea that the FFM dimensions would be associated with
the socially–valued outcome of academic performance has been confirmed.
A Meta-Analysis of … 23
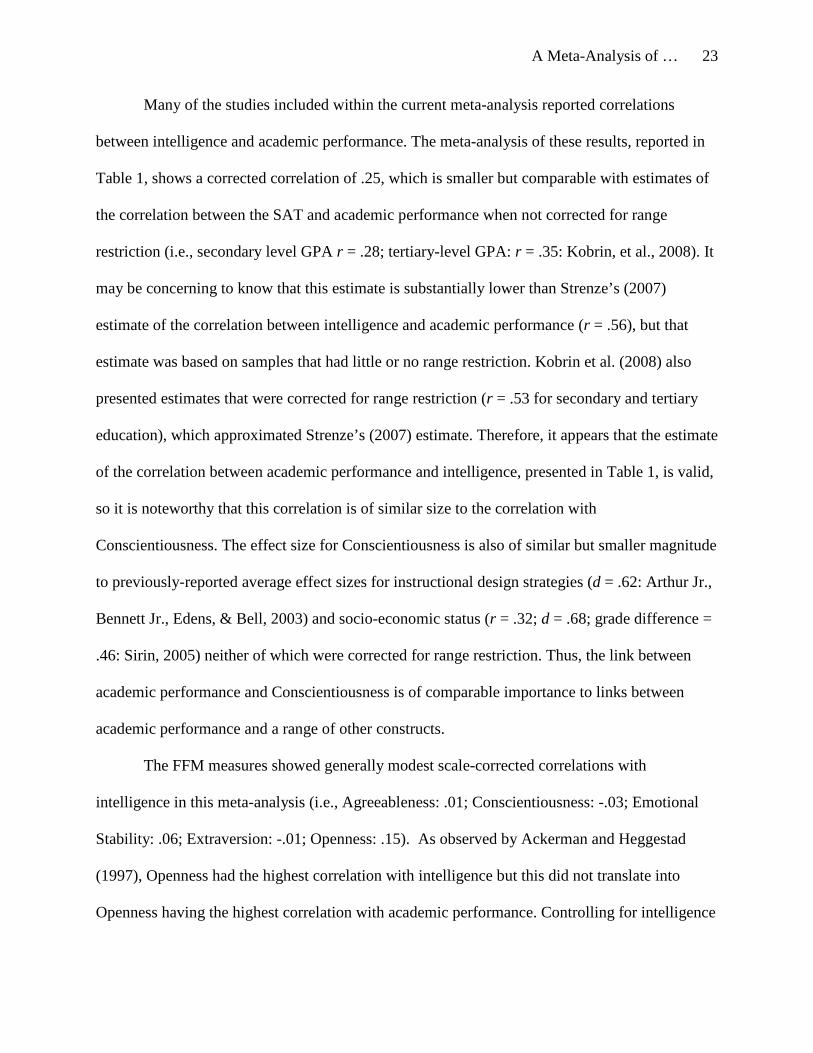
Many of the studies included within the current meta-analysis reported correlations
between intelligence and academic performance. The meta-analysis of these results, reported in
Table 1, shows a corrected correlation of .25, which is smaller but comparable with estimates of
the correlation between the SAT and academic performance when not corrected for range
restriction (i.e., secondary level GPA r = .28; tertiary-level GPA: r = .35: Kobrin, et al., 2008). It
may be concerning to know that this estimate is substantially lower than Strenze’s (2007)
estimate of the correlation between intelligence and academic performance (r = .56), but that
estimate was based on samples that had little or no range restriction. Kobrin et al. (2008) also
presented estimates that were corrected for range restriction (r = .53 for secondary and tertiary
education), which approximated Strenze’s (2007) estimate. Therefore, it appears that the estimate
of the correlation between academic performance and intelligence, presented in Table 1, is valid,
so it is noteworthy that this correlation is of similar size to the correlation with
Conscientiousness. The effect size for Conscientiousness is also of similar but smaller magnitude
to previously-reported average effect sizes for instructional design strategies (d = .62: Arthur Jr.,
Bennett Jr., Edens, & Bell, 2003) and socio-economic status (r = .32; d = .68; grade difference =
.46: Sirin, 2005) neither of which were corrected for range restriction. Thus, the link between
academic performance and Conscientiousness is of comparable importance to links between
academic performance and a range of other constructs.
The FFM measures showed generally modest scale-corrected correlations with
intelligence in this meta-analysis (i.e., Agreeableness: .01; Conscientiousness: -.03; Emotional
Stability: .06; Extraversion: -.01; Openness: .15). As observed by Ackerman and Heggestad
(1997), Openness had the highest correlation with intelligence but this did not translate into
Openness having the highest correlation with academic performance. Controlling for intelligence

A Meta-Analysis of … 24
had some effect on the correlations reported in Table 1, with the largest effects being to reduce
the correlation with Openness from .12 to .09, while the correlation with Conscientiousness
actually increased, due to its negative correlation with intelligence. Thus, this analysis is
inconsistent with Chamorro-Premuzic and Furnham’s (2006) argument that links between
personality and academic performance will largely be due to common links with intelligence.
------------------------------------
Insert Table 1 around here
------------------------------------
The significant Q statistics for correlations with each of the FFM factors, as well as
intelligence, indicate the presence of heterogeneity among the correlations, while the values for
I2 show that most of the variation between samples is systematic. These points indicate the
existence of substantial moderators of the relationship between the FFM dimensions and
academic performance. A range of statistical tools has been used to analyze summary results for
the presence of moderators, but some of these techniques can be problematic. Specifically, the
use of correlation, ordinary least squares regression, or Hunter and Schmidt’s (2004) hierarchical
sub-group analysis can produce biased and unreliable estimates in the presence of skewed
sample size distributions or multicollinearity (Steel & Kammeyer-Mueller, 2002). In contrast,
weighted least squares regression with sample size used to weight observations is relatively
unbiased under similar conditions, especially with larger numbers of studies (Steel &
Kammeyer-Mueller, 2002). In this meta-analysis, the sample size distribution was highly skewed
(skew = 6.62; standard error of skew = .21; p < .001) so weighted least squares regression was
used for the moderator analyses. Corrected correlations are more directly comparable than raw
correlations (Schmidt & Hunter, 1996), so they were used as the criterion variables.
A Meta-Analysis of … 25
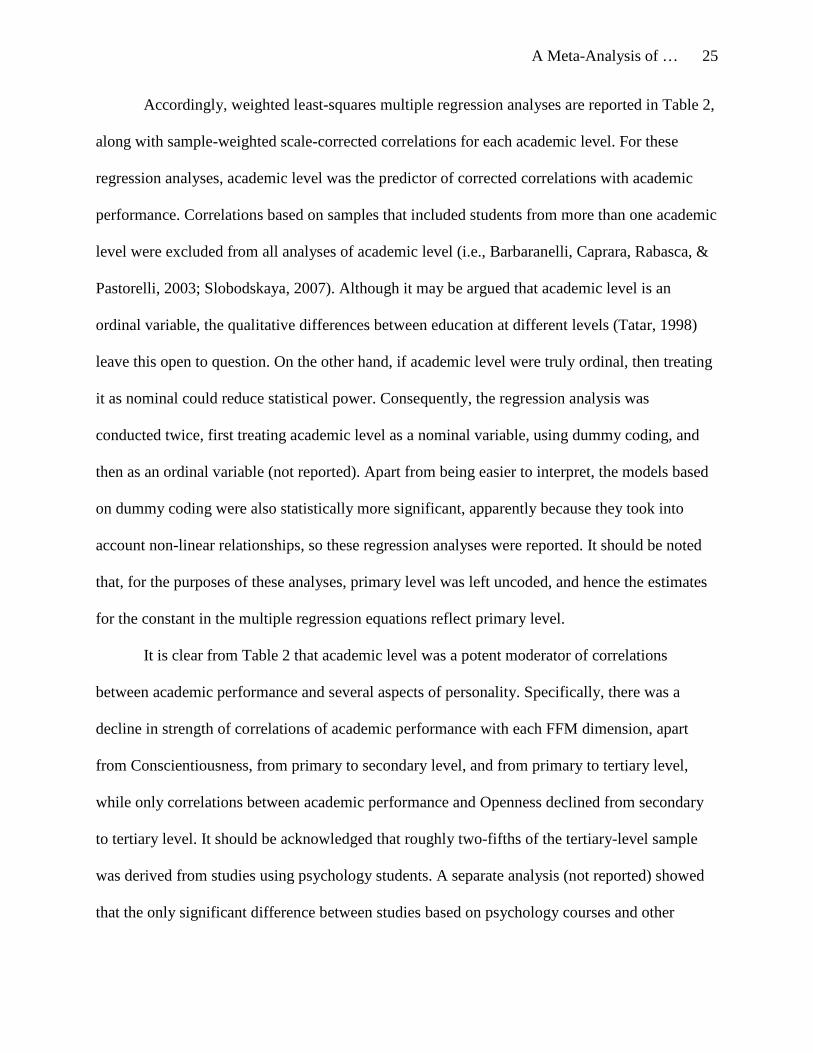
Accordingly, weighted least-squares multiple regression analyses are reported in Table 2,
along with sample-weighted scale-corrected correlations for each academic level. For these
regression analyses, academic level was the predictor of corrected correlations with academic
performance. Correlations based on samples that included students from more than one academic
level were excluded from all analyses of academic level (i.e., Barbaranelli, Caprara, Rabasca, &
Pastorelli, 2003; Slobodskaya, 2007). Although it may be argued that academic level is an
ordinal variable, the qualitative differences between education at different levels (Tatar, 1998)
leave this open to question. On the other hand, if academic level were truly ordinal, then treating
it as nominal could reduce statistical power. Consequently, the regression analysis was
conducted twice, first treating academic level as a nominal variable, using dummy coding, and
then as an ordinal variable (not reported). Apart from being easier to interpret, the models based
on dummy coding were also statistically more significant, apparently because they took into
account non-linear relationships, so these regression analyses were reported. It should be noted
that, for the purposes of these analyses, primary level was left uncoded, and hence the estimates
for the constant in the multiple regression equations reflect primary level.
It is clear from Table 2 that academic level was a potent moderator of correlations
between academic performance and several aspects of personality. Specifically, there was a
decline in strength of correlations of academic performance with each FFM dimension, apart
from Conscientiousness, from primary to secondary level, and from primary to tertiary level,
while only correlations between academic performance and Openness declined from secondary
to tertiary level. It should be acknowledged that roughly two-fifths of the tertiary-level sample
was derived from studies using psychology students. A separate analysis (not reported) showed
that the only significant difference between studies based on psychology courses and other

A Meta-Analysis of … 26
tertiary courses was that there was a slightly higher correlation of academic performance with
Conscientiousness in psychology (r = .28), which will have increased the correlation with
tertiary academic performance overall. In summary, although academic level had a significant
moderating effect, this varied depending on which dimension of the FFM and which academic
levels are considered.
Also presented in Table 2 are the results of examining the moderating effect of academic
level on correlations with intelligence. These too were significantly affected by academic level,
falling significantly from primary to secondary education, an observation which is consistent
with previously observed declines in correlations with intelligence due to range restriction
(Jensen, 1980). The meta-analytic correlations between intelligence and academic performance
were used to calculate partial correlations between FFM measures and academic performance,
while controlling for intelligence. As observed with the overall meta-analysis, controlling for
intelligence did have an effect on correlations with academic performance. When intelligence
was controlled for, correlations with Extraversion and Emotional Stability were most reduced by
controlling for intelligence at the primary education level. At all levels, correlations with
Agreeableness were least affected by controlling for intelligence, while correlations with
Conscientiousness increased slightly at the secondary and tertiary levels.
This analysis allowed an examination of the incremental prediction of tertiary level GPA
by FFM measures, over that provided by secondary level GPA, in similar fashion to an
assessment of the validity of SAT presented by Kobrin et al. (2008). Past behavior is typically
the best predictor of future behavior (Ouelette & Wood, 1998), so controlling for past behavior
— such as past academic performance — means this is a particularly rigorous test. A meta-
analytic estimate of the correlation between secondary- and tertiary-level GPA was obtained on

A Meta-Analysis of … 27
the basis of the studies in the database that reported correlations between secondary and tertiary
GPA (eight studies with a total N of 1581). The resulting scale-corrected correlation was .35, a
figure that is similar to the estimate of .36 (uncorrected for range restriction) provided by Kobrin
et al. (2008). When controlling for secondary GPA, the partial correlations of the FFM measures
with tertiary GPA were: Agreeableness rpartial = .05; Conscientiousness rpartial = .17; Emotional
Stability rpartial = -.01; Extraversion rpartial = .00; and Openness rpartial = .03. By way of
comparison, the corresponding partial correlation of intelligence with tertiary GPA was .14.
Thus, apart from Conscientiousness, the FFM measures added little to the prediction of tertiary
GPA over that provided by secondary GPA. However, Conscientiousness added slightly more to
the prediction of tertiary GPA than did intelligence, so has again been found to be a
comparatively important predictor of academic performance.
------------------------------------
Insert Table 2 around here
------------------------------------
Westen and Rosenthal’s (2003) indexes were used to assess the similarity between the
correlations obtained in this meta-analysis and those reported by Barrick et al. (2001) in their
meta-analysis of the FFM and work performance (i.e., scale-corrected correlation of work
performance with Agreeableness: .13; Conscientiousness: .27; Emotional Stability: .13;
Extraversion: .13; Openness: .07). Westen and Rosenthal’s alerting index (ralerting-CV) provides an
indication of the level of agreement between observed and predicted correlations but does not
allow a test of significance, while their contrast index (rcontrast-CV) provides a test of significance
but does not provide a valid estimate of the level of agreement with expectations, so these
indexes need to be used together. For the following analyses, the average aggregate sample sizes
A Meta-Analysis of … 28
reported in Tables 1 and 2 were used to calculate the significance level. When the estimates
obtained from the total sample (i.e., Table 1) are compared with Barrick et al.’s estimates, the
level of agreement between correlations of academic performance and the FFM measures was
substantial and significant (ralerting-CV = .64; rcontrast-CV = .12; p < .001). Interestingly, the degree of
agreement between the correlations reported here and those reported by Barrick et al. (2001)
increased from primary (ralerting-CV = .37; rcontrast-CV = .04; p < .05) to secondary (ralerting-CV = .60;
rcontrast-CV = .11; p < .001) and tertiary levels of education (ralerting-CV = .15; rcontrast-CV = .79; p <
.001). Thus, academic and work performance show more similarity in their relationships with the
FFM measures at higher levels of education.
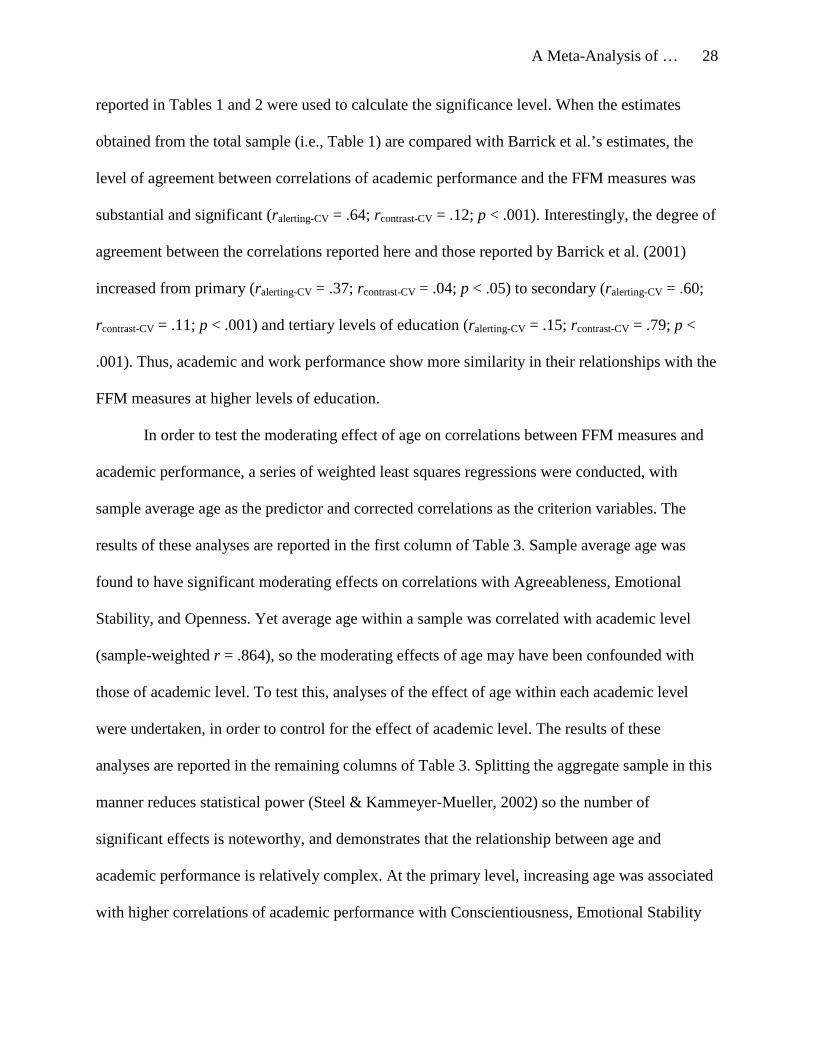
In order to test the moderating effect of age on correlations between FFM measures and
academic performance, a series of weighted least squares regressions were conducted, with
sample average age as the predictor and corrected correlations as the criterion variables. The
results of these analyses are reported in the first column of Table 3. Sample average age was
found to have significant moderating effects on correlations with Agreeableness, Emotional
Stability, and Openness. Yet average age within a sample was correlated with academic level
(sample-weighted r = .864), so the moderating effects of age may have been confounded with
those of academic level. To test this, analyses of the effect of age within each academic level
were undertaken, in order to control for the effect of academic level. The results of these
analyses are reported in the remaining columns of Table 3. Splitting the aggregate sample in this
manner reduces statistical power (Steel & Kammeyer-Mueller, 2002) so the number of
significant effects is noteworthy, and demonstrates that the relationship between age and
academic performance is relatively complex. At the primary level, increasing age was associated
with higher correlations of academic performance with Conscientiousness, Emotional Stability

A Meta-Analysis of … 29
and Extraversion, and lower correlations with Openness. At the secondary level, increasing age
was associated with declining correlations with Agreeableness, Emotional Stability, and
Openness. No significant moderating effects of age on correlations with academic performance
were observed at the tertiary level.
------------------------------------
Insert Table 3 around here
------------------------------------
In summary, the results of this meta-analysis showed that academic performance was
associated with measures based on the FFM, especially measures of Conscientiousness.
Conscientiousness had an overall association with academic performance that was of similar
magnitude to that of intelligence. Correlations of FFM measures with intelligence were not
mirrored by their correlations with academic performance, and controlling for intelligence had
little effect on these correlations — findings that ran counter to the expectations of earlier
writers. Of the FFM measures, only Conscientiousness retained most of its association with
tertiary academic performance when secondary academic performance was controlled for. Yet
this relatively clear picture belies the fact that most of the variation between samples was
systematic. The consequent moderator analyses explicated some of this underlying complexity.
Correlations of academic performance with each of the FFM measures, apart from
Conscientiousness, were reduced as educational level rose, while correlations with
Agreeableness, Emotional Stability and Openness all decreased with student age. Age interacted
with academic level to produce different effects in primary, secondary, and tertiary education for
each FFM dimension.

A Meta-Analysis of … 30
Discussion
This meta-analysis has provided the most comprehensive statistical review of the
relationship between personality and academic performance to date and has confirmed the
prediction of various writers since the early twentieth century that will or Conscientiousness
would be associated with academic performance. It is clear that dimensions of personality
identified on the basis of the lexical hypothesis can provide practically useful levels of statistical
prediction of the socially important criterion of academic performance. Unlike measures of
intelligence, personality measures based on the lexical hypothesis were not designed to predict
academic performance, so it is especially noteworthy that Conscientiousness and intelligence had
similar levels of validity at both the secondary and tertiary levels of education. Future
researchers and academics therefore need to seriously consider the role of personality, especially
Conscientiousness, within academic settings.
Some confirmation of the idea that personality would play a similar role in academic
performance to the one it plays in work performance was provided by the fact that
Conscientiousness was confirmed as the strongest FFM predictor of academic performance, just
as it has been found to be the strongest FFM predictor of academic performance. Further
parallels resulted from the comparison of correlations in the two settings using Westen and
Rosenthal’s (2003) indexes. These showed that, with respect to the role of personality, “school”
becomes more like work as students progress through their academic careers.
Likewise, the pattern of correlations in the overall meta-analysis did not reflect the
strength of correlations between intelligence and measures of the FFM. Further, controlling for
intelligence had only minor effects on the validity of the FFM measures, so the argument that
relationships between personality and academic performance are based purely or even largely on
their mutual relationships with intelligence is unsustainable. Instead, the FFM dimensions appear
A Meta-Analysis of … 31
to be part of the set of factors that contribute to performance by affecting students’ willingness to
perform. Although Agreeableness, Conscientiousness, and Openness had validities in the overall
sample that were practically significant, these validities were considerably smaller than the
validity of Conscientiousness. Only Conscientiousness had more than a trivial partial correlation
with tertiary academic performance when secondary academic performance was controlled for.
From a practical perspective, the results presented here have several implications. Apart
from previous academic performance, intelligence is probably the most used selection tool for
entrance to tertiary education, based on its well-established validity (Kobrin, et al., 2008;
Strenze, 2007). However, the usefulness of intelligence as a predictor of future academic
performance is reduced by its substantial overlap with previous academic performance and
because in real world applications selection panels are working with range-restricted groups of
applicants and cannot correct for measurement and methodological artifacts. Consequently, the
finding that within this research Conscientiousness showed similar levels of validity to
intelligence indicates that it is likely to have similar levels of practical utility, provided it can be
validly assessed. This qualification is important — faking is a much stronger possibility when
measuring personality rather than intelligence — and puts a premium on the construct validity of
any personality measures that may potentially be used for selection into academic programs. The
use of valid, educationally-based measures should be further encouraged by the findings that the
effect size for Conscientiousness is comparable with that of instructional design and that
Conscientiousness has a practically important association with failure rates.
In this context, FFM measures should also be useful for identifying students who are
likely to under-perform. Under-performance by capable students has been a major concern at
least since the middle of the previous century (Stein, 1963). The finding that measures of

A Meta-Analysis of … 32
personality can predict which students are more likely to fail should prompt the use of these
measures for identifying students who are at risk, allowing them to be targeted for assistance
programs. Such programs could well attempt to address personality-related deficits. For example,
it appears that students who are low on Conscientiousness may well fail because of reduced
effort and poor goal-setting (Barrick, et al., 1993), so these students may benefit from training or
guidance in these areas. Alternatively, teaching methods may be adjusted to adapt to the specific
personality styles of students in order to assist their learning.
Practitioners should, nonetheless, be cautious in applying the results of this research
because of the finding that substantial proportions of variations between studies was systematic,
rather than random. In this light, it is not surprising that earlier reviewers of personality’s role in
academic performance concluded that results were “erratic,” but this means that the correlations
reported here need to be interpreted with respect to various moderators. One moderator that may
account for much of this systematic variation is varying levels of range restriction between
samples in the meta-analysis. The differences between the estimates of the validity of
intelligence in this meta-analysis compared with previous studies (e.g., Kobrin et al., 2008;
Strenze, 2007) are consistent with the existence of substantial range restriction in the post-
primary samples. The inability to assess range restriction is a shortcoming of this study but other
moderators were able to be assessed, namely academic level and age.
Academic level
Correlations of academic performance with all the FFM measures, except
Conscientiousness, decreased from primary to secondary and from secondary to tertiary
education. The decline in these correlations from primary to secondary and tertiary levels
appears to mirror the previously mentioned decline in correlations between academic
A Meta-Analysis of … 33
performance and intelligence. Researchers on intelligence attribute this decline to increasing
levels of range restriction (Jensen, 1980), a factor that was not controlled for in this study.
However, if range restriction is used to explain the decline in correlations with most of the FFM
measures, it implies that the underlying true correlation between Conscientiousness and
academic performance may well increase substantially from the primary to tertiary level of
education because it showed no concomitant decline.
An alternative explanation relates to the increasing variety of learning environments and
activities experienced by students as they progress through their educational careers. It is
common for primary school children to have a standard curriculum within their school, state, or
nation, but secondary and tertiary education tend to be far more varied (Tatar, 1998). Any
interactions between personality and learning environments would tend to cloud and reduce
overall correlations between personality and academic performance, potentially leading to
declines in correlations. This would include cases in which different learning environments
produced different levels of grade inflation. If this is the reason for the moderating effect of
academic level, the matching of specific personality dimensions with specific academic criteria
should be pursued, much as has been advocated with respect to workplace criteria (Tett, Steele,
& Beauregard, 2003).
Age
Age was found to moderate academic performance–personality correlations, with
correlations with Agreeableness, Emotional Stability and Openness declining significantly as
sample average age increased. Although there has been considerable research on the
measurement of personality throughout the lifespan (see Caspi, Roberts, & Shiner, 2005 for a
review), few studies have examined the effect of age on the predictive validity of personality, so
A Meta-Analysis of … 34
the results of this meta-analysis are an important addition to knowledge in this area. However,
these results need to be considered in conjunction with the finding of the significant interaction
between age and academic level, and correlations between personality and academic
performance.
Interaction of age and academic level
A further level of complexity was added by the significant interaction between academic
level and age to produce complex patterns of academic performance–personality correlations.
Correlations between academic performance and personality rose and fell depending on the FFM
dimension and whether the correlation was obtained from samples in primary or secondary level
of education. One possible explanation for these moderating effects is based on the validity of
measurement of personality and academic performance. Measurement of personality in
childhood, adolescence, and adulthood are different. During the primary school years, children
undergo complex developmental processes, including changes in cognitive complexity and
psychological understanding (Wellman & Lagattuta, 2004), which are likely to affect their
ratings of their own personality and hence moderate the correlation between personality and
academic performance. To be fair, the studies in this meta-analysis that examined children all
utilized measures that were designed and validated specifically for children (cf., Laidra et al.,
2007; Lounsbury, Gibson & Hamrick, 2004), and children’s self-ratings of personality show
sound levels of temporal reliability (Caspi, et al., 2005), demonstrating that they continue to
measure similar underlying constructs over time. However, the factor structure and construct
validity of younger children’s self-assessments is less consistent than for adults, and improves
with age (Allik, Laidra, Realo, & Pullman, 2004; Lewis, 2001). Problems with factor structure
and construct validity will reduce correlations with independent variables, so the increase with

A Meta-Analysis of … 35
age of correlations between academic performance and Conscientiousness, Emotional Stability
and Extraversion during primary education may be a function of growing levels of construct
validity of children’s self-assessments. If this is accepted, and it is further accepted that children
are increasingly accurate in their self-assessments by the time they finish primary education, this
would mean that the correlations at that time are the most accurate reflections of the true
relationship between personality and performance at the primary level.
Increasingly valid measurement of personality at the primary education level may also
account for changes in correlations of Openness with academic performance, even though these
correlations fell rather than rose with increasing age. Openness is correlated with academic self-
efficacy and academic self-confidence (Peterson & Whiteman, 2007), so younger children may
be estimating their Openness partly on the basis of these factors. Specifically, younger children
may conflate their academic success and associated levels of knowledge and enjoyment of study
with aspects of Openness, such as being open-minded. If so, it means their self-assessments of
Openness will be less valid, and that increased validity of assessment with age should result in
declines in correlations between Openness and academic performance. Thus, the observed
moderating effects of age on correlations in primary education may be due to increasing levels of
validity of measurement of this personality factor.
Just as increasing validity of measurement of personality may account for changes in
correlations at the primary level, changes in the measurement of academic performance may help
to explain the declines in correlations with Agreeableness, Emotional Stability and Openness
with increasing age at the secondary level. One reviewer highlighted that grading practices at
different educational levels are subject to different pressures and that this can affect the nature of
academic assessment. At all levels, teachers face various social pressures with respect to grading,

A Meta-Analysis of … 36
based on their relationships with students and parents, and are subject to bias associated with
social desirability (Felson, 1980; Zahr, 1985). However, the importance of grades rises as
students progress through their secondary and tertiary education, because the consequences for
future study and career become increasingly salient. Students in primary education also have
much closer relationships with fewer teachers than they do in secondary education, while it is
common for tertiary-level teachers to have relatively distant relationships with students. Thus,
the relative weighting on achievement-oriented assessment practices, as opposed to assessments
that reflect social relationships, would tend to rise as students progress through their academic
careers. What this means is that assessments of academic performance should be increasingly
less associated with relationship factors as students age.
In primary education, the higher activity levels associated with Extraversion may affect
ratings by making a student more visible, thus affecting the ability of teachers to recall students’
performance, which is a significant moderator of performance ratings (Murphy & Cleveland,
1995). This effect would decline as relationships with teachers become more distant in secondary
education. Agreeableness, Conscientiousness and Emotional Stability are all associated with
social desirability (Digman, 1997), which has also been shown to affect performance ratings
(Murphy & Cleveland, 1995). Consequently, as assessments become more learning-orientated
and less socially–influenced, the association between measures of academic performance and
those associated with social desirability should fall, and the association with Agreeableness and
Emotional Stability apparently fell in step with that. On the other hand, correlations with
Conscientiousness remained stable throughout secondary and tertiary education, suggesting that
this dimension is not only socially desirable but also continues to facilitate learning. These
arguments do not necessarily imply that academic performance assessment in primary education
A Meta-Analysis of … 37
is invalid, because not all halo is invalid (Hoyt, 2000) and social desirability can itself be a valid
predictor of objective performance (Ones, Viswesvaran, & Reiss, 1996). However, it would
mean that the construct-level relationship reflected by the observed correlations between
personality and academic performance may be relatively complex. Future research is needed to
determine the validity of these explanations of the process by which these FFM measures are
linked to academic performance.
A further effect may add to the decline in correlations with Emotional Stability at the
secondary level. This dimension of personality has been found to moderate responses to stressors
(Suls & Martin, 2005) in such a manner that students who are low on Emotional Stability will
perform worse on stressful tests of ability (Dobson, 2000). Yet, among people with higher
intelligence, Emotional Stability has no relationship with performance on tests, apparently
because intelligence provides greater capacity for managing one’s emotional responses (Perkins
& Corr, 2006). Upwardly restricting the range of intelligence in students, which is believed to
occur as students progress through their academic careers (Jensen, 1980), may mean that only the
more intelligent students with low levels of Emotional Stability are retained in formal education.
These students may well have learnt strategies for managing their emotional reactions so that
their academic performance would not be affected by their level of Emotional Stability. If older
students with low Emotional Stability generally found tests, examinations and other academic
activities progressively less stressful, the advantage of having higher levels of Emotional
Stability would decline, as would correlations between academic performance and Emotional
Stability.

A Meta-Analysis of … 38
Limitations
Every research study involves making tradeoffs, and whereas this study was aided by the
use of broad, commonly–used measures of both personality (the FFM) and academic
performance (GPA), the use of these broad measures was also a significant limitation. These
broad factors facilitate comparability but hide details of relationships that may become apparent
with finer-grained analysis. For example, the complexities of relationships between intelligence
and personality, especially Extraversion (Wolf & Ackerman, 2005), have not been addressed in
this research. Other methodological limitations that have been mentioned, such as the lack of
correction for range, may have led to substantial underestimates of the strength of correlations.
Future research on the extent of range restriction at different academic levels would be helpful,
as would be the reporting of levels of range restriction by future researchers. This would not only
make meta-analyses easier — it would also make interpretation of results more accurate
(Schmidt & Hunter, 1996).
A further limitation was that it was not possible to test for the presence of non-linear
relationships between personality and academic performance. Eysenck & Cookson (1969) found
that the association of academic performance with Neuroticism was non-linear, while Cucina and
Vasilopoulos (2005) reported the presence of curvilinear relationships with Openness and
Conscientiousness. Even strong non-linear relationships may not produce significant linear
correlations and non-linearity can mask co–existing linear relationships. The existence of either
of these situations would mean the results reported here may underestimate the overall
correlations between personality and academic performance. Future researchers are encouraged
to examine their research for the presence of non-linearity in associations between academic
performance and personality.

A Meta-Analysis of … 39
Conclusion
In their review, De Raad and Schouwenburg (1996) concluded that “personality usually
comes at the bottom of the list of theorizing” (p.328) about learning and education. The results of
this meta-analysis indicate that personality should take a more prominent place in future theories
of academic performance, and not merely as an adjunct to intelligence. This research has
demonstrated that the optimism of earlier researchers on academic performance–personality
relationships was justified; personality is definitely associated with academic performance. At
the same time, the results of this research have provided further evidence of the validity of the
lexical hypothesis, as well as establishing a firm basis for viewing personality as an important
component of students’ willingness to perform. And, just as with work performance,
Conscientiousness has the strongest association with academic performance of all the FFM
dimensions and rivaled that of intelligence except in primary education. Yet the complications
highlighted by the moderator analyses indicate that the relationship between personality and
academic performance needs to be understood as a complex phenomenon in its own right.
Just as with work performance, future considerations of individual differences with
respect to academic performance will need to consider not only the g factor of intelligence, but
also the w factor of Conscientiousness. However, the strength of the various moderators
examined in this meta-analysis shows that, although it can be stated that personality is related to
academic performance, any such statement must be subject to qualifications relating to academic
level, age, and the interaction between these variables, and most likely also to range restriction.
The degree of heterogeneity identified within the samples indicates that there are likely to be
further substantial moderators to be identified. Although the role of personality in academic
A Meta-Analysis of … 40
performance may be both statistically and practically significant, it is also subtle, complex and in
need of much further exploration.

A Meta-Analysis of … 41
References
References marked with an asterisk indicate studies included in the meta-analysis.
Ackerman, P. L., & Heggestad, E. D. (1997). Intelligence, personality, and interests: Evidence
for overlapping traits. Psychological Bulletin, 121(2), 219-245.
*Allik, J., Laidra, K., Realo, A., & Pullman, H. (2004). Personality development from 12 to 18
years of age: Changes in mean levels and structure of traits. European Journal of
Personality, 18, 445-462.
Allport, G. W., & Odbert, H. S. (1936). Trait names: A psycho-lexical study. Psychological
Monographs, 47(1, Whole No. 211).
*Amelang, M., & Steinmayr, R. (2006). Is there a validity increment for tests of emotional
intelligence in explaining the variance of performance criteria? Intelligence, 34, 459-468.
Arthur Jr., W., Bennett Jr., W., Edens, P. S., & Bell, S. T. (2003). Effectiveness of training in
organizations: A meta-analysis of design and evaluation features. Journal of Applied
Psychology, 88(2), 234-256.
Ashton, M. C., Lee, K., Perugini, M., Szarota, P., de Vries, R. E., Di Blas, L., et al. (2004). A
six-factor structure of personality-descriptive adjectives: Solutions from psycholexical
studies in seven languages. Journal of Personality and Social Psychology, 86(2), 356-
366.
Bacon, D. R., & Bean, B. (2006). GPA in research studies: An invaluable but neglected
opportunity. Journal of Marketing Education, 28(1), 35-42.
*Barbaranelli, C., Caprara, G. V., Rabasca, A., & Pastorelli, C. (2003). A questionnaire for
measuring the Big Five in late childhood. Personality and Individual Differences, 34,
645-664.

A Meta-Analysis of … 42
*Barchard, K. A. (2003). Does emotional intelligence assist in the prediction of academic
success? Educational and Psychological Measurement, 63(5), 840-858.
Barrick, M. R., & Mount, M. K. (1991). The big five personality dimensions and job
performance: A meta-analysis. Personality Psychology, 44, 1-26.
Barrick, M. R., Mount, M. K., & Judge, T. A. (2001). Personality and performance at the
beginning of the new millennium: What do we know and where do we go next.
International Journal of Selection and Assessment, 9(1-2), 9-30.
Barrick, M. R., Mount, M. K., & Strauss, J. P. (1993). Conscientiousness and performance of
sales representatives: Test of the mediating effects of goal setting. Journal of Applied
Psychology, 78, 715-722.
Barthelemy, J. J. (2005). Aggression and the big five personality factors of grades and
attendance. Unpublished doctoral dissertation, University of Tennessee, Knoxville.
*Bartone, P. T., Snook, S. A., & Tremble Jr., T. R. (2002). Cognitive and personality predictors
of leader performance in West Point cadets. Military Psychology, 14(4), 321-338.
*Bauer, K. W., & Liang, Q. (2003). The effect of personality and precollege characteristics on
first-year acitivities and academic performance. Journal of College Student Development,
44(3), 277-290.
*Bidjerano, T., & Dai, D. Y. (2007). The relationship between the big-five model of personality
and self-regulated learning strategies. Learning and Individual Differences, 17(1), 69-81.
Blumberg, M., & Pringle, C. D. (1982). The missing opportunity in organizational research:
Some implications for a theory of work performance. Academy of Management Review,
7(4), 560-569.

A Meta-Analysis of … 43
*Bolwahnn, B. (2001). The effect of personality and precollege characteristics on first-year
acitivities and academic performance. Unpublished Master of Arts dissertation, Southern
Illinois University, Carbondale.
Bowles, S., & Gintis, H. (1999). Comments on "The long shadow of work". Critical Sociology,
25(2/3), 3-7.
Bowles, S., Gintis, H., & Meyer, P. (1999). The long shadow of work: Education, the family, and
the reproduction of the social division of labor. Critical Sociology, 25(2/3), 286-305.
*Bratko, D., Chamorro-Premuzic, T., & Saks, Z. (2006). Personality and school performance:
Incremental validity of self- and peer-ratings over intelligence. Personality and
Individual Differences, 41, 131-142.
Bring, J. (1994). How to standardize regression coefficients. The American Statistician, 48(3),
209-213.
Brown, A. L., & French, L. A. (1979). The zone of potential development: Implications for
intelligence testing in the year 2000. Intelligence, 3(3), 255-273.
*Burgard, M. E. The Five-Factor Model of personality and academic performance among
college students. Unpublished Masters Dissertation, Southern Connecticut State
University, New Haven.
*Busato, V., Prins, F. J., Elshout, J. J., & Hamaker, C. (2000). Intellectual ability, learning style,
personality, achievement motivation and academic success of psychology students in
higher education. Personality and Individual Differences, 29, 1057-1068.
Caspi, A., Roberts, B. W., & Shiner, R. L. (2005). Personality development: Stability and
change. Annual Review of Psychology, 56, 453-484.

A Meta-Analysis of … 44
*Chamorro-Premuzic, T. (2006). Creativity versus conscientiousness: Which is a better predictor
of student performance? Applied Cognitive Psychology, 20, 521-531.
*Chamorro-Premuzic, T., & Furnham, A. (2003a). Personality predicts academic performance:
Evidence from two longitudinal university samples. Journal of Research in Psychology,
37, 319-338.
*Chamorro-Premuzic, T., & Furnham, A. (2003b). Personality traits and academic examination
performance. European Journal of Personality, 17, 237-250.
Chamorro-Premuzic, T., & Furnham, A. (2006). Intellectual competence and the intelligent
personality: A third way in differential psychology. Review of General Psychology,
10(3), 251-267.
*Chamorro-Premuzic, T., Furnham, A., & Ackerman, P. L. (2006). Incremental validity of the
Typical Intellectual Engagement scale as predictor of different academic performance
measures. Journal of Personality Assessment, 87(3), 261-268.
*Clark, J. K. (2007). Relationship of personality and sleep to academic success in the United
States military academy: A perspective utilizing the five factor model of personality.
Unpublished Doctoral Dissertation, Fielding Graduate University, Santa Barbara, Calif.
Cohen, J. (1988). Statistical power analysis of the behavioral sciences. (2nd ed.). New York:
Academic Press.
*Colquitt, J. A., & Simmering, M. J. (1998). Conscientiousness, goal orientation, and motivation
to learn during the learning process: A longitudinal study. Journal of Applied Psychology,
83(4), 654-665.
*Conard, M. A. (2006). Aptitude is not enough: How personality and behavior predict academic
performance. Journal of Research in Personality, 40(339-346).
A Meta-Analysis of … 45
Costa, P. T., Jr., & McCrae, R. R. (1988). From catalog to classification: Murray's needs and the
Five-Factor Model. Journal of Personality and Social Psychology, 55, 258-265.
*Cucina, J. M., & Vasilopoulos, N. L. (2005). Nonlinear personality-performance relationships
and the spurious moderating effects of traitedness. Journal of Personality, 73(1), 227-
259.
*Day, E. A., Radosevich, D. J., & Chasteen, C. S. (2003). Construct- and criterion-related
validity of four commonly used goal orientation instruments. Contemporary Educational
Psychology, 28, 434-464.
*De Fruyt, F., & Mervielde, I. (1996). Personality and interests as predictors of educational
streaming and achievement. European Journal of Personality, 10, 405-425.
De Raad, B., & Schouwenburg, H. C. (1996). Personality in learning and education: A review.
European Journal of Personality, 10, 303-336.
*Di Fabio, A., & Busoni, L. (2007). Fluid intelligence, personality traits and scholastic success:
Empirical evidence in a sample of Italian high school students. Personality and
Individual Differences, 43(8), 2095-2104.
Digman, J. M. (1989). Five Robust Trait Dimensions: Development, Stability, and Utility.
Journal of Personality, 57(2), 195-214.
Digman, J. M. (1997). Higher-order factors of the Big Five. Journal of Personality and Social
Psychology, 73, 1246-1256.
*Diseth, A. (2003). Personality and approaches to learning as predictors of academic
achievement. European Journal of Personality, 17, 143-155.

A Meta-Analysis of … 46
Dobson, P. (2000). An investigation into the relationship between neuroticism, extraversion and
cognitive test performance in selection. International Journal of Selection and
Assessment, 8(3), 99-109.
*Dollinger, S. J., & Orf, L. A. (1991). Personality and performance in "personality":
Conscientiousness and openness. Journal of Research in Personality, 25(3), 276-284.
*Duff, A., Boyle, E., Dunleavy, K., & Ferguson, J. (2004). The relationship between personality,
approach to learning and academic performance. Personality and Individual Differences,
36, 1907-1920.
Dunsmore, J. A. (2006). An investigation of the predictive validity of broad and narrow
personality traits in relation to academic achievement. Unpublished doctoral dissertation,
University of Tennessee, Knoxville.
*Edwards, J. F. (1998). Several nonintellective variables and the "Big Five" personality factors
as predictors of academic performance by first-year college students. Unpublished
Master of Science, Mississippi State University.
*Ehrler, D. J. (2008). An investigation into the relation between the Five-Factor Model of
personality and educational achievement in children. Unpublished Doctoral Dissertation,
Georgia State University, Rome, Georgia.
Eysenck, H. J. (1992). Personality and education: The influence of Extraversion, Neuroticism
and Psychoticism. German Journal of Educational Psychology, 6, 133-144.
Eysenck, H. J., & Cookson, D. (1969). Personality in primary school children: 1. Ability and
achievement. British Journal of Educational Psychology, 39, 109-122.
Eysenck, H. J., & Eysenck, M. W. (1985). Personality and individual differences: A natural
sciences approach. New York: Plenum Press.
A Meta-Analysis of … 47
Eysenck, H. J., & Eysenck, S. B. G. (1975). Manual of the Eysenck Personality Questionnaire.
London: Hodder and Stoughton.
*Farsides, T., & Woodfield, R. (2003). Individual differences and undergraduate academic
success: The roles of personality, intelligence, and application. Personality and
Individual Differences, 33, 1225-1243.
Felson, R. B. (1980). Physical attractiveness, grades and teachers’ attributions of ability.
Representative Research in Social Psychology, 11(1), 64-71.
*Ferguson, E., James, D., O'Hehir, F., & Sanders, A. (2003). Pilot study of the roles of
personality, references, and personal statements in relation to performance over the five
years of a medical degree. British Medical Journal, 326, 429-431.
*Ferguson, E., Sanders, A., O' Hehir, F., & James, D. (2000). Predictive validity of personal
statements and the role of the Five–Factor Model of personality in relation to medical
training. Journal of Occupational and Organizational Psychology, 73(3), 321-344.
Flemming, E. G. (1932). College achievement, intelligence, personality, and emotion. Journal of
Applied Psychology, 16(6), 668-674.
Focquaert, F., Steven, M. S., Wolford, G. L., Colden, A., & Gazzaniga, M. S. (2007).
Empathizing and systemizing cognitive traits in the sciences and humanities. Personality
and Individual Differences, 43, 619-625.
Frey, M. C., & Detterman, D. K. (2004). Scholastic assessment or g? The relationship between
the scholastic assessment test and general cognitive ability. Psychological Science, 15(6),
373-378.
Friday, A. S. (2005). Criterion-related validity of Big Five adolescent personality traits.
Unpublished doctoral dissertation, University of Tennessee, Knoxville.

A Meta-Analysis of … 48
*Fritzche, B. A., McIntire, S. A., & Yost, A. P. (2002). Holland type as a moderator of
personality-performance predictions. Journal of Vocational Behavior, 60(3), 422-436.
Funder, D. C. (2001). Personality. Annual Review of Psychology, 52, 197-221.
*Furnham, A., & Chamorro-Premuzic, T. (2004). Personality and intelligence as predictors of
statistics examinations grades. Personality and Individual Differences, 37, 943-955.
*Furnham, A., Chamorro-Premuzic, T., & McDougall, F. (2002). Personality, cognitive ability,
and beliefs about intelligence as predictors of academic performance. . Learning and
Individual Differences, 14(1), 47-64.
*Garcia-Ruffin, N. (2003). The measurement of fear of success and its relationship to
personality, perceived parenting, study habits, and academic performance. Unpublished
Doctoral Dissertation, Fordham University, New York.
*Gerhardt, M. W., Rode, J. C., & Peterson, S. J. (2007). Exploring mechanisms in the
personality-performance relationship: Mediating roles of self-management and situational
constraints. Personality and Individual Differences, 43(6), 1344-1355.
*Goff, M., & Ackerman, P. L. (1992). Personality-intelligence relations: Assessment of typical
intellectual engagement. Journal of Educational Psychology, 84(4), 537-552.
Goldberg, L. R., & Rosolack, T. K. (1994). The Big-Five factor structure as an integrative
framework: An empirical comparison with Eysenck's P-E-N model. In C. F. Halverson,
G. A. Kohnstamm & R. P. Martin (Eds.), The Developing Structure of Temperament and
Personality From Infancy to Adulthood (pp. 7-35). Hillsdale N.J.: Lawrence Erlbaum.
Goldberg, L. R., Sweeney, D., Merenda, P. F., & Hughes, J. E. (1996). The Big-Five Factor
structure as an integrative framework: An analysis of Clarke's AVA Model. Human
Performance, 9, 441-471.
A Meta-Analysis of … 49
*Gray, E. K., & Watson, D. (2002). General and specific traits of personality and their relation to
sleep and academic performance. Journal of Personality, 70(2), 177-206.
Guion, R. M., & Gottier, R. F. (1965). Validity of personality measures in personnel selection.
Personnel Psychology, 18, 135-164.
*Hair, P., & Hampson, S. E. (2006). The role of impulsivity in predicting maladaptive behaviour
among female students. Personality and Individual Differences, 40, 943-952.
Hansford, B. C., & Hattie, J. A. (1982). The relationship between self and
achievement/performance measures. Review of Educational Research, 52(1), 123-142.
Harris, D. (1940). Factors affecting college grades: a review of the literature, 1930-1937.
Psychological Bulletin, 37(3), 125-166.
Haskell, R. E. (2001). Transfer of learning: Cognition, instruction, and reasoning. San Diego,
CA: Academic Press.
*Heaven, P. C. L., Ciarrochi, J., & Vialle, W. (2007). Conscientiousness and Eysenckian
psychoticism as predictors of school grades: A one-year longitudinal study. Personality
and Individual Differences, 42, 535-546.
Hendriks, A. A. J., Perugini, M., Angleitner, A., Ostendorf, F., Johnson, J. A., De Fruyt, F., et al.
(2003). The Five-Factor Personality Inventory: Cross-cultural generalizability across 13
countries. European Journal of Personality, 17, 347-372.
*Higgins, D. M., Peterson, J. B., Pihl, R. O., & Lee, A. G. M. (2007). Prefrontal cognitive
ability, intelligence, big five personality, and the prediction of advanced academic and
workplace performance. Journal of Personality and Social Psychology, 93(2), 298-319.
Higgins, J. P. T., & Thompson, S. G. (2002). Quantifying heterogeneity in a meta-analysis.
Statistics in Medicine, 21, 1539-1558.

A Meta-Analysis of … 50
*Hirsh, J. B. (2006). Predicting creativity and academic success with a '"fake-proof" measure of
the Big Five. Unpublished Masters Dissertation, University of Toronto, Toronto.
Hogan, J., & Holland, B. (2003). Using theory to evaluate personality and job-performance
relations: A socioanalytic perspective. Journal of Applied Psychology, 88(1), 100-112.
Hough, L. M. (1992). The “Big Five” personality variables—construct confusion: Description
versus prediction. Human Performance, 5(1/2), 139-155.
Hough, L. M. (2001). I/Owes its advances to personality. In B. W. Roberts (Ed.), Personality
psychology in the workplace: Decade of behavior. (pp. 19-44). Washington, DC:
American Psychological Association.
Hough, L. M., Eaton, N., K., Dunnette, M. D., Kamp, J. D., & McCloy, R. A. (1990). Criterion-
related validities of personality constructs and the effect of response distortion on those
validities. Journal of Applied Psychology, 75(5), 581-595.
Hoyt, W. T. (2000). Rater bias in psychological research: When is it a problem and what can we
do about it? Psychological Methods, 5(1), 64-86.
Huedo-Medina, T. B., Sánchez-Meca, J., Marín-Martínez, F., & Botella, J. (2006). Assessing
heterogeneity in meta-analysis: Q statistic or I2 Index? Psychological Methods, 11(2),
193-206.
Hunter, J. E., & Schmidt, F. L. (2004). Methods of meta-analysis: Correcting error and bias in
research findings. Thousand Oaks, CA: Sage.
Hunter, J. E., Schmidt, F. L., & Jackson, G. B. (1982). Meta-analysis: Cumulating research
findings across studies. Beverly Hills, CA: Sage.
Hyde, J. S., Fennema, E., & Lamon, S. J. (1990). Gender differences in mathematics
performance: A meta-analysis. Psychological Bulletin, 107(2), 139-155.

A Meta-Analysis of … 51
Jackson, D. N., & Rushton, J. P. (2006). Males have greater g: Sex differences in general mental
ability from 100,000 17- to 18-year-olds on the Scholastic Assessment Test. Intelligence,
34(5), 479-486.
Jensen, A. R. (1980). Bias in mental testing. New York: Free Press.
Johnson, V. E. (1997). An alternative to traditional GPA for evaluating student performance.
Statistical Science, 12(4), 251-269.
Judge, T. A., & Bono, J. E. (2002). A rose by any other name: Are self-esteem, generalized self-
efficacy, neuroticism, and locus of control indicators of a common construct? In B. W.
Roberts & R. T. Hogan (Eds.), Personality psychology in the workplace (pp. 93-118).
Washington DC: American Psychological Association.
Judge, T. A., & Ilies, R. (2002). Relationship of personality to performance motivation: A meta-
analytic review. Journal of Applied Psychology, 87(4), 797-807.
*Kessler, M. (2002). Conscientiousness, mastery, conflictual independence, and self-efficacy in
relationship to student adaptation and academic success during the first semester of
college: A comparative and predictive study of first - and second- generation college
students. Unpublished Doctoral Dissertation, Kent State University, Kent, Ohio.
*Klinkosz, W., Sekowski, A., & Brambring, M. (2006). Academic achievement and personality
in university students who are visually impaired. Journal of Visual Impairment &
Blindness, 100(11), 666-675.
Kobrin, J. L., Patterson, B. F., Shaw, E. J., Mattern, K. D., & Barbuti, S. M. (2008). Validity of
the SAT for predicting first-year college grade point average. New York: The College
Board.

A Meta-Analysis of … 52
Koenig, K. A., Frey, M. C., & Detterman, D. K. (2008). ACT and general cognitive ability.
Intelligence, 36(2), 153-160.
Kuncel, N. R., Crede, M., & Thomas, L. L. (2005). The validity of self-reported grade point
averages, class ranks, and test scores: A Meta-analysis and review of the literature.
Review of Educational Research, 75(1), 63-82.
Kuncel, N. R., Hezlett, S. A., & Ones, D. S. (2001). A comprehensive meta-analysis of the
predictive validity of the graduate record examinations: Implications for graduate student
selection and performance. Psychological Bulletin, 127(1), 162-181.
Kuncel, N. R., Hezlett, S. A., & Ones, D. S. (2004). Academic performance, career potential,
creativity, and job performance: Can one construct predict them all? Journal of
Personality and Social Psychology, 86(1), 148-161.
*Laidra, K., Pullman, H., & Allik, J. (2007). Personality and intelligence as predictors of
academic achievement: A cross-sectional study from elementary to secondary school.
Personality and Individual Differences, 42, 441-451.
*Langford, P. H. (2003). A one-minute measure of the Big Five?: Evaluating and abridging
Shafer's (1999a) Big Five markers. Personality and Individual Differences, 35, 1127-
1140.
*Laskey, M. L. (2004). Assessing the influence of self-efficacy, metacognition, and personality
traits on at-risk college students' academic performance and persistence. Unpublished
Doctoral Dissertation, Cardinal Stritch University, Milwaukee.
LeBreton, J. M., Burgess, J. R. D., Kaiser, R. B., Atchley, E. K., & James, L. R. (2003). The
restriction of variance hypothesis and interrater reliability and agreement: Are ratings
from multiple sources really dissimilar? Organizational Research Methods, 6(1), 80-128.

A Meta-Analysis of … 53
*Lee, F. K. (2004). Conscientiousness, neuroticism, and self-management strategies: a process
model of personality and achievement outcomes. Unpublished Doctoral Dissertation,
University of Missouri-Columbia, Columbia, Missouri.
Lewis, M. (2001). Issues in the study of personality development. Psychological Inquiry, 12(2),
67-83.
*Lievens, F., & Coetsier, P. (2002). Situational tests in student selection: An examination of
predictive validity, adverse impact and construct validity. International Journal of
Selection and Assessment, 10(4), 245-257.
*Lievens, F., Coetsier, P., De Fruyt, F., & De Maeseneer, J. (2002). Medical students'
personality characteristics and academic performance: a five-factor model perspective.
Medical Education, 36(11), 1050-1056.
Lindenberger, U., Li, S.-C., Lövdén, M., & Schmiedek, F. (2007). The Center for Lifespan
Psychology at the Max Planck Institute for Human Development: Overview of
conceptual agenda and illustration of research activities. International Journal of
Psychology, 42(4), 229-242.
Lounsbury, J. W., Gibson, L. W., & Hamrick, F. L. (2004). The development and validation of a
personological measure of work drive. Journal of Business and Psychology, 18(4), 427-
451.
Lounsbury, J. W., Gibson, L. W., Sundstrom, E., Wilburn, D., & Loveland, J. M. (2004). An
empirical investigation of the proposition that ‘School is Work’: A comparison of
personality–performance correlations in school and work settings. Journal of Education
and Work, 17(1), 119-131.

A Meta-Analysis of … 54
*Lounsbury, J. W., Huffstetler, B. C., Leong, F. T., & Gibson, L. W. (2005). Sense of identity
and collegiate academic achievement. Journal of College Student Development, 46(5),
501-514.
Lounsbury, J. W., Steel, R. P., Loveland, J. M., & Gibson, L. W. (2004). An investigation of
personality traits in relation to adolescent school absenteeism. Journal of Youth and
Adolescence, 33(5), 457-466.
*Lounsbury, J. W., Sundstrom, E., Loveland, J. M., & Gibson, L. W. (2003a). Intelligence, ‘‘Big
Five’’ personality traits, and work drive as predictors of course grade. Personality and
Individual Differences, 35, 1231-1239.
Lounsbury, J. W., Sundstrom, E., Loveland, J. M., & Gibson, L. W. (2003b). Broad versus
narrow personality traits in predicting academic performance of adolescents. Learning
and Individual Differences, 14(1), 67-77.
Loveland, J. M. (2004). Cognitive ability, Big Five, and narrow personality traits in the
prediction of academic performance. Unpublished Doctoral Dissertation, University of
Tennessee, Knoxville.
Loveland, J. M., Lounsbury, J. W., Welsh, D., & Buboltz, W. C. (2007). The validity of physical
aggression in predicting adolescent academic performance. British Journal of
Educational Psychology, 77(1), 167-176.
Margrain, S. A. (1978). Student characteristics and academic performance in higher education: A
review. Research in Higher Education, 8(2), 111-123.
*Marsh, H. W., Trautwein, U., Lüdtke, O., Köller, O., & Baumert, J. (2006). Integration of
multidimensional self-concept and core personality constructs: Construct validation and
relations to well-being and achievement. Journal of Personality, 74(2), 403-456.

A Meta-Analysis of … 55
*McKenzie, K., & Gow, K. (2004). Exploring the first year academic achievement of school
leavers and mature-age students through structural equation modelling. Learning and
Individual Differences, 14(2), 107-123.
*McKenzie, R. (2000). Psychological characteristics of pre-service elementary teachers: five
factor model, vocational personality characteristics, and efficacy. Unpublished Doctoral
Dissertation, Northern Arizona University, Flagstaff, Arizona.
*McManus, I. C., Livingston, G., & Katona, C. (2006). The attractions of medicine: The generic
motivations of medical school applicants in relation to demography, personality and
achievement. BMC Medical Education, 6(11), 1-15.
*Moon, S. M., & Illingworth, A. J. (2005). Exploring the dynamic nature of procrastination: A
latent growth curve analysis of academic procrastination. Personality and Individual
Differences, 38, 297-309.
*Moseley, P. L. (1998). The relationship of personality factors and academic preparedness with
participation in an undergraduate mentoring program. Unpublished Doctoral
Dissertation, Northern Arizona University, Flagstaff, Arizona.
Murphy, K. R., & Cleveland, J. N. (1995). Understanding performance appraisal: Social
organizational, and goal-based perspectives. Thousand Oaks, CA: Sage.
*Musgrave-Marquart, D., Bromley, S. P., & Dalley, M. B. (1997). Personality, academic
attribution, and substance use as predictors of academic achievement in college students.
Journal of Social Behavior and Personality, 12(2), 501-511.
Neisser, U., Boodoo, G., Bouchard, T. J. J., Boykin, A. W., Brody, N., Ceci, S. J., et al. (1996).
Intelligence: Knowns and unknowns. American Psychologist, 51(2), 77-101.

A Meta-Analysis of … 56
*Nguyen, N. T., Allen, L. C., & Fraccastoro, K. (2005). Personality predicts academic
performance: Exploring the moderating role of gender. Journal of Higher Education
Policy and Management, 27(1), 105-116.
Nijhuis, J., Segers, M., & Gijselaers, W. (2007). The interplay of perceptions of the learning
environment, personality and learning strategies: a study amongst International Business
Studies students. Studies in Higher Education, 32(1), 59-77.
*Noftle, E. E., & Robins, R. W. (2007). Personality predictors of academic outcomes: Big Five
correlates of GPA and SAT scores. Journal of Personality and Social Psychology, 93(1),
116-130.
O'Connor, M. C., & Paunonen, S. V. (2007). Big Five personality predictors of post-secondary
academic performance. Personality and Individual Differences, 43(5). 971-990.
OECD. (2007). Education at a glance 2007: OECD indicators. Paris: OECD Publishing.
*Okun, M. A., & Finch, J. F. (1998). The Big Five personality dimensions and the process of
institutional departure. Contemporary Educational Psychology, 23(3), 233-256.
Olejnik, S., & Algina, J. (2000). Measures of effect sizes for comparative studies: Applications,
interpretations, and limitations. Contemporary Educational Psychology, 25, 241-286.
Ones, D. S., Viswesvaran, C., & Reiss, A. D. (1996). Role of social desirability in personality
testing for personnel selection: The red herring. Journal of Applied Psychology, 81, 660–
679.
*Oswald, F. L., Schmitt, N., Kim, B. H., Ramsay, L. J., & Gillespie, M. A. (2004). Developing a
biodata measure and situational judgment inventory as predictors of college student
performance. Journal of Applied Psychology, 89(2), 187-207.

A Meta-Analysis of … 57
Ouellette, J. A., & Wood, W. (1998). Habit and intention in everyday life: The multiple
processes by which past behavior predicts future behavior. Psychological Bulletin,
124(1), 54-74.
*Parkinson, J., & Taggar, S. (2006). Intelligence, personality and performance on case studies.
Journal of Business and Psychology, 20(3), 395-408.
*Paunonen, S. V. (1998). Hierarchical organization of personality and prediction of behavior.
Journal of Personality and Social Psychology, 74(2), 538-556.
*Paunonen, S. V., & Ashton, M. C. (2001). Big Five predictors of academic achievement.
Journal of Research in Personality, 35, 78-90.
*Peeters, H., & Lievens, F. (2005). Situational judgement tests and their predictiveness of
college students' success: The influence of faking. Educational and Psychological
Measurement, 65(1), 70-89.
Perkins, A. M., & Corr, P. J. (2006). Cognitive ability as a buffer to neuroticism: Churchill's
secret weapon? Personality and Individual Differences, 40(1), 39-51.
*Perry, S. R. (2003). Big Five personality traits and work drive as predictors of adolescent
academic performance. Unpublished Doctoral Dissertation, University of Tennessee,
Knoxville, Tennessee.
*Peterson, C. H., Casillas, A., & Robbins, S. B. (2006). The student readiness inventory and the
Big Five: Examining social desirability and college academic performance. Personality
and Individual Differences, 41, 663-673.
Peterson, E. R., & Whiteman, M. C. (2007). "I think I can, I think I can..": The interrelationships
among self-assessed intelligence, self-concept, self-efficacy and the personality trait

A Meta-Analysis of … 58
intellect in university students in Scotland and New Zealand. Personality and Individual
Differences, 43(4), 959-968.
*Petska, K. S. (2007). Using personality variables to predict academic success in personalized
system of instruction. Unpublished Doctoral Dissertation, University of Nebraska-
Lincoln, Lincoln, NE.
*Phillips, P., Abraham, C., & Bond, R. (2003). Personality, cognition and university students'
examination performance. European Journal of Personality, 17(6), 435-448.
*Poropat, A. E. (2005). An examination of the relationship between personality and Citizenship
Performance in academic and workplace settings. Unpublished Doctoral Dissertation,
Griffith University, Brisbane, Qld.
*Ridgell, S. D., & Lounsbury, J. W. (2004). Predicting academic success: General intelligence,
“Big Five” personality traits, and work drive. College Student Journal, 38(4), 607-618.
Robbins, S. B., Lauver, K., Le, H., Davis, D., Langley, R., & Carlstrom, A. (2004). Do
psychosocial and study skill factors predict college outcomes? A meta-analysis.
Psychological Bulletin, 130(2), 271-288.
Roberts, B. W., Kuncel, N. R., Shiner, R. L., Caspi, A., & Goldberg, L. R. (2007). The power of
personality: The comparative validity of personality traits, socioeconomic status, and
cognitive ability for predicting important life outcomes. Perspectives on Psychological
Science, 2(4), 313-345.
Rogers, C. L. (2005). An investigation of the Big Five and narrow personality traits in relation to
academic performance. Unpublished Doctoral Dissertation, University of Tennessee,
Knoxville.

A Meta-Analysis of … 59
Rosenthal, R., & DiMatteo, M. R. (2001). Meta–analysis: Recent developments in quantitative
methods for literature reviews. Annual Review of Psychology, 52, 59-82.
Roth, P. L., BeVier, C. A., Schippman, J. S., & Switzer III, F. S. (1996). Meta–analysing the
relationship between grades and job performance. Journal of Applied Psychology, 81(5),
548-556.
*Santo, S. A. (2001). Virtual learning, personality, and learning styles. Unpublished Doctoral
Dissertation, University of Virginia, Charlottesville, Virginia.
Saucier, G. (2003). An alternative multi-language structure for personality attributes. European
Journal of Personality, 17, 179-205.
Saucier, G., & Goldberg, L. R. (1996). The language of personality: Lexical perspectives on the
five-factor model. In J. S. Wiggins (Ed.), The five-factor model of personality:
Theoretical perspectives. (pp. 21-50). New York: Guilford.
*Scepansky, J. A., & Bjornsen, C. A. (2003). Educational, orientation, NEO PI-R personality
traits, and plans for graduate school. College Student Journal, 37(4), 574-581.
Schmidt, F. L., & Hunter, J. E. (1996). Measurement error in psychological research: Lessons
from 26 research scenarios. Psychological Methods, 1, 199-223.
*Schmit, M. J., Ryan, A. M., Stierwalt, S. L., & Powell, A. B. (1995). Frame-of-Reference
effects on personality scale scores and criterion-related validity. Journal of Applied
Psychology, 80(5), 607-620.
Schuler, H., Funke, U., & Baron-Boldt, J. (1990). Predictive validity of school grades: A meta-
analysis. Applied Psychology: An International Review, 39(1), 89-103.
Sirin, S. R. (2005). Socioeconomic status and academic achievement: A meta-analytic review of
research. Review of Educational Research, 75(3), 417-453.
A Meta-Analysis of … 60
Slobodskaya, H. R. (2007). The associations among the Big Five, Behavioural Inhibition and
Behavioural Approach systems and child and adolescent adjustment in Russia.
Personality and Individual Differences, 43(4), 913-924.
Spearman, C. (1904). “General intelligence,” objectively determined and measured. . American
Journal of Psychology, 15, 201-293.
Spearman, C. (1927). The abilities of man. London: Macmillan.
Steel, P. D. (2007). The nature of procrastination: A meta-analytic and theoretical review of
quintessential self-regulatory failure. Psychological Bulletin, 133(1), 65-94.
Steel, P. D., & Kammeyer-Mueller, J. D. (2002). Comparing meta-analytic moderator estimation
techniques under realistic conditions. Journal of Applied Psychology, 87(1), 96-111.
Stein, M. I. (1963). Personality measures in admissions: Antecedents and personality factors as
predictors of college success. New York: College Entrance Examination Board.
Stewart, H. L., III. (2001). Effect of personality on the appraisal of future performance: A
dissertation. Unpublished Doctoral Dissertation, University of Iowa, Iowa City.
Strenze, T. (2007). Intelligence and socioeconomic success: A meta-analytic review of
longitudinal research. Intelligence, 35, 401-426.
Suls, J., & Martin, R. (2005). The daily life of the garden-variety neurotic: Reactivity, stressor
exposure, mood spillover, and maladaptive coping. Journal of Personality, 73(6), 1-25.
Tatar, M. (1998). Primary and secondary school teachers' perceptions and actions regarding their
pupils' emotional lives. School Psychology International, 19(2), 151-168.
Tempelaar, D. T., Gijselaers, W. H., van der Loeff, S. S., & Nijhuis, J. F. H. (2007). A structural
equation model analyzing the relationship of student achievement motivations and
A Meta-Analysis of … 61
personality factors in a range of academic subject-matter areas. Contemporary
Educational Psychology, 32(1), 105-131.
Tett, R. P., Steele, J. R., & Beauregard, R. S. (2003). Broad and narrow measures on both sides
of the personality-job performance relationship. Journal of Organizational Behavior, 24,
335-356.
Thorndike, E. L. (1940). Human nature and the social order. New York: Macmillan.
Traag, T., van der Valk, J., van der Velden, R., de Vries, R., & Wolbers, M. H. J. (2005). Why
does education matter? Explaining the effect of the highest level of education attained by
school leavers on their labour market position. Pedagogische Studiën, 82(6), 453-469.
Trapmann, S., Hell, B., Hirn, J. O. W., & Schuler, H. (2007). Meta-analysis of the relationship
between the Big Five and academic success at university. Zeitschrift Fur Psychologie,
215(2), 132-151.
Trautwein, U., Ludtke, O., Schnyder, I., & Niggli, A. (2006). Predicting homework effort:
Support for a domain-specific, multilevel homework model. Journal of Educational
Psychology, 98(2), 438-456.
Vermetten, Y. J., Lodewijks, H. G., & Vermunt, J. D. (2001). The role of personality traits and
goal orientations in strategy use. Contemporary Educational Psychology, 26, 149-170.
Viswesvaran, C., & Ones, D. S. (2000a). Measurement error in “Big Five factors” personality
assessment: Reliability generalization across studies and measures. Educational and
Psychological Measurement, 60(2), 224-235.
Viswesvaran, C., Ones, D. S., & Schmidt, F. L. (1996). Comparative analysis of the reliability of
job performance ratings. Journal of Applied Psychology, 81(5), 557-574.

A Meta-Analysis of … 62
*Wagerman, S. A., & Funder, D. C. (2007). Acquaintance reports of personality and academic
achievement: A case for conscientiousness. Journal of Research in Personality, 41, 221-
229.
Webb, E. (1915). Character and Intelligence: An Attempt at an Exact Study of Character.
Cambridge, U.K.: Cambridge University Press.
Wellman, H. M., & Lagattuta, K. H. (2004). Theory of mind for learning and teaching: The
nature and role of explanation. Cognitive Development, 19(4), 479-497.
Westen, D., & Rosenthal, R. (2003). Quantifying construct validity: Two simple measures.
Journal of Personality and Social Psychology, 84(5), 608-618.
Willingham, W. W., Pollack, J. M., & Lewis, C. (2002). Grades and test scores: Accounting for
observed differences. Journal of Educational Measurement, 39(1), 1-37.
*Wintre, M. G., & Sugar, L. A. (2000). Relationships with parents, personality, and the
university transition. Journal of College Student Development, 41(2), 202-214.
Wolf, M. B., & Ackerman, P. L. (2005). Extraversion and intelligence: A meta-analytic
investigation. Personality and Individual Differences, 39, 531-542.
*Wolfe, R. N., & Johnson, S. D. (1995). Personality as a predictor of college performance.
Educational and Psychological Measurement, 55(2), 177-185.
*Woodfield, R., Jessop, D., & McMillan, L. (2006). Gender differences in undergraduate
attendance rates. Studies in Higher Education, 31(1), 1-22.
*Wu, K. (2004). The association of blood type on the the five factors of personality in Chinese
adolescents. Unpublished Doctoral Dissertation, Loma Linda University, Loma Linda,
California.

A Meta-Analysis of … 63
Wu, K., Lindsted, K. D., Tsai, S.-Y., & Lee, J. W. (2008). Chinese NEO-PI-R in Taiwanese
adolescents. Personality and Individual Differences, 44, 656-667.
Zahr, L. (1985). Physical attractiveness and Lebanese children’s school performance.
Psychological Reports, 56(1), 191-192.

A Meta-Analysis of … 64
Author Note
Arthur E. Poropat, Department of Management, Griffith University, Nathan, Australia.
This research was partially funded by a Griffith Business School Small Grant. My thanks
go to Adrian Wilkinson, Royce Sadler, Ashlea Troth, Glenda Strachan, and especially Sue Jarvis,
for their comments on earlier drafts. I am particularly thankful for the diligent research assistance
of Kelley Turner and Sue Ressia.
Correspondence concerning this article may be addressed to Arthur Poropat, Department
of Management, Griffith University, Nathan, Qld, Australia. 4111. E-mail:

A Meta-Analysis of … 65
Table 1
Correlations between FFM scales and Academic Performance
ρ : 95%
Credibility
Interval
FFM Scales k N r a ρ a d Grade
Diff.
Lower Upper Q a I2 ρg
Agreeableness 109 58522 .07 .07 .14 .10 -.16 .30 921.7 88.3% .07
Conscientiousness 138 70926 .19 .22 .46 .31 -.09 .54 1990.4 93.1% .24
Emotional Stability 114 59554 .01 .02 .03 .02 -.29 .32 1563.3 92.8% .01
Extraversion 113 59986 -.01 -.01 -.02 -.01 -.32 .30 1599.5 93.0% -.01
Openness 113 60442 .10 .12 .24 .16 .09 .17 1028.4 89.1% .09
Intelligence 47 31955 .23 .25 .52 .35 -.18 .68 1606.5 97.1% -
k = number of samples; N = aggregate sample; r = sample-weighted correlation; ρ = sample-
weighted correlation corrected for scale reliability; d = Cohen’s d; Grade Diff. = d expressed as
grade difference; Q = Cochran’s measure of homogeneity; I2 = Higgins & Thompson’s (2002)
measure of heterogeneity; ρg = ρ as partial correlation, controlled for intelligence.
a All estimates of r, ρ & Q are significant at p < .001
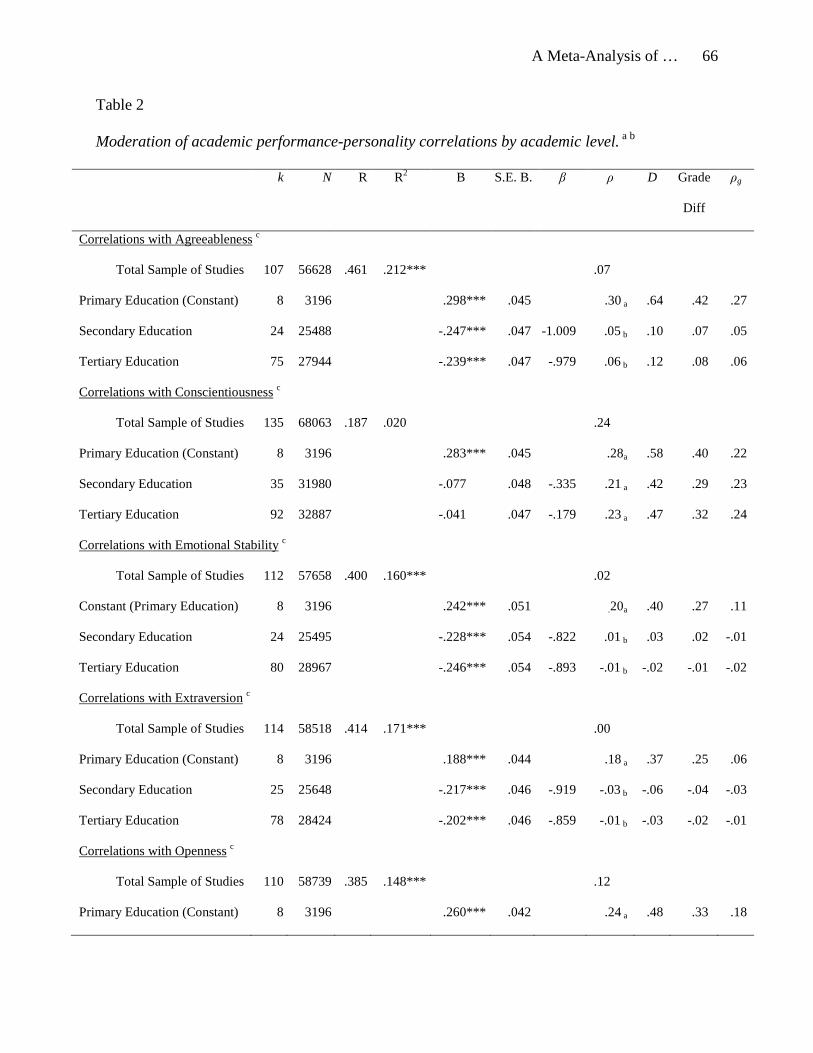
A Meta-Analysis of … 66
Table 2
Moderation of academic performance-personality correlations by academic level. a b
k N R R2 B S.E. B. β ρ D Grade
Diff
ρg
Correlations with Agreeableness c
Total Sample of Studies 107 56628 .461 .212*** .07
Primary Education (Constant) 8 3196 .298*** .045 .30 a .64 .42 .27
Secondary Education 24 25488 -.247*** .047 -1.009 .05 b .10 .07 .05
Tertiary Education 75 27944 -.239*** .047 -.979 .06 b .12 .08 .06
Correlations with Conscientiousness c
Total Sample of Studies 135 68063 .187 .020 .24
Primary Education (Constant) 8 3196 .283*** .045 .28a .58 .40 .22
Secondary Education 35 31980 -.077 .048 -.335 .21 a .42 .29 .23
Tertiary Education 92 32887 -.041 .047 -.179 .23 a .47 .32 .24
Correlations with Emotional Stability c
Total Sample of Studies 112 57658 .400 .160*** .02
Constant (Primary Education) 8 3196 .242*** .051 .20a .40 .27 .11
Secondary Education 24 25495 -.228*** .054 -.822 .01 b .03 .02 -.01
Tertiary Education 80 28967 -.246*** .054 -.893 -.01 b -.02 -.01 -.02
Correlations with Extraversion c
Total Sample of Studies 114 58518 .414 .171*** .00
Primary Education (Constant) 8 3196 .188*** .044 .18 a .37 .25 .06
Secondary Education 25 25648 -.217*** .046 -.919 -.03 b -.06 -.04 -.03
Tertiary Education 78 28424 -.202*** .046 -.859 -.01 b -.03 -.02 -.01
Correlations with Openness c
Total Sample of Studies 110 58739 .385 .148*** .12
Primary Education (Constant) 8 3196 .260*** .042 .24 a .48 .33 .18
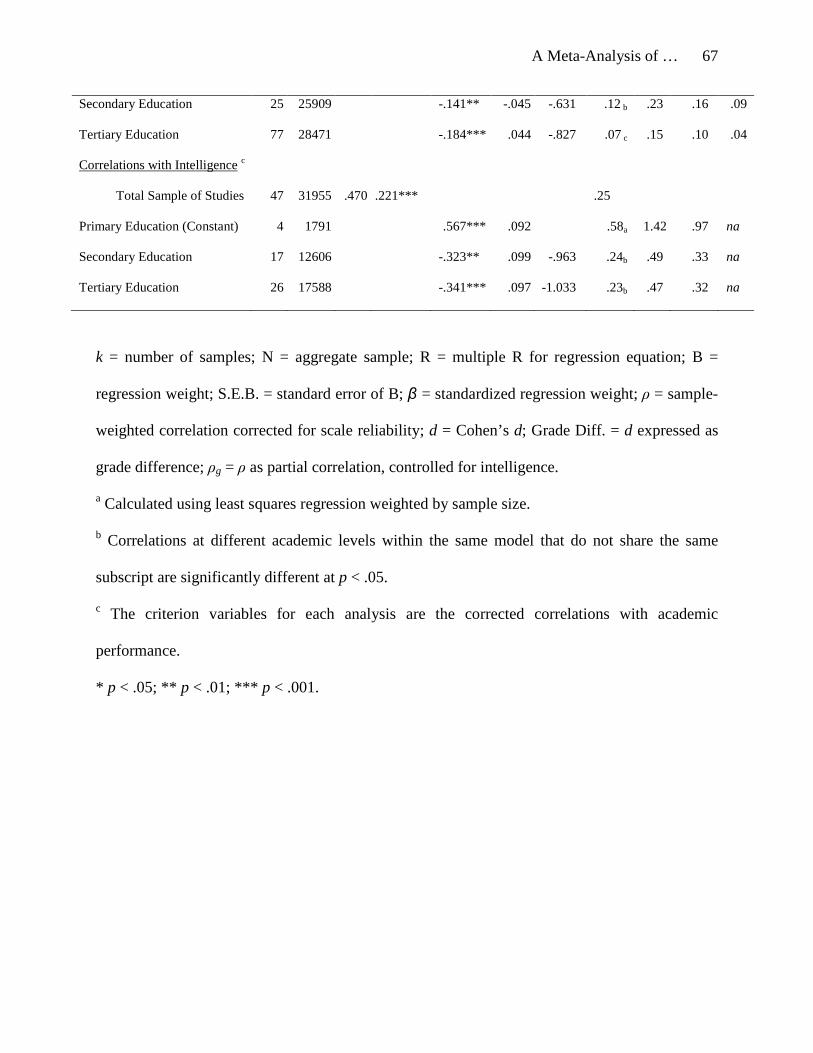
A Meta-Analysis of … 67
Secondary Education 25 25909 -.141** -.045 -.631 .12 b .23 .16 .09
Tertiary Education 77 28471 -.184*** .044 -.827 .07 c .15 .10 .04
Correlations with Intelligence c
Total Sample of Studies 47 31955 .470 .221*** .25
Primary Education (Constant) 4 1791 .567*** .092 .58a 1.42 .97 na
Secondary Education 17 12606 -.323** .099 -.963 .24b .49 .33 na
Tertiary Education 26 17588 -.341*** .097 -1.033 .23b .47 .32 na
k = number of samples; N = aggregate sample; R = multiple R for regression equation; B =
regression weight; S.E.B. = standard error of B; β = standardized regression weight; ρ = sample-
weighted correlation corrected for scale reliability; d = Cohen’s d; Grade Diff. = d expressed as
grade difference; ρg = ρ as partial correlation, controlled for intelligence.
a Calculated using least squares regression weighted by sample size.
b Correlations at different academic levels within the same model that do not share the same
subscript are significantly different at p < .05.
c The criterion variables for each analysis are the corrected correlations with academic
performance.
* p < .05; ** p < .01; *** p < .001.

A Meta-Analysis of … 68
Table 3
Moderating Effects of Age on Correlations of FFM scales and Academic Performance within
Academic Levels. a b
Total Sample Primary Education Secondary Education Tertiary Education
Sample Mean Age Sample Mean Age Sample Mean Age Sample Mean Age
Mean 17.21 11.11 16.12 20.43
Standard Deviation 3.77 1.57 2.45 2.79
Correlations of academic performance with:c
Agreeableness -.38*** (107) -.54 (8) -.42* (24) .17 (75)
Conscientiousness -.03 (135) .87** (8) -.12 (35) -.07 (92)
Emotional Stability -.44*** (111) .77* (8) -.63*** (24) -.14 (79)
Extraversion -.17 (109) .79* (8) .10 (24) .13 (77)
Openness -.43*** (110) -.76* (8) -.47* (25) .10 (77)
a Values in brackets refer to the number of studies used to calculate moderator effects.
b All moderator effects are beta weights, calculated using least squares regression weighted by
sample size.
c The criterion variables for each analysis are the corrected correlations with academic
performance.
* p < .05; ** p < .01; *** p < .001.