
A Mathematical Model of Force Generation by Flexible Kinetochore-Microtubule Attachments
10
A Mathematical Model of Force Generation by Flexible Kinetochore-Microtubule Attachments James P. Keener † and Blerta Shtylla ‡ * † Department of Mathematics, University of Utah, Salt Lake City, UT 84112; and ‡ Department of Mathematics, Pomona College, Claremont, CA 91711 ABSTRACT Important mechanical events during mitosis are facilitated by the generation of force by chromosomal kinetochore sites that attach to dynamic microtubule tips. Several theoretical models have been proposed for how these sites generate force, and molecular diffusion of kinetochore components has been proposed as a key component that facilitates kinetochore function. However, these models do not explicitly take into account the recently observed flexibility of kinetochore components and variations in microtubule shape under load. In this paper, we develop a mathematical model for kinetochore-microtubule connections that directly incorporates these two important components, namely, flexible kinetochore binder elements, and the effects of tension load on the shape of shortening microtubule tips. We compare our results with existing biased diffusion models and explore the role of protein flexibility inforce generation at the kinetochore-microtubule junctions. Our model results suggest that kinetochore component flexibility and microtubule shape variation under load significantly diminish the need for high diffusivity (or weak specific binding) of kinetochore components; optimal kinetochore binder stiffness regimes are predicted by our model. Based on our model results, we suggest that the underlying principles of biased diffusion paradigm need to be reinterpreted. INTRODUCTION The process of cell division involves a multitude of complex biochemical and mechanical events that lead to the equal partition of genetic material from the mother cell to the daughter cell. A fascinating and crucial process during division has to do with the generation and control of the movement of replicated chromosomes. A chromosome must interact with microtubules (Mts), which are part of a dynamic network called the mitotic spindle (1–6). Connections between chromosomes and Mts are mediated by macromolecular structures called kinetochores (kts) (7–10). A variety of proteins that can associate with Mts directly localize at kts, however; Mts also undergo continuous growth and shortening while their ends are attached to the kt sites. A question of con- siderable interest in this context is how the kt site might function as a force-generating machine capable of moving chromosome several microns. A natural contender for this task would be molecular motor enzymes (11). However, molecular motor enzymes that localize at kts have been shown to be dispensable for kt motion in yeast (12,13). Kt nonmotor components should thus have the ability to generate movement by latching on to Mt tips that constantly lose or gain monomers; how such a task is achieved is not clear. Force generation at kts has conse- quently attracted considerable interest from both an exper- imental standpoint and quantitative modeling approaches (14–16). Many components of kts have become known. Significant technical advances in high-resolution imaging have led to new insights regarding kt component spatial organization and copy numbers inside kts in a variety of organisms (17–19). A few proteins are emerging as important struc- tural components of kts. The Ndc80 complex is an elongated dumbbell-like molecule with a high degree of flexibility because of a hinge site around its halfway point (20–22) that connects on one side to the kt structure and on the other to the Mts (23–25). KMN proteins are conserved kt com- ponents that form the primary kt-Mt interface (26); these proteins have affinity for the Mt, and importantly form a scaffold that acts to localize several kt kinases. The Dam1/DASH complex is essential in budding yeast and can form rings or spirals in the presence of Mt (27,28). Although there is no evidence that this complex can form rings in organisms other than yeast, it remains an important component at the kt-Mt interface. Further, it has been shown that Dam1 contain flexible elements for interaction with the kinetochore microtubule (kMt) (29). Finally, the Mis12 complex is another conserved kt component that can directly bind to the chromosomal chromatin (30,31). Mts are polar hollow filaments composed of ab tubulin dimers that are arranged into linear chains called pro- tofilaments. During mitosis, Mts undergo stochastic transitions between states of growth and shortening, known as ‘‘dynamic-instability’’ (32). Mts have a built-in polarity, with the plus-end experiencing faster growth/ shortening than the minus-end. Tubulin adds to the Mt lattice in its Guanosine-triphosphate (GTP)-tubulin form; GTP is subsequently hydrolyzed into GDP-tubulin. The hydrolysis state of a tubulin dimer determines its preferred Submitted September 30, 2013, and accepted for publication January 7, 2014. *Correspondence: [email protected] Editor: Leah Edelstein-Keshet Ó 2014 by the Biophysical Society 0006-3495/14/03/0998/10 $2.00 http://dx.doi.org/10.1016/j.bpj.2014.01.013 998 Biophysical Journal Volume 106 March 2014 998–1007
Transcript of A Mathematical Model of Force Generation by Flexible Kinetochore-Microtubule Attachments

998 Biophysical Journal Volume 106 March 2014 998–1007
A Mathematical Model of Force Generation by FlexibleKinetochore-Microtubule Attachments
James P. Keener† and Blerta Shtylla‡*†Department of Mathematics, University of Utah, Salt Lake City, UT 84112; and ‡Department of Mathematics, Pomona College, Claremont,CA 91711
ABSTRACT Important mechanical events during mitosis are facilitated by the generation of force by chromosomal kinetochoresites that attach to dynamic microtubule tips. Several theoretical models have been proposed for how these sites generate force,and molecular diffusion of kinetochore components has been proposed as a key component that facilitates kinetochore function.However, these models do not explicitly take into account the recently observed flexibility of kinetochore components andvariations in microtubule shape under load. In this paper, we develop a mathematical model for kinetochore-microtubuleconnections that directly incorporates these two important components, namely, flexible kinetochore binder elements, andthe effects of tension load on the shape of shortening microtubule tips. We compare our results with existing biased diffusionmodels and explore the role of protein flexibility inforce generation at the kinetochore-microtubule junctions. Our model resultssuggest that kinetochore component flexibility andmicrotubule shape variation under load significantly diminish the need for highdiffusivity (or weak specific binding) of kinetochore components; optimal kinetochore binder stiffness regimes are predicted byour model. Based on our model results, we suggest that the underlying principles of biased diffusion paradigm need to bereinterpreted.
INTRODUCTION
The process of cell division involves a multitude of complexbiochemical and mechanical events that lead to the equalpartition of genetic material from the mother cell to thedaughter cell. A fascinating and crucial process duringdivision has to do with the generation and control of themovement of replicated chromosomes.
A chromosome must interact with microtubules (Mts),which are part of a dynamic network called the mitoticspindle (1–6). Connections between chromosomes andMts are mediated by macromolecular structures calledkinetochores (kts) (7–10). A variety of proteins that canassociate with Mts directly localize at kts, however; Mtsalso undergo continuous growth and shortening while theirends are attached to the kt sites. A question of con-siderable interest in this context is how the kt site mightfunction as a force-generating machine capable of movingchromosome several microns. A natural contender for thistask would be molecular motor enzymes (11). However,molecular motor enzymes that localize at kts have beenshown to be dispensable for kt motion in yeast (12,13).Kt nonmotor components should thus have the ability togenerate movement by latching on to Mt tips thatconstantly lose or gain monomers; how such a task isachieved is not clear. Force generation at kts has conse-quently attracted considerable interest from both an exper-imental standpoint and quantitative modeling approaches(14–16).
Submitted September 30, 2013, and accepted for publication January 7,
2014.
*Correspondence: [email protected]
Editor: Leah Edelstein-Keshet
� 2014 by the Biophysical Society
0006-3495/14/03/0998/10 $2.00
Many components of kts have become known. Significanttechnical advances in high-resolution imaging have led tonew insights regarding kt component spatial organizationand copy numbers inside kts in a variety of organisms(17–19). A few proteins are emerging as important struc-tural components of kts. The Ndc80 complex is an elongateddumbbell-like molecule with a high degree of flexibilitybecause of a hinge site around its halfway point (20–22)that connects on one side to the kt structure and on the otherto the Mts (23–25). KMN proteins are conserved kt com-ponents that form the primary kt-Mt interface (26); theseproteins have affinity for the Mt, and importantly form ascaffold that acts to localize several kt kinases. TheDam1/DASH complex is essential in budding yeast andcan form rings or spirals in the presence of Mt (27,28).Although there is no evidence that this complex can formrings in organisms other than yeast, it remains an importantcomponent at the kt-Mt interface. Further, it has been shownthat Dam1 contain flexible elements for interaction with thekinetochore microtubule (kMt) (29). Finally, the Mis12complex is another conserved kt component that candirectly bind to the chromosomal chromatin (30,31).
Mts are polar hollow filaments composed of ab tubulindimers that are arranged into linear chains called pro-tofilaments. During mitosis, Mts undergo stochastictransitions between states of growth and shortening,known as ‘‘dynamic-instability’’ (32). Mts have a built-inpolarity, with the plus-end experiencing faster growth/shortening than the minus-end. Tubulin adds to the Mtlattice in its Guanosine-triphosphate (GTP)-tubulin form;GTP is subsequently hydrolyzed into GDP-tubulin. Thehydrolysis state of a tubulin dimer determines its preferred
http://dx.doi.org/10.1016/j.bpj.2014.01.013

Force generation by flexible kinetochore-microtubule attachments. 999
conformation: GTP dimers are thought to lie parallel to theMt lattice, whereas Guanosine-diphosphate (GDP) tubulinprefers to bend away from the lattice (33). When a Mt disas-sembles, the tubulin at theMt tips experience both loss of theGTP cap and lateral interactions that causes protofilamentsto become relaxed and subsequently flare at the Mt ends(33,34). The plus-ends of Mts are embedded in the kt attach-ment site, and while attached, growth and shortening pre-vails. During this process, energy from GTP hydrolysis isreleased, and presumably this energy can be used by kt sitesto generate motion (35–38).
Most of the existing theoretical models of Mt-kt coupling(35,39–42) are based on one of two postulated mechanismsfor force generation. In the biased-diffusion model, initiallyproposed by Hill (35), the plus end of a kMt is assumed to besurrounded by a rigid coaxial ‘‘sleeve’’ the inner surface ofwhich is composed of several binding elements that bindspecific kMt sites. The one-dimensional Brownian motionof the sleeve along the axis of the kMt is biased to increaseoverlap, because a larger number of kMt-sleeve bindingslowers the total energy of the system. The interplay of thisbiased diffusion and the depolymerization of the kMt givesrise to the pull exerted by the coupler on the kt. The secondproposed ‘‘power-stroke’’ coupling mechanism is based onthe idea that the curling protofilament tips of a depoly-merizing Mt exert a force on a rigid kt-connected slidingring surrounding the Mt (40,41). These previous modelscapture several aspects of kt-Mt engagement; however,they ignore important mechanical features of the kt machinesuch as feedback between kMt protofilament shape and mul-tiple flexible kt binder attachments under load. Specifically,kMt protofilaments at the curling ends of depolymerizingMts can undergo shape changes when challenged by force.On the other hand, kMt protofilament shape can have signif-icant effects on kMt depolymerization speeds, and on theability of kt binders to engage with Mt tips. It is reasonableto expect that when modulation of Mt shape and ktbinder attachment dynamics under load are combinedtogether, mutual feedback might generate complex attach-ment responses. Novel modeling approaches are needed toaccount for these interactions.
Recent experimental results also highlight the need for anovel approach to kt-kMt modeling. There is evidence that
kts engage kMts through multivalent attachments that movealong Mts consistent with a biased diffusion mechanism(43). However, it also has been recently reported that allkt components are flexible, not rigid (44). Previous theoret-ical work that studied kt attachments in the biased-diffusionframework (including work from these authors (42))assumes that kt multivalent attachments are rigid. Impor-tantly, the role of kMt shape in depolymerization dynamicsand kt attachments has been largely ignored in previousmodeling work. Yet, recent data shows nonmonotonic sensi-tivity of kt-kMt attachment dynamics on the amount oftension load exerted on kts (45–47). These data collectivelyindicate that the kt/kMt juncture can respond to force incomplex ways and thereby the kt machine may work inregimes where the two standard classes of models currentlyused do not apply.
The purpose of this paper is to develop a new model offorce generation at the kt-Mt interface that incor-porates kt-component flexibility, kMt protofilament shapemechanics, and kMt depolymerization kinetics. Using ourmodel, we demonstrate how these features of kt juncturesaffect the ability of this attachment site to generate forcefor various parameter regimes. In so doing, we provide analternate mechanism to rigid sleeve-type biased diffusionfor kt force generation.
METHODS AND MATERIALS
Description of the Model
We start by briefly describing the proposed location and geometrical
arrangement of the components of the kt site. In Fig. 1 a we show a
three-dimensional model derived from high-resolution data from a previous
study (9), and in Fig. 1 b we show a diagram of the attachment site that we
use for our model. The key assumption we make in this work is that several
flexible kt proteins are bound to Mt protofilaments with variable deforma-
tion, generating force depending on the deformation of the flexible protein
from its rest position.
Kinetochore binders
We assume that the kt components are uniformly distributed in the radial
direction and that kMt protofilaments maintain rotational symmetry, so
that the key dynamics of attachment are accurately represented by projec-
ting and tracking the attachment site on a one-dimensional line, as shown in
Fig. 1 b. We suppose that flexible and stretchable kt components (i.e.,
FIGURE 1 Diagram of model components for
kt/kMt attachment. (a) three-dimensional model
derived from high-resolution data of a vertebrate
kt attached to a depolymerizing kMt, adapted
from (9). Green ribbon representation for the
kMt, and inner kt complexes are shown as spheres
and rods, as described in (9). A nucleosome is
shown as a ribbon model in dark purple, next to
a simplified representation of chromatin (purple).
(b) Diagram of our model for kt binders and
kMt. The purple structure represents the flexible
kMt binder elements, uniformly distributed on
the kMt. To see this figure in color, go online.
Biophysical Journal 106(5) 998–1007

1000 Keener and Shtylla
Ndc80 or KMN linkers etc.) are connected to a protein arm and bind the
surface of the kMt. To describe the dynamics of the binder/kMt interactions
in mathematical terms, we use two independent variables, y, the rest posi-
tion of the binder, and z, the location of the binder attachment on the Mt,
depicted in Fig. 1 b. The relative orientation of the tip of the Mt with the
binder rest positions is determined by l. We distinguish three cases for
the overlap, shown in Fig. 2 a:
1) For l%0 there is no overlap between the kMt and the binder rest posi-
tions; however, the kt is still engaged with the kMt, i.e., the binders
are stretched outward from their rest positions.
2) For 0<l<L there is partial overlap between the rest positions of the
binders and the kMt lattice.
3) For lRL there is total overlap between all the binders and the kMt
lattice.
The remaining assumptions for binder/kMt interactions are as follows.
We assume that there are nT binders in total, uniformly distributed along
the y axis and with rest position, y, where 0<y<L. The kt binders can
bind to the Mt at any position z with z<l. We track the density of bound
binders, nðz; y; tÞ using the partial differential equation, derived in the
Supporting Material:
vn
vt¼ konðz; yÞ
nTL�Z l
�N
ndz
!� koff ðz; yÞn� v
vzðvnÞ;
(1)
where v is the z-velocity of the binders bound to the kt. The rates kon; koff are
position dependent attachment and detachment rates for binders respec-
tively, derived in the Supporting Material. The numbers of binders in this
model can change because of three factors: 1), a new binder bond is estab-
lished, 2), an existing binder bond is broken, 3), a binder can change its z�position because of movement of the Mt relative to the binder arm. At any
given time, the total number of bound binders isR L0
R l�N nðz; y; tÞdzdy.
Kt binders can engage with the kMt and apply force in various directions;
however, the structure of kts remains unresolved and we suppose that the
primary movement of kt binders is along the horizontal axis of kMt sym-
metry, without significant changes in the vertical distance between the
binder arm and the kMt lattice. Thus, we make the assumption that the kt
binder force generated f, is horizontal, either pulling (to the right) or push-
ing (to the left), ignoring small forces along the vertical direction (Fig. 2 a).
The force generated by an individual bound binder is assumed to be equal to
kðy� zÞ, where k is the binder spring constant and y� z is the displacement
of the spring from its rest position, i.e., the protein springs are linear with
zero rest length. A potential source of kt binder flexibility assumed here
might be the observed flexible kink of the Ndc80 rod complexes (22);
a b
FIGURE 2 (a) Diagram of a flared mt protofilament and kMt overlap
cases. A plot of the radial deformation of the kMt protofilaments u, under
load f is also shown. (b) Diagram of the cross-section of a Mt with lateral
attachments between protofilaments. The rest distance is given by l0 and
there are nf ¼ 13 protofilaments per Mt. The radial displacement u
measures distance from the center of the kMt. To see this figure in color,
go online.
Biophysical Journal 106(5) 998–1007
however, this does not preclude the existence of other compliant parts of
kt elements, or potential contributions from pericentromeric chromatin
stretching (48).
We next briefly summarize kt binder attachment/detachment kinetics.
Unbound binders are free to diffuse but are constrained by the restoring
force, hence their motion is described by an Ornstein-Uhlenbeck process.
Consequently, they can bind to the Mt at a position z at a rate that is a
Gaussian function of the force kðy� zÞ. The unbinding rate is taken to be
load-dependent in a way described by Bell’s law. The binding equilibrium
constant is expð�a=kBTÞ, where a is the binding free energy. The binders
have a strong affinity for the Mts, reflected by the fact that a[kBT. The
resulting model (Eq. 1) that tracks the number of bound and unbound kt
binders is similar to Huxley’s model for muscle contraction (49), as detailed
in the Supporting Material.
Shape of a depolymerizing kMt
Recent evidence indicates that kMt depolymerization is sensitive to
opposing tension load on kt components (45,47). The depolymerizing Mt
protofilaments are known to curl, or flare, at the plus ends. Umbreit et al.
(50) found that incubating Ndc80 with Mts produced stabilized Mt tips
with straighter protofilaments and slower depolymerization. Taken
together, these findings indicate that kt components can have an effect on
Mt growth/shortening kinetics, an effect that seems to be sensitive to
load. We incorporate these effects into our model by assuming that the
shape of kMts is modified by the tension from the binders.
Our model for the shape of a kMt is a generalization of a continuous
model that represents the kMt as a tube made of uniform elastic material
that can stretch and bend, Fig. 1 b. This approach removes the need for
detailed descriptions on tubulin structure and interactions and is similar
to the approach taken in Janosi et al. (51). Since the kMt here is assumed
to be rotationally symmetric about the central axis, we focus our attention
on a line, or ‘‘protofilament’’ with the understanding that the full kMt
shape is obtained by rotating the filament about the central axis, as shown
in Fig. 2 b.
Our assumptions for the shape equation model are as follows. We assume
that a flaring protofilament has a constant preferred curvature f and resists
bending from its preferred curvature with bending rigidity a, with units of
force per length-squared. Furthermore, we assume that flaring is con-
strained by elastic lateral forces between protofilaments, giving an unloaded
protofilament the length constant l�1. Additionally, we assume that lateral
bonds break in a load dependent fashion. A derivation of the shape equa-
tions for a loaded protofilament using energy minimization arguments is
given in the Supporting Material. The resulting system of shape equations
for our model generalizes the standard linear beam equations used to calcu-
late equilibrium shapes for unloaded Mts considered in (51) and is given by
the following equations:
ad4u
dz4¼ d
dz
�rdu
dz
�� klatu exp
�� u
uf
�; (2)
dr
dz¼ f ; rðlÞ ¼ 0; (3)
where u is the radial deformation of the protofilament, f is the load
force density on the filament, klat ¼ al4 is the effective linear Hook’s con-
stant for the lateral restoring force, and q ¼ du=dz is the angle of ascent of
the kMt protofilament, see Fig. 2.
Finally, the shape of the kMt can be determined once we compute the
load imparted on the kMt by the kt binders. This binder load is computed
using the following:
f ðzÞ ¼ k
nf
Z L
0
ðz� yÞnðz; y; tÞdy; (4)
Force generation by flexible kinetochore-microtubule attachments. 1001
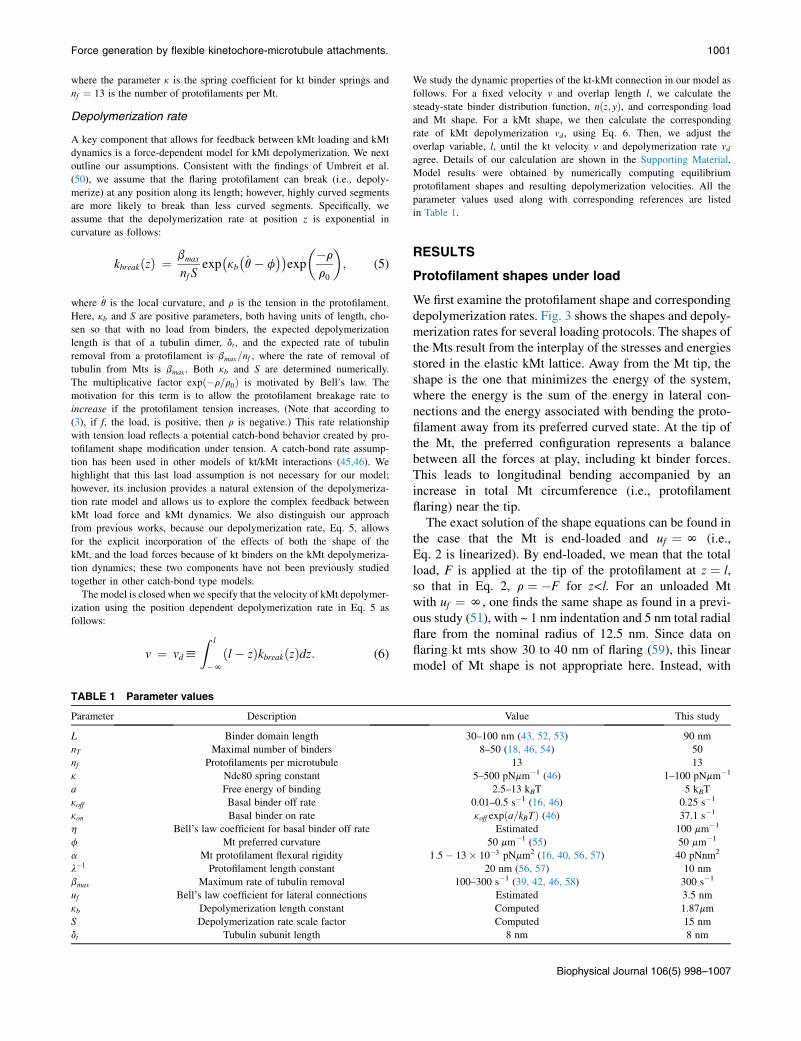
where the parameter k is the spring coefficient for kt binder springs and
nf ¼ 13 is the number of protofilaments per Mt.
Depolymerization rate
A key component that allows for feedback between kMt loading and kMt
dynamics is a force-dependent model for kMt depolymerization. We next
outline our assumptions. Consistent with the findings of Umbreit et al.
(50), we assume that the flaring protofilament can break (i.e., depoly-
merize) at any position along its length; however, highly curved segments
are more likely to break than less curved segments. Specifically, we
assume that the depolymerization rate at position z is exponential in
curvature as follows:
kbreakðzÞ ¼ bmax
nf Sexp�kb�_q� f
��exp
��r
r0
�; (5)
where _q is the local curvature, and r is the tension in the protofilament.
Here, kb and S are positive parameters, both having units of length, cho-
sen so that with no load from binders, the expected depolymerization
length is that of a tubulin dimer, dt , and the expected rate of tubulin
removal from a protofilament is bmax=nf , where the rate of removal of
tubulin from Mts is bmax . Both kb and S are determined numerically.
The multiplicative factor expð�r=r0Þ is motivated by Bell’s law. The
motivation for this term is to allow the protofilament breakage rate to
increase if the protofilament tension increases. (Note that according to
(3), if f, the load, is positive, then r is negative.) This rate relationship
with tension load reflects a potential catch-bond behavior created by pro-
tofilament shape modification under tension. A catch-bond rate assump-
tion has been used in other models of kt/kMt interactions (45,46). We
highlight that this last load assumption is not necessary for our model;
however, its inclusion provides a natural extension of the depolymeriza-
tion rate model and allows us to explore the complex feedback between
kMt load force and kMt dynamics. We also distinguish our approach
from previous works, because our depolymerization rate, Eq. 5, allows
for the explicit incorporation of the effects of both the shape of the
kMt, and the load forces because of kt binders on the kMt depolymeriza-
tion dynamics; these two components have not been previously studied
together in other catch-bond type models.
The model is closed when we specify that the velocity of kMt depolymer-
ization using the position dependent depolymerization rate in Eq. 5 as
follows:
v ¼ vdh
Z l
�N
ðl� zÞkbreakðzÞdz: (6)
TABLE 1 Parameter values
Parameter Description
L Binder domain length
nT Maximal number of binders
nf Protofilaments per microtubule
k Ndc80 spring constant
a Free energy of binding
koff Basal binder off rate
kon Basal binder on rate
h Bell’s law coefficient for basal binder off rate
f Mt preferred curvature
a Mt protofilament flexural rigidity
l�1 Protofilament length constant
bmax Maximum rate of tubulin removal
uf Bell’s law coefficient for lateral connections
kb Depolymerization length constant
S Depolymerization rate scale factor
dt Tubulin subunit length
We study the dynamic properties of the kt-kMt connection in our model as
follows. For a fixed velocity v and overlap length l, we calculate the
steady-state binder distribution function, nðz; yÞ, and corresponding load
and Mt shape. For a kMt shape, we then calculate the corresponding
rate of kMt depolymerization vd , using Eq. 6. Then, we adjust the
overlap variable, l, until the kt velocity v and depolymerization rate vdagree. Details of our calculation are shown in the Supporting Material.
Model results were obtained by numerically computing equilibrium
protofilament shapes and resulting depolymerization velocities. All the
parameter values used along with corresponding references are listed
in Table 1.
RESULTS
Protofilament shapes under load
We first examine the protofilament shape and correspondingdepolymerization rates. Fig. 3 shows the shapes and depoly-merization rates for several loading protocols. The shapes ofthe Mts result from the interplay of the stresses and energiesstored in the elastic kMt lattice. Away from the Mt tip, theshape is the one that minimizes the energy of the system,where the energy is the sum of the energy in lateral con-nections and the energy associated with bending the proto-filament away from its preferred curved state. At the tip ofthe Mt, the preferred configuration represents a balancebetween all the forces at play, including kt binder forces.This leads to longitudinal bending accompanied by anincrease in total Mt circumference (i.e., protofilamentflaring) near the tip.
The exact solution of the shape equations can be found inthe case that the Mt is end-loaded and uf ¼ N (i.e.,Eq. 2 is linearized). By end-loaded, we mean that the totalload, F is applied at the tip of the protofilament at z ¼ l,so that in Eq. 2, r ¼ �F for z<l. For an unloaded Mtwith uf ¼ N, one finds the same shape as found in a previ-ous study (51), with ~ 1 nm indentation and 5 nm total radialflare from the nominal radius of 12.5 nm. Since data onflaring kt mts show 30 to 40 nm of flaring (59), this linearmodel of Mt shape is not appropriate here. Instead, with
Value This study
30–100 nm (43, 52, 53) 90 nm
8–50 (18, 46, 54) 50
13 13
5–500 pNmm�1 (46) 1–100 pNmm�1
2.5–13 kBT 5 kBT
0.01–0.5 s�1 (16, 46) 0.25 s�1
koff expða=kBTÞ (46) 37.1 s�1
Estimated 100 mm�1
50 mm�1 (55) 50 mm�1
1:5� 13� 10�3 pNmm2 (16, 40, 56, 57) 40 pNnm2
20 nm (56, 57) 10 nm
100–300 s�1 (39, 42, 46, 58) 300 s�1
Estimated 3.5 nm
Computed 1.87mm
Computed 15 nm
8 nm 8 nm
Biophysical Journal 106(5) 998–1007

a b
d e
c
FIGURE 3 Model results of kMt shapes and depolymerization. (a) Protofilament displacement u, and (b) normalized depolymerization rate,
kbreakðzÞ=kbreakð0Þ for an end-loaded protofilament with three load amounts: G ¼ 0 unloaded (solid line), G ¼ 1 (dashed line), and G ¼ 10 (short dashed
line). For this depolymerization rate, kb ¼ 1:87m m and S ¼ 15 nm. (c) Depolymerization rate ðvdÞ for a protofilament with end-load G, relative to that
for the unloaded mt, for two different values of the Bell’s law coefficient L2f0=a ¼ 2:5 (upper, dashed) and N (lower, dashed). (d) and (e) Mt shape shown
as the rotationally symmetric ‘‘cylinder’’ derived from the protofilament shape in (a), for the loads G ¼ 0, unloaded shown in (d), and G ¼ 10 in (e),
respectively. To see this figure in color, go online.
1002 Keener and Shtylla
uf ¼ 3:5 nm, the equations can no longer be solved withanalytical methods, but the amount of flaring is closer tothat seen in data.
Examples of the protofilament shape and scaled depoly-merization rates for Mts with uf ¼ 3:5 nm are shown inFig. 3 a and b. Fig. 3 a shows shapes corresponding to threedifferent Mts with end-loading G ¼ 0, 1, and 10, whereG ¼ F=al2 is the nondimensional load corresponding tototal load F. The solid curve shows the shape with no loadG¼ 0, and the solid curve in Fig. 3 b shows the scaled depo-lymerization rate for this Mt, kbreakðzÞ=kbreakð0Þ. For this Mt,the expected depolymerization distance is dt and theexpected depolymerization velocity for a mt is bmaxdt=nf .The remaining two dashed curves in Fig. 3 show the proto-filament shape and depolymerization rate for protofilamentsthat are end-loaded with a total force F, for two differentvalues of nondimensional load G ¼ F=al2, (G ¼ 1, dashed,and G ¼ 10, short dashed). Clearly, for larger values of G,the protofilament is straighter, leading to a slower depoly-merization rate. Fig. 3 c shows the relative depolymerizationrate (relative to that of the unloaded protofilament withG ¼ 0) as a function of G, the nondimensional load,for two different values of the Bell’s law coefficientbr0 ¼ L2r0=a ¼ 2:5 (dashed curve) and N (solid curve).Note that r0 ¼ N corresponds to a tension-independentdepolymerization rate, where the rate of monomer removal
Biophysical Journal 106(5) 998–1007
is related to the local curvature. The upper curve (corre-sponding to L2r0=a ¼ 2:5) shows nonmonotone behaviortypical of catch-bonds. This results from competition be-tween decreased curvature, which slows depolymerization,and tension, which increases depolymerization. The param-eter r0 scales the effect of tension on depolymerization, withsmaller values of r0 leading to a more rapid increase indepolymerization as a function of increasing load.
Tension-independent depolymerization
Fig. 4 shows a typical example of the load velocity curve, inthis case for k ¼ 10 pN mm�1, a ¼ 40 pN nm2, r0 ¼ N.Recall that r0 ¼ N corresponds to the case where tensionin the protofilament has no direct effect on depolymeriza-tion. An interesting feature of this load-velocity curve isthat there are actually two curves, one (shown dashed) forwhich d ¼ l=L, the percentage overlap, is negative (we referto this as no overlap, and binders are attached but stretched),and one for which d is positive. For this load-velocity curve,the maximum load of ~ 7 pN occurs close to the minimalvelocity of ~ 0.009 mm s�1. There is no steady-state solutionof the equation for larger loads because the couplers detachat larger loads. The dashed curve intersects the velocityaxis (load ¼ 0) at the free depolymerization velocity0.175 mms�1. The solid curve has the interesting feature

a b
FIGURE 4 (a) Load as a function of velocity and (b) velocity as a function
of d, the percentage overlap, for Ndc80 spring constant k ¼ 10 pNmm�1,
and protofilament bending rigidity a ¼ 40 pN nm2 ðg ¼ 700Þ. The solid
curve represents a binder/Mt arrangement for which the overlap is
positive, whereas the red dashed curve represents a binder/mt arrangement
for which the overlap is negative. To see this figure in color, go online.
Force generation by flexible kinetochore-microtubule attachments. 1003
that it can sustain velocities that are larger than the freedepolymerization velocity, which arises when a proportionof kt binders help to increase the local curvature at thekMt tip ends. This last feature highlights potentially coun-terintuitive feedbacks that can arise in this coupler, sincekt binders can be locked to increase kMt depolymerizationby bending the protofilaments, and subsequently increasingkt translocation velocities in the face of resistive load. Theforce-velocity curves obtained here also distinguish thismodel from the Hill-type biased diffusion force-velocityrelations (42), because in the classical biased diffusionmodel velocities cannot exceed free depolymerization rates,and coupler velocity is independent of the specific amountof overlap.
To give an idea of how the binders work to generate load,Fig. 5 shows a series of figures detailing the forces and loadsfor three different values of overlap d ¼ �0:3402 (a),0.6748 (b), and 0.4017(c). Fig. 5 a shows the force densitygenerated by the Ndc80 complex of proteins, plotted as afunction of x ¼ y=L. The dotted portion of the curves band c are the regions where Ndc80 overlaps with protofila-ments. For curve a, even though there is no overlap with thekt binder arm ðd<0Þ, the binders are engaged because theyare extended (stretched), hence generating positive force.For the other two curves, some Ndc80 proteins are extended(with force >0) whereas others are compressed (withforce <0). Fig. 5 b shows the load on the protofilamentsplotted as a function of z<l; for curve a, there is no overlapwith Ndc80, so z<0. For curves a and b, the load is strictly
a b c
positive, so that the protofilaments are straightened (withprotofilament shape shown in Fig. 5 c), which leads to aslowing of depolymerization. On the other hand, for Fig. 5c, the load on protofilaments is of both signs, so that theprotofilaments are more curved than the unloaded protofila-ment, and therefore, according to our model (Eq. 5), depo-lymerization is enhanced. It is for this reason thatdepolymerization can be faster than for an unloaded proto-filament, even though there is a net positive load. Thedashed curve in Fig. 5 c is the shape of an unloaded proto-filament, as shown in Fig. 3 a. These results imply that flex-ible kt binders can play a complex role in modulating kMtshortening dynamics, with the potential for enhancing kMtdepolymerization rates in some overlap regimes.
Although the shape of the load-velocity curve is qualita-tively the same for a large range of parameter values, thequantitative details are modified in significant ways. Thenondimensional parameter g ¼ nTL
3k=nfa determinesthe relative stiffness of the protofilaments comparedwith the force applied by Ndc80 binders and, therefore, de-termines the ability of the binders to bend the protofilamentfrom their preferred unloaded configuration. Hence, thisparameter determines the variability of the velocity of theload-velocity curve. If g is large, there is large variation inthe velocity, whereas if g is small, the variation in velocityis also smaller. Fig. 6 shows the load-velocity curve and ve-locity-overlap curve in the two cases that g ¼ 140 andg ¼ 700. The main impact of this change is that the rangeof velocities is smaller (v>0:26m m s�1 for g ¼ 140
compared with v>0:09m m s�1 for g ¼ 700.) These resultsindicate that overall velocity and maximal loads supportedby kts are lowered when kt binders are ‘‘weakened’’ becausethey cannot affect kMt depolymerization dynamics. In aprevious study (50) it was reported that phosphorylationof kt components by Aurora B kinase not only weakens ktattachment, but also nearly abolishes the ability of theNdc80 complex to influence kMt dynamics. Our resultssupport the possibility that posttranslational phosphoryla-tion of kt binders affects attachment dynamics by alteringthe stiffness parameter g.
An important parameter for kt couplers is the maximalnumber of binders in each attachment site. In our model,both parameters g and the load F are proportional to thenumber of the total binders in the kt complex, nT . Specif-ically, both g and F are decreased if the numbers of binders,
FIGURE 5 Ndc80 binder force density (a),
protofilament load (b), and protofilament displace-
ment (c) shown for the three values of overlap
d ¼ �0:3402 for curve a, 0.6748 for curve b, and
0.4017 for curve c. The dashed curve in (c) shows
the shape of an unloaded protofilament, from
Fig. 3 a. The dotted portion of the curves b
and c are the regions of overlap of Ndc80 with
protofilaments. To see this figure in color, go
online.
Biophysical Journal 106(5) 998–1007
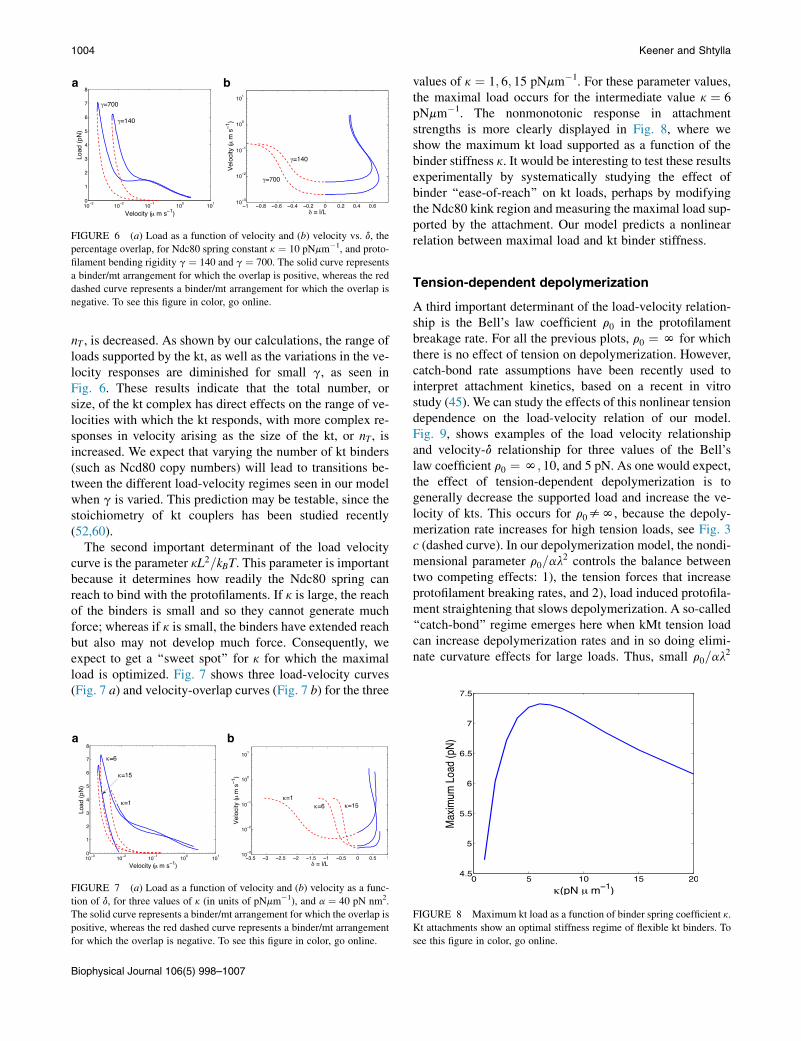
a b
FIGURE 6 (a) Load as a function of velocity and (b) velocity vs. d, the
percentage overlap, for Ndc80 spring constant k ¼ 10 pNmm�1, and proto-
filament bending rigidity g ¼ 140 and g ¼ 700. The solid curve represents
a binder/mt arrangement for which the overlap is positive, whereas the red
dashed curve represents a binder/mt arrangement for which the overlap is
negative. To see this figure in color, go online.
1004 Keener and Shtylla
nT , is decreased. As shown by our calculations, the range ofloads supported by the kt, as well as the variations in the ve-locity responses are diminished for small g, as seen inFig. 6. These results indicate that the total number, orsize, of the kt complex has direct effects on the range of ve-locities with which the kt responds, with more complex re-sponses in velocity arising as the size of the kt, or nT, isincreased. We expect that varying the number of kt binders(such as Ncd80 copy numbers) will lead to transitions be-tween the different load-velocity regimes seen in our modelwhen g is varied. This prediction may be testable, since thestoichiometry of kt couplers has been studied recently(52,60).
The second important determinant of the load velocitycurve is the parameter kL2=kBT. This parameter is importantbecause it determines how readily the Ndc80 spring canreach to bind with the protofilaments. If k is large, the reachof the binders is small and so they cannot generate muchforce; whereas if k is small, the binders have extended reachbut also may not develop much force. Consequently, weexpect to get a ‘‘sweet spot’’ for k for which the maximalload is optimized. Fig. 7 shows three load-velocity curves(Fig. 7 a) and velocity-overlap curves (Fig. 7 b) for the three
a b
FIGURE 7 (a) Load as a function of velocity and (b) velocity as a func-
tion of d, for three values of k (in units of pNmm�1), and a ¼ 40 pN nm2.
The solid curve represents a binder/mt arrangement for which the overlap is
positive, whereas the red dashed curve represents a binder/mt arrangement
for which the overlap is negative. To see this figure in color, go online.
Biophysical Journal 106(5) 998–1007
values of k ¼ 1; 6; 15 pNmm�1. For these parameter values,the maximal load occurs for the intermediate value k ¼ 6
pNmm�1. The nonmonotonic response in attachmentstrengths is more clearly displayed in Fig. 8, where weshow the maximum kt load supported as a function of thebinder stiffness k. It would be interesting to test these resultsexperimentally by systematically studying the effect ofbinder ‘‘ease-of-reach’’ on kt loads, perhaps by modifyingthe Ndc80 kink region and measuring the maximal load sup-ported by the attachment. Our model predicts a nonlinearrelation between maximal load and kt binder stiffness.
Tension-dependent depolymerization
A third important determinant of the load-velocity relation-ship is the Bell’s law coefficient r0 in the protofilamentbreakage rate. For all the previous plots, r0 ¼ N for whichthere is no effect of tension on depolymerization. However,catch-bond rate assumptions have been recently used tointerpret attachment kinetics, based on a recent in vitrostudy (45). We can study the effects of this nonlinear tensiondependence on the load-velocity relation of our model.Fig. 9, shows examples of the load velocity relationshipand velocity-d relationship for three values of the Bell’slaw coefficient r0 ¼ N; 10, and 5 pN. As one would expect,the effect of tension-dependent depolymerization is togenerally decrease the supported load and increase the ve-locity of kts. This occurs for r0sN, because the depoly-merization rate increases for high tension loads, see Fig. 3c (dashed curve). In our depolymerization model, the nondi-mensional parameter r0=al
2 controls the balance betweentwo competing effects: 1), the tension forces that increaseprotofilament breaking rates, and 2), load induced protofila-ment straightening that slows depolymerization. A so-called‘‘catch-bond’’ regime emerges here when kMt tension loadcan increase depolymerization rates and in so doing elimi-nate curvature effects for large loads. Thus, small r0=al
2
FIGURE 8 Maximum kt load as a function of binder spring coefficient k.
Kt attachments show an optimal stiffness regime of flexible kt binders. To
see this figure in color, go online.

Force generation by flexible kinetochore-microtubule attachments. 1005
signals that the filaments are less resistive to load and caneasily break under tension, whereas large r0=al
2 indicatesthat protofilaments are more resilient to load and becomeless curved without breaking, thus causing slower depoly-merization. Most kMt protofilaments become elongatedand less curled while attached to kts in anaphase, wheredepolymerization of kMt prevails (59), and measurementsof attachments times for reconstructed kts in (45) indicatethat large forces are required to break kt-kMt attachments(more than 10 pN of tension was required to break mostattachments in (45)). Based on these observations, it isreasonable to expect that kt-kMt attachments operate in ahigh r0 regime, where the inclusion of an explicit catch-bond response to tension may not be necessary. In thisregime, tension forces primarily serve to slow downdepolymerization by straightening protofilaments until largetension loads detach the kt binders.
Perhaps not expected, however, is that there is hystereticbehavior when r0=al
2 is sufficiently small. In particular,with r0=al
2 sufficiently small, there is a range of velocitiesfor which there are three possible loads, with hysteretic tran-sitions into and out of this range. The actual appearance ofthese hysteric regimes in kt function depends on the value ofr0=al
2; but if present, it might have interesting mechanicalconsequences for chromosome motion.
a b
FIGURE 9 (a) Load as a function of velocity and (b) velocity as a func-
tion of d, for three values of r0 (in units of pN), and a ¼ 40 pN nm2.The
solid curve represents a binder/Mt arrangement for which the overlap is
positive, whereas the red dashed curve represents a binder/mt arrangement
for which the overlap is negative. To see this figure in color, go online.
DISCUSSION
In this study we derived and analyzed a model of force gen-eration at the kt-mt juncture. The primary novelty of ourmodel is that we include two important features that havenot been previously considered together at this attachmentsite. These are the effect of flexibility of key kt componentsthat interact with kMt fiber, and the effects of tension loadon the shape and corresponding depolymerization velocityof attached kMts. Further, the modeling framework wepropose in this paper allows for an analytically tractabletreatment of kMt protofilament shapes under load that arisewhile a depolymerizing kMt is attached to a moving kt. Ourmodel extends and generalizes previous work on continuousmodels of Mt shape (51). The model we have constructedshares some common features with Huxley’s model formuscle contraction (49). Indeed, we propose that the Huxleymuscle model is a useful framework for kt attachmentmodels, especially in light of the reported kt binderflexibility.
The inclusion of a flexible array of binders distinguishesour model from previous biased diffusion models(35,39,42). For these previous kt-kMt models, the assump-tion is made that kt components are rigid. This rigidityrequirement then allows an attached kts’ binder componentsto change position relative to the kMt either via thermaldiffusion, or kMt depolymerization/polymerization. How-ever, for this biased-diffusion process to work, it is alsorequired that the binding of kts to mts be sufficiently weak
so that there can be significant thermal diffusion on thekMt lattice.
Our model achieves biased diffusion by a different mech-anism, one that is more physically reasonable. Because thebinders are flexible, when they are unbound from the Mt,they undergo diffusion, constrained by the restoring forceof stretching. So, although the diffusion of the binders isnot biased, their binding is biased by the location of bindingsites relative to the rest location of the binder. In our model,once the binder is attached to the mt, it is no longer free todiffuse along the mt; this is in direct contrast to previousmodels of biased diffusion. In fact, for our proposed mech-anism to work, the binders must be flexible, as inflexiblebinders do not diffuse.
Another important component of our model is the incor-poration of a model of kMt shape and explicit connectionbetween protofilament shape and the rate of kMt shortening.Our model also directly connects mechanical features of thekMt with its depolymerization rate by using an exponentialrate function. This rate is reminiscent of catch-bonds thatcan gain strength under tensile load, and as seen in Fig. 3c, this gain of strength under load slows depolymerization.Of course, under high enough loads bonds break morereadily, and this feature is reflected by the parameter r0.Smaller values of r0 lead to more rapid breakage becauseof loading, and can even change the character of the load-velocity curve (see Fig. 9,).
Our model results indicate that kt binder flexibility canhave a significant effect on the tracking ability of a ktcoupler with a depolymerizing kMt. We highlight twoimportant results here. First, the velocity range that thecoupler can sustain under load is sensitive to the ratio ofthe stiffness of the kMt protofilaments with the force appliedby the Ndc80 linkers. This makes sense since the generationof velocity in this model is directly dependent on the abilityof the protofilament to bend, thus a more rigid protofilamentcan easily overwhelm a flexible kt component and preventmovement, because of slowed depolymerization. Second,
Biophysical Journal 106(5) 998–1007
1006 Keener and Shtylla
the range of velocities is also sensitive to the flexibility ofNdc80. This feature is related to the ability of Ndc80 tocapture a binding site and generate force. If too soft, thekt component can reach multiple binding sites; however,the connection cannot support much load. On the otherhand, if the kt component is too stiff, then it cannot explorespace and access binding sites as easily. Thus, stiffer bindersare not able to support kt coupling. In fact, we observe anoptimal stiffness range for these couplers.
The optimal stiffness can be directly related to someintrinsic properties of sleeve-type biased diffusion couplers.We have previously shown (42) that in the Hill sleeve-typebiased diffusion model, thermal diffusion, as well as binderspacing, can significantly affect the force velocity responseof the coupler. In this study we show that flexibility anddiffusion of unbound kt binders eliminate the need for diffu-sion of the binders on the kMt lattice. More specifically,highly flexible (soft) kt components generate an effectivethermal motion of the coupler on the kMt lattice bindingsites allowing for swift adjustment of the kt juncture onthe depolymerizing filament; this leads to successfulcoupling. On the other hand, stiff couplers can supportmore force when engaged with a binder; however, theycannot reach enough binding sites, effectively operating asa sleeve-type biased diffusion coupler with strong specificbinding and/or small diffusion coefficient (we have previ-ously referred to these couplers as sticky couplers).
We conclude that diffusion of kt couplers is crucial totheir functionality; however, the nature of that diffusion,whether on the kMt lattice, or because of the flexibility ofunbound binders, is yet to be definitively established. Basedon our model results and the observed kt flexibility, weexpect the latter option to play a dominant role in kt motion.
SUPPORTING MATERIAL
One figure and additional supplemental information are available at http://
www.biophysj.org/biophysj/supplemental/S0006-3495(14)00081-2.
This research was supported in part by NSF grant DMS-1122297 to JPK
and by NSF grant DMS-1358932 to BS.
REFERENCES
1. Karsenti, E., and I. Vernos. 2001. The mitotic spindle: a self-mademachine. Science. 294:543–547.
2. Kline-Smith, S. L., and C. E. Walczak. 2004. Mitotic spindle assemblyand chromosome segregation: refocusing on microtubule dynamics.Mol. Cell. 15:317–327.
3. O’Connell, C. B., and A. L. Khodjakov. 2007. Cooperative mecha-nisms of mitotic spindle formation. J. Cell Sci. 120:1717–1722.
4. Walczak, C. E., and R. Heald. 2008. Mechanisms of mitotic spindleassembly and function. Int. Rev. Cytol. 265:111–158.
5. Bouck, D. C., A. P. Joglekar, and K. S. Bloom. 2008. Design features ofa mitotic spindle: balancing tension and compression at a single micro-tubule kinetochore interface in budding yeast. Annu. Rev. Genet.42:335–359.
Biophysical Journal 106(5) 998–1007
6. Mogilner, A., and E. Craig. 2010. Towards a quantitative understandingof mitotic spindle assembly and mechanics. J. Cell Sci. 123:3435–3445.
7. Welburn, J. P., and I. M. Cheeseman. 2008. Toward a molecular struc-ture of the eukaryotic kinetochore. Dev. Cell. 15:645–655.
8. Santaguida, S., and A. Musacchio. 2009. The life and miracles ofkinetochores. EMBO J. 28:2511–2531.
9. Alushin, G., and E. Nogales. 2011. Visualizing kinetochore architec-ture. Curr. Opin. Struct. Biol. 21:661–669.
10. DeLuca, J. G., and A. Musacchio. 2012. Structural organization of thekinetochore-microtubule interface. Curr. Opin. Cell Biol. 24:48–56.
11. Goshima, G., and R. D. Vale. 2003. The roles of microtubule-basedmotor proteins in mitosis: comprehensive RNAi analysis in theDrosophila S2 cell line. J. Cell Biol. 162:1003–1016.
12. Grishchuk, E. L., and J. R. McIntosh. 2006. Microtubule depolymeriza-tion can drive poleward chromosome motion in fission yeast. EMBO J.25:4888–4896.
13. Tanaka, K., E. Kitamura, ., T. U. Tanaka. 2007. Molecular mecha-nisms of microtubule-dependent kinetochore transport toward spindlepoles. J. Cell Biol. 178:269–281.
14. Mogilner, A., R. Wollman, ., J. Scholey. 2006. Modeling mitosis.Trends Cell Biol. 16:88–96.
15. Vladimirou, E., E. Harry, ., A. D. McAinsh. 2011. Springs, clutchesand motors: driving forward kinetochore mechanism by modelling.Chromosome Res. 19:409–421.
16. Asbury, C. L., J. F. Tien, and T. N. Davis. 2011. Kinetochores’ grippingfeat: conformational wave or biased diffusion? Trends Cell Biol.21:38–46.
17. Wan, X., R. P. O’Quinn, ., E. D. Salmon. 2009. Protein architectureof the human kinetochore microtubule attachment site. Cell. 137:672–684.
18. Johnston, K., A. Joglekar, ., E. D. Salmon. 2010. Vertebratekinetochore protein architecture: protein copy number. J. Cell Biol.189:937–943.
19. Joglekar, A. P., K. Bloom, and E. D. Salmon. 2009. In vivo proteinarchitecture of the eukaryotic kinetochore with nanometer scale accu-racy. Curr. Biol. 19:694–699.
20. Wei, R. R., P. K. Sorger, and S. C. Harrison. 2005. Molecular organi-zation of the Ndc80 complex, an essential kinetochore component.Proc. Natl. Acad. Sci. USA. 102:5363–5367.
21. Ciferri, C., J. De Luca, ., A. Musacchio. 2005. Architecture of thehuman ndc80-hec1 complex, a critical constituent of the outer kineto-chore. J. Biol. Chem. 280:29088–29095.
22. Wang, H.-W., S. Long, ., E. Nogales. 2008. Architecture andflexibility of the yeast Ndc80 kinetochore complex. J. Mol. Biol.383:894–903.
23. DeLuca, J. G., W. E. Gall, ., E. D. Salmon. 2006. Kinetochoremicrotubule dynamics and attachment stability are regulated byHec1. Cell. 127:969–982.
24. Wei, R. R., J. Al-Bassam, and S. C. Harrison. 2007. The Ndc80/HEC1complex is a contact point for kinetochore-microtubule attachment.Nat. Struct. Mol. Biol. 14:54–59.
25. Ciferri, C., S. Pasqualato, ., A. Musacchio. 2008. Implications forkinetochore-microtubule attachment from the structure of an engi-neered Ndc80 complex. Cell. 133:427–439.
26. Cheeseman, I. M., J. S. Chappie, ., A. Desai. 2006. The conservedKMN network constitutes the core microtubule-binding site of thekinetochore. Cell. 127:983–997.
27. Miranda, J. J., P. De Wulf, ., S. C. Harrison. 2005. The yeast DASHcomplex forms closed rings on microtubules. Nat. Struct. Mol. Biol.12:138–143.
28. Westermann, S., H.-W. Wang, ., G. Barnes. 2006. The Dam1 kineto-chore ring complex moves processively on depolymerizing microtu-bule ends. Nature. 440:565–569.
Force generation by flexible kinetochore-microtubule attachments. 1007
29. Miranda, J. J., D. S. King, and S. C. Harrison. 2007. Protein arms in thekinetochore-microtubule interface of the yeast DASH complex. Mol.Biol. Cell. 18:2503–2510.
30. Petrovic, A., S. Pasqualato, ., A. Musacchio. 2010. The MIS12 com-plex is a protein interaction hub for outer kinetochore assembly. J. CellBiol. 190:835–852.
31. Maskell, D. P., X.-W. Hu, and M. R. Singleton. 2010. Molecular archi-tecture and assembly of the yeast kinetochore MIND complex. J. CellBiol. 190:823–834.
32. Howard, J., and A. A. Hyman. 2009. Growth, fluctuation and switchingat microtubule plus ends. Nat. Rev. Mol. Cell Biol. 10:569–574.
33. Wang, H.-W., and E. Nogales. 2005. Nucleotide-dependentbending flexibility of tubulin regulates microtubule assembly. Nature.435:911–915.
34. Mandelkow, E.-M., E. Mandelkow, and R. A. Milligan. 1991. Microtu-bule dynamics and microtubule caps: a time-resolved cryo-electronmicroscopy study. J. Cell Biol. 114:977–991.
35. Hill, T. L. 1985. Theoretical problems related to the attachment ofmicrotubules to kinetochores. Proc. Natl. Acad. Sci. USA. 82:4404–4408.
36. Mahadevan, L., and T. J. Mitchison. 2005. Cell biology: powerfulcurves. Nature. 435:895–897.
37. Mogilner, A., and G. Oster. 2003. Polymer motors: pushing out thefront and pulling up the back. Curr. Biol. 13:R721–R733.
38. Grishchuk, E. L., M. I. Molodtsov, ., J. R. McIntosh. 2005. Forceproduction by disassembling microtubules. Nature. 438:384–388.
39. Joglekar, A. P., and A. J. Hunt. 2002. A simple, mechanistic modelfor directional instability during mitotic chromosome movements.Biophys. J. 83:42–58.
40. Molodtsov, M. I., E. L. Grishchuk,., F. I. Ataullakhanov. 2005. Forceproduction by depolymerizing microtubules: a theoretical study. Proc.Natl. Acad. Sci. USA. 102:4353–4358.
41. Efremov, A., E. L. Grishchuk, ., F. I. Ataullakhanov. 2007. In searchof an optimal ring to couple microtubule depolymerization to proces-sive chromosome motions. Proc. Natl. Acad. Sci. USA. 104:19017–19022.
42. Shtylla, B., and J. P. Keener. 2011. A mathematical model for forcegeneration at the kinetochore-microtubule interface. SIAM J. Appl.Math. 71:1821–1848.
43. Gonen, S., B. Akiyoshi, ., T. Gonen. 2012. The structure of purifiedkinetochores reveals multiple microtubule-attachment sites. Nat.Struct. Mol. Biol. 19:925–929.
44. O’Connell, C. B., A. Khodjakov, and B. F. McEwen. 2012. Kinetochoreflexibility: creating a dynamic chromosome–spindle interface. Curr.Opin. Cell Biol. 24:40–47.
45. Akiyoshi, B., K. K. Sarangapani,., S. Biggins. 2010. Tension directlystabilizes reconstituted kinetochore-microtubule attachments. Nature.468:576–579.
46. Civelekoglu-Scholey, G., B. He, ., D. Cimini. 2013. Dynamic bondsand polar ejection force distribution explain kinetochore oscillations inPtK1 cells. J. Cell Biol. 201:577–593.
47. Franck, A. D., A. F. Powers, ., C. L. Asbury. 2007. Tension appliedthrough the Dam1 complex promotes microtubule elongationproviding a direct mechanism for length control in mitosis. Nat. CellBiol. 9:832–837.
48. Bouck, D. C., and K. Bloom. 2007. Pericentric chromatin is an elasticcomponent of the mitotic spindle. Curr. Biol. 17:741–748.
49. Huxley, A. F. 1957. Muscle structure and theories of contraction. Prog.Biophys. Biophys. Chem. 7:255–318.
50. Umbreit, N. T., D. R. Gestaut,., T. N. Davis. 2012. The Ndc80 kinet-ochore complex directly modulates microtubule dynamics. Proc. Natl.Acad. Sci. USA. 109:16113–16118.
51. Janosi, I. M., D. Chretien, and H. Flyvbjerg. 2002. Structural microtu-bule cap: stability, catastrophe, rescue, and third state. Biophys. J.83:1317–1330.
52. Joglekar, A. P., D. Bouck, ., K. S. Bloom. 2008. Molecular architec-ture of the kinetochore-microtubule attachment site is conservedbetween point and regional centromeres. J. Cell Biol. 181:587–594.
53. Cheeseman, I. M., and A. Desai. 2008. Molecular architecture of thekinetochore-microtubule interface. Nat. Rev. Mol. Cell Biol. 9:33–46.
54. Powers, A. F., A. D. Franck, ., C. L. Asbury. 2009. The Ndc80 kinet-ochore complex forms load-bearing attachments to dynamic microtu-bule tips via biased diffusion. Cell. 136:865–875.
55. Janosi, I. M., D. Chretien, and H. Flyvbjerg. 1998. Modeling elasticproperties of microtubule tips and walls. Eur. Biophys. J. 27:501–513.
56. Mickey, B., and J. Howard. 1995. Rigidity of microtubules is increasedby stabilizing agents. J. Cell Biol. 130:909–917.
57. VanBuren, V., L. Cassimeris, and D. J. Odde. 2005. Mechanochemicalmodel of microtubule structure and self-assembly kinetics. Biophys. J.89:2911–2926.
58. Waters, J. C., T. J. Mitchison,., E. D. Salmon. 1996. The kinetochoremicrotubule minus-end disassembly associated with poleward flux pro-duces a force that can do work. Mol. Biol. Cell. 7:1547–1558.
59. McIntosh, J. R., E. O’Toole,., E. L. Grishchuk. 2013. Conserved anddivergent features of kinetochores and spindle microtubule ends fromfive species. J. Cell Biol. 200:459–474.
60. Joglekar, A. P., D. C. Bouck,., E. D. Salmon. 2006. Molecular archi-tecture of a kinetochore-microtubule attachment site. Nat. Cell Biol.8:581–585.
Biophysical Journal 106(5) 998–1007


