
A managed futures delta neutral strategy to yield … managed futures delta neutral strategy to...
27
This presentation is intended solely for the recipient and should not be replicated in any form or manner electronic or otherwise A managed futures delta neutral strategy to yield positive alpha for investors
Transcript of A managed futures delta neutral strategy to yield … managed futures delta neutral strategy to...
This presentation is intended solely for the recipient and should not be replicated in any form or manner electronic or otherwise
A managed futures delta neutral strategy to yield positive alpha for investors

Slide - 2
This presentation is intended solely for the recipient and should not be replicated in any form or manner electronic or otherwise
The information contained in this document does not constitute in any manner any investment advice or solicitation or endorsement relating to the
products mentioned herein ("Products"). The Products may not be suited to all categories of investors and hence Investors/Recipients must make their
own investment decision (at their sole description & risk) and where necessary take advice from independent professional advisors before investing.
Investors/Recipients are (1) not provided any guarantee/assurance that the investment objective of the Products will be achieved; and (2) not offered
any guarantee/assured returns on their investments in the Products.
Investments in Quantitative products/strategy are subject to market risks due to various micro and macro factors and forces affecting the capital
markets which include price fluctuation risks. The investments may not be suited to all categories of Investors/Recipients. As with any investment in any
securities, the value of the portfolio under products/strategy can go up or down depending on the factors and forces affecting the capital market. The
investment objective of the Samssara Capital Technologies LLP is to construct an optimally focused portfolio of large cap securities to significantly
outperform NIFTY-50 Index with the risk lesser than the benchmark (NIFTY-50).
samLongShort is only the name of the products/strategy and does not in any manner indicate either the quality of the products/strategy or its future
prospects and returns. The past performance of the strategy and/or its back-tests is not indicative of future performance. We have taken responsible
measures to ensure the accuracy of the information provided in this document. Trading in the off-exchange market is very speculative in nature,
involves considerable risks and is not appropriate for all investors. Therefore, before deciding to participate in off-exchange Foreign Exchange trading,
you should carefully consider your investment objectives, level of experience and risk appetite. Investors should only use risk capital when trading in
capital markets because there is always the risk of substantial loss.
The Portfolio Manager, its affiliates/associates, their directors, employees, representatives or agents shall not be liable or responsible, in any manner
whatsoever, to any Investor/Recipient or any other person, for the performance/profitability/operations of the products/strategy, the contents of any
document or any investments in the products/strategy including any and all direct, special, punitive, indirect, or consequential damages (including lost
profits), even if notified of the possibility of such damages.
samLongShort strategy is not sponsored, endorsed, sold or promoted by National Stock Exchange Limited (“NSE”).
Disclaimer & Risk Factors

Slide - 3
This presentation is intended solely for the recipient and should not be replicated in any form or manner electronic or otherwise
The Mandate
Yield positive alpha for the investors
Yield absolute returns irrespective of the market direction over a long term
Generate consistent returns with low volatility and significant sharpe
Slide - 4
This presentation is intended solely for the recipient and should not be replicated in any form or manner electronic or otherwise
About Us
COMPANY BACKGROUND
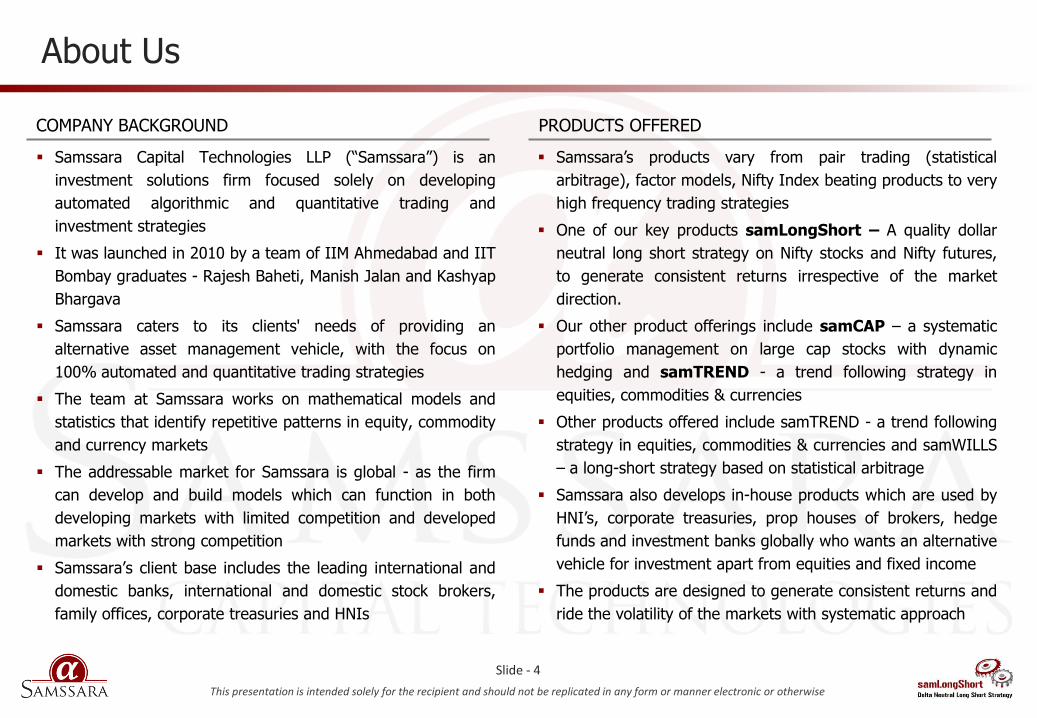
Samssara Capital Technologies LLP (“Samssara”) is an
investment solutions firm focused solely on developing
automated algorithmic and quantitative trading and
investment strategies
It was launched in 2010 by a team of IIM Ahmedabad and IIT
Bombay graduates - Rajesh Baheti, Manish Jalan and Kashyap
Bhargava
Samssara caters to its clients' needs of providing an
alternative asset management vehicle, with the focus on
100% automated and quantitative trading strategies
The team at Samssara works on mathematical models and
statistics that identify repetitive patterns in equity, commodity
and currency markets
The addressable market for Samssara is global - as the firm
can develop and build models which can function in both
developing markets with limited competition and developed
markets with strong competition
Samssara’s client base includes the leading international and
domestic banks, international and domestic stock brokers,
family offices, corporate treasuries and HNIs
PRODUCTS OFFERED
Samssara’s products vary from pair trading (statistical
arbitrage), factor models, Nifty Index beating products to very
high frequency trading strategies
One of our key products samLongShort – A quality dollar
neutral long short strategy on Nifty stocks and Nifty futures,
to generate consistent returns irrespective of the market
direction.
Our other product offerings include samCAP – a systematic
portfolio management on large cap stocks with dynamic
hedging and samTREND - a trend following strategy in
equities, commodities & currencies
Other products offered include samTREND - a trend following
strategy in equities, commodities & currencies and samWILLS
– a long-short strategy based on statistical arbitrage
Samssara also develops in-house products which are used by
HNI’s, corporate treasuries, prop houses of brokers, hedge
funds and investment banks globally who wants an alternative
vehicle for investment apart from equities and fixed income
The products are designed to generate consistent returns and
ride the volatility of the markets with systematic approach

Slide - 5
This presentation is intended solely for the recipient and should not be replicated in any form or manner electronic or otherwise
Our client base
Corporate Treasuries / Family Offices / Stock Brokers HNIs (Individuals)
Millennium Stock Broking Pvt. Ltd.
HNIs and executives of
corporates like:
Leading Private Equity firms
Promoters of manufacturing
and services industries
Large financial services
MNC
CEO of a leading KPO
Bombay Gas Co.

Slide - 6
This presentation is intended solely for the recipient and should not be replicated in any form or manner electronic or otherwise
Manish Jalan
Director Manish is the director and chief strategist of the company. Prior to
being in India, Manish was a quantitative equity Trader in Tokyo, with
Merrill Lynch Prop Desk for over 4 Yrs where he played a vital role in
development and implementation of various factor models and
high/medium frequency trading models, which contributed
significantly to the prop desk profitability. Manish has worked closely
with more then 5 Indian broker shops and numerous International
banks in algorithmic trading, high frequency trading, statistical
arbitrage, quantitative modeling, back testing, programming, statistical
analysis and risk handling. Manish is a B.Tech and M.Tech from IIT
Bombay in Mechanical Engineering.
Kashyap Bhargava
VP, Strategy Development Kashyap is a B. Tech. and M. Tech. from IIT Bombay and specializes
in development of automated quantitative trading strategies. He has
around 7 years of trading experience in Indian Markets and has been
developing medium/low frequency trading strategies. He has also
worked at the proprietary trading desk of G.H. Financials as a
derivative trader for 2 years developing trading strategies for US, UK
and European Fixed Income and Equity markets.
Rajesh Baheti
Director Rajesh is the incubation partner and director of the company. Rajesh,
brings with him more then 15 years of experience in trading India
markets. He is currently the director and founding member of
Crossseas Capital Services (One of the first clients of Samssara).
Rajesh established Crossseas in 1995 and since then has been
instrumental in providing consultancy to clients in shares, bonds, stock
etc. Crossseas currently operates 5 offices in Mumbai and several
others across the country. Crossseas provides solutions in systematic
trading opportunities to selected clients in India and abroad. Rajesh
holds a PGDM from IIM Ahmedabad.
Tarun Soni
VP, Business Development Tarun leads the business development initiatives at Samssara. Prior to
this, he worked with investment banking team at Anand Rathi Advisors
for two years. He also worked with the investment banking team at
Avendus Capital for three years and with Bank of America back office
for one year. He has a strong experience of working on successful
mergers & acquisitions and private equity syndication transactions
across various sectors. Tarun is a B. Tech. from IIT Bombay.
The Team

Slide - 7
This presentation is intended solely for the recipient and should not be replicated in any form or manner electronic or otherwise
samLongShort – Product details

Slide - 8
This presentation is intended solely for the recipient and should not be replicated in any form or manner electronic or otherwise
Basic Methodology
Long
Short
a
Portfolio selection
• 100% quantitative ranking and scoring of Nifty-50 stocks from
Rank 1 to Rank 50 done on the 1st of every month
• Portfolio is constructed in two steps :
• Taking long positions in the top 10 ranked stocks
with an equal weightage of 10% assigned to each of
the top 10 stocks
• Taking short positions in Nifty futures of value
equivalent to 100% of the long portfolio
• The re-balancing of the stocks portfolio is done at the beginning
of every month
• The idea is to generate consistent and less volatile alpha over
Nifty, which results into attractive returns with low risk when
run on a 2x leverage

Slide - 9
This presentation is intended solely for the recipient and should not be replicated in any form or manner electronic or otherwise
OPTIMIZED BETA
SHORT TERM
TEMPORARY UNDER-
PERFORMERS
LONG TERM
OUTPERFORMERS
High ranked future outperformers
Uses the short, medium and long term outperformance and underperformance of each stock in Nifty-50 to
calculate the ranks
Stocks with long term outperformance and short term temporary underperformance is given higher weight
Proprietary statistical and quantitative techniques are used in ranking mechanism to further reinforce that the
short term underperformance is temporary in nature
Portfolio return optimization techniques are used for optimizing the beta of the portfolio
Ranking Mechanism

Slide - 10
This presentation is intended solely for the recipient and should not be replicated in any form or manner electronic or otherwise
Capital protection
The Long-Short strategy ensures protection of the capital irrespective of the market
movements
The protection to the capital stands at the “core” of the strategy

Slide - 11
This presentation is intended solely for the recipient and should not be replicated in any form or manner electronic or otherwise
Considerations Approach
Back testing Mechanism
• 10 years of back testing from 2001 to 2010
• Tracking changes in Nifty50 stocks over the last 10 years
• Methodology tested across varied market conditions
Live Market Testing • Daily tracking of the NAV and portfolio returns
• Monthly ranking, optimization and re-balance
Portfolio Selection • Uniform ranking mechanism
• Top 10 stocks are selected
Portfolio Re-balance • Beginning of every month
Portfolio constituents • 10 stocks long from Nifty50
• Nifty futures short to the 100% of long portfolio value
Portfolio Weight • Equal weight for all stocks at 10% for the long portfolio
• 100% weightage to Nifty futures for the short portfolio
Back Testing and Live Market Approach

Slide - 12
This presentation is intended solely for the recipient and should not be replicated in any form or manner electronic or otherwise
Back-test based on realistic scenario
• Slippage and Transaction Cost @ 50 BP

Slide - 13
This presentation is intended solely for the recipient and should not be replicated in any form or manner electronic or otherwise
Year on Year Performance Chart against NIFTY50
Note: ▪ Historical return generated by back-testing
▪ Slippage & Transaction Cost @ 50bp
17.4%
63.1%
26.0%
-3.2%
12.3%
28.6%
17.3%
78.2%
57.7%
-15.7% -15.0%
4.2%
69.4%
10.2%
32.3%
39.1%
50.3%
-48.6%
68.4%
16.8%
-60.0%
-40.0%
-20.0%
0.0%
20.0%
40.0%
60.0%
80.0%
100.0%
2001 2002 2003 2004 2005 2006 2007 2008 2009 2010
samLongShort Nifty50

Slide - 14
This presentation is intended solely for the recipient and should not be replicated in any form or manner electronic or otherwise
Year on Year Performance Chart against NIFTY50 (table)
Note: ▪ Historical return generated by back-testing
▪ Slippage & Transaction Cost @ 50bp
Year NIFTY50 samLongShort (2x Leverage)
2001 -15.0% 17.4%
2002 4.2% 63.1%
2003 69.4% 26.0%
2004 10.2% -3.2%
2005 32.3% 12.3%
2006 39.1% 28.6%
2007 50.3% 17.3%
2008 -48.6% 78.2%
2009 68.4% 57.7%
2010 16.8% -15.7%
Average 22.7% 28.2%
Slide - 15
This presentation is intended solely for the recipient and should not be replicated in any form or manner electronic or otherwise
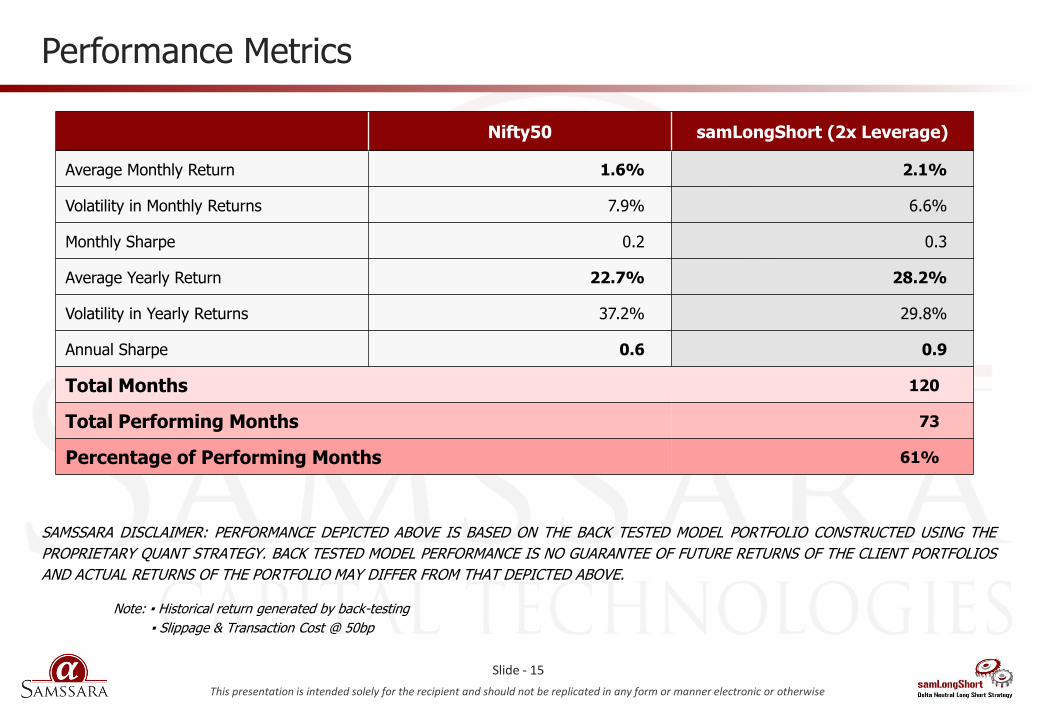
Nifty50 samLongShort (2x Leverage)
Average Monthly Return 1.6% 2.1%
Volatility in Monthly Returns 7.9% 6.6%
Monthly Sharpe 0.2 0.3
Average Yearly Return 22.7% 28.2%
Volatility in Yearly Returns 37.2% 29.8%
Annual Sharpe 0.6 0.9
Total Months 120
Total Performing Months 73
Percentage of Performing Months 61%
Performance Metrics
SAMSSARA DISCLAIMER: PERFORMANCE DEPICTED ABOVE IS BASED ON THE BACK TESTED MODEL PORTFOLIO CONSTRUCTED USING THE
PROPRIETARY QUANT STRATEGY. BACK TESTED MODEL PERFORMANCE IS NO GUARANTEE OF FUTURE RETURNS OF THE CLIENT PORTFOLIOS
AND ACTUAL RETURNS OF THE PORTFOLIO MAY DIFFER FROM THAT DEPICTED ABOVE.
Note: ▪ Historical return generated by back-testing
▪ Slippage & Transaction Cost @ 50bp

Slide - 16
This presentation is intended solely for the recipient and should not be replicated in any form or manner electronic or otherwise
Terms Futures Equity (2x Leverage)
Minimum Capital Investment Rs. 100 Lacs
Equity Exposure Rs. 200 Lacs (2x Leverage)
Nifty Futures Hedge Rs. 200 Lacs (2x Hedged)
Annualized Return (excluding FD returns) 28.2%
Annualized Volatility 29.8%
Annualized Sharpe 0.9
Peak to Trough Drawdown* 25%
Peak to Trough Drawdown on Capital* Rs. 25 Lacs
Transactions Costs + Slippage 50 bps
Recommended Account Types Client accounts (Managed Futures)
* Based on back-test results from 2001 to 2010
Futures Exposure in Equities

Slide - 17
This presentation is intended solely for the recipient and should not be replicated in any form or manner electronic or otherwise
Live Performance

Slide - 18
This presentation is intended solely for the recipient and should not be replicated in any form or manner electronic or otherwise
SAMSSARA DISCLAIMER: PERFORMANCE DEPICTED ABOVE IS BASED ON THE LIVE PORTFOLIO MANAGED ON SAMLONGSHORT STRATEGY. THE ACTUAL PERFORMANCE MAY VARY FROM CLIENT TO CLIENT BASED ON CASH/FUTURE POSITIONING, EXECUTION METHOLOLOGY AND EXECUTION TIMINGS.
2011 – Monthly NIFTY50* samLongShort
(2x Leverage)***
Jan – 2011 -12.0% 1.1%
Feb – 2011 1.9% -0.7%
Mar – 2011 5.5% 2.8%
Apr – 2011 -2.1% 3.2%
May – 2011 -1.9% 1.4%
Jun – 2011 0.6% 1.7%
Jul – 2011 -2.0% 0.0%
Aug – 2011 -8.6% -4.2%
Sep – 2011 -3.8% 6.0%
Oct – 2011 8.42% 5.9%
Nov – 2011 -6.1% 5.5%
Dec – 2011 -6.1% -5.3%
Total -24.7% 17.8%
Outperformance over Nifty Index 42.5%
* Nifty returns are calculated from 1st day of current month to 1st day of next month ** All portfolio re-balances and return calculations are done on 1st trading day of every month *** 2X Leverage on stock futures, data includes F&O prices, rollover prices and transaction costs (transaction costs: 20 bps)
Live Performance
2012 – Monthly NIFTY50* samLongShort
(2x Leverage)***
Jan – 2012 12.9% 18.0%
Feb – 2012 2.0% 4.4%
Mar – 2012 -0.4% -0.1%
Apr – 2012 -1.5% -0.8%
May – 2012 -7.6% 4.9%
Jun – 2012 9.0% 3.3%
Jul – 2012 -0.7% -3.4%
Aug – 2012 0.3% -5.1%
Sep – 2012 8.6% 6.6%
Oct – 2012 -1.3% -3.0%
Total 21.8% 25.3%
Outperformance over Nifty Index 3.5%

Slide - 19
This presentation is intended solely for the recipient and should not be replicated in any form or manner electronic or otherwise
Comparison with Nifty50 Index
SAMSSARA DISCLAIMER: PERFORMANCE DEPICTED ABOVE IS BASED ON THE LIVE PORTFOLIO MANAGED ON SAMLONGSHORT STRATEGY. THE ACTUAL PERFORMANCE MAY VARY FROM CLIENT TO CLIENT BASED ON CASH/FUTURE POSITIONING, EXECUTION METHOLOLOGY AND EXECUTION TIMINGS.
0
20
40
60
80
100
120
140
160
180
Value of Rs. 100 invested in samLongShort v/s NIFTY (Since Inception)
samLongShort Nifty50

Slide - 20
This presentation is intended solely for the recipient and should not be replicated in any form or manner electronic or otherwise
Performance in August 2012
Portfolio August 2012
Rank Long Stocks Return in August 2012 (%)
1 Mahindra & Mahindra Ltd. 8.2%
2 Wipro Ltd 7.2%
3 NTPC Ltd 7.2%
4 Maruti Suzuki India Ltd 3.7%
5 Bharat Heavy Electricals Ltd -1.3%
6 Larsen & Toubro Ltd -1.4%
7 Bank of Baroda Ltd -5.9%
8 Hero MotoCorp Ltd -6.7%
9 Jaiprakash Associates Ltd -15.9%
10 Bharti Airtel Ltd -17.4%
Long Portfolio Return (On a 2x leverage) -4.5%
Return on Short of Nifty futures (On a 2x leverage) -0.5%
Costs 0.2%
Net Return of samLongShort for Month of August 2012 (On a 2x leverage) -5.1%
SAMSSARA DISCLAIMER: PERFORMANCE DEPICTED ABOVE IS BASED ON THE LIVE PORTFOLIO MANAGED ON SAMLONGSHORT STRATEGY. THE ACTUAL PERFORMANCE MAY VARY FROM CLIENT TO CLIENT BASED ON CASH/FUTURE POSITIONING, EXECUTION METHOLOLOGY AND EXECUTION TIMINGS.

Slide - 21
This presentation is intended solely for the recipient and should not be replicated in any form or manner electronic or otherwise
Performance in September 2012
SAMSSARA DISCLAIMER: PERFORMANCE DEPICTED ABOVE IS BASED ON THE LIVE PORTFOLIO MANAGED ON SAMLONGSHORT STRATEGY. THE ACTUAL PERFORMANCE MAY VARY FROM CLIENT TO CLIENT BASED ON CASH/FUTURE POSITIONING, EXECUTION METHOLOLOGY AND EXECUTION TIMINGS.
Portfolio September 2012
Rank Long Stocks Return in September 2012 (%)
1 Larsen & Toubro Ltd 18.6%
2 ICICI Bank Ltd 16.8%
3 Maruti Suzuki India Ltd 16.1%
4 Ambuja Cements Ltd 15.9%
5 Steel Authority of India Ltd 12.8%
6 ACC Ltd 11.7%
7 GAIL India Ltd 10.9%
8 Reliance Industries Ltd 9.4%
9 Bajaj Auto Ltd 9.0%
10 Bharat Petroleum Corp Ltd 3.3%
Long Portfolio Return (On a 2x leverage) 23.1%
Return on Short of Nifty futures (On a 2x leverage) -16.3%
Costs 0.2%
Net Return of samLongShort for Month of September 2012 (On a 2x leverage) 6.6%

Slide - 22
This presentation is intended solely for the recipient and should not be replicated in any form or manner electronic or otherwise
Performance in October 2012
Portfolio October 2012
Rank Long Stocks Return in October 2012 (%)
1 Infosys Technologies Ltd -9.3%
2 Hero MotoCorp Ltd 4.2%
3 HDFC -1.9%
4 GAIL India Ltd -10.6%
5 Bharti Airtel Ltd 4.9%
6 Reliance Industries Ltd -4.2%
7 Asian Paints Ltd -2.5%
8 Wipro Ltd -6.1%
9 Oil & Natural Gas Corp Ltd -5.6%
10 Siemens India Ltd -2.8%
Long Portfolio Return (On a 2x leverage) -3.4%
Return on Short of Nifty futures (On a 2x leverage) 1.3%
Costs 0.2%
Net Return of samLongShort for Month of October 2012 (On a 2x leverage) -3.0%
SAMSSARA DISCLAIMER: PERFORMANCE DEPICTED ABOVE IS BASED ON THE LIVE PORTFOLIO MANAGED ON SAMLONGSHORT STRATEGY. THE ACTUAL PERFORMANCE MAY VARY FROM CLIENT TO CLIENT BASED ON CASH/FUTURE POSITIONING, EXECUTION METHOLOLOGY AND EXECUTION TIMINGS.

Slide - 23
This presentation is intended solely for the recipient and should not be replicated in any form or manner electronic or otherwise
Advisory Structure, Fee Structure & Risk Management

Slide - 24
This presentation is intended solely for the recipient and should not be replicated in any form or manner electronic or otherwise
Advisory structure
Client Broker Clients open a trading/demat
account directly with the broker
For samLongShort, Samssara acts as an advisor to its clients
The customer would open a broking/demat account directly with any of the brokers empaneled by Samssara
which would offer competitive brokerage rates that are pre-negotiated by Samssara
Samssara orders trades to the brokers on behalf of the clients. These trades are approved by the clients to
the brokers

Slide - 25
This presentation is intended solely for the recipient and should not be replicated in any form or manner electronic or otherwise
Details Terms
Quantitative Intelligence Samssara Capital Technologies LLP
Minimum Investment Rs. 100 Lacs
Prime Broker Contingent on the client
Fee Structure
Performance Fees:
• Management Fee: 0%
• Performance Fee: 20%*
• High Water-Mark: Yes
Statutory levies such as STT At cost
Average churning per year 8 times
Portfolio re-balance Beginning of every month
Hedging Anytime during the month
Subscriptions / Redemptions / Exit End of every month
NAV Reporting Daily
* Performance fee on the net profit generated. Net of all costs, not taxes
Fees Structure
Slide - 26
This presentation is intended solely for the recipient and should not be replicated in any form or manner electronic or otherwise
Risk Management
Sticking to absolute blue-chips and mega-caps stocks of Nifty50 portfolio
Large pool of liquidity available in Nifty 50 stocks and hence outperformance is not due to
liquidity premium in any stocks (Unlike in BSE 200 portfolio)
Diversified portfolio with weight in no stock exceeding 10%
Beta optimized in the portfolio to ensure that the excess return is not beta inclined
The shorting mechanism has the dual advantage of generating low risk returns on the
portfolio for clients
The fund has been designed to yield “consistent” returns for the investors irrespective of
the market conditions and hence providing them with an alternative and protected
investment vehicle for their investments
Slide - 27
This presentation is intended solely for the recipient and should not be replicated in any form or manner electronic or otherwise
Contact us
Head Office:
208/209, Veena Chambers 21 Dalal Street Mumbai – 400 001
Development Office:
207, Business Classic, Behind H P Petrol Pump, Chincholi Bunder Road, Malad (W) Mumbai – 400 064
For more information do visit : www.samssara.com
Manish Jalan
M: +91 98678 32726 D: +91 22 6748 7720 E: [email protected]
Tarun Soni
M: +91 98692 17190 D: +91 22 6748 7720 E: [email protected]