
A Machine Learning Investigation of One-Month MomentumMachine Learning Investigation of One-Month...
36
A Machine Learning Investigation of One-Month Momentum Ben Gum
Transcript of A Machine Learning Investigation of One-Month MomentumMachine Learning Investigation of One-Month...

A Machine Learning Investigation of One-Month MomentumBen Gum
Machine Learning Investigation of One-Month MomentumContents
● Problem● Data● Recent Literature● Simple Improvements● Neural Network Approach● Conclusion● Appendix : Some Background on Neural Networks

Machine Learning Investigation of One-Month MomentumProblem
● In 1990, Jegadeesh (Evidence of Predictable Behavior in Security Returns) showed that there is a negative auto-correlation in one month active stock returns.
– That is, a portfolio that is long last month’s losers and short last month’s winners has significant positive returns.
– The intuition for this is that investors may over-value last month’s winners, which can depress returns in the near future.
● Since 1990, this efect has decayed substantially, but others have published refinements of the one-month return reversal efect, by considering the daily returns within the trailing month (rather than the simple aggregate).
● Based on this, we investigate how we can predict month t+1 returns using the daily returns during month t. We use traditional techniques based on rather literature and then compare with a straight-forward neural network approach.

Machine Learning Investigation of One-Month MomentumProblem : Metrics
● As with recent literature, we use the metric of the returns to an equal-weighted quintile diference portfolios.
– That is, for a signal s, we sort the stocks by s then construct a long-short portfolio that goes long the highest quintile of s and is short the lowest quintile of s.
– This is a rather standard metric that is independent of the overall market return and generally avoids issues with size biases (equal-weighted long-only portfolios ofen have a small cap tilt that can obscure the results of the underlying signal).
– In addition, the quintile diference portfolio is generally investible and is not overly afected by outliers.

Machine Learning Investigation of One-Month MomentumContents
● Problem● Data● Recent Literature● Simple Improvements● Neural Network Approach● Conclusion● Appendix : Some Background on Neural Networks

Machine Learning Investigation of One-Month MomentumData
● We get our daily stock returns from the Quandl Wiki database
– Quandl has a number of handy financial databases, but for the exercise, we only need the daily returns (from daily adjusted close prices).
– Quandl data is accessible via API or by mass download. For convenience we did a mass download of the entire Quandl Wiki database
– Quandl Wiki daily price data begins in 1960 and continues to present .● We also pull the daily S&P 500 (SPY) returns from the Yahoo Finance API.
– This starts in 1993, so we have 25 years of total test data.
– All of this is out of sample with respect to the Jegadeesh paper.

Machine Learning Investigation of One-Month MomentumData : Further Details
● Although the Quandl Wiki price data begins in 1960, the coverage is very thin initially.
– During our test period of 1993-2017, the number of companies ranges from 1049 to 3113
– In aggregate, we have 644,583 (company,month) data points for the study.

Machine Learning Investigation of One-Month MomentumContents
● Problem● Data● Recent Literature● Simple Improvements● Neural Network Approach● Conclusion● Appendix : Some Background on Neural Networks

Machine Learning Investigation of One-Month MomentumRecent Literature
● We replicate and expand upon the findings in of Asness et al (Betting Against Correlations 2017)
– By considering daily returns, they derive signals of market correlation and of positive skew of returns and show that both of these result in under-performance over the subsequent month
– The intuition for this is similar to that of Jegadeesh. Investors over-pay for market correlations and positive skew and thus these metrics disappoint in the next month.
– Asness at al add some additional reasoning regarding the contradiction with CAPM. CAPM says that investors who want to out-perform the market will simply buy a leveraged market portfolio. However when investors are unable or unwilling to lever, they may seek out positive skews and/or higher beta.
● Asness et al define SMAX (scaled max) as a metric of positive skew as a function of the daily total returns over the trailing month.
– SMAX = (Average of highest 5 total daily returns)/(Stdev of the daily returns)
– Note that max return and stdev of returns are highly correlated so the scaling removes this correlation, leaving a pure measure of positive skew.

Machine Learning Investigation of One-Month MomentumRecent Literature : Signal Replication
● To replicate the results of Jegadeesh ad Asness et al, we calculate the following statistics for each company,month pair
– forward_return, the return to the company in month t+1 (our dependent variable)
– spycorr, the correlation of the daily returns in month t between the company and SPY● This is a variant of the market correlation metric from Asness et al
– ret, the monthly return of the company in month t (Jegadeesh, 1990)
– max5, the average of the largest five total daily returns of the company in month t
– min5, the average of the smallest five total daily returns of the company in month t
– std, the standard deviation of the total daily returns of the company in month t
– sret, scaled return = ret/std
– smax, scaled max = max5/std
– smin, scaled min = min5/std

Machine Learning Investigation of One-Month MomentumRecent Literature : Signal Replication, a Snapshot View
● The table below shows the signals for a handful of companies for January 2014
– Note that we are not concerned with the relative scales of the independent variables (spycorr, …, smin) since we are using them to create quintile diference portfolios and are thus only concerned with rankings.
Machine Learning Investigation of One-Month MomentumRecent Literature : Signal Replication, Snapshot Correlations
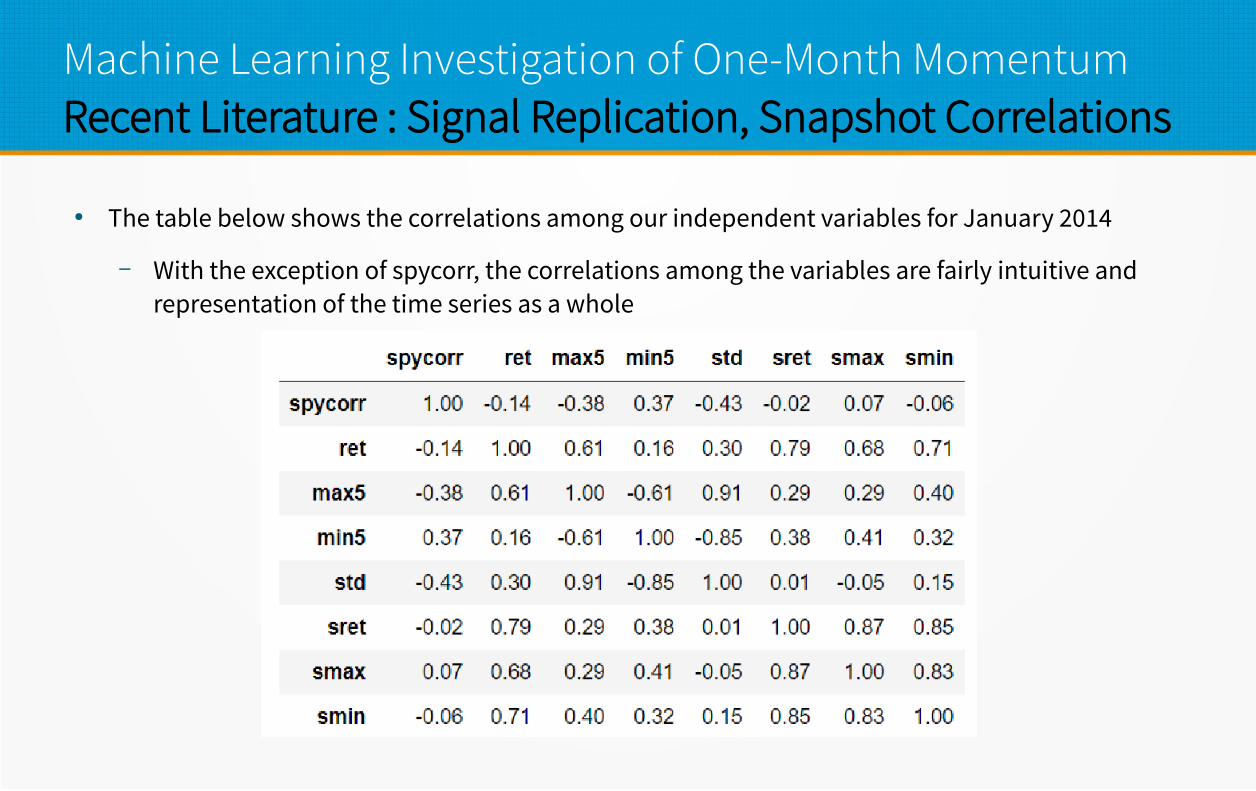
● The table below shows the correlations among our independent variables for January 2014
– With the exception of spycorr, the correlations among the variables are fairly intuitive and representation of the time series as a whole
Machine Learning Investigation of One-Month MomentumRecent Literature : Signal Replication, Snapshot Distributions
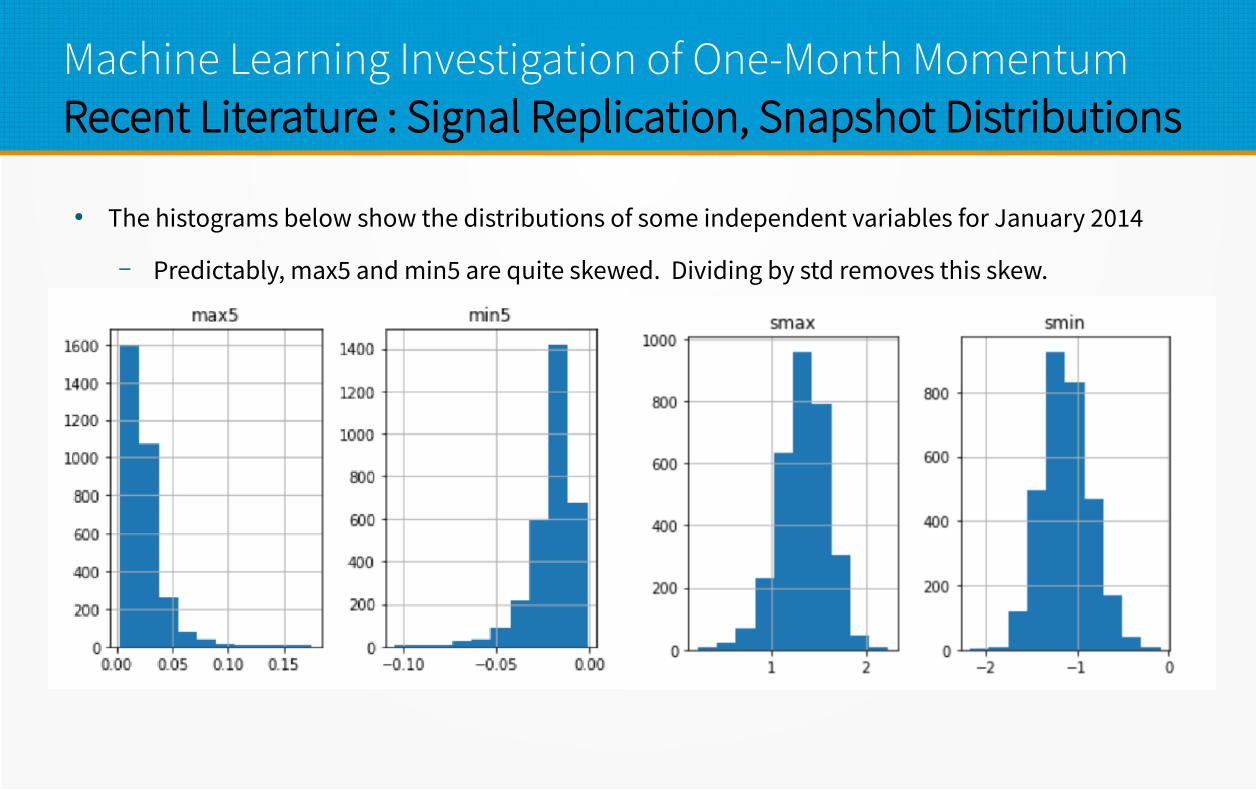
● The histograms below show the distributions of some independent variables for January 2014
– Predictably, max5 and min5 are quite skewed. Dividing by std removes this skew.
–

Machine Learning Investigation of One-Month MomentumRecent Literature : Signal Replication, Quintile Returns
● The chart and table below the returns to the quintile portfolios for each signal
– The chart is rolling 10-year average to show the decay. These confirm that these signals work over the test period, but have decayed substantially.

Machine Learning Investigation of One-Month MomentumContents
● Problem● Data● Recent Literature● Simple Improvements● Neural Network Approach● Conclusion● Appendix : Some Background on Neural Networks

Machine Learning Investigation of One-Month MomentumSimple Improvements
● To improve upon the individual signals, we create simple combinations that are equal weighted averages of standardized signals (so that the relative weights are consistent through time).
– We can see that corr+smax is now our best signal. Note that this could be further optimized (though at the risk of over-fitting in sample).

Machine Learning Investigation of One-Month MomentumContents
● Problem● Data● Recent Literature● Simple Improvements● Neural Network Approach● Conclusion● Appendix : Some Background on Neural Networks
Machine Learning Investigation of One-Month MomentumNeural Network Approach : What, Why, and How
● What : I think of a neural network is a generalization of a regression
● A regression transforms a few medium strength predictors into a strong predictor.● A Neural Network transforms many weak predictors into a few medium strength predictors and then into
a strong predictor.● Why : In this problem we have the ~20 daily returns from month t (ie weak predictors of return) and want a strong
prediction of return in month t+1.
– Instead of picking the medium strength from predictors literature (such as corr and smax in the previous section), we train the neural network to pick.
● How : In order to train on multiple months of data, we will need to modestly transform the inputs.
– This will lose some information, but will prevent the network from trying to overfit based on aspects specific to particular months.
– We limit ourselves to the last 20 business days of the month.
– In addition, we transform all returns to active and do not use the SPY returns.

Machine Learning Investigation of One-Month MomentumNeural Network Approach : Training/Testing split
● We will need to be careful about splitting our training and testing test sets so that our test results are realistic, since Neural Networks have to potential to substantially overfit.
● To do this, we use a technique called rolling lagged cross-validation.
– For each year y in our testing window, we first train our network on the 60 months in years y-5 to y-1. We then test our network on the 12 months of year y.
– For example, our first training set will be the 73,382 company,month pairs from 1993-1997.
– Our training independent inputs are then a 73,382x20 matrix of daily returns and our dependent for training is a 73,382x1 matrix of the subsequent monthly returns
● Our initial model is consists of our 20 daily return inputs (weak predictors), 20 nodes in a hidden layer (medium strength predictors), and one output node (ideally a strong predictor of active returns).
● Although our model itself is a bit of a black box, the rolling lagged cross-validation assures us that all of our testing is out of sample.

Machine Learning Investigation of One-Month MomentumNeural Network Approach : Model Performance
● The chart and table below show the performance of five neural network model structures over our test window 1998-2017. The ‘single’ model with one hidden layer of 20 nodes does best.

Machine Learning Investigation of One-Month MomentumNeural Network Approach : Comparison with Others
● Over the 1998-2017 test window, the neural network model out-performs the trailing return (Jegadeesh), SMAX (Asness et al), as well as our simple combination of idea, Smax + SpyCorr.
– Though all models decay substantially in strength over time.
Machine Learning Investigation of One-Month MomentumNeural Network Approach : Correlation with Others
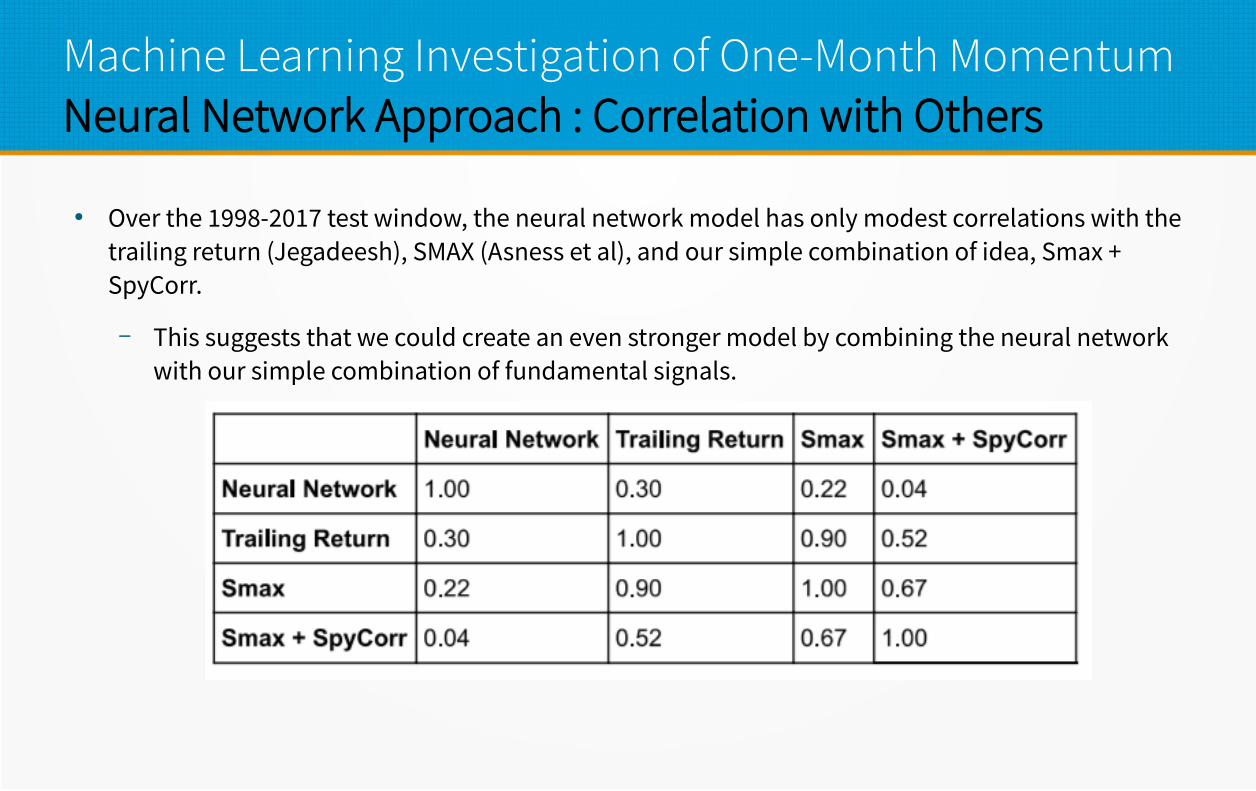
● Over the 1998-2017 test window, the neural network model has only modest correlations with the trailing return (Jegadeesh), SMAX (Asness et al), and our simple combination of idea, Smax + SpyCorr.
– This suggests that we could create an even stronger model by combining the neural network with our simple combination of fundamental signals.

Machine Learning Investigation of One-Month MomentumContents
● Problem● Data● Recent Literature● Simple Improvements● Neural Network Approach● Conclusion● Appendix : Some Background on Neural Networks

Machine Learning Investigation of One-Month Momentum Conclusions: Findings and Questions
● Using daily and monthly returns from the US Stock Market from 1993-2017, we have:
– Replicated signals from Jegadeesh and Asness et al and shown that while they continue to work, their efectiveness has decreased substantially over time.
– Created a simple combination of signals that out-performs either of the components.
– Trained and tested a neural network model that out-performs the all of the above.● Questions:
– Can we generate an improved signal by combining the models from literature with the neural networks?
– Is there a way to make use of market/total returns to improve our neural network model?
– Would a diferent structure of neural network give us an improved prediction?

Machine Learning Investigation of One-Month MomentumContents
● Problem● Data● Recent Literature● Simple Improvements● Neural Network Approach● Conclusion● Appendix : Some Background on Neural Networks

Machine Learning Investigation of One-Month MomentumSome Background on Neural Networks
● There are many online resources on Neural Networks, but my favorite is the four video YouTube series by 3Blue1Brown. It gives a deep dive into using a neural network to recognize a hand-written digit.
– The follow slides are a brief sampling of that deep dive.● Digit/image recognition is a very powerful application of neural networks, but difers from the stock
return prediction in several fundamental ways.
– Digit/image recognition is a classification problem, in that the dependent variable is one of a finite number of classes, such as the digits 0-9.
● Stock return prediction has a continuous dependent variable. While the general methodology is similar, the continuous neural network will have a diferent functions at each node.
– Digit/image recognition has the advantages that:● More images/digits can always be generated for training.● Yesterday’s digits/images are very similar to tomorrow’s. Returns might not be.

Machine Learning Investigation of One-Month MomentumNeural Networks by 3Blue1Brown : Problem Setup
BLUE1BROWN SERIES S3 • E1 But what *is* a Neural Network? | Deep learning, chapter 1

Machine Learning Investigation of One-Month MomentumNeural Networks by 3Blue1Brown : Network Structure
BLUE1BROWN SERIES S3 • E1 But what *is* a Neural Network? | Deep learning, chapter 1

Machine Learning Investigation of One-Month MomentumNeural Networks by 3Blue1Brown : Classifier Limitations
BLUE1BROWN SERIES S3 • E2 Gradient descent, how neural networks learn | Deep learning, chapter 2

Machine Learning Investigation of One-Month MomentumNeural Networks by 3Blue1Brown : A Single Node
BLUE1BROWN SERIES S3 • E1 But what *is* a Neural Network? | Deep learning, chapter 1

Machine Learning Investigation of One-Month MomentumNeural Networks by 3Blue1Brown : 13,002 Parameters!
BLUE1BROWN SERIES S3 • E1 But what *is* a Neural Network? | Deep learning, chapter 1

Machine Learning Investigation of One-Month MomentumNeural Networks by 3Blue1Brown : Loss Function
BLUE1BROWN SERIES S3 • E2 Gradient descent, how neural networks learn | Deep learning, chapter 2

Machine Learning Investigation of One-Month MomentumNeural Networks by 3Blue1Brown : Gradient Descent
BLUE1BROWN SERIES S3 • E2 Gradient descent, how neural networks learn | Deep learning, chapter 2

Machine Learning Investigation of One-Month MomentumNeural Networks by 3Blue1Brown : Implementing Gradient Descent
BLUE1BROWN SERIES S3 • E2 Gradient descent, how neural networks learn | Deep learning, chapter 2

Machine Learning Investigation of One-Month MomentumNeural Networks by 3Blue1Brown : Updating Network Parameters
BLUE1BROWN SERIES S3 • E3 What is backpropagation really doing? | Deep learning, chapter 3

Machine Learning Investigation of One-Month MomentumNeural Networks by 3Blue1Brown : Backpropagation
BLUE1BROWN SERIES S3 • E4 Backpropagation calculus | Deep learning, chapter 4