A Look at New Features in 7.8. CQG Version 7.8 CQG version 7.8 brings traders and brokers new...
14
A Look at New Features in 7.8
-
Upload
collin-moorefield -
Category
Documents
-
view
218 -
download
0
Transcript of A Look at New Features in 7.8. CQG Version 7.8 CQG version 7.8 brings traders and brokers new...

A Look at New Features in 7.8
CQG Version 7.8
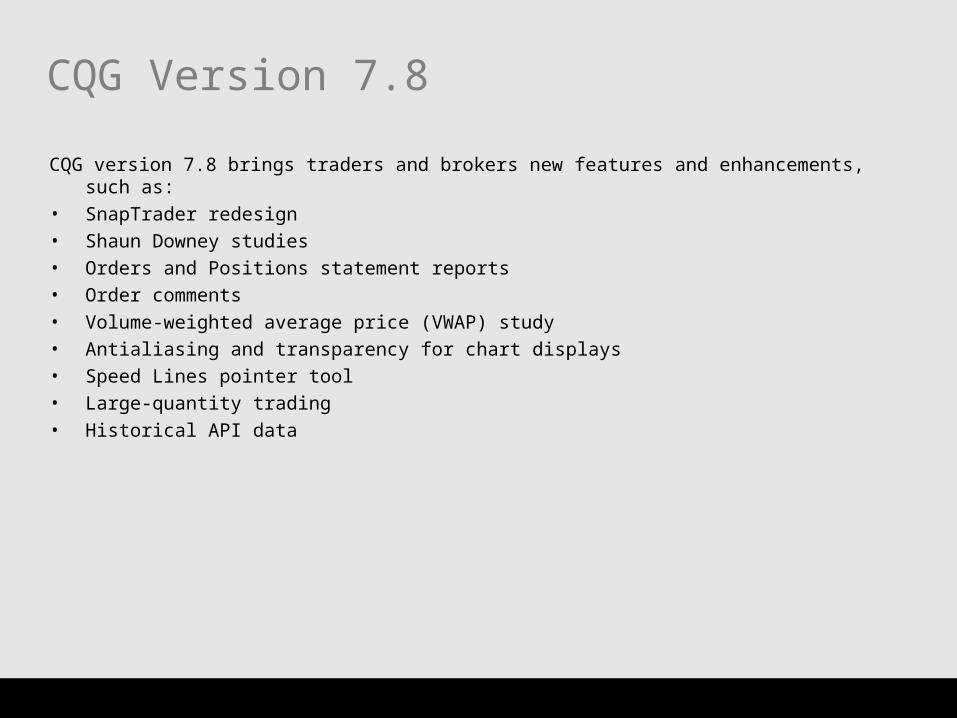
CQG version 7.8 brings traders and brokers new features and enhancements, such as:
• SnapTrader redesign
• Shaun Downey studies
• Orders and Positions statement reports
• Order comments
• Volume-weighted average price (VWAP) study
• Antialiasing and transparency for chart displays
• Speed Lines pointer tool
• Large-quantity trading
• Historical API data

The SnapTrader flyouts appear when you hover over the buy and sell market buttons. Green indicates buy orders and red indicates sell orders. You can access all of the stop order and limit order types.
Redesigned SnapTrader
• The oversized view of the SnapTrader, shown in the center of the chart, shows the new text descriptions for orders and the new colors on the flyouts.
• The SnapTrader now features added order types. Choose from either limit orders or trailing limit orders. Stop orders now include:
– Stop
– Stop limit
– Trailing stop
– Trailing stop limit
– DOM-triggered stop
– DOM-triggered trailing stop
– DOM-triggered trailingstop limit Key Benefit: Trade directly from the chart using
SnapTrader, making analytics and trading a
seamless process.
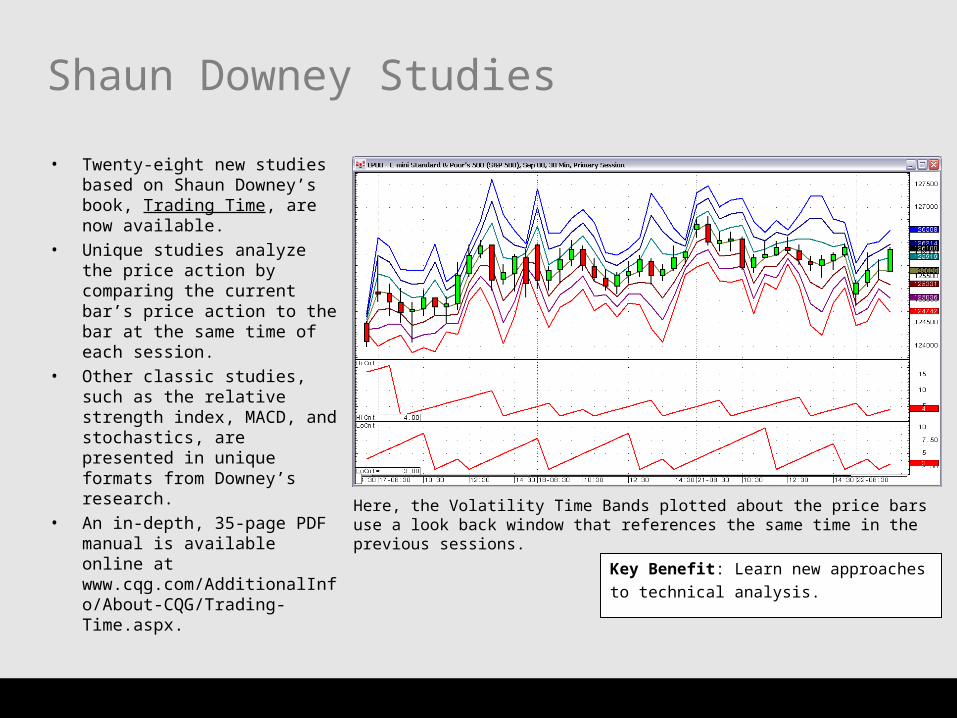
Here, the Volatility Time Bands plotted about the price bars use a look back window that references the same time in the previous sessions.
Shaun Downey Studies
• Twenty-eight new studies based on Shaun Downey’s book, Trading Time, are now available.
• Unique studies analyze the price action by comparing the current bar’s price action to the bar at the same time of each session.
• Other classic studies, such as the relative strength index, MACD, and stochastics, are presented in unique formats from Downey’s research.
• An in-depth, 35-page PDF manual is available online at www.cqg.com/AdditionalInfo/About-CQG/Trading-Time.aspx.
Key Benefit: Learn new approaches
to technical analysis.

Orders and Positions Display
• Export statements to HTML or into a Microsoft Excel® spreadsheet.
• Choose from these data fields:
– Date ranges
– Trades
– Orders
– Purchase & Sales
– Account value summary
– Opens positions summary
– Cash adjustments
• Access examples of VBA programming code to design custom reports in Excel.
Key Benefit: Exporting statement
reports to an Excel spreadsheet
offers increased convenience and
greater flexibility.
Export reports from CQG to an Excel spreadsheet for easier record-keeping.

Order Comments
• Order comments are displayed in columns in the Orders and Positions window
• The order comments can be updated through the dialog window.
• The comment column is optional for all of the ordercategories in the Order and Positions display. Thecomment tabs include:
– Working
– Filled
– Cancelled
– Exceptions
– Parked
– AllKey Benefit: Log comments to individual orders to
track trading decisions. Brokers can attach
comments to orders placed by customers as well as
leave notes for other brokers or traders on the desk.
Comments can be attached to individual orders through this dialog window.

The VWAP can be calculated over the entire trading session or for a certain amount of time.
Volume-Weighted Average Price (VWAP) Study
• The VWAP study calculates the volume-weighted average price throughout the trading session.
• The starting bar can be:
– Start of the day
– Start of session
– None
• Choose any of the following bar values for the VWAP calculation:
– Open
– High
– Low
– Close
– Mid-point price
– HLC/3 Key Benefit: The VWAP study provides the current
estimated volume-weighted average price for
traders needing the information to manage orders.
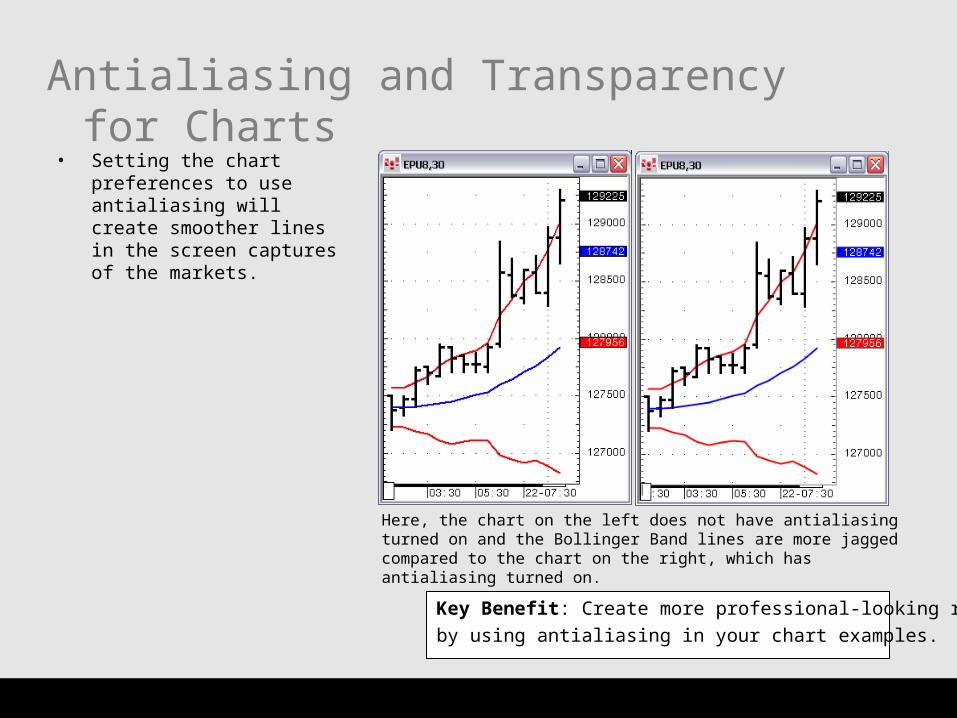
Here, the chart on the left does not have antialiasing turned on and the Bollinger Band lines are more jagged compared to the chart on the right, which has antialiasing turned on.
Antialiasing and Transparency for Charts
• Setting the chart preferences to use antialiasing will create smoother lines in the screen captures of the markets.
Key Benefit: Create more professional-looking reports
by using antialiasing in your chart examples.

Speed Lines
• Speed Lines are plotted using market swings. Start with 1 as the starting point. The Speed Lines will intersect with the line drawn from point 2 to 3 using any user-defined ratio.
• Here, the intersection points are in eights. Up to nine Speed Lines can be plotted.
• Choose any color for the Speed Lines.
Key Benefit: Use Speed Lines to
identify potential support and resistance
levels in a trend.
These nine Speed Lines intersect the swing line from point 2 to point 3 in one-eighth steps.
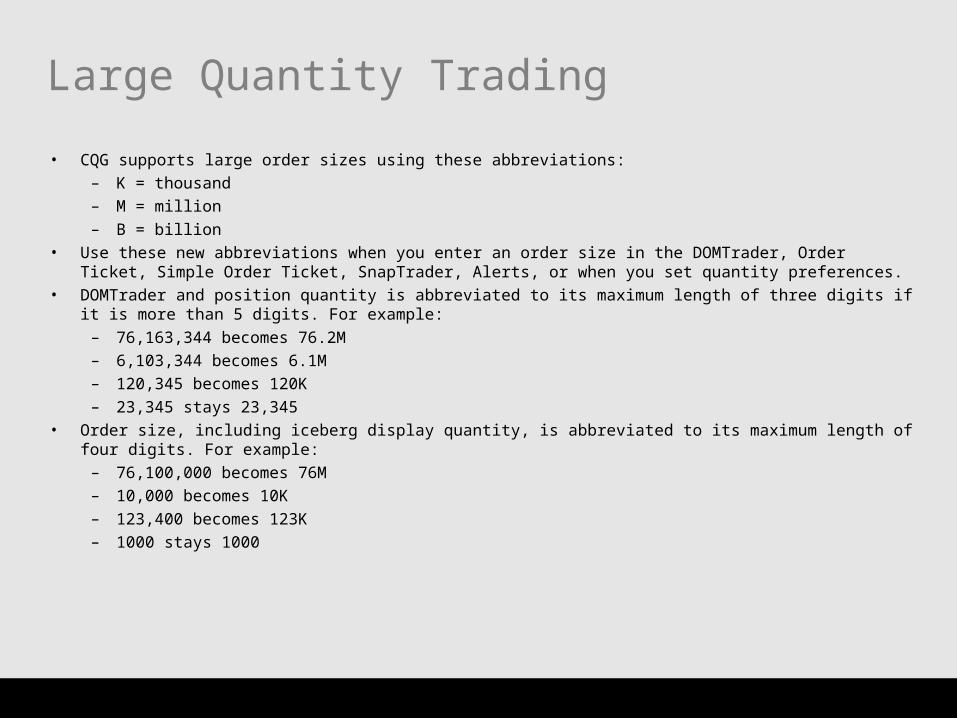
Large Quantity Trading
• CQG supports large order sizes using these abbreviations:– K = thousand– M = million– B = billion
• Use these new abbreviations when you enter an order size in the DOMTrader, Order Ticket, Simple Order Ticket, SnapTrader, Alerts, or when you set quantity preferences.
• DOMTrader and position quantity is abbreviated to its maximum length of three digits if it is more than 5 digits. For example:
– 76,163,344 becomes 76.2M – 6,103,344 becomes 6.1M – 120,345 becomes 120K – 23,345 stays 23,345
• Order size, including iceberg display quantity, is abbreviated to its maximum length of four digits. For example: – 76,100,000 becomes 76M – 10,000 becomes 10K– 123,400 becomes 123K– 1000 stays 1000
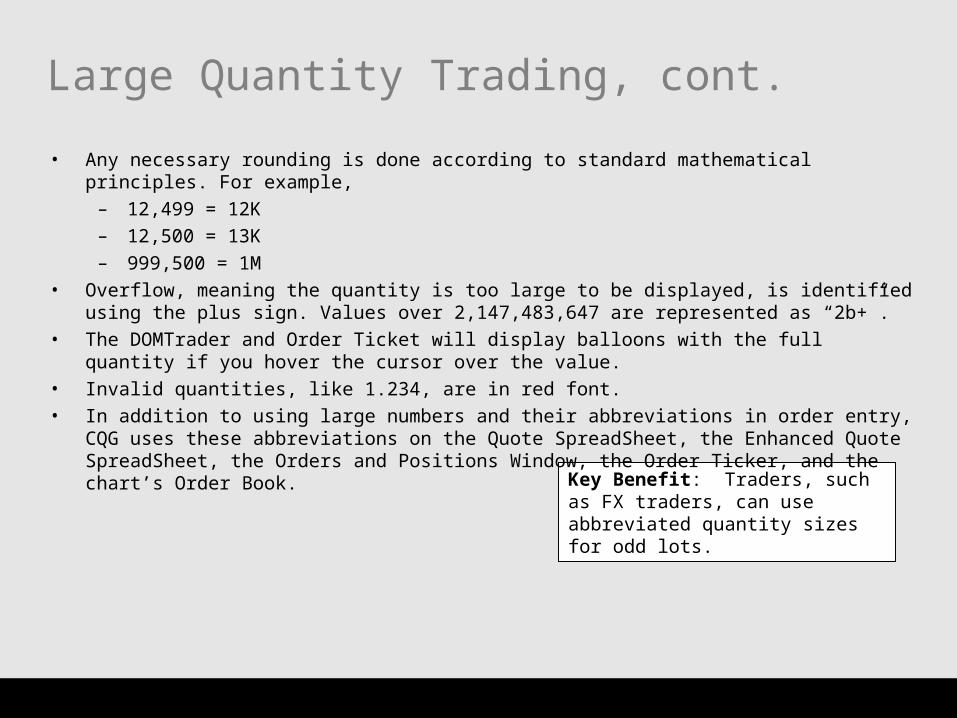
Key Benefit: Traders, such as FX traders, can use abbreviated quantity sizes for odd lots.
Large Quantity Trading, cont.
• Any necessary rounding is done according to standard mathematical principles. For example,
– 12,499 = 12K
– 12,500 = 13K
– 999,500 = 1M
• Overflow, meaning the quantity is too large to be displayed, is identified using the plus sign. Values over 2,147,483,647 are represented as “2b+”.
• The DOMTrader and Order Ticket will display balloons with the full quantity if you hover the cursor over the value.
• Invalid quantities, like 1.234, are in red font.
• In addition to using large numbers and their abbreviations in order entry, CQG uses these abbreviations on the Quote SpreadSheet, the Enhanced Quote SpreadSheet, the Orders and Positions Window, the Order Ticker, and the chart’s Order Book.

Historical API
Newly available features include:
• Tick, timed bars, CVB, TradeFlow, and Point and Figure values
• Custom study values
• Condition, QFormula, and trading system definitions
• Expression data • Data source symbol data,
including name, abbreviation, symbols type, and status of the source and description, abbreviation, and typeof symbol
Key Benefit: CQG API includes
more historical data for research
and trading.
Traders can export more historical market information through the CQG API to other applications.

CQG, Inc.CQG, Inc.
CQG, Inc. is the industry’s highest-performing solution to integrate market data, technical analysis, and trade routing. CQG’s data coverage includes futures, options, fixed income, foreign exchange, and equities exchanges worldwide as well as debt securities, reports, and indices. Founded in 1980, CQG is headquartered in Denver with sales and support offices worldwide. For more information, visit www.cqg.com.
Customer Support:• US 1 800-525-7082• UK +44 (0) 20-7827-9500• Australia +61 (0) 2-9235-2009 • France +33 (0) 1-74-18-07-81 • Germany +49 (0) 69-920-7920 • Japan +81 (0) 3-3286-6633 • Russia +7 495-795-2410 • Singapore +65 6720-3165

DisclaimerDisclaimer
Trading and investment carry a high level of risk, and CQG, Inc. does not make any recommendations for buying or selling any financial instruments. We offer educational information on ways to use our sophisticated CQG trading tools, but it is up to our customers and other readers to make their own trading and investment decisions, or to consult with a registered investment advisor.
© 2008 CQG, Inc. All rights reserved worldwide.
CQG, DOMTrader, TFVol, and TFOBV are registered trademarks of CQG, Inc.


![7.8 notes[1]](https://static.fdocuments.us/doc/165x107/547c9b815906b561378b456f/78-notes1.jpg)