
A Longitudinal Study of Market and Firm Level Factors...
43
A Longitudinal Study of Market and Firm Level Factors Influencing ERP Systems Adoption and Post-Implementation System Enhancement Options Jian Cao 1 , Andreas I. Nicolaou 2 and Somnath Bhattacharya 3 1 School of Accounting, Florida Atlantic University, USA 2 Department of Accounting & IS, Bowling Green State University, USA 3 School of Accounting, Florida Atlantic University, USA 1 [email protected], 2 [email protected], 3 [email protected] Abstract We examine whether firms‘ investments in ERPS, including the initial adoption decision and subsequent system enhancements are consistent with economic determinants and a real options perspective. We model ERPS adoption and subsequent enhancements (in the form of upgrades or add-ons) as two separate but related decisions on the exercise of real options in a continuous implementation process. We find that ERPS adopting firms are more likely to operate in highly concentrated industries, be industry leaders, and have lower investment opportunities and higher free cash flows than non-adopters. The findings are consistent with a real options lens suggesting that the adoption of ERPS spawns growth options by creating barriers of entry, enhancing competitiveness, and providing the flexibility needed to adapt to new opportunities. In contrast, subsequent system enhancement decisions are affected by how quickly companies begin to reap the benefits they sought to accomplish in the initial ERPS adoption and by the use of high-quality post-implementation activities (as posited by Nicolaou 2004a and examined in Nicolaou and Bhattacharya 2008) that relate to project planning, strategy, and process integration. These findings suggest that the implementation and use of ERPS may enable flexibility and organizational capabilities which, in turn, allow management to optimally reconfigure the investment in ERPS by exercising operational options to enhance the system in the post-implementation period. Overall, our evidence is consistent with the adopted real options theory lens and suggests that firms should embed real options value in ERPS investments. Keywords: IT investments, ERP systems adoption, ERP systems post-implementation review, system enhancements, market effects, firm effects, longitudinal study, real options theory.
Transcript of A Longitudinal Study of Market and Firm Level Factors...

A Longitudinal Study of Market and Firm Level Factors Influencing ERP Systems
Adoption and Post-Implementation System Enhancement Options
Jian Cao1, Andreas I. Nicolaou
2 and Somnath Bhattacharya
3
1School of Accounting, Florida Atlantic University, USA
2Department of Accounting & IS, Bowling Green State University, USA
3 School of Accounting, Florida Atlantic University, USA
Abstract
We examine whether firms‘ investments in ERPS, including the initial adoption
decision and subsequent system enhancements are consistent with economic determinants
and a real options perspective. We model ERPS adoption and subsequent enhancements (in
the form of upgrades or add-ons) as two separate but related decisions on the exercise of real
options in a continuous implementation process. We find that ERPS adopting firms are more
likely to operate in highly concentrated industries, be industry leaders, and have lower
investment opportunities and higher free cash flows than non-adopters. The findings are
consistent with a real options lens suggesting that the adoption of ERPS spawns growth
options by creating barriers of entry, enhancing competitiveness, and providing the flexibility
needed to adapt to new opportunities. In contrast, subsequent system enhancement decisions
are affected by how quickly companies begin to reap the benefits they sought to accomplish
in the initial ERPS adoption and by the use of high-quality post-implementation activities (as
posited by Nicolaou 2004a and examined in Nicolaou and Bhattacharya 2008) that relate to
project planning, strategy, and process integration. These findings suggest that the
implementation and use of ERPS may enable flexibility and organizational capabilities
which, in turn, allow management to optimally reconfigure the investment in ERPS by
exercising operational options to enhance the system in the post-implementation period.
Overall, our evidence is consistent with the adopted real options theory lens and suggests that
firms should embed real options value in ERPS investments.
Keywords: IT investments, ERP systems adoption, ERP systems post-implementation review,
system enhancements, market effects, firm effects, longitudinal study, real options theory.

A Longitudinal Study of Market and Firm Level Factors Influencing ERP Systems
Adoption and Post-Implementation System Enhancement Options
I. INTRODUCTION
The implementation of enterprise resource planning systems (ERPS) often results in
failures, and prior surveys have shown that a 30 percent failure rate is not unusual (The
Standish Group 2001), while as many as 80 percent of such projects run over their initial
budgets (Walkerden and Jeffery 1997). In such situations, where a high risk of failure exists
due to ERPS adoption and subsequent implementation problems, it is important not just to
recognize the future value of the system as just a single project, but also to assess potential
future choices in system implementation which may enhance the strategic value of the
system. In this paper, we conduct a longitudinal study of ERPS project decision-making,
including initial adoption and subsequent post-implementation choices, from a real options
perspective.
The real options theory logic best applies in situations involving ERPS
implementation and long-term use, as they deal with irreversible decisions under high
uncertainty. A real option is synonymous to flexibility. The holder of an option has the right,
but not the obligation to take ownership of an underlying asset at a future point in time.
Because management will only exercise a real option if its expected outcome has incremental
value over other planned benefits, real options always add value to a project (Barnett 2005;
Copeland 2001; Trigeorgis 1996). An increase in flexibility when investing in IT
infrastructure, for example, has been shown to have a positive influence on the value of IT
investments (Benaroch and Kauffman 2000; Taudes et al. 2000). Real options theory offers a
lens through which we can examine whether organizations recognize opportunities to create
options in ERPS implementations, value these options, predict how such valuations affect
2
decision choices, and recommend how ERPS implementations should be managed in order to
realize this value.
Extant information systems (IS) research on real options has, to date, focused mainly
on prescriptives regarding the evaluation of options and the active management of investment
risks (e.g., Bardhan et al. 2004; Benaroch and Kauffman 2000; Benaroch 2002; Benaroch et
al. 2006; Benaroch et al. 2007; Clemons and Gu 2003; Fichman 2004; Kumar 2004; Schwartz
and Zozaya-Gorostiza 2003; Taudes et al. 2000). Only limited research has examined
whether management decisions about information technology (IT) investments are consistent
with real options theory. Tiwana et al. (2006, 2007) show in an experimental setting that
managers tend to intuitively associate real options with the evaluation of troubled projects
and projects with low quantifiable benefits. Benaroch et al. (2006) empirically examine
whether managers appear to control investment-specific risks using real options. They too
find that IT managers indeed follow the logic of real options in managing IT investment risk,
albeit purely based on intuition. However, these studies only use experimental or project-
level data and offer little insights into the specific real options presented in large IT projects
such as ERPS and their management.
The adoption and enhancement decision choices in ERPS present a unique context in
which both growth and operating real options can be examined.1 First, initial investments in
ERPS enable strategic growth options as ERPS provide new opportunities for future
initiatives that may enhance a firm‘s strategic agility and competitive flexibility or
innovativeness (Benaroch 2002; Sambamurthy et al. 2003). Building ERPS provides for
scalability in a firm‘s information infrastructure (Kumar, 2004), which is necessary for a firm
to attain efficiency and competitiveness in both its internal as well as its external information
supply chains (Johnston and Vitale, 1998; Nicolaou, 2008; Patnayakuni et al., 2006). ERPS
1 Benaroch (2002) distinguishes between two classes of real IT options: operating options that allow to flexibly
change investment configuration features (timing, scale, scope, etc.), and strategic growth options that spawn
new investment opportunities.
3
also spawn additional investments in complementary organizational resources such as
business process (re)design, work flow, and other IT-related complementarities (Melville et
al., 2004).
Second, the resulting information infrastructure from the initial ERPS implementation
can, in turn, enhance organizational capabilities and yield a number of new ERPS-related
operating options, such as the option to defer, the option to change scale, the option to switch
use, the option to abandon or the option to stage. Nicolaou and Bhattacharya (2006) have
classified post-implementation system changes as modular additions, upgrades,
abandonments, and switches. They find that system enhancements increase (reduce) the
potential for gains (losses) on the base project. Further, Nicolaou (2008) suggests that
embedding operating options in ERPS, enhancements in particular, can contribute to the
investment value by enhancing the flexibility for further deployment of ERPS and/or add-on
applications.2 System enhancements can take the form of either modular additions to the
original implementation or upgrades that occur as a result of vendor-supported version
changes3. Our examination therefore focuses on system adoption and system enhancements in
the long-term use of ERPS.
In this study we develop cross-sectional models that examine the optimal exercise of
these ERPS-related options. We track firms announcing initial ERPS implementation
decisions during the 1989–1998 period, and also examine their system enhancement choices
for a 10-year post adoption period (till 2008). Since companies actively manage ERPS-
related options to enhance the investment value throughout the investment life-cycle (e.g.,
2 Prior research also suggests that system enhancement options provide organizations with the flexibility to alter
or expand the initially planned application capabilities, thereby increasing investment payoffs (Benaroch, 2002;
Benaroch et al., 2006; Taudes et al., 2000). 3 Two other ERPS-related operating options, system switchings and system abandonments, are not included in
our examination because they are both rare and less publicized. Those decisions typically involve prior
implementation failure or significant prior implementation difficulties (Nicolaou and Bhattacharya 2006; 2008).

4
Nicolaou and Bhattacharya 2006; Nicolaou 2008),4 we model ERPS adoption decisions and
subsequent enhancement choices as two separate and distinct, yet related, decisions on the
exercise of real operating options in a continuous implementation process. This approach
represents a departure from Benaroch et al. (2006), who examine various option types (defer,
pilot, prototype, stage, abandon, contract, and outsource) presented in different IT projects
from a single organization. In contrast, we examine the adoption and enhancement options
specifically related to an ERPS investment. Because investments in ERPS are expensive and
irreversible, a question of interest relates to differences in the economic determinants driving
ERPS adoption choices. Furthermore, because ERPS are modular and implemented over the
long term, we also examine how such choices at the adoption stage affect subsequent system
enhancement events.
We develop predictions and test determinants of ERP adoption decisions. We expect
that adoption of ERPS will be positively associated with increased demand for competitive
flexibility and growth opportunities. Consistent with our expectation, we find that ERPS
adopting firms are more likely to operate in highly concentrated industries, be industry
leaders, and have lower investment opportunities and higher free cash flows than non-
adopters. These findings suggest that ERPS adoption events embed future growth options
leading to competitive advantage by creating barriers of entry and providing the flexibility
needed to adapt to new growth opportunities, and are also consistent with past related
findings (e.g., Nicolaou, 2004b, 2008; Subramani 2004).
Further, and consistent with the modular nature of ERPS, we also find that the
financial performance effect of the initial ERPS implementation combined with the use of
high-quality post-implementation review (PIR hereafter) activities, as posited by Nicolaou
4 Surveys show that ERPS implementations differ from other IT projects in that they are not single events
(Faleti, 2001; Willis and Willis-Brown, 2002). Research also shows that the degree to which an ERPS
implementation is successful is moderated by various factors or decision choices during the ERPS
implementation process (Nicolaou, 2004a, b; Nicolaou and Bhattacharya, 2006, 2008; Ranganathan and Brown,
2006).
5
(2004a) and further validated by Nicolaou and Bhattacharya (2008), significantly increase the
probability of subsequent system enhancements. System enhancement options tend to be
exercised during the medium-term of the ERPS implementation period (3 to 5 years post-
adoption), and follow positive initial performance outcomes. These improvements in
performance are found to be associated with firms which follow such well-planned PIR
practices as project planning, strategy, and process integration. As a result, the value-
generating effect of ERPS adoption is contingent on high-quality PIR practices, ex-post.
These findings suggest that the implementation and use of ERPS enhances financial
flexibility and organizational capabilities which, in turn, enable management to optimally
reconfigure the investment in ERPS using various operational options. Our findings also lend
support to the argument that proactively embedding flexibility into risky IT investments is
value maximizing (Amran and Kulatilaka, 1999; Benaroch, 2002; Benaroch et al., 2006).
Overall, our findings suggest that some firms, as a consequence of their innate
characteristics, are a priori more prone to invest in ERP systems, and more capable of
building future flexibility into such investments. Their subsequent actions, modeled as
exercises of system enhancement options, further their lead vis-à-vis their peers. Our
evidence is consistent with economic determinants of differences in ERPS investments, and
with the real options perspective which suggests that proactively embedding options
(flexibility) into risky IT investments can add relative long term value (Amran and Kulatilaka
1999; Benaroch 2002; Benaroch et al. 2006).
The remainder of the paper is organized as follows. Section II reviews literature on
factors affecting the implementation of ERPS, and develops the research hypotheses for this
study. Section III develops cross-sectional models for the optimal exercise of ERPS-related
operating options as two separate but related decisions. Section IV presents our empirical
findings and Section V concludes the study.

6
II. BACKGROUND AND HYPOTHESES DEVELOPMENT
The theory of irreversible investments suggests that if risk-neutral firms cannot
dispose of installed capital, uncertainty regarding demand or competition reduces current
investments due to high switching costs (e.g., Arrow, 1968). In this approach toward risk, the
internal rate of return and discounted cash flow (DCF) of initially projected values constitute
the preferred methods to evaluate the efficacy of long-term investments (Graham and Harvey
2001). However, these methods do not consider any value due to the flexibility of
management to alter the scope or enhance a project as it progresses. Real options exist in the
long-term implementation of ERPS, regardless of whether their value is realized and
incorporated in decision making. An irreversible investment, such as an ERPS project,
creates real options because it offers the flexibility of changing such investment configuration
features as postponing the project, changing its scale, or staging implementation so as to
partially dispel uncertainty via new information.
The exercise of ERPS real options is costly to the firm and should be carefully
planned (e.g., Nicolaou 2004a, Nicolaou and Bhattacharya 2008). Viewing each ERPS
project as a portfolio of real options, we empirically examine managerial decisions related to
the growth and operational options in ERPS investments. We argue below that ERP-related
real options may have different implications for firms with varying characteristics of
competition, market power, financial flexibility, and system implementation practices. We
then perform an empirical analysis of these features using longitudinal firm-level data.
Guiso and Parigi (1999) suggest that the effect of uncertainty on an irreversible
investment varies by the degree of competition in the product market. We expect firms with
substantial market power to be more likely to adopt ERPS for purely strategic advantages,
continuing to act as market leaders and embracing new opportunities for growth. Investments

7
in ERPS can present follow-up growth opportunities as ERPS entail future initiatives that
enhance a firm‘s strategic agility and competitive flexibility or innovativeness (Sambamurthy
et. al., 2003). Research shows that intensive investment in technology reflects a firm‘s efforts
to differentiate itself and mitigate competition from new entrants and existing competitors
(Kamien and Schwartz, 1975). One interpretation is that high IT investment intensity could
imply high monetary and technical barriers to entry and lower competition from the industry
to which a firm belongs. This suggests a potential for the firm to earn economic rents. In
other words, industries with lower competition enjoy greater entrance barrier benefits by
investing in ERPS. Conversely, the materialization of competitive risks can result in project
abandonments, i.e., the killing off of an investment and the redirecting its resources to
alternate uses (Clemons and Weber, 1990).
A second interpretation of the theory of irreversible investments as it relates to ERPS
may be that leaders in an industry have greater incentives to invest in technology than
followers in order to enhance and cement their leadership in the market.5 If the investments in
ERPS pay off, then a leader can keep or increase its current market share in the future. Prior
literature examining IT capability suggests that leaders in IT enjoy strategic benefits from
increased organizational capabilities and long-lasting operational efficiencies (Bharadwaj,
2000; Clemons and Row, 1991; Mata et al, 1995).6
5 This argument contrasts but is not contrary to the view of Arrow (1962), who suggests that, on average,
incumbents have lower incentives to invest in technology (i.e., R&D) than outsiders due to lower entry
pressures. We argue that difference exists between industry leaders and followers due to leaders‘ quests for
staying one step ahead of the competition. 6 For example, Intel has successfully implemented an ERPS environment that is based on industry-standard
servers and supports more than 10,000 active users. Intel‘s competitor strategy is to remain innovative and
always a step ahead of the competition. It created the ―Intel Inside®‖ brand that is the symbol of quality and it
has formed an alliance with Microsoft to complement its product offerings. It realized early on that increased
demand for faster chips would not come about from software advancements alone; and that a needed push could
come from video. As a result, Intel has also created alliances with other software providers to create virtual
reality video games and with telecommunication providers to increase the capacity of fiber optic networks over
which data is transmitted. Its focal alliance with Microsoft has thus been greatly complemented by these other
alliances, as they have not only pushed up the demand for faster chips but also for new software applications
that take advantage of superfast processing cycles (Brandenburger and Nalebuff, 1996; see also Intel‘s 2009
White Paper on information technology, ―Deploying ERP on Cost-effective Industry-standard Servers‖,
available at http://download.intel.com/it/pdf/321373.pdf).

8
Prior literature also indicates that system enhancements (e.g., upgrades and add-ons)
that are carried out in a timely manner might also help an organization differentiate itself
from competitors and gain higher differential returns (Kremers and Van Dissel, 2000, p.56).
Kremers and Van Dissel (2000) suggest that the choice of an enhancement is more likely to
be a contingent corrective action in response to observed conditions. It is possible that firms
exercise enhancement choices in response to unexpected increases in demand (Benaroch
2002).
Based on the above, we expect that the degree of competition in a firm‘s industry and
the strength of the firm‘s market power affect both the initial ERPS adoption and its
subsequent enhancement decisions. We, therefore, state our first set of hypotheses in the
alternative form as follows:
H1a: Ceteris paribus, the exercise of the option to adopt ERPS is negatively related to
the degree of competition in a firm’s industry and positively related to the strength of the
firm’s market power.
H1b: Ceteris paribus, the exercise of the option to enhance ERPS is negatively related
to the degree of competition in a firm’s industry and positively related to the strength of the
firm’s market power.
Since ERP systems are modular and implemented over the long term, we expect the
performance effects of the initial ERPS adoption along with various project implementation
factors to further affect post-implementation enhancement choices. For example, Nicolaou
(2004b) reports that expected benefits of ERPS implementation are clustered into improved
productivity and decision making, external integration, and internal integration/improved
customer service. In the same vein, Subramani (2004) suggests that collaborative support
capabilities offered by ERPS can help level the competitive field in a firm‘s environment. In
Seddon et al.‘s (2010) model on organizational benefits, the more immediate benefits from
implementing systems that match needs and are accepted by users, translate into successful
business improvement projects, similar to our conceptualization of system enhancements.
Nicolaou (2008) argues that the use of ERPS can ease inter-firm tensions and facilitate a

9
firm‘s potential to enhance performance via strategic alliances. Recent evidence from supply
chain logistics relationships suggests that active balancing, rather than entirely competitive or
cooperative stances, positively impact strategic information flows through customized IT,
promote mutual trust, and enhance performance (Klein et al., 2007). Prior research, thus, has
successfully demonstrated that the adoption and use of ERPS has a potentially significant
influence on the adopting firm‘s financial performance outcomes (Hunton et al., 2003;
Nicolaou, 2004b; Poston and Grabski, 2001).
However, as mentioned above, we cannot expect all ERPS to have the same value
potential due to implementation variations that influence the integration potential and thus the
option value of the initial ERP investment (Nicolaou, 2004b; Ranganathan and Brown, 2006;
Seddon et al. 2010). For example, Ranganathan and Brown (2006) report that the choice of
implementation site and choice of modules are two key project decisions that significantly
influence market reactions to ERPS investment announcements. Nicolaou (2004b) suggests
vendor choice, implementation goal, module choice, and length of implementation to be
moderators of attained performance effects of ERPS use. Seddon et al. (2010) argue that
functional fit, or the extent to which functional capabilities of the system match
organizational needs, is a major component of a project‘s on-going improvement and affects
realized benefits.
Firms adopting ERP systems are likely to scale up their subsequent development
efforts or operations if post-implementation reviews suggest both tangible and intangible
benefits associated with the adoption and use of these systems. On the other hand, an
expansion budget is likely to not be approved if reviews suggest that these systems have not
been well-integrated, have not been well-accepted within the organization, or have not been
able to improve profitability or lower personnel, inventories, or systems maintenance costs to
the extent anticipated. Therefore, we expect the extent to which the decision to use ERPS

10
―matches‖ the organization‘s needs and generates positive returns to affect subsequent
enhancement decisions. We state this in our second hypothesis in the alternative form as
follows:
H2: Ceteris paribus, the exercise of the option to enhance ERPS is positively related
to the extent to which the decision to use ERPS “matches” the organization’s initial needs
and the satisfying of its short-term post-implementation goals.
Prior research (Brown and Vessey, 2003; Nicolaou 2004a; Ragowsky et al., 2005) has
examined the need for and the manner in which ERPS adopting firms plan and conduct PIR
activities in order to maximize the benefits derived from ERPS implementations. Based on
the Nicolaou (2004a) framework of PIR quality and its role in affecting ERPS performance
outcomes, we also examine the association between high-quality PIR practices and post-
implementation enhancements in companies that implement ERP systems. We expect high-
quality PIR activities to increase the probability of subsequent enhancement choices for two
primary reasons. First, high-quality PIRs act as moderators of attained performance effects
(Nicolaou, 2004b), especially as they relate to the occurrence of system implementation
planning and business process effectiveness activities (Nicolaou and Bhattacharya, 2008).
Second, Benaroch (2002) argues that since real options are not inherent in IT
investments, they must be planned and intentionally embedded in a target IT investment so as
to enable a beneficial configuration. Flexibilities can often be built by pursuing such risk
countermeasures as over-engineering, information hiding designs, fault tolerant architectures,
competitive designs, paired programming, cross training of IT personnel, more room for
verification and validation, resource reservation and over-staffing. From this perspective, a
primary goal of the PIR is to formulate a set of conditions that would enable an organization
to build an adequate information infrastructure based on the ERP systems functionality.
Further, an organization that follows a well-planned, high-quality PIR process would also be
expected to expand on the basic ERP infrastructure and create opportunities for sustainable

11
future growth beyond any initial benefits that are anticipated. Therefore, it follows that firms
that adopt high-quality PIR practices would be able to exercise a number of operating options
during the PIR period, as well as be able to identify and assess in advance a planned set of
growth options. We state this in our third hypothesis in the alternative form as follows:
H3: Ceteris paribus, the exercise of the option to enhance ERPS is positively related
to high-quality PIR practices conducted by an organization.
Finally, we consider the optimal timing of systems transformation during the post-
implementation period. Discrete changes may occur over several periods beyond the initial
implementation and the timing of the option exercise may affect the returns that accrue to the
option holder. The timing of system transformation is, therefore, a strategic choice as the
changes are expected to help surface implementation issues that affect subsequent use of and
success from the use of ERP systems (Nicolaou and Bhattacharya, 2006). Prior research on
the performance effect of ERPS suggests that late enhancements are more likely to signify
that necessary adjustments to the system were not performed in a timely manner, which, in
turn, may be indicative of less than optimal control by the firm over its ERP processes. This
would be expected to result in performance deterioration (Kremer and Van Dissel, 2000). In
contrast, according to Nicolaou and Bhattacharya (2006), firms that initiate early
enhancements in the form of either add-ons or upgrades, enjoy superior differential financial
performance in comparison to other ERP-adopting firms‘ differential performance (Nicolaou
and Bhattacharya, 2006).
Nicolaou and Bhattacharya (2006) define ―early‖ as the year of systems completion
and the year immediately following system completion. As most firms typically spend two to
five years on their ERP implementation efforts following the initial adoption (e.g., Nicolaou,
2004b), we consider an early exercise to occur within five years of the year of initial ERPS
adoption. Based on the above discussion, we expect the early exercise of enhancement

12
options to have a valuable beneficial implication for ERP systems transformations. We state
this in our fourth hypothesis in the alternative form as follows:
H4: Ceteris paribus, the exercise of the option to enhance ERPS is more likely to
occur during the early to medium term following the initial adoption.
III. RESEARCH METHOD
Sample
We use the original Nicolaou (2004b) data set to identify an initial sample of 247
firms announcing an ERP implementation from 1989 to 1998. The disclosed year of inception
is coded as ―t0‖ to indicate the year of adoption. For the 247 ERP-adopting firms, we search
the Lexis/Nexis database for post-ERP implementation enhancements using upgrade and add-
on as search terms for the 10-year period post adoption (till 2008).7 As discussed earlier,
while add-ons to ERP systems typically take the form of modular additions to the original
implementation, upgrades occur as a result of vendor supported version changes.
Enhancements may also occur when other-vendor add-ons embellish systems. While these
add-ons are not original vendor supported, they typically improve the ERPS‘ functionality in
customer-specific ways.
For each of these 247 firms, we also used the company name and the term ERP or
enterprise resource planning to search for announcements that relate to post-implementation
review (PIR) activities. We used the initial adoption year as the base year and conducted a
search for 10 years beyond that date (for details on this sample selection effort, refer to
Nicolaou and Bhattacharya, 2008). We read each one of the announcements and coded the
7 We also searched for abandonments and switches. However, we found abandonments and switches more
difficult to trace—with the former being several degrees more difficult than the latter. This situation arose
because both ERP vendors and their customers have vested interests in minimizing publicity related to ERP
abandonments. While switches are not as stigmatizing as pure-play abandonments, they are, nevertheless, often
viewed as precursors and predictors of unfavorable ERPS-related events. Hence, these were also relatively more
difficult to surface when compared to the more favorable enhancement and upgrade criteria. Eventually, we
identified 182 discrete changes with the breakdown of 148 add-ons, 15 upgrades, 11 switches and 8
abandonments. Only a few switches and abandonments remain in our sample after imposing the data
requirement described later. Therefore, we restrict our analysis to only upgrades and add-ons.

13
information using the 14 PIR activities reported in the Nicolaou (2004b) PIR-Quality
framework (see Table 1). A binary code was used wherein a ―1‖ indicated the presence of a
high-quality activity in a specific firm prior to and during the year of the enhancement and
―0‖ indicated the absence thereof. We identified 79 ERPS-adopting companies that reported
use of some PIR activities. In total, these 79 firms were found to have carried out a total of
171 high-quality PIR activities. The most frequently used activities included process
integration (n = 33), project planning and attainment of benefits (n = 26 each), infrastructure
and strategy (n = 20 each), and others with relatively lower frequencies.
We require the adopting firms to have the necessary financial statement variables
available from Compustat. We retain 181 firms with required data for the year before
adoption, year of adoption, and/or a minimum of three years following the adoption. To
conduct the initial adoption test, we match each adoption firm with all non-adopting firms
within the same two-digit SIC industry with sufficient data on COMPUSTAT at the year
preceding the ERPS adoption year. We identify non-adopting firms as those without
disclosures about ERPS adoptions based on our search of the Lexis/Nexis Newswires, Global
Disclosure database, and websites of major ERP vendors, as described in Nicolaou 2004b.
The above procedures yielded a control group of 20,168 non-adopting firms matching the 181
adopters in the final sample.
The sample for the system enhancement options tests also includes the 181 ERPS
adopting firms, across the 10 years we used as the relevant post-implementation period for
system enhancements and PIR activities. This resulted in 1,415 firm-year observations. The
final number of observations (firm-years) is not an exact multiple of the 10 years due to
higher frequency of missing data beyond the three year post-adoption requirement we
imposed for the adoption test. The 181 firms finally included in the sample had exhibited a

14
total of 34 unique firm-year enhancement events. Panel A of Table 1 summarizes the sample
selection, while Panel B presents the distribution of our sample firms by industry.
<Insert Tables 1 and 2 about here>
Research Model for the ERPS Initial Adoption Decision
We assume the ERP systems adoption decision to be characterized in the following
form:
ADOPTt = f (Industry competitivenesst-1; Market powert-1; Firm sizet-1; Profitabilityt-1;
Investment opportunity sett-1; Cash flowt-1; Leveraget-1; Riskt-1; Years;
Industries) (1)
where, period t is the year of initial ERPS implementation and all variables are defined as of
the beginning of the ERPS adoption year unless otherwise specified.
The research model in Eq. (1) allows us to assess whether, in the cross-section, there
is an association between demand conditions (industry competitiveness and market power)
and ERPS adoption decisions (ADOPT) while also controlling for other factors that were
previously shown to influence managers‘ investment decisions. This model addresses the
predictions made in research hypothesis H1a. To conduct this analysis, we use the group of
181 ERPS adopting firms and the matched group of control firms, as described in our sample
selection procedures and shown in Table 2.
Table 3 describes in detail how each of the variables in Eq. (1) is measured. We use
the Herfindahl index to measure the competitiveness of an industry (Tirole 1988). This is
defined as the sum of the squares of the market shares of each individual firm in an industry.
Decreases in the Herfindahl index generally indicate an increase in competition, whereas
increases imply the opposite (Tirole, 1988). We use market share to measure the
concentration of market power (i.e., the ability of a market participant to manipulate prices),
although the limitations of market shares as proxy of market power are widely acknowledged
(see Boulding and Staelin, 1990). We expect both measures to be positively associated with

15
the probability of an ERPS adoption as the expected investment value of such a potential
growth option is likely to be greater for firms with substantial market power.
We control for other factors affecting firms‘ incentives and ability to conduct a long-
term large IT investment. We include firm size (logarithm of the market value of equity) and
profitability (ROA), as smaller and less profitable firms have more volatile earnings and cash
flows and thus greater uncertainty about their ability to fully fund the investment (see
Benaroch, 2002). We also control for the effects of investment opportunity sets and the free
cash flow problem on ERPS adoption decisions. Our primary proxy for expected investment
opportunities is the market-to-book ratio (a rough proxy for Tobin‘s Q), calculated as the
ratio of the market value of total assets to the book value of total assets (Fama and French,
2002). Prior research suggests that Q has a small, but significant positive effect on company
investment (Blundell et al., 1992). We use sales growth as an additional proxy for expected
investment.
The free cash flow hypothesis (Jensen, 1986) suggests that managers in firms with
high cash flow and low investment opportunities tend to waste free cash flow (the excess of
cash earnings over growth opportunities) on perquisites and bad investments (e.g., takeovers,
leveraged buyouts). Firms that have the free cash flow problem have greater incentives to
adopt ERPS as they have more need for the elimination of inefficiencies in an effort to
mitigate agency concerns and to adapt to new opportunities. Following Lang et al. (1991), we
measure the free cash flow problem as the three-year average of operating cash flow less
common and preferred dividends, scaled by total assets, if the firm has a book-to-market
assets ratio greater than one (a proxy for low growth opportunities), and zero otherwise. We
also consider the components of cash flows, cash flow from operations and net external
financing (e.g., Lang et al., 1996; Bradshaw et al., 2006). We calculate cash flow from
operations as earnings before depreciation minus working capital accruals scaled by average

16
assets (Bushman et al., 2008). We calculate net external financing as the sum of net equity
financing and net debt financing scaled by average assets (Bradshaw et al., 2006).
We also consider leverage and firm idiosyncratic risk as additional risk factors
affecting ERPS adoption. The association between leverage and investments is less clear as
financial leverage creates incentives for managers to assume excessively risky projects on
behalf of shareholders ex post after the debt has been sold (Harris and Raviv, 1991; Leland,
1998), while high leverage reduces a firm‘s ability to finance growth through a liquidity
effect (e.g., Myers, 1977). Idiosyncratic return variance is used as an alternative proxy for
uncertainty in the uncertainty-investments association literature (e.g., Leahy and Whited,
1996). However, this returns-based measure tends to be noisy as it essentially captures all
relevant source of risk (e.g., Guiso and Parigi, 1999). We measure a firm‘s idiosyncratic risk
as the standard deviation of residuals from a regression of its daily excess stock returns (i.e.,
raw returns less the riskless rate) on the market factor (i.e. the value-weighted market return
less the riskless rate).
Research Model for the ERP System Enhancement Decision
We assume the ERP systems post-implementation system enhancement decision to be
characterized in the following form:
ENHANCE t+i (i=1,…..,10) = f (∆Industry competitivenesst-1, t+i-1; ∆Market powert-1, t+i-1; System
matcht; Initial performancet,t+1; High-quality PIRt, t+i; Earlyt+i; Mediumt+i; Firm
sizet+i-1; Investment opportunity sett+i-1; Cash shortaget+i-1; Losst+i-1; Years;
Industries) (2)
Eq. (2) models the determinants of adopters‘ enhancement decisions over a 10-year
period after initial adoption. The determinants in Eq. (2) are primarily motivated by prior
studies of the performance outcome and the effective operation of post-adoption ERPS (e.g.,
Nicolaou, 2004a, b; Nicolaou and Bhattacharya, 2006, 2008). As posited in research

17
hypothesis H1b, these early-stage implementation factors are central to the ability to
optimally reconfigure an ERP investment using a follow-up enhancement option.
We predict that the exercise of the option to enhance ERPS is positively associated
with the extent to which a firm attained the benefits it sought to accomplish with ERPS
adoption. Nicolaou (2004b) has shown that these performance benefits typically accrue to
ERP-adopting firms within approximately two years from the date of original rollout.
CosgroveWare (2003) also suggests that while most adopting firms do not realize the
anticipated benefits within the first year of implementation, they do begin to reap these
benefits from the second year on. Therefore, we use the initial performance (average ROA)
during the year of and the year immediately after the initial ERPS adoption to measure the
immediate after-effects of ERP implementations (see table 5 for a detailed description of how
all variables in Eq. (2) are measured; the variables are defined as of beginning of the change
year unless otherwise mentioned).
In research hypothesis H2, we predict that the option to enhance ERPS will be
positively related with the extent to which the system ‗matches‘ needs and satisfies post-
implementation goals. It might be the case, however, that ERPS adoption and use are
endogenous choices, with the net benefits varying with the extent to which the initially
planned ERPS implementation ―matches‖ the organization‘s needs. Our sample used to
estimate ERPS enhancement probabilities is censored since only firms adopting ERPS are
observed to exercise their options to expand. Heckman (1979) has shown that censored
samples can lead to biased estimates, if, in our example, the sample selection rule is
correlated with the errors in the enhancement probability equation. In our case, it is possible
that a firm is likely to not implement new ERP options if there is a mismatch between the
initial ERPS adoption and the firm‘s innate characteristics. We assume that the estimated
probability for adoption from Eq. (1) represents the extent to which the initial adoption is a

18
good match for the company. We control for the difference between match and mismatch
firms by including an indicator variable for firms that show a match between ERPS use and
fundamental characteristics (i.e., firms with the estimated probability from Eq. (1) greater
than the mean estimated probability of adoption) in Eq. (2).8 This determinant in the model
addresses our research hypothesis H2.
Following Nicolaou‘s (2004a) framework of PIR quality (empirically examined in
Nicolaou and Bhattacharya 2008), we predict that well-planned high-quality PIR activities
will also be positively associated with the presence of an enhancement option. The Nicolaou
(2004b) model proposes 14 different PIR activities, as shown in table 1. Nicolaou and
Bhattacharya (2008) show that differences in the nature of PIR are associated with the
performance effect of ERPS. Specifically, ERPS firms demonstrate improved differential
performance due to the use of post-implementation activities that relate to project planning,
strategy, and process integration shortly after implementation of the ERPS. In contrast,
system deployment-related post implementation activities (these typically occur at later
stages) appear to have deteriorating performance effects. Therefore, we use an indicator
variable for high-quality PIR equaling to one if the firm has project planning, strategy, and
process integration related PIR practices prior to the enhancement event, and 0 otherwise.9
In order to test research hypothesis H4, we also examine the timing of the ERPS
enhancement decisions by including two time indicator variables. Early term equals one if the
system enhancement occurs shortly after the initial system implementation (i.e., years 1 and
2), and 0 otherwise. Medium term equals one if the system enhancement occurs during the
medium ERPS implementation period (years 3-5), and 0 otherwise.
8 We note that in our case the standard Heckman procedure is not applicable to address the selection issue since
the structure exposed to potential sample selection bias has a qualitative dependent variable (Boyes et al. 1989;
Greene 2002). 9 We also consider the possibility that use of PIR activities and system enhancement could be endogenous
events; however, results from the Hausman‘s (1978) test for exogeneity failed to reject the null, thus allowing us
to validly test this hypothesis. We do test for this possibility, nevertheless, in our statistical analysis.

19
Changes in industry competitiveness and market power (rather than their levels) are
included in Eq. (2) to proxy for any change in demand and competition since the launching of
the ERPS platform. Positive coefficients on these two variables are consistent with firms
exercising enhancement choices in response to unexpected increases in demand (Benaroch
2002).
We also control for the effect of firm fundamental characteristics on ERPS
enhancement decisions as these characteristics may proxy for a firm‘s inherent ability to
realize an enhancement opportunity. We predict that the decision to exercise an enhancement
option is positively associated with firm size and growth opportunities as both suggest
flexibility in creating capabilities and opportunities for follow-up investments.10
Further, we
predict the enhancement choice to be negatively associated with the degree of cash
constraints. Fazzari et al. (1987) suggest that investment can be excessively sensitive to
contractions in cash flow for financially constrained firms. Following prior research (e.g.,
Core and Guay, 1999), we measure the degree of cash flow shortfall as the three-year average
of common and preferred dividends plus cash flow used in investing activities less cash flow
from operations divided by total assets. In addition, Joos and Plesko (2004) suggest that
persistent losses typically contain large negative cash flow. We also use an indicator variable
equal to one if the firm reports a loss in any of the previous three years, and zero otherwise.
For both Eq. (1) and Eq. (2), we include year dummy variables for each sample year
and industry dummy variables for each two-digit industry that has at least 100 observations
and estimate logistic regressions with standard errors clustering by firm.
10
We measure firm size with log (sales) as annual sales may arguably be a less noisy measure than market
value, to proxy for the operation scale of the firm.

20
IV. RESULTS
The Decision to Adopt ERPS
Table 3 presents descriptive statistics for the variables in Eq. (1) for our ERPS
adopting firms compared to matched non-adopting firms. Panel A also reports test statistics
of the differences in means and medians for each of the variables under two-tailed t-tests and
Wilcoxon rank sum tests, respectively. Combined, the number of observations for all
variables except sales growth (GROWTH), idiosyncratic risk (RISK), net external financing
(EXT_FIN), and cash flow from operations (CFO_OP) is 20,349; and the number of
observations for GROWTH, RISK, EXT_FIN, and CFO_OP is 12,622. Panels A and B
present the distributional properties of our measures of industry competitiveness, market
power, and fundamental characteristics for adopting and non-adopting firms, respectively. In
addition, we report the test statistics for mean and median differences between the two
samples in Panel A.
The means and medians of the industry Herfindahl Index (HERFINDAHL) suggest
similar industry distribution between adopters and non-adopters. The mean (median) values
of market share (MKT_SHR) for the adopting sample and the non-adopting sample are 1.2
percent and 0.3 percent (0.3 percent and 0 percent), respectively. The differences of both the
mean and median MKT_SHR are statistically different from zero (two-tailed p-values
significant at 1 percent or better), consistent with our expectation.
Panel A also reveals that, on average, ERPS adopters tend to be larger, more
profitable, have lower idiosyncratic risk (RISK), and face fewer growth opportunities
(suggested by the lower market-to-book-asset (MB) ratio and sales growth (GROWTH)),
compared to their industry peers. These companies are also more likely to have the free-cash-
flow problem, as captured by both higher FREE_CFP and higher operating cash flow
(CFO_OP). On the other hand, the finding that ERPS-related options are less likely to be

21
available for smaller and less profitable firms is consistent with high monetary risk involved
in ERPS implementation (Benaroch, 2002). It is vital to control for these innate firm
characteristics in our multivariate tests as such characteristics may have a direct effect on the
adoption decisions.
Panel C reports the correlations among variables, with the Pearson (Spearman)
correlations on the upper (lower) diagonal. We discuss the Pearson correlations, but note that
the Spearman rank-order correlations are consistent with the Pearson results. Consistent with
our research expectations, the ADOPT indicator variable is positively correlated with
MKT_SHR, FIRM_SIZE, PROFITABILITY, FREE_CFP, and CFO_OP, and negatively
correlated with MB and RISK (two-tailed p-values significant at 1 percent or better). We note
that several independent variables have relatively large correlations, in particular those
correlations with FREE_CFP (its largest correlation coefficient being 0.784, with
PROFITABILITY). Despite the large correlations among those independent variables, the
highest variable inflation factor (based on OLS) for the control variables used in the
multivariate regression is 1.64, suggesting that multicollinearity is not a problem.
<Insert Table 3 about here>
To examine whether the above-mentioned variables affect the ERPS adoption
decisions, we report the results from several logistic regression tests using Eq. (1) in Table 4.
We cluster standard errors by firm and include year and industry indicators. The three
columns on the left present the estimations for the full sample of 20,349 observations,
including either PROFITABILITY, FREE_CFP, or both. The probit model for the adoption
decision has significant explanatory power (p-value < 0.001), with pseudo-R-squared values
ranging from 9.2 to 9.5 percent. Consistent with H1a, the coefficients on HERFINDAHL and
MKT_SHR are consistently positive and highly significant (two-tailed p values significant at
1 percent or better) after controlling for other firm-level characteristics. This indicates that the

22
probability of adoption is negatively related to the degree of competition in a firm‘s industry
and positively related to the strength of the firm‘s market power. This finding suggests that
the expected investment values of ERPS growth options (e.g., entrance barrier and
competitive advantage) could be greater for firms with substantial market power. The result is
also consistent with ERPS providing new opportunities for future initiatives that enhance a
firm‘s strategic agility, competitive flexibility, and innovativeness (Bharadwaj, 2000;
Clemons and Row, 1991; Mata et al, 1995; Sambamurthy et al., 2003).
Among the control variables, we find that the likelihood of adoption is positively
associated with larger firms, firms that have higher profit levels, higher market-to-book ratio,
and more excess cash, consistent with these innate fundamental characteristics having direct
effects on firms‘ adoption decisions (two-tailed p values significant at 5 percent or better).
These multivariate results are consistent with the univariate results reported in Table 3. In
addition, the coefficients on PROFITABILITY and FREE_CFP are positive and significant
(two-tailed p values significant at 1 percent or better) when either variable is included in Eq.
(1) (i.e., Model 1 and Model 2, respectively). However, the coefficient on FREE_CFP is not
statistically different from zero when both variables are included (Model 3), suggesting
excess cash can be viewed as a proxy for profitability, rather than a proxy for agency issues.
The last column presents the estimations for the reduced sample of 12,622 observations with
GROWTH, RISK, EXT_FIN, and CFO_OP included. Only the coefficient on EXT_FIN is
positively significant (although there is a small improvement in pseudo-R2), suggesting the
addition of these variables might not improve the explanatory power of models. Therefore,
we calculate the predicted probability of ERPS adoption using the coefficients in Model 1.
<Insert Table 4 about here>
Summarizing, our findings suggest that firms establish a new growth option by
adopting ERPS in an effort to differentiate themselves, create barriers of entry, and obtain

23
sustainable competitive advantage (e.g., Benaroch 2002; Sambamurthy et al. 2003).
However, some firms may not adopt ERPS due to a lack of ability to fully fund such long-
term irreversible investments. Our findings are consistent with industry and professional
surveys, which show that the basic drivers motivating adoption of ERPS include cost
reduction, improved efficiency, reduced product cycle time, improved customer service and
satisfaction, the ability to change and configure business in response to changing market
place, as well as the enabling of e-commerce (Attaway, 1999; Glover et al., 1999).
The Decision to Exercise the Enhancement Option
Table 4 presents descriptive statistics on the variables included in Eq. (2), as well as a
correlation matrix of the explanatory variables. Panel A of table 4 presents descriptive
statistics for 34 instances of system enhancements announced by 30 ERPS adopting firms
over the 10-year time period following adoption. For comparison, in Panel B, we present
1,318 firm-years for all adopters (firm-years) that did not report an enhancement choice and
have necessary data for analysis. In panel A, we also report differences in means and medians
for each of the variables using both two-tailed t-tests and Wilcoxon rank sum tests. As shown
earlier in table 2, the total number of observations available for the second stage analysis is
1,415.
As previously discussed, research hypothesis H2 is tested by using the predicted
probability of adoption from the estimation of Eq. (1) (based on model 1 in Table 4) to
measure the extent to which the initially planned ERPS implementation ―matches‖ the
organization‘s needs. We create an indicator variable (PROB_ADOPT) which takes the value
of 1 if the firm‘s estimated probability of adoption is greater than the mean estimated
probability of all firms in the sample. As we argued in research hypothesis H2, we expect this
variable to be significantly positively associated with the probability of new enhancement
choices among adopters in our second stage analysis (Eq. (2)).

24
Consistent with H2, the predicted probability of adoption (as captured by
PROB_ADOPT) is greater for adopters that exercised an enhancement option during the
post-implementation period than for adopters that did not exercise an enhancement option
(0.324 versus 0.141; two-tailed p<.01). The average initial post-adoption performance
(INIT_PERF -- measured by average ROA) for firms with system enhancements is 18.1
percent. The mean of INIT_PERF for the control group is significantly smaller at 14 percent.
These univariate results provide some support for the conjecture that system enhancement
firms are more likely to enjoy immediate benefits from initial ERPS implementation possibly
because their initial adoptions better match these firms‘ needs and innate characteristics.
Moreover, firms with enhancements had a higher mean PIR score than the control sample
(61.8 percent versus 2.1 percent; two-tailed p<.01). These findings provide some initial
support for H3. Further, enhancements tend to occur during the medium term of the ERPS
implementation period (47.1 percent), rather than during the early term (17.6 percent), which
is slightly different from the more even distribution of the control sample over time (32.3
versus 25.3 percent), providing partial support for H4.
However, differences between the means and medians of ∆HERFINDAHL and
∆MKT_SHR are not statistically significantly different from zero, providing no evidence to
support H1b. Turning to other fundamental characteristics, the average SALES is
significantly higher for system enhancement firms, and their average MB ratio is also higher,
but is only marginally significant, suggesting that differential operation scale and investment
opportunities are likely to exist between enhancement adopters and non-enhancement
adopters.
Turning to Panel C, which presents the Pearson and Spearman correlation matrix
among the variables in Eq. (2), enhancements are positively related to higher probability of
initial adoption, more high-quality PIR activities, higher medium-term occurrence, larger

25
operation scale, and more investment opportunities. We also note that several correlation
coefficients among the independent variables tend to be high. PROB_ADOPT and
INIT_PERF are significantly correlated, suggesting that adopters realize expected benefits
due to a good match between organizational need and initial ERPS use; both variables are
also significantly correlated with firm fundamental characteristics (two-tailed p values
significant at 5 percent or better). Further, variable inflation factors (based on OLS) for the
control variables used in the multivariate regression are generally small mitigating the
concern for multicollinearity.
<Insert Table 5 about here>
Table 6 shows the logistic regression models which provide tests for the research
model specified in Eq. (2). The first column of Table 6 (Model 1), presents a logistic
regression of adopters‘ enhancement decisions based on Eq. (2) with standard errors
clustering by each ERP adopting firm. The model is statistically significant (p<0.01), with a
pseudo R2 of 0.419. The results regarding system related factors are consistent with the
univariate results in Table 5. In particular, we find that the coefficient on INIT_PERF is
significantly positive after controlling for fundamental factors that affect system
enhancements (two-tailed p<.01), providing strong support for H2. After controlling for
INIT_PERF and firm fundamental characteristics (the exogenous determinants of the
adoption choice), the coefficient on PROB_ADOPT is not significantly different from zero.
These findings suggest that the immediate after-effect of ERP adoption significantly affects a
firm‘s ability to optimally reconfigure an ERP investment using a follow-up enhancement
option.
Furthermore, the coefficient on PIR is also significantly positive (two-tailed p<.01),
consistent with expectation and in support of H3. This suggests that an organization that
follows a well-planned, high-quality PIR process has greater ability to optimally reconfigure
26
an ERP investment using a follow-up enhancement option. This finding is consistent with
Nicolaou (2004a) and Nicolaou and Bhattacharya (2006, 2008), which suggest that PIR
activities develop the necessary contextual conditions for an enhancement option to be
present by facilitating system implementation planning and business process effectiveness. In
particular, high-quality PIRs were demonstrated in past research to enable flexibility as
exemplified by their positive impact on financial performance (Nicolaou and Bhattacharya,
2008). Furthermore, these results provide support for Benaroch (2002), who argued that since
flexibility is not inherent in any investment, proactively embedding flexibility in risky IT
investments can add value.
In contrast, the explanatory power of fundamental factors tends to be weak compared
to system related factors. The coefficients on ∆HERFINDAHL and ∆MKT_SHR are not
significantly different from zero.11
The coefficients on EARLY and MEDIUM are also not
significantly different from zero (possibly due to model misspecification as discussed next),
providing little support for H4. Regarding firm-level characteristics, only SALES is
significantly (albeit marginally) positively associated with the probability of system
enhancement in model 1. Overall, these other variables do not provide substantial incremental
power in explaining post-adoption enhancement decisions.
Model 1 includes PIR as an independent variable to explain post-adoption
enhancement decisions. However, ERP enhancements and PIR activities could also be
endogenous choices which bias our results. Next, we use two approaches to address the
possibility that the choice of PIR could be endogenous with ERP enhancement. First, we use
a two-stage instrumental variables (IV) estimation. In the first stage, we estimate a model of
PIR on all right-hand side variables in Eq. (2) and use the estimated coefficients to obtain
predicted PIR. In the second stage, the predicted PIR from the first stage become an
11
A possible explanation for this (absence of) finding is that some enhancements may be caused by issues and
problems uncovered during the initial implementation and therefore are not strictly demand-driven (Nicolaou
and Bhattacharya, 2006).

27
additional independent variable in Eq. (2) modeling the enhancement decision. However, the
Hausman‘s (1978) test for exogeneity failed to reject the null. Therefore, we choose not to
report this analysis as the estimation under Model 1 is more efficient than the two-stage IV
estimation.
Second, since PIR activities could be a driver motivating system enhancements, we
may have two binary response variables that vary jointly. We adopt bivariate probit models to
account for the possibility of a joint distribution (Greene, 2002) and report the results in the
last two columns of Table 6 (Model 2). The estimate of rho (i.e., the correlation of the
residuals from the two models) is 0.868, suggesting that unexplained probability to perform
high-quality PIR is actually associated with higher incidences of system enhancements
among ERPS adopters (p < 0.001), and therefore the bivariate probit approach is justified.
While the tenor of the results is unchanged, there are several notable differences between the
estimation under Model 2 and the estimation previously reported based on Model 1,
suggesting that the simple logit model for enhancement decisions could be misspecified.
Model 2 shows that high-quality PIR activities typically occur over the first few years
immediately following the initial ERPS adoption, whereas a relatively longer lag is observed
for system enhancements—they are more likely to occur 3 to 5 years after the adoption (but
still within the early post-implementation period as defined by Nicolaou and Bhattacharya,
2006, 2008). This finding provides support for H4, suggesting that system enhancements
usually follow well-planned high-quality PIR activities.
Although both decisions are significantly positively associated with firm size, the
MB-ratio is only significantly associated with PIR activities. This seems to imply that
companies can better manage beneficial opportunities by adopting high-quality PIR practices
that relate to project planning, strategy, and process integration. In other words, PIR
moderates the influence of growth opportunities on system enhancements. In addition, the

28
immediate after-effect of ERPS is positively associated with the enhancement decision, but
not PIR. As Nicolaou and Bhattacharya (2008) argue, PIR is a moderating variable that
influences the relationship between ERPS investments and potential productivity gains
achieved by implementing firms. As such, while performance is not a driver of PIR, it may
motivate the decision of ERPS enhancement, as a positive performance outcome following
the initial ERPS adoption event, creates additional flexibility.
Summarizing, the combined evidence of Model 1 and Model 2 in Table 6 suggests
two critical factors for an enhancement option to be present in an ERPS project. These are
how quickly companies begin to reap the benefits they sought to accomplish from the ERPS
adoption and whether well-planned PIR practices are in place to enhance system
implementation planning and business process effectiveness. Therefore, by establishing an
association between post-implementation system fit, review, and enhancement, our findings
support the real options perspective of ERP systems adoption and post-implementation
management. This suggests that there could be multiple ways to reconfigure the investment in
ERPS using different of series of compound options.
<Insert Table 6 about here>
V. CONCLUSION
This paper examines whether firms‘ investments in ERPS, including the initial
adoption decision, post-implementation reviews, and subsequent changes are consistent with
an economic-determinants-and-real options perspective. Using a large-scale panel data, we
posit and find that highly concentrated industries and industry leaders are more likely to
adopt ERPS due to greater entrance barriers and competitiveness benefits from investments in
ERPS. This suggests that uncertainty tends to have a non-negative effect on investments in
ERPS among firms. We also find that the likelihood of adoption is positively associated with
larger firms, firms that have higher profit levels, higher market-to-book ratio, and more
29
excess cash, consistent with these innate fundamental characteristics having direct effects on
firms‘ adoption decisions. Combined, we provide two possible explanations for a firm to
adopt ERPS: (i) the quest to differentiate itself and mitigate competition from new entrants
and existing competitors, and (ii) the need to eliminate inefficiencies and the creation of new
growth opportunities.
We find some evidence that the likelihood of system enhancement (i.e., upgrades or
add-ones) following initial ERPS implementation varies with the extent to which the initial
decision to use ERPS ―matches‖ the firm‘s fundamental characteristics. More importantly,
we find that the exercise of the option to enhance ERPS is positively associated with the
extent to which a firm attained the benefits it sought to accomplish with the initial ERPS
adoption. Moreover, high-quality post-implementation practices that relate to project
planning, strategy, and process integration also increase the odds of system enhancements.
These two factors explain a significant portion of the variation in post-implementation
enhancement choices. Although the explanatory power of fundamental factors tends to be
weak, our findings suggest that the implementation and use of ERPS enhances financial
flexibility and organizational capabilities, which, in turn, enables management to optimally
reconfigure investment in ERPS and exercise the options for future initiatives that can
enhance a firm‘s strategic agility, competitive flexibility, and innovativeness (Nicolaou
2008).
Our overall results suggest firms efficiently invest in ERPS, and are consistent with
real options theory. Our study is different from prior studies on IT investment decisions in the
framework of strategic real options (Benaroch et al. 2006) in that we model ERPS adoption
decisions and subsequent adaptation choices as two separate but related decisions about
exercising real operating options in a continuous implementation process. Our findings
provide strong empirical support for the argument that formal adoption of a real options

30
perspective on IT projects benefits the success rate of such projects (e.g., Benaroch 2002).
Our findings also have important implications for research on ERPS implementation
effectiveness and for the use and deployment of ERPS in business organizations.
REFERENCES
Arrow, K. J. (1962). "The Economic Implications of Learning by Doing". Review of
Economic Studies 29: 155–73.
Arrow, K. J. ―Optimal Capital Policy with Irreversible Investment,‖ in Value, Capital, and
Growth, J. N. Wolfe, ed., (Chicago: Aldine, 1968), 1-19.
Amram, M., and Kulatilaka, N. ―Disciplined Decisions: Aligning Strategy with the Financial
Markets,‖ Harvard Business Review (77), January-February, 1999, pp. 95-104.
Attaway, M. C. 1999. Billing risks. Internal Auditor (August): 43-47.
Bardhan, I., Bagchi, S. and Sougstad, R. Prioritizing a portfolio of information technology
investment projects. Journal of Management Information Systems, 21, 2, 2004, 33-60.
Barnett, M.L. Paying attention to real options. R&D Management 35, pp.61-75, 2005.
Benaroch, M. and Kauffman, R.J. A case for using real options pricing analysis to evaluate
information technology project investment. Information Systems Research, 10, 1,
1999, 70-86.
Benaroch, M., and Kauffman, R. J. ―Justifying Electronic Banking Network Expansion Using
Real Options Analysis,‖ MIS Quarterly (24:2), June 2000, pp. 197-225.
Benaroch, M. ―Managing Investments in Information Technology Based on Real Options
Theory,‖ Journal of MIS, (19:2), Fall 2002, pp. 43-84.
Benaroch M., Lichtenstein Y. and Robinson K., ―Real Options in IT Risk Management: An
Empirical Validation of Risk-Option Relationships,‖ MIS Quarterly, Vol. 30, No. 4,
December 2006.
Benaroch M., Jeffery, M., Kauffman, R.J. and Shah S., ―Option-Based Risk Management: A
Field Study of Sequential IT Investment Decisions,‖ Journal of Management
Information Systems, Vol. 24, No. 2, 103-140, Fall 2007.
Bharadwaj, A. "A Resource-based Perspective of Information Technology Effectiveness and
Profitability: An Empirical Investigation," MIS Quarterly, spring 2000, pp. 169-196.
Boulding, W. and R. Staelin. Environment, Market Share, and Market Power. Management
Science, 1990(36:10): 1160-1177
Boyes, W., D. Hoffman, and S. Low, "An Econometric Analysis of the Bank Credit Scoring
Problem," Journal of Econometrics, 40, 1989, pp. 3-14.
Blundell, R, S. Bond, M. Devereux, and F. Schiantarelli. Investment and Tobin's Q: Evidence
from company panel data. Journal of Econometrics Volume 51, Issues 1-2, January-
February 1992, pp. 233-257.
Bradshaw, M. S. Richardson and R. Sloan. 2006. The relation between corporate financing
activities, analysts‘ forecasts and stock returns. Journal of Accounting and Economics
42: 53-85.
Brandenburger A, and Nalebuff, BJ. Co-opetition. New York: Doubleday; 1996.
Brown C, Vessey I. Managing the next wave of enterprise systems: leveraging lessons from
ERP. Manage Inf Syst Q 2003(2:1):65–77.

31
Bushman, R., A. Smith and F. Zhang, 2008. Investment-cash flow sensitivities are really
investment-investment sensitivities. Working paper, University of North Carolina at
Chapel Hill.
Clemons, E. K., and Gu, B. Justifying information technology investments: Balancing the
need for speed of action with certainty before action. Journal of Management
Information Systems, 20, 2, 2003, 11-48.
Clemons, E. K., and M. Row. 1991. Sustaining IT advantage: The role of structural
differences. MIS Quarterly 15(12): 66-77.
Clemons, E. K., and Weber, B. ―Strategic Information Technology Investments: Guidelines
for Decision Making,‖ Journal of Management Information Systems (7:2), 1990, pp.
9-28.
Copeland, T. The real options approach to capital allocation. Strategic Finance, October
2001, pp. 33-37.
Core, J., Guay, W., 1999. The use of equity grants to manage optimal equity incentive levels.
Journal of Accounting and Economics 28, 151–184.
CosgroveWare, L. (2003), ―By the numbers: Enterprise systems show results. C/O Magazine,
November1 (available online at http://www.cio.com/archive/110103/tl_numbers.html)
Faleti SA. ERP optimization: maximize ROI through improved performance. AFP Exchange
2001(21: 5):26–9.
Fazzari, Steven M., R. Glenn Hubbard, and Bruce C. Petersen, 1988, Financing constraints
and corporate investment, Brookings Papers on Economic Activity 1, 151-195.
Fama, E. F., and K. R. French. 2002. Testing trade-off and pecking order predictions about
dividends and debt. Review of Financial Studies 15: 1-33.
Fichman R.G. Real options and IT platform adoption: Implications for theory and practice,
Information Systems Research, 15, 2, 2004, 132-154.
Glover, S. M., D. F. Prawitt, and M. B. Romney. 1999. Implementing ERP. Internal Auditor
(February): 40-47.
Greene, W., 2002. Econometric Analysis. Prentice Hall, Upper Saddle River, NJ.
Harris, M., Raviv, A., 1991. The theory of capital structure. Journal of Finance 46, 297–356.
Hausman, J. 1978. Specification tests in Econometrics. Econometrica 46: 1251–1271.
Heckman, J., 1979. Sample selection bias as a specification error. Econometrica 47, 153}161.
Hunton JE, Lippincott B, Reck JL. Enterprise resource planning systems: comparing firm
performance of adopters and non-adopters. Int J Account Inf Syst 2003;4:165 – 84
[September].
Jensen, M. 1986. Agency costs of free cash flow, corporate finance, and takeovers. American
Economic Review Vol. 76, No.2: 323-329.
Johnston, H. R. and M. R. Vitale. 1988. Creating competitive advantage with inter-
organizational information systems. MIS Quarterly 12 (2): 153-165.
Joos, Peter R. and Plesko, George A., Valuing Loss Firms (June 16, 2004). MIT Sloan
Working Paper No. 4491-04.
Kamien and Schwartz, 1975. M.I. Kamien and N.L. Schwartz, Market structure and
innovation: a survey. Journal of Economic Literature 13 (1975), pp. 1–37.
Klein R, Rai A, Straub DW. Competitive and cooperative positioning in supply chain
logistics relationships. Decis Sci 2007;38:611–46 [November].
Kremers M, Van Dissel H. ERP system migrations. Commun ACM 2000;43(4):53 – 6.
Kumar, R.L. A framework for assessing the business value of information technology
infrastructure. Journal of Management Information Systems, 21, 2, 2004, 11-32.
Lang L., E. Ofek and R. Stulz. 1996. Leverage, investment, and firm growth. Journal of
Financial Economics 40: 3-29.

32
Lang, L., Stulz, R., Walkling, R., 1991. A test of the free cash flow hypothesis: The case of
bidder returns. Journal of Financial Economics 29, 315-355.
Leahy, J., and T. Whited. The Effect of Uncertainty on Investment: Some Stylized Facts.
Journal of Money, Credit and Banking, XXVIII (1996): 64-83.
Leland, H., 1998. Agency costs, risk management, and capital structure. Journal of Finance
53, 1212–1243.
Graham, J. and C. Harvey. 2001. The theory and practice of corporate finance: Evidence
from the field. Journal of Financial Economics 60 (May): 187–243.
Guiso, L. and G. Parigi. 1999. Investment and demand uncertainty. The Quarterly Journal of
Economics 114(1): 185-227.
Mata, F. J. , W. L. Fuerst, and J. B. Barney. 1995. Information Technology and Sustained
Competitive Advantage: A Resource-Based Analysis. MIS Quarterly 19(4): 487-505.
Myers. Stewart. 1977, Determinants of corporate borrowing. Journal of Financial Economics
5.147-175.
Melville N, Kraemer K, Gurbaxani V. Information technology and organizational
performance: an integrative model of IT business value. MIS Q 2004;28(2):283–322.
Nicolaou, A.I. Quality of post-implementation review for enterprise resource planning
systems. Int J Account Inf Syst 2004a;5:25–49 (May).
Nicolaou, A.I. Firm performance effects in relation to the implementation and use of
enterprise resource planning systems. J Inf Syst 2004b;18:79–105 (Fall).
Nicolaou, A.I. Research issues on the use of ERPS in Interorganizational relationships. Int J
Account Inf Syst 2008; 9:79–105 (June).
Nicolaou, A.I, & Bhattacharya, S. Organizational performance effects of ERP systems usage:
the impact of post-implementation changes. Int J Account Inf Syst 2006;7:18–35.
Nicolaou, A.I., & Bhattacharya, S. Sustainability of ERPS performance outcomes: the role of
post-implementation review quality. Int J Account Inf Syst 2008;9:43–60 [Spring, 1].
Patnayakuni, R., A. Rai, and S. Nainika. 2006. Relational antecedents of information flow
integration for supply chain coordination. Journal of Management Information
Systems 23 (1): 13-49.
Poston, R. and S. Grabski, 2001. Financial Impacts of Enterprise Resource Planning
Implementations. International Journal of Accounting Information Systems Vol. 2,
Issue 4: 271-294.
Ranganathan C, Brown CV. ERP investments and the market value of firms: toward an
understanding of influential ERP project variables. Inf Syst Res 2006;17:145–61
[June].
Ragowsky A, Somers TM, Adams DA. Assessing the value provided by ERP applications
through organizational activities. Commun Assoc Inf Syst 2005(16):381–406.
Sambamurthy V, Bharadwaj A, Grover V. Shaping agility through digital options:
reconceptualizing the role of information technology in contemporary firms. MIS Q
2003;27(2):237–63.
Schwartz, E. S., and Zozaya-Gorostiza, C. ―Investment Under Uncertainty in Information
Technology: Acquisition and Development Projects,‖ Management Science (49:1),
January 2003, pp. 57-70.
Subramani M. How do suppliers benefit from information technology use in supply chain
relationships? MIS Q 2004;28(1):45–73.
Seddon, P.B., C. Calvert, and S. Yang. A multi-project model of key factors affecting
organizational benefits from enterprise systems. MIS Quarterly (34:2), June 2010, pp.
305-328.
Taudes, A., Feurstein, M., and Mild, A. ―Options Analysis of Software Platform Decisions: A
Case Study,‖ MIS Quarterly (24:2), June 2000, pp. 227-243.

33
The Standish Group. 2001. Extreme Chaos. Accessible at:
https://secure.standishgroup.com/reports/reports.php
Tirole, J. 1988. The Theory of Industrial Organization. Cambridge, Mass.: MIT Press.
Tiwana, A., Keil, M., Fichman, R.G. (2006), "Information systems project continuation in
escalation situations: a real options model", Decision Sciences, Vol. 37 No.3, pp.357-
91.
Tiwana, A., Wang, J.J., Keil, M., Ahluwalia, P. (2007), "The bounded rationality bias in
managerial valuation of real options: theory and evidence from IT projects", Decision
Sciences, Vol. 38 No.1, pp.157-81.
Trigeorgis, L. Real Options: Managerial Flexibility and strategy in Resource Allocation, MIT
Press, Cambridge, MA, 1996.
Walkerden F., and Jeffery R. Software cost estimation: a review of models, processes, and
practice. Advances in Computers. Vol. 44. San Diego: Academic Press, pp. 62-94,
1997
Willis TH, Willis-Brown AH. Extending the value of ERP. Ind Manage Data Syst
2002(102:1):35–8.
TABLE 1
PIR Dimensions and Activities
PIR Dimension PIR Activities
I. Review of Overall
Project Scope and
Planning
1. PROJECT PLAN: - Project planning evaluated and changes instituted in
subsequent implementation teams.
2. INFRASTRUCTURE: Information infrastructure development considered
critical for survival, competitive advantage.
3. STRATEGY: Evaluated system fit with strategic vision for organizational
transformation.
II. Review of
Driving Principles
for Project
Development
4. PROCESS INTEGRATION- Formal review of process integration.
5. PROJECT CHANGE: - Initial reactive response to problems due to
implementation process inadequacies introduced by system.
6. GLOBAL REACH: Evaluated global reach and support.
7. JUSTIFICATION: - Re-evaluation of initial system justification.
III. Effectiveness of
Misfit Resolution
Strategies
8. FIT RESOLUTION: evaluated fit of system with needs.
9. MISFIT RESOLUTION: developed workarounds to resolve misfits (by-pass
system deficiencies).
10. PROCESS SIMPLICITY: Evaluated process simplicity – adopted simple
processes, reengineered processes for simplicity.
IV. Evaluation of
Attained Benefits
11. BENEFITS ATTAINED: - Evaluated attainment of benefits.
12. USER COMPLAINTS: lack of benefits as evidenced by user complaints.
V. Evaluation of
Learning
13. USER LEARNING: - Reviewed user learning and instituted corrective
mechanisms.
14. KNOWLEDGE TRANSFER: - Evaluated knowledge transfer among
implementation teams (multi-site implementations).
Source: Nicolaou 2004(b)

34
TABLE 2
Sample Details
Panel A: Description of Sample Selection
ERP Firms Control firms Total
Observations in the Initial Adoption Test
Total observations before Compustat data requirements
(Control observations are from the same 2-digit SIC
industry and year on Compustat) 247 27,457 27,704
Less observations missing necessary financial/market
data for analysis (66) (7,289) (7,355)
Total ERP/Control Observations 181 20,168 20,349
Firm-Year Observations in the System Enhancement
Options Test Firm-Year
Total possible ERP observations during the 10-year
period following the adoption 1,810 n/a
Less observations missing necessary financial/market
data during the 10-year period following the adoption,
beyond a minimum of three-year data requirement (395) n/a
Total 1,415
Panel B: Distribution of ERP firms by Two-Digit Standard Industrial Classification (SIC) Code
Industry Sector SIC Code
# of ERP
Firms in the
Sample Percentage
of Sample
Agricultural production 1 1 0.55%
Oil & gas 13 3 1.66
Bldg contractors 15 1 0.55
Food and kindred products 20 3 1.66
Textile mill products 22 3 1.66
Lumber & wood products 24 2 1.10
Furniture & fixtures 25 5 2.76
Papers & allied products 26 4 2.21
Printing & publishing 27 5 2.76
Chemicals & allied products 28 17 9.39
Petroleum & coal products 29 3 1.66
Rubber & plastics products 30 3 1.66
Leather & leather products 31 1 0.55
Stone, clay & glass products 32 1 0.55
Primary metal industries 33 7 3.87
Fabricated metal products 34 5 2.76
Industrial machinery & equipment 35 24 13.26
Electronics & electrical equipment 36 20 11.05
Transportation equipment 37 16 8.84

35
Instruments & related products 38 11 6.08
Miscellaneous manufacturing 39 4 2.21
Trucking, courier, & storage services 42 1 0.55
Air transportation services 45 1 0.55
Tele communications & broadcasting 48 4 2.21
Electric, gas & sanitary services 49 5 2.76
Wholesale—Durable goods 50 3 1.66
Wholesale—Paper & paper products 51 2 1.10
Retail—Building materials, hardware, garden supply 52 1 0.55
Retail—General merchandise stores 53 1 0.55
Retail—Food, grocery, & convenience stores 54 1 0.55
Retail—Eating & drinking 58 3 1.66
Retail—Miscellaneous retail 59 4 2.21
Commercial banks & saving institutions 60 1 0.55
Insurance industries 63 3 1.66
Business services 73 9 4.97
Services—Amusement and recreation 79 1 0.55
Non-operating establishments 99 2 1.10
Total 181 100.00

TABLE 3
Summary Statistics for ERP Adoption and Its Determinants
Variable N Mean Std Dev Q1 Median Q3 t-test a
Wilcoxon rank
sum test a
Panel A: ERP firms (ADOPT = 1)
HERFINDAHL 181 0.059 0.046 0.037 0.045 0.073 1.350 1.767 *
MKT_SHR 181 0.012 0.019 0.000 0.003 0.012 6.100 *** 11.839 ***
FIRM_SIZE 181 6.203 2.128 4.650 6.250 7.633 10.440 *** 9.861 ***
PROFITABILITY 181 0.140 0.093 0.106 0.150 0.180 15.600 *** 7.025 ***
MB 181 1.840 1.227 1.150 1.432 1.963 4.790 *** 1.238
FREE_CFP 181 0.058 0.075 0.000 0.061 0.102 15.320 *** 6.180 ***
LEVERAGE 181 0.530 0.223 0.399 0.535 0.662 1.120 1.795 *
GROWTH 140 0.239 0.542 0.035 0.126 0.301 2.400 ** 0.051
RISK 140 0.027 0.016 0.015 0.022 0.036 10.520 *** 7.959 ***
EXT_FIN 140 0.114 0.379 -0.038 0.011 0.096 0.480 0.629
CFO_OP 140 0.071 0.166 0.034 0.097 0.147 4.740 *** 3.696 ***
Panel B: Control firms (ADOPT = 0)
HERFINDAHL 20,168 0.055 0.041 0.032 0.043 0.064
MKT_SHR 20,168 0.003 0.009 0.000 0.000 0.001
FIRM_SIZE 20,168 4.549 2.123 3.096 4.420 5.908
PROFITABILITY 20,168 0.029 0.277 0.013 0.099 0.165
MB 20,168 2.283 2.230 1.075 1.509 2.505
FREE_CFP 20,168 -0.031 0.243 -0.009 0.002 0.081
LEVERAGE 20,168 0.511 0.305 0.281 0.493 0.681
GROWTH 12,482 0.351 0.997 0.007 0.137 0.362
RISK 12,482 0.041 0.025 0.023 0.036 0.051
EXT_FIN 12,482 0.129 0.373 -0.032 0.009 0.118
CFO_OP 12,482 0.003 0.245 -0.049 0.063 0.134
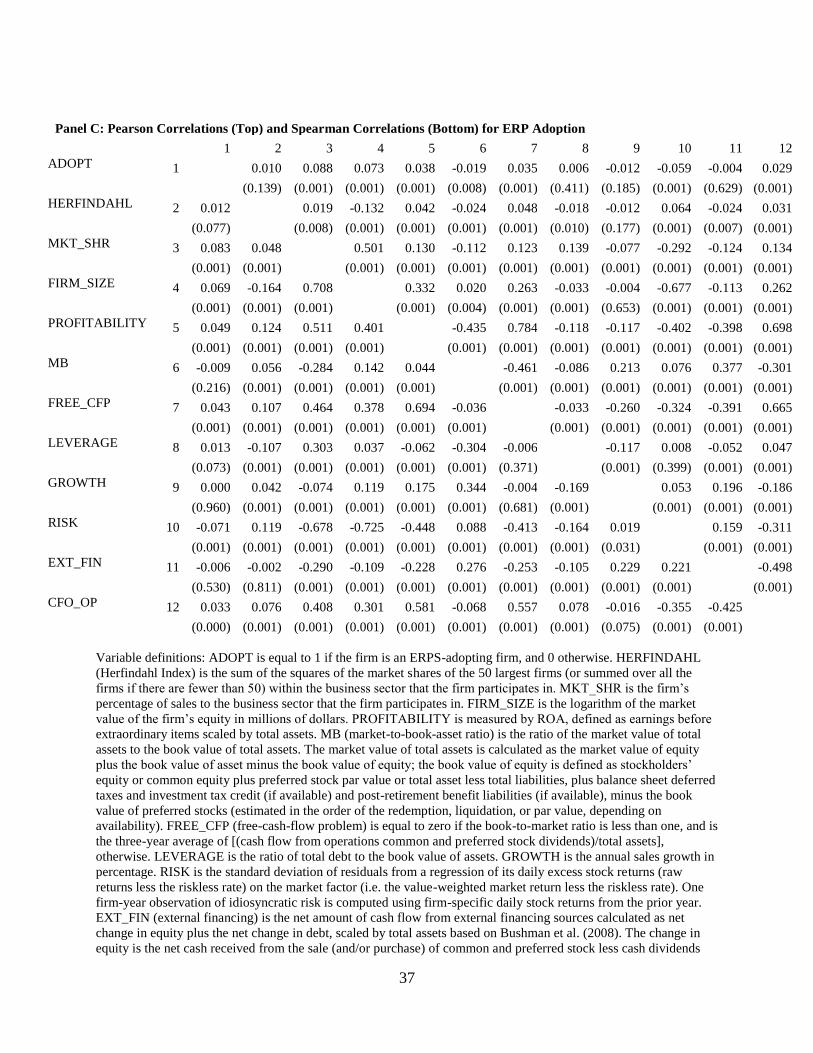
37
Panel C: Pearson Correlations (Top) and Spearman Correlations (Bottom) for ERP Adoption
1 2 3 4 5 6 7 8 9 10 11 12
ADOPT 1 0.010 0.088 0.073 0.038 -0.019 0.035 0.006 -0.012 -0.059 -0.004 0.029
(0.139) (0.001) (0.001) (0.001) (0.008) (0.001) (0.411) (0.185) (0.001) (0.629) (0.001)
HERFINDAHL 2 0.012 0.019 -0.132 0.042 -0.024 0.048 -0.018 -0.012 0.064 -0.024 0.031
(0.077) (0.008) (0.001) (0.001) (0.001) (0.001) (0.010) (0.177) (0.001) (0.007) (0.001)
MKT_SHR 3 0.083 0.048 0.501 0.130 -0.112 0.123 0.139 -0.077 -0.292 -0.124 0.134
(0.001) (0.001) (0.001) (0.001) (0.001) (0.001) (0.001) (0.001) (0.001) (0.001) (0.001)
FIRM_SIZE 4 0.069 -0.164 0.708 0.332 0.020 0.263 -0.033 -0.004 -0.677 -0.113 0.262
(0.001) (0.001) (0.001) (0.001) (0.004) (0.001) (0.001) (0.653) (0.001) (0.001) (0.001)
PROFITABILITY 5 0.049 0.124 0.511 0.401 -0.435 0.784 -0.118 -0.117 -0.402 -0.398 0.698
(0.001) (0.001) (0.001) (0.001) (0.001) (0.001) (0.001) (0.001) (0.001) (0.001) (0.001)
MB 6 -0.009 0.056 -0.284 0.142 0.044 -0.461 -0.086 0.213 0.076 0.377 -0.301
(0.216) (0.001) (0.001) (0.001) (0.001) (0.001) (0.001) (0.001) (0.001) (0.001) (0.001)
FREE_CFP 7 0.043 0.107 0.464 0.378 0.694 -0.036 -0.033 -0.260 -0.324 -0.391 0.665
(0.001) (0.001) (0.001) (0.001) (0.001) (0.001) (0.001) (0.001) (0.001) (0.001) (0.001)
LEVERAGE 8 0.013 -0.107 0.303 0.037 -0.062 -0.304 -0.006 -0.117 0.008 -0.052 0.047
(0.073) (0.001) (0.001) (0.001) (0.001) (0.001) (0.371) (0.001) (0.399) (0.001) (0.001)
GROWTH 9 0.000 0.042 -0.074 0.119 0.175 0.344 -0.004 -0.169 0.053 0.196 -0.186
(0.960) (0.001) (0.001) (0.001) (0.001) (0.001) (0.681) (0.001) (0.001) (0.001) (0.001)
RISK 10 -0.071 0.119 -0.678 -0.725 -0.448 0.088 -0.413 -0.164 0.019 0.159 -0.311
(0.001) (0.001) (0.001) (0.001) (0.001) (0.001) (0.001) (0.001) (0.031) (0.001) (0.001)
EXT_FIN 11 -0.006 -0.002 -0.290 -0.109 -0.228 0.276 -0.253 -0.105 0.229 0.221 -0.498
(0.530) (0.811) (0.001) (0.001) (0.001) (0.001) (0.001) (0.001) (0.001) (0.001) (0.001)
CFO_OP 12 0.033 0.076 0.408 0.301 0.581 -0.068 0.557 0.078 -0.016 -0.355 -0.425
(0.000) (0.001) (0.001) (0.001) (0.001) (0.001) (0.001) (0.001) (0.075) (0.001) (0.001)
Variable definitions: ADOPT is equal to 1 if the firm is an ERPS-adopting firm, and 0 otherwise. HERFINDAHL
(Herfindahl Index) is the sum of the squares of the market shares of the 50 largest firms (or summed over all the
firms if there are fewer than 50) within the business sector that the firm participates in. MKT_SHR is the firm‘s
percentage of sales to the business sector that the firm participates in. FIRM_SIZE is the logarithm of the market
value of the firm‘s equity in millions of dollars. PROFITABILITY is measured by ROA, defined as earnings before
extraordinary items scaled by total assets. MB (market-to-book-asset ratio) is the ratio of the market value of total
assets to the book value of total assets. The market value of total assets is calculated as the market value of equity
plus the book value of asset minus the book value of equity; the book value of equity is defined as stockholders‘
equity or common equity plus preferred stock par value or total asset less total liabilities, plus balance sheet deferred
taxes and investment tax credit (if available) and post-retirement benefit liabilities (if available), minus the book
value of preferred stocks (estimated in the order of the redemption, liquidation, or par value, depending on
availability). FREE_CFP (free-cash-flow problem) is equal to zero if the book-to-market ratio is less than one, and is
the three-year average of [(cash flow from operations common and preferred stock dividends)/total assets],
otherwise. LEVERAGE is the ratio of total debt to the book value of assets. GROWTH is the annual sales growth in
percentage. RISK is the standard deviation of residuals from a regression of its daily excess stock returns (raw
returns less the riskless rate) on the market factor (i.e. the value-weighted market return less the riskless rate). One
firm-year observation of idiosyncratic risk is computed using firm-specific daily stock returns from the prior year.
EXT_FIN (external financing) is the net amount of cash flow from external financing sources calculated as net
change in equity plus the net change in debt, scaled by total assets based on Bushman et al. (2008). The change in
equity is the net cash received from the sale (and/or purchase) of common and preferred stock less cash dividends

38
paid and the net change in debt equals net cash received from the issuance (or reduction) of debt. CFO_OP (cash
flow from operations) is calculated as calculated as earnings before depreciation minus working capital accruals
scaled by average assets based on Bushman et al. (2008). Working capital accruals is measured as change in current
assets less change in cash and cash equivalents less change in current liabilities other than change in short-term debt
and change in tax payable. All variables are measured as of the beginning of the ERPS adopting year, unless
otherwise specified. The continuous variables are winsorized at the top 1% and bottom 99% percentiles.
a ***, **, and * indicate significant differences in means or medians between ERP-adopting firms and control firms
at the 0.01, 0.05, and 0.1 levels respectively, two-tailed.

39
Table 4
The Decision to Adopt ERPS
Independent Variables
Predicted
Sign Model 1 Model 2 Model 3 Model 4
Coefficient
Estimate
Coefficient
Estimate
Coefficient
Estimate
Coefficient
Estimate
(p-value) (p-value) (p-value) (p-value)
Intercept ? -6.994 -6.886 -6.956 -6.439
(0.001) (0.001) (0.001) (0.001)
HERFINDAHL + (H1a) 4.240 4.557 4.284 4.185
(0.008) (0.005) (0.007) (0.021)
MKT_SHR + (H1a) 20.203 19.450 20.464 17.807
(0.001) (0.001) (0.000) (0.009)
FIRM_SIZE + 0.214 0.224 0.207 0.217
(0.001) (0.001) (0.001) (0.003)
PROFITABILITY + 2.748 2.155 2.330
(0.001) (0.007) (0.011)
MB + -0.157 -0.123 -0.147 -0.247
(0.020) (0.049) (0.031) (0.002)
FREE_CFP + 2.670 1.056
(0.000) (0.222)
LEVERAGE ? -0.251 -0.290 -0.234 -0.202
(0.470) (0.405) (0.505) (0.610)
GROWTH + -0.041
(0.742)
RISK - -10.571
(0.195)
EXT_FIN + 0.756
(0.002)
CFO_OP + -0.217
(0.762)
Industry Dummies Yes Yes Yes Yes
Year Dummies Yes Yes Yes Yes
N 20,349 20,349 20,349 12,622
Pseudo R2 0.094 0.092 0.095 0.108
(p-value) (0.001) (0.001) (0.001) (0.001)
***, **, * denote significance at the 0.01, 0.05, 0.10 levels (two-tailed), respectively.
See Table 3 for variable definitions. We cluster standard errors by firm and include year and industry indicators.

40
TABLE 5
Summary Statistics for ERP Enhancement Decisions and Their Determinants
Variable N Mean Std Dev Q1 Median Q3 t-test a
Wilcoxon rank
sum test a
Panel A: Enhancement Adopters (ENHANCE = 1)
PROB_ADOPT 34 0.324 0.475 0.000 0.000 1.000 2.220 *** 2.977 ***
INIT_PERF 34 0.181 0.082 0.130 0.158 0.223 2.670 *** 2.293 ***
PIR 34 0.618 0.493 0.000 1.000 1.000 21.410 *** 18.609 ***
EARLY 34 0.176 0.387 0.000 0.000 0.000 1.020 1.021
MEDIUM 34 0.471 0.507 0.000 0.000 1.000 1.810 * 1.813 *
∆HERFINDAHL 34 -0.004 0.026 -0.013 -0.004 0.000 0.380 1.436
∆MKT_SHR 34 0.017 0.051 -0.001 0.001 0.008 -0.850 1.230
SALES 34 8.296 1.683 7.206 8.348 9.319 3.830 *** 3.785 ***
MB 34 2.395 1.876 1.202 1.487 2.805 1.750 * 1.923 *
LOSS 34 0.382 0.493 0.000 0.000 1.000 0.140 0.145
CFO_SHORT 34 -0.176 0.152 -0.259 -0.170 -0.102 1.260 1.514
Panel B: Non-enhancement Adopters (ENHANCE = 0)
PROB_ADOPT 1,381 0.141 0.348 0.000 0.000 0.000
INIT_PERF 1,381 0.140 0.088 0.110 0.143 0.186
PIR 1,381 0.021 0.143 0.000 0.000 0.000
EARLY 1,381 0.253 0.435 0.000 0.000 1.000
MEDIUM 1,381 0.323 0.468 0.000 0.000 1.000
∆HERFINDAHL 1,381 -0.002 0.026 -0.011 -0.003 0.002
∆MKT_SHR 1,381 0.009 0.037 0.000 0.000 0.002
SALES 1,381 6.978 1.989 5.379 7.008 8.495
MB 1,381 1.828 1.306 1.105 1.402 1.971
LOSS 1,381 0.395 0.489 0.000 0.000 1.000
CFO_SHORT 1,381 -0.147 0.130 -0.214 -0.153 -0.088

41
Panel C: Pearson Correlations (Top) and Spearman Correlations (Bottom) for ERP Enhancement
1 2 3 4 5 6 7 8 9 10 11 12
ENHANCE 1 0.079 0.071 0.495 -0.027 0.048 -0.010 0.030 0.101 0.066 -0.004 -0.034
(0.003) (0.008) (0.001) (0.307) (0.070) (0.707) (0.252) (0.000) (0.014) (0.885) (0.208)
PROB_ADOPT 2 0.079 0.171 0.062 -0.032 -0.005 0.111 0.357 0.514 0.069 -0.058 -0.059
(0.003) (0.001) (0.020) (0.236) (0.840) (0.001) (0.001) (0.001) (0.010) (0.028) (0.027)
INIT_PERF 3 0.061 0.202 0.026 -0.032 -0.013 0.078 0.066 0.277 0.271 -0.144 -0.314
(0.022) (0.001) (0.321) (0.232) (0.623) (0.003) (0.014) (0.001) (0.001) (0.001) (0.001)
PIR 4 0.495 0.062 0.031 0.030 0.030 -0.030 0.012 0.082 0.084 -0.029 -0.043
(0.001) (0.020) (0.249) (0.257) (0.260) (0.267) (0.643) (0.002) (0.002) (0.274) (0.105)
EARLY 5 -0.027 -0.032 -0.039 0.030 -0.404 -0.028 -0.025 -0.100 0.009 -0.118 -0.090
(0.307) (0.236) (0.140) (0.257) (0.001) (0.294) (0.344) (0.000) (0.739) (0.001) (0.001)
MEDIUM 6 0.048 -0.005 -0.018 0.030 -0.404 -0.054 -0.015 -0.030 -0.021 -0.059 -0.025
(0.070) (0.840) (0.501) (0.260) (0.001) (0.044) (0.581) (0.259) (0.433) (0.026) (0.356)
∆HERFINDAHL 7 -0.038 0.038 0.108 -0.037 0.014 -0.066 0.197 0.051 -0.018 0.010 -0.032
(0.151) (0.150) (0.001) (0.165) (0.606) (0.013) (0.001) (0.054) (0.502) (0.700) (0.231)
∆MKT_SHR 8 0.033 0.238 0.157 0.020 -0.048 -0.013 -0.008 0.328 0.051 -0.017 -0.060
(0.219) (0.001) (0.001) (0.460) (0.069) (0.622) (0.752) (0.001) (0.057) (0.533) (0.024)
SALES 9 0.101 0.501 0.288 0.084 -0.103 -0.031 0.015 0.320 0.081 -0.104 -0.240
(0.000) (0.001) (0.001) (0.002) (0.000) (0.249) (0.575) (0.001) (0.002) (0.001) (0.001)
MB 10 0.051 0.128 0.387 0.053 0.056 -0.087 -0.080 0.126 0.167 -0.093 -0.254
(0.055) (0.001) (0.001) (0.045) (0.035) (0.001) (0.003) (0.001) (0.001) (0.001) (0.001)
LOSS 11 -0.004 -0.058 -0.176 -0.029 -0.118 -0.059 0.021 -0.046 -0.088 -0.054 0.165
(0.885) (0.028) (0.001) (0.274) (0.001) (0.026) (0.424) (0.085) (0.001) (0.042) (0.001)
CFO_SHORT 12 -0.040 -0.062 -0.402 -0.026 -0.098 0.003 0.003 -0.244 -0.212 -0.318 0.174
(0.130) (0.020) (0.001) (0.335) (0.000) (0.906) (0.901) (0.001) (0.001) (0.001) (0.001)
Variable definitions: ENHANCE is equal to 1 if the firm have an ERP enhancement (add-on or upgrade) during the
year, and 0 otherwise. PROB_ADOPT is equal to 1 if the estimated probability from the regression of initial ERP
adoption is greater than the mean estimated probability of adoption. INIT_PERF (initial performance) is the average
ROA of the year of and the year immediately after the initial ERPS adoption. PIR is equal to 1 if the firm
implemented PIR activities relating to project planning, strategy, and process integration prior to the enhancement,
and 0 otherwise. EARLY is equal to 1 for the early ERPS implementation period (Year 1 and Year 2), and 0
otherwise. MEDIUM is equal to 1 for the medium ERPS implementation period (Year 3, 4 and 5), and 0 otherwise.
∆HERFINDAHL is the change in the Herfindahl Index from the beginning of the initial ERPS adopting year to the
beginning of the new options adopting year. ∆MKT_SHR is the change in the market share from the beginning of
the initial ERPS adopting year to the beginning of the options adopting year. SALES is the logarithm of annual
sales, measured as of the beginning of the options adopting year. LOSS is an indicator variable equal to one if the
firm has loss (income) before extraordinary items and discontinued operations in any of the three years prior to the
options adopting year. CFO_SHORT (cash flow shortfall) is the average of [(common and preferred dividends +
cash flow from investing - cash flow from operations)/total assets] for the three years prior to the options adopting
year. HERFINDAHL, MKT_SHR, and MB are defined in Table 3. The continuous variables are winsorized at the
top 1% and bottom 99% percentiles.
a ***, **, and * indicate significant differences in means or medians between options firms and non-options firms at
the 0.01, 0.05, and 0.1 levels respectively, two-tailed.

42
Table 6
The Decision to Enhance ERP
Model 1 Model 2
Independent Variables
Predicted
Sign
Dependent Variable:
ENHANCE
(2.1) Dependent
Variable: PIR
(2.2) Dependent
Variable:
ENHANCE
Coefficient Estimate Coefficient Estimate Coefficient Estimate
p-value p-value p-value
Intercept ? -8.256 -3.199 -3.927
(0.001) (0.001) (0.001)
PROB_ADOPT + (H2) 0.172 0.105 0.170
(0.730) (0.597) (0.422)
INIT_PERF + (H2) 8.578 -0.439 2.483
(0.003) (0.599) (0.047)
PIR + (H3) 4.361
(0.001)
EARLY + (H4) -0.330 0.441 0.136
(0.645) (0.012) (0.534)
MEDIUM + (H4) 0.603 0.342 0.399
(0.281) (0.035) (0.023)
∆HERFINDAHL + (H1b) 1.065 -4.185 -1.920
(0.805) (0.179) (0.565)
∆MKT_SHR + (H1b) 0.777 -0.533 -0.476
(0.826) (0.790) (0.824)
SALES + 0.234 0.111 0.140
(0.074) (0.014) (0.012)
MB + -0.001 0.098 0.062
(0.996) (0.029) (0.268)
LOSS - 0.549 -0.022 0.185
(0.180) (0.882) (0.258)
CFO_SHORT - 1.639 -0.081 0.520
(0.462) (0.892) (0.439)
Industry Dummies Yes Yes Yes
Year Dummies Yes Yes Yes
N 1,415 1,415 1,415
Pseudo R2 / rho 0.419 0.868
(p-value) (0.001) (0.001)
***, **, * denote significance at the 0.01, 0.05, 0.10 levels (two-tailed), respectively.
See Table 5 for variable definitions. We cluster standard errors by each adopting firm and include industry
indicators.