Textile Organic Dyes – Characteristics, Polluting Effects and ...

Cities 36 (2014) 41–49
Contents lists available at ScienceDirect
Cities
journal homepage: www.elsevier .com/locate /c i t ies
A long view of polluting industry and environmental justice in Baltimore
0264-2751/$ - see front matter � 2013 Elsevier Ltd. All rights reserved.http://dx.doi.org/10.1016/j.cities.2013.09.004
⇑ Corresponding author.E-mail addresses: [email protected] (C.G. Boone), [email protected]
du (M. Fragkias), [email protected] (G.L. Buckley), [email protected] (J.M. Grove).
1 Baltimore City is a county equivalent jurisdiction in Maryland. The sursuburban counties are Anne Arundel, Baltimore, Carroll, Harford, and Howa
Christopher G. Boone a,⇑, Michail Fragkias b, Geoffrey L. Buckley c, J. Morgan Grove d
a School of Sustainability, Arizona State University, PO Box 875502, Tempe, AZ 85287-5502, USAb Department of Economics, Boise State University, 1910 University Drive, Boise, ID 83725, USAc Department of Geography, Ohio University, 122 Clippinger Labs, Athens, OH 45701, USAd Baltimore Field Station and Baltimore Ecosystem Study, US Forest Service Northern Research Station, Suite 350, 5523 Research Park Drive, Baltimore, MD 21228, USA
a r t i c l e i n f o
Article history:Received 10 August 2012Received in revised form 3 September 2013Accepted 11 September 2013Available online 5 October 2013
Keywords:Environmental justiceBaltimoreLongitudinalToxics Release InventoryHazards Density IndexSustainability
a b s t r a c t
Purpose: This study examines the density of polluting industry by neighborhoods in Baltimore over thelong term, from 1950 to 2010, to determine if high pollution burdens correspond spatially with expecteddemographic and housing variables predicted in the environmental justice literature. For 1960–1980 weuse data on heavy industry from Dun and Bradstreet directories and for 1990–2010 the US EPA’s ToxicsRelease Inventory to calculate a Hazards Density Index. Drawing on the decennial censuses for 1960–2010, we populate census tracts from corresponding years with data on race, ethnicity, educationalattainment, income, and housing tenure.Findings: Density of polluting industry is positively correlated with low-income neighborhoods and ren-ter-occupied housing in 1960 and by 2010 with white, Hispanic, and low educational attainment popu-lations. In general, over time density of polluting facilities shifts from an association with wealth to raceand ethnicity while educational attainment remains a significant variable throughout. This study con-firms earlier analyses on Baltimore that white neighborhoods are more likely than African–Americanneighborhoods (1990–2010) to contain polluting facilities but reveals for the first time that educationalattainment is also significant. The paper concludes with a discussion of the Baltimore Sustainability Planand its weak efforts to address persistent environmental injustices.
� 2013 Elsevier Ltd. All rights reserved.
Introduction
In a 1958 planning report, the population of Baltimore was pro-jected to steadily increase from 950,000 in 1950 to 1.2 million by1980 (Baltimore Regional Planning Council., 1958). This projectionwas based on an assumption that the city would grow uninter-rupted along an elegant smooth curve. What the planners did notforesee was the radical transformation of Baltimore’s industrialeconomy; from 1950 to 2000, the city experienced a net loss ofmore than 100,000 manufacturing jobs. Nor could they predictthe full impacts of federally-subsidized suburbanization throughthe Federal Highway Acts and the guaranteed mortgages for newhome construction, the Martin Luther King riots of 1968, the crackcocaine epidemic in the 1980s and rise of violent crime, or thepowerful lure of suburban schools, homes, and jobs. Baltimore Ci-ty’s population peaked in 1950 and has been in steady decline eversince.
For the 620,000 residents who remain, what are they left with?Although industries shed thousands of good paying jobs, Baltimo-reans have to live with still-functioning and polluting facilities.
From 2005 to 2010, nearly 120 million pounds of toxic pollutantswere released into the air, water, and land of Baltimore City, fargreater than any of the surrounding counties in Maryland. On aver-age, each resident of Baltimore City endures 191 lb of released tox-ins compared to 47 lb per person for the suburban counties in themetropolitan area.1
Baltimore City distinguishes itself from surrounding counties inanother way – it is majority (64%) African–American. This corre-sponding pattern of polluting industry in areas populated by peo-ple of color agrees with the vast majority of environmental justicefindings (Downey & Hawkins, 2008; Mohai & Saha, 2007). How-ever, when we zoom down to finer spatial scales, an unexpectedpattern emerges. Most of the toxic releasing facilities recorded inthe US Environmental Protection Agency’s Toxics Release Inven-tory (TRI) are found in or near white rather than black neighbor-hoods (Boone, 2002; Boone, 2008a; Downey, 2007). This ispeculiar given that the majority of environmental justice studiesconducted at the census tract or zip code level show that margin-alized communities, including persons in poverty and ethnic/racialminorities, are more likely to live near toxic facilities than whitesand higher-income residents, and that race and ethnicity are usu-
roundingrd.

42 C.G. Boone et al. / Cities 36 (2014) 41–49
ally stronger predictors than income. Results from Baltimore aremore the exception than the rule, although studies from Detroit(Downey, 2005), Buffalo (Krieg, 2005), and Cleveland (Bowen, Sal-ling, Haynes, & Cyran, 1995) show similar findings of African–American neighborhoods not significantly associated with toxiccensus tracts.
In Baltimore, a variety of historical reasons help to explain whywhites are more likely than blacks to live near TRI facilities. One isthe changing notion of amenity location combined with commu-nity inertia. In the first few decades of the twentieth century, livingclose to a factory job was a privilege afforded primarily to whiteBaltimoreans (Olson, 1997). The city has undergone significantdemographic shifts but many of these older white communities re-main close to what are now designated as toxic releasing facilities.From a distributive justice perspective, the potential for environ-mental inequities hinges on residential segregation. Baltimorehas a long history of residential segregation along racial, ethnic,class, and religious lines. It was the first city in the nation to passa local ordinance restricting where blacks could live (Power,1983), setting an example that numerous southern cities wouldfollow before a US Supreme Court ruling in 1917 ended the prac-tice. Wishing to ‘‘protect’’ residents from ‘‘negro encroachment’’in the wake of the Supreme Court decision, homeowners associa-tions from across the city cooperated with one another to preventblacks, Jews, and other ethnic whites, particularly those fromsouthern and eastern Europe, from gaining a toehold in theirneighborhoods. They also adopted restrictive covenants that for-bade homeowners from selling to whomever they wished. Whilethey sought to secure their borders, homeowners lobbied for theprovision of a variety of amenities, such as telephone service,paved roads, street trees, and parks (Buckley & Boone, 2011). Fed-eral institutions, including the Home Owners Loan Corporation inthe 1930s, helped to reinforce segregation in the city (Lord & Nor-quist, 2010). The net effect was to keep white neighborhoods occu-pied by white residents longer than if choice alone dictated. Whiteprivilege and accompanying segregation in essence ‘backfired’ onwhite residents now living in toxic neighborhoods while blackBaltimoreans were subjected to grossly unjust rules andinstitutions.
Change over time
What has not been adequately explored in the environmentaljustice literature is how patterns of inequity change over time. Inpart this is a function of available data. The US Environmental Pro-tection Agency did not begin to collect and publish TRI data until1987. However, this now amounts to over two decades of informa-tion on toxic releases, so longitudinal studies are possible andmeaningful using this important data source. A second explanationis the recoil from early ‘‘which came first’’ studies, an approachthat has been largely discredited as a means of establishing causa-tion. Minorities moving into a neighborhood after a pollutingindustry is established can still be an environmental injustice, asinstitutions, discrimination, and unfair practices might diminishopportunities for minorities to live in neighborhoods without pol-luting facilities. The causes of where people live and may live arecomplex, and a simple analysis of which came first – the industryor the population – neglects the myriad array of constraints on thechoice of residential or industrial location. A second issue that of-ten arises, as a criticism of environmental justice, is evidence ofharm (Bowen, 2002). Making the link between location of a haz-ardous waste facility, for instance, and the health and well beingof nearby residents is a valid and appropriate approach (Brulle, Da-vid, & Pellow, 2006; Hynes & Lopez, 2007). Indeed, this is the bur-den of epidemiologists who have developed painstaking methodsto explicate causal pathways of environmental hazards and health
outcomes. When this information is available, the environmentaljustice community has used it (Osiecki, Seijeoung, Ifeanyi, & Cal-houn, 2013) but also resisted the argument of evidence of harmfor several reasons. First, it could be perilous for residents to waitfor the science to demonstrate causal linkages while living with apolluting facility. A second concern is that proof of harm shouldnot rest with victims, as is typically the case, but with the pollutersthemselves. A third reason that the environmental justice commu-nity resists drifting into risk analysis and proof of harm is that itdistracts from the processes, rather than the outcomes alone, thatmay be unjust (Bullard, 1996). Exclusion of citizens from decision-making can be as much of an injustice as living with polluting facil-ities (Schlosberg, 2007).
In this study, we conduct a longitudinal analysis of pollutingindustry and demographics not to explore causation but effect.Other analyses and studies have demonstrated that a series ofinstitutions effectively segregated white and black Baltimore andrestricted heavy industry through zoning to areas near the harbor(Boone, 2002; Orser, 1994). This paper will examine if those insti-tutions have consistently confined heavy industry to white neigh-borhoods over time. In other words, we examine if the effect hasbeen consistent over the last 60 years, or if it has shifted in signif-icant ways. To our knowledge, this is the first study to investigatedistributive environmental justice over such a long time period.We argue that this long time span allows environmental justiceresearchers to examine the dynamics of change, persistence, pathdependency, and legacies that would otherwise be difficult if notimpossible to observe. A site-specific historical approach providesinsight into the dynamics of distributive justice, which is a criticalstarting point for subsequent process justice inquiries.
It is important to note that environmental burdens are morethan pollution from heavy industry. Others have studied the loca-tion of hazardous waste facilities (Bullard, 1990), recycling sortingcenters (Gandy, 2002), housing in flood plains (Maantay & Maroko,2009), liquor stores (Romley, Cohen, Ringel, & Sturm, 2007) andother unwanted land uses or hazards as environmental justice con-cerns. Dangerous contaminants such as lead are found in very highconcentrations in Baltimore, especially in older housing that is notcarefully maintained (Andra, Sarkar, Datta, & Saminathan, 2006;Schwarz et al., 2012). In most cities, lead levels correspond withpoverty, which correlates strongly with some ethnic and racialminorities (Zhou, Boone, & Shock, 2012). Traffic and noise pollu-tion, trash, and biohazards (including used syringes) are amongmany other factors that should be considered environmental bur-dens (Sobotta, Campbell, & Owens, 2007). Environmental justiceis also concerned with the distribution of environmental amenities.Theories of social privilege have been used to show how whites inmany US cities enjoy a disproportionate share of environmentalamenities, such as access to parks and open space, clean air, andtree canopy cover (Landry & Chakraborty, 2009; Pulido, 2000). Inthe case of Baltimore, white privilege in the past meant close ac-cess to employment in factories. The legacy of that past privilegeto an amenity is now a disproportionately high concentration ofpolluting facilities in white neighborhoods.
Data and methods
The principal objective of this paper is to map the historical dis-tribution of polluting industries in Baltimore and compare thosedistributions to nearby social and housing characteristics. The pur-pose for doing so is to examine if the patterns vary or persist overtime. To match the decennial census, we analyze the spatial andstatistical relationships between polluting industry and socialand housing characteristics at 10 year intervals from 1960 to2010. As with most longitudinal datasets, the categories and

C.G. Boone et al. / Cities 36 (2014) 41–49 43
measurement methods of the censuses vary to a degree, but we be-lieve they are reasonably robust for the purposes of the analysis.
The TRI is one of the most commonly used data sources in out-come-equity analysis. Mandated by the Emergency Planning andCommunity Right-to-Know Act (EPCRA) of 1986, facilities meetingcertain minimum release thresholds and other criteria are requiredto report to the Environmental Protection Agency releases ofchemicals that are toxic to people or the environment. The TRI isused extensively in EJ research because it provides data about ac-tual releases of toxic substances. Since TRI data have been collectedonly since 1986, we use alternative data sources for 1960, 1970,and 1980. To match the TRI initial screening criteria, we use theDun & Bradstreet (D&B) Regional Directories to extract locationdata for heavy manufacturing (SIC divisions 20–29), electric utili-ties (SIC 4911, 4931, 4939), chemical wholesalers (SIC 5169), andpetroleum terminals (SIC 5171). While the presence of such facili-ties does not necessarily equal the disamenity of present-day TRIsites, for the purposes of this analysis, they are assumed to besources of pollution and are treated as disamenities. The D&Bdirectories contain street addresses, which we geocoded to approx-imate location of the facilities. If a D&B facility matched a facility inthe TRI, we assigned the location of the D&B facility using the TRIdata.
To measure the concentration of polluting industries by neigh-borhood, we use the Hazards Density Index (HDI) first developedby Bolin et al. (2002). For our analysis, the HDI summarizes theproportion of 800-m (half-mile) buffers from polluting facilitiesthat intersect each census tract. For example, if census tract X con-tains a TRI site and completely contains the 800 m buffer, it wouldhave a HDI score of 1. If 20% of the area of another 800 m bufferfrom an adjacent census tract covered census tract X, its HDI scorewould be 1.2. This method is useful for avoiding a simple containerapproach to hazards mapping. The 800 m buffer has been used inother EJ analyses, including Baltimore (Boone, 2002), as a measureof potential impact. It is an imperfect measure of risk, but itapproximates a measure of living with a disamenity in and aroundone’s neighborhood. Historical census tract boundaries and data(1960–1980) were downloaded from the National Historic GIS(Minnesota Population Center, 2011), while tabular data andboundary files for 1990–2010 were drawn from American Factfind-er website (http://www.factfinder2.census.gov) and the TIGER/lineshapefiles from the US Census Bureau (http://www.census.gov/geo/www/tiger/).
For each decade, we compare the means (t-test) of neighbor-hood demographics (race/ethnicity, educational attainment, familyincome) and housing tenure (renters) with zero and nonzero HDIscores for significant (p < .05) differences. Spearman’s correlationsof demographics and housing tenure with HDI are also generated.
We estimate linear relationships between HDI, socioeconomiccharacteristics, and housing tenure. Land value data, which couldpotentially strengthen the models, were not available over thestudy period. However, we believe that family income, which is in-cluded in our models, is a reasonable if imperfect proxy for landrent. We use regression analysis and ordinary least squares (OLSs)as our baseline methodology deploying HDI as our dependent var-iable. Regression analysis allows us to explore the strength of therelationship between the HDI and a variety of socioeconomic vari-ables such as population, income, and race, testing for each vari-able independently and controlling for the effects of all othervariables. We run OLS for both the full sample of observations(the population of all census tracts across the years in our study)and for a sub-sample of observations that only showcase strictlypositive values for the HDI dependent variable.
For the case of using the full sample of observations (the popu-lation of tracts in the city of Baltimore), the construction of ourdependent variable (HDI) gives rise to a large number of zero
values; that is, tracts with a zero HDI score constitute a significantmajority of our observations while tracts with continuous positivevalues are a minority. While the zero-inflated continuous depen-dent variables are not uncommon in social and natural sciences,this feature of our dependent variable leads us to a specific model-ing approach for this paper. We hypothesize that the data con-struction process introduces the property of heteroskedasticity inour regression error term (the unobservables). That is, one of themain assumptions for OLS, the assumption of constant variancefor the error term is violated. This can be verified by a look atthe plot of standard OLS residuals. Heteroskedasticity leads tothe problem of biased standard error estimates for the regressioncoefficients, but not biased regression coefficients themselves.While the magnitude of a coefficient is not biased, any statisticalsignificance inference is then suspect. We correct for heteroskedas-ticity by utilizing an OLS estimation method of White’s heteroske-dasticity consistent standard errors. We also run our OLSregression excluding all tracts that have a zero HDI score.
For our examination of spatial diffusion patterns of hazardsacross time we use a LISA statistic. A local indicator for spatialassociation (LISA) is any statistic that gives an indication of the ex-tent of statistically significant spatial clustering of similar valuesaround each observation in the sample (Anselin, 1995). We use aLISA to identify local spatial clusters (hotspots) of HDI and trackpotential shifts across time. These hotspots are formed by sets ofadjacent locations for which our LISA is statistically significant. Inorder to detect these hotspots and their spatial diffusion over timein clustered, diffused or random patterns we considered both thelocation of each of our observations and the values of the variableof interest, the HDI in each location and tract in the city ofBaltimore.
Results
Hazard density index and bivariate correlations with socioeconomicdata, 1960–2010
The Dun and Bradstreet directories for 1960 recorded 63 indus-tries that fell under the SIC codes for likely polluting facilities. Forthat year, the Hazards Density Index was highest near the core ofthe city, along the waterfront, and to the east and west of the city(Fig. 1). Census tracts with an HDI score greater than zero tended tohave a higher percentage of low income families, ‘‘nonwhite’’ per-sons, percent renters, and lower percentage of adults with collegedegrees than census tracts with HDI scores of zero. Bivariate corre-lations show that race was not significantly correlated with HDI,but income, educational attainment, and persons renting were.Neighborhoods with a higher percentage of families earning lessthan $1000 and $5000 a year were likely to live in tracts with high-er HDI scores, while neighborhoods with a higher proportion ofpeople in the upper income classes were likely to have lowerHDI scores. Census tracts with a higher percent of persons with ahigh school or college degree were negatively correlated withHDI. Percent renters was positively correlated with HDI.
By 1970, the number of likely polluting facilities within cityboundaries decreased to 46 although 3 others were within 800 mof the city boundary and thus contributed to the HDI of tracts with-in the city. Near downtown the HDI continued to be highest as wellas to the southwest and in the east end. The HDI was also highalong the Jones Falls and railroad corridor to the north of the cen-tral city. Census tracts with an HDI score greater than zero tendedto have a higher percentage of low income families and percentrenters, and a lower percent of high school and college graduatesthan census tracts with an HDI score of zero. Bivariate correlationshows strong and positive correlations between HDI score and per-

Fig. 1. Hazards Density Index for Baltimore City, 1960–2010.
44 C.G. Boone et al. / Cities 36 (2014) 41–49
cent of low income families and percent of adults with 8th gradeeducational attainment. The relationship is significant and nega-tive with percent of high income families and high school and col-lege educational attainment.
By 1980, the number of likely polluting industries increased to77, with only 8 matching those from the 1960 directory. This figureis close to the 82 facilities that were recorded in the first TRI in1987. The match by company names, however, is quite low (5) be-tween the D&B in 1980 and TRI in 1987. Facilities continue to beclustered near downtown and the southwest neighborhoods ofCamden, Carroll, and Pigtown, further south in Fairfield and CurtisBay, and the industrial districts on the eastern edge of the city.Census tracts with an HDI score greater than zero tended to havea lower median family income, a higher percentage of adults withonly an 8th grade education, a lower percentage of high school andcollege educated adults, and a lower percentage of owner occupiedhouses than census tracts with an HDI score of zero. Bivariate cor-relations show a positive and significant relationship between HDIscore and % with 8th grade educational attainment, % white, and %Hispanic, and a negative and significant relationship between HDIscores and % black and % with a college degree.
For 1990, we switched to using the location of TRI sites andthere were 66 within or adjacent to the city boundaries. Notably,TRI facilities were nearly absent in the downtown core or the near-by inner harbor where a decade of redevelopment displaced much
of the ageing industry and warehousing (Olson, 1997). Instead, TRIfacilities were concentrated in the historic industrial areas of Cam-den and Carroll to the southwest, Locust Point, Fairfield, and CurtisBay to the south, and Canton and Pulaski to the east. Census tractsthat had HDI scores greater than zero tended to have higher per-centages of adults with only an 8th grade education, lower per-centages of adults with a college degree, and lower medianfamily incomes than census tracts with an HDI score of zero. Unlikein 1970 or 1980, race variables are significantly different in zeroand nonzero HDI census tracts. By 1990, percent white for censustracts with HDI scores greater than zero is significantly higherand percent black is significantly lower than in census tracts withan HDI score of zero. Correlations show % white and % of adultswith only an 8th grade education positively and significantly corre-lated with HDI and % black, % of adults with a college degree, andmedian family income negatively and significantly correlated withHDI.
In 2000, Baltimore City contained 65 TRI sites. Between 1990and 2000, the HDI declined in the historic industrial neighborhoodsof Camden/Carroll but remained high in the Fairfield, Curtis Bay,and Hawkins Point districts as well as the industrial east end. Cen-sus tracts with an HDI score greater than zero tended to have ahigher percentage of whites, a higher percentage of adults withonly an 8th grade education, and a higher percentage of rentersthan census tracts with an HDI score of zero. HDI was positively

C.G. Boone et al. / Cities 36 (2014) 41–49 45
and significantly correlated with % white, % Hispanic, % 8th gradeeducational attainment, and % owner-occupied houses, and nega-tively and significantly correlated with % African American, % witha college degree, and % renters.
In 2010, there were 42 TRI facilities in Baltimore City. By thistime, facilities were absent from the downtown commercial coreand clustered in the historical industrial zones to the south, east,and west of the city. Census tracts with an HDI score greater thanzero tended to have a higher percentage of whites and lower per-centage of African Americans and a higher percentage of adultswith only an 8th grade education than census tracts with an HDIscore of zero. HDI was positively and significantly correlated with% white, % Hispanic, % with 8th grade educational attainment, andnegatively and significantly correlated with% African American andpercent college educated.
Regressions
We find that our models excluding zero HDI values improveonly slightly in terms of the explanatory power of the modelsacross the six time slices in our sample. Excluding zero HDI tractsfrom the sample also does not lead to substantially different mag-nitudes of estimated coefficients for the variables included in ourspecifications. The models also maintain the general patterns ofstatistical significance of the estimated coefficients. However,other than for 1960 and 2010, the models are relatively weak withr-squared values between 0.10 and 0.17. For 2010, which has thehighest r-squared value (0.45) of all the models, the sign of thecoefficients is similar to the bivariate analysis for that year. Percentblack, percent with a college degree, and median family income areall negative and significant at p < 0.01. For the 1960 model, percentnon-white is negatively associated and percent renters are posi-tively associated with HDI and significant at p < 0.01. As expected,the percentage of higher income families is negatively associatedwith HDI (p < 0.01). Highly educated neighborhoods are negativelyassociated with HDI as expected, but the model also returns a neg-ative coefficient for percentage of adults with less than an 8thgrade education. Model coefficients for median family income, per-cent black, percent college educated, and percent renters from1960 to 2010 are shown in Table 1.
Spatial diffusion
The Moran’s I statistic exhibits a declining trend over time.From a high value of 0.66 in 1960 it declines to 0.34 in 1970, in-creases slightly to 0.38 in 1980, declines again to 0.27 in 1990and to a low of 0.16 in 2000. Thereafter, we see a rise to 0.29 in2010. The declining trajectory in the Moran’s I statistic suggeststhat the spatial arrangement of HDI values moves from a moreclustered pattern to a less clustered pattern, without ever reachinga dispersed pattern. In the last decade reported, we observe areversal of this trend. The decline and rise reflects the general shiftfrom a concentration of facilities near the downtown core in 1960to an eventual re-concentration of facilities in 2010 to the southern
Table 1Selected regression model coefficients for 1960–2010. Hazards Density Index (HDI) is dep
1960 1970
R-squared 0.37 0.10% Black �0.01565** �0.00224% College educated �0.07650* 0.01327% Renters 0.02525** �0.00059Median family income ($10,000s)
* p < 0.05.** p < 0.01.
and eastern extents of the city. The map Fig. 2 shows locations withsignificant local Moran statistics across time and classifies thoselocations by type of spatial association. The spatial autocorrelationat the tract level exhibits an interesting and shifting pattern of spa-tial diffusion between 1960 and 2010. The bright red and dark bluetracks indicate spatial clusters (respectively, high surrounded byhigh, and low surrounded by low). In contrast, the light red andlight blue tracts indicate spatial outliers (respectively, high sur-rounded by low, and low surrounded by high). Between 1960and 1980 there are significant hotspots that are stable across time.The clustered tracks with high HDI associations (hotspots) werefound to cover the central census tracts of Baltimore while severalclusters of tracts with low HDI exist in the west and the northeastof the city. The figures show a structural break in the pattern in theperiod of 1990 and a new spatial pattern begins to form in 2000and 2010. Starting in 1990 the strong high HDI cluster in the centerof the city disappears and a low HDI cluster emerges in the north ofthe city. Several high HDI clusters begin to emerge in the south andeast of the city. By 2000, the high HDI clusters have shifted to thesouth and southeast of the city, and the pattern appears to be sta-ble up to the last year of our observation in 2010.
Discussion
Between 1960 and 2010, the distribution of polluting facilitiesshifted from the core to the eastern and southern peripheries ofthe city. This is apparent from visual interpretation of maps show-ing polluting facilities and from the spatial diffusion analysis. At thesame time, overall density of polluting facilities declined. The meanHDI score for census tracts was highest in 1960 (0.96) and lowest in2010 (0.10), and the number of census tracts without an HDI scoreincreased over time, from 51 (31% of total) in 1960 to 147 (74% oftotal) in 2010. Similar to other cities, the number of TRI facilitiesin Baltimore has been in decline since the 1980s. From 82 facilitiesin 1987, the number declined to 42 in 2010. This may be explainedin part by the marked deindustrialization of Baltimore’s economyand the draw of suburban locations as centers of employmentand industry. Some scholars point to the success of EPCRA forimproving transparency of how toxic substances are used and re-leased, providing an incentive for companies to find alternativesor reduce emissions (Fung & O’Rourke, 2000). The right to knowabout toxic emissions provides data for groups to shame pollutingindustry, and some companies, especially early in the TRI program,saw their stock prices decline with the publication of informationabout their toxic releases (Hamilton, 2005).
The news on overall trends of toxic releases in Baltimore ismixed. Despite the decline in number of TRI facilities in Baltimore,reported releases of toxins were greater in the 2000s than the1990s, increasing from 86 to 222 million pounds. However, whentaking into account the toxicity and fate of releases (using the EPA’sRisk Screening Environmental Indicators) the trend has been nega-tive, with a high score of 27 million in 1987 to 783,000 in 2007.
As the patterns and magnitude of HDI have shifted over time,who has been burdened most? The results show a general transition
endent variable.
1980 1990 2000 2010
0.15 0.17 0.13 0.45�0.01195** �0.01065* �0.00906* �0.00521**
�0.00203 �0.02201 0.00491 �0.01143**
0.01163** 0.00233 0.00111 0.00084�0.00671** 0.0046 �0.00299 �0.00005**
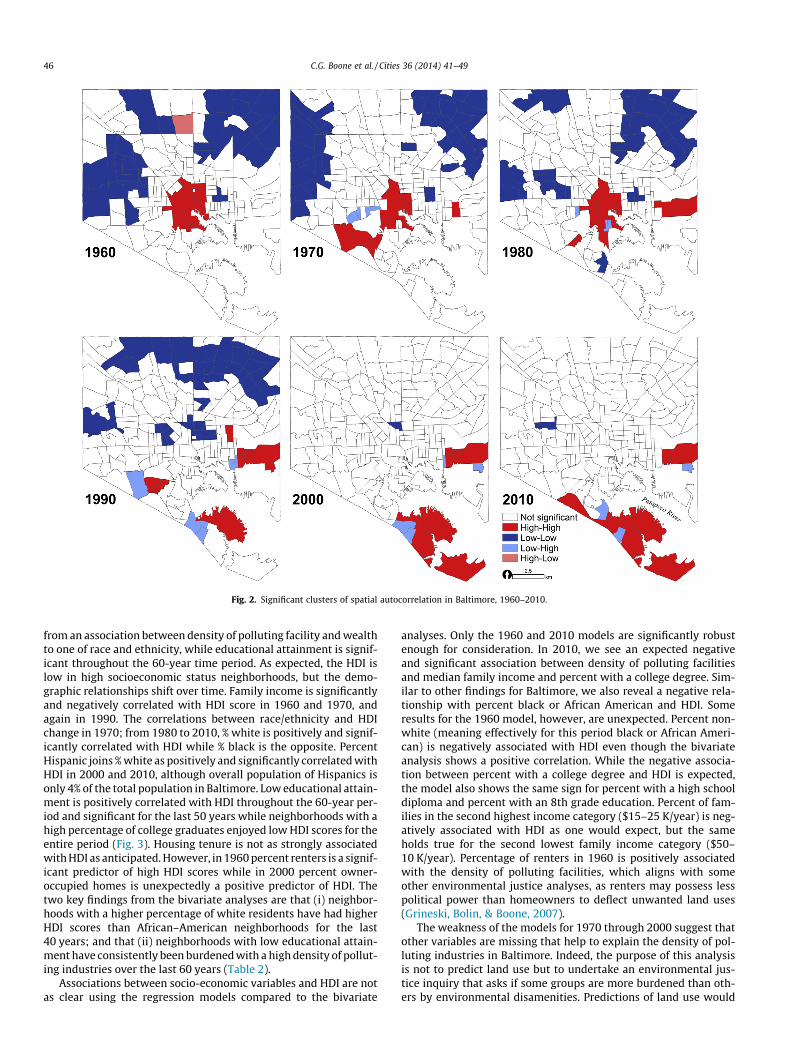
Fig. 2. Significant clusters of spatial autocorrelation in Baltimore, 1960–2010.
46 C.G. Boone et al. / Cities 36 (2014) 41–49
from an association between density of polluting facility and wealthto one of race and ethnicity, while educational attainment is signif-icant throughout the 60-year time period. As expected, the HDI islow in high socioeconomic status neighborhoods, but the demo-graphic relationships shift over time. Family income is significantlyand negatively correlated with HDI score in 1960 and 1970, andagain in 1990. The correlations between race/ethnicity and HDIchange in 1970; from 1980 to 2010, % white is positively and signif-icantly correlated with HDI while % black is the opposite. PercentHispanic joins % white as positively and significantly correlated withHDI in 2000 and 2010, although overall population of Hispanics isonly 4% of the total population in Baltimore. Low educational attain-ment is positively correlated with HDI throughout the 60-year per-iod and significant for the last 50 years while neighborhoods with ahigh percentage of college graduates enjoyed low HDI scores for theentire period (Fig. 3). Housing tenure is not as strongly associatedwith HDI as anticipated. However, in 1960 percent renters is a signif-icant predictor of high HDI scores while in 2000 percent owner-occupied homes is unexpectedly a positive predictor of HDI. Thetwo key findings from the bivariate analyses are that (i) neighbor-hoods with a higher percentage of white residents have had higherHDI scores than African–American neighborhoods for the last40 years; and that (ii) neighborhoods with low educational attain-ment have consistently been burdened with a high density of pollut-ing industries over the last 60 years (Table 2).
Associations between socio-economic variables and HDI are notas clear using the regression models compared to the bivariate
analyses. Only the 1960 and 2010 models are significantly robustenough for consideration. In 2010, we see an expected negativeand significant association between density of polluting facilitiesand median family income and percent with a college degree. Sim-ilar to other findings for Baltimore, we also reveal a negative rela-tionship with percent black or African American and HDI. Someresults for the 1960 model, however, are unexpected. Percent non-white (meaning effectively for this period black or African Ameri-can) is negatively associated with HDI even though the bivariateanalysis shows a positive correlation. While the negative associa-tion between percent with a college degree and HDI is expected,the model also shows the same sign for percent with a high schooldiploma and percent with an 8th grade education. Percent of fam-ilies in the second highest income category ($15–25 K/year) is neg-atively associated with HDI as one would expect, but the sameholds true for the second lowest family income category ($50–10 K/year). Percentage of renters in 1960 is positively associatedwith the density of polluting facilities, which aligns with someother environmental justice analyses, as renters may possess lesspolitical power than homeowners to deflect unwanted land uses(Grineski, Bolin, & Boone, 2007).
The weakness of the models for 1970 through 2000 suggest thatother variables are missing that help to explain the density of pol-luting industries in Baltimore. Indeed, the purpose of this analysisis not to predict land use but to undertake an environmental jus-tice inquiry that asks if some groups are more burdened than oth-ers by environmental disamenities. Predictions of land use would

Fig. 3. Correlation coefficients for socioeconomic variables and HDI in Baltimore,1960–2010. White circles are correlation coefficients that are significant at p < 0.01.
C.G. Boone et al. / Cities 36 (2014) 41–49 47
take into account many other variables—such as land rents, trans-portation infrastructure, raw materials costs, market accessibility,zoning and other regulations—that are well established in indus-
trial location theory and regional science as being important deter-minants. It is possible that more robust land use models thatcontrol for industrial location variables might reveal differencesin burdens between socioeconomic groups. However, this ap-proach faces some formidable hurdles given that such variablesas land rents are imbued with social values, including racism, thatdrive pricing beyond physical characteristics, scarcity, or locationof the land (Pulido, 2000). The same holds true for regulatory struc-tures, such as zoning or transportation planning, that constrain orencourage industrial location (Maantay, 2002). Separating or con-trolling for social values—including bigotry and prejudice—thatare bound up in such seemingly benign things as land rents is amessy business but critically important for exploring causes ofenvironmental injustice.
A second possibility for the weak models is that within thetime-series perspective, we are faced with a longer-term structuralbreak period in terms of explanatory power of the standard vari-ables. Clearly the social and built landscape has changed over the60-year time period. The patterns of polluting industry show sig-nificant shifts from the core of Baltimore to the periphery. Whilethe city remained racially segregated throughout the period, ingeneral African–American neighborhoods expanded from smallerconcentrations to the east and west of downtown, radiating tothe northwest and northeast as well as expanding to the southernfringes of the city. Neighborhoods that remained primarily popu-lated with white residents shrank in number over this period,but included the longstanding industrial districts in Canton tothe east and in and around Curtis Bay to the south. During thesetransitions, and possibility because of the dynamic changes, themodels that incorporate race and ethnicity, income, housing ten-ure, and education proved relatively weak, even though many ofthe bivariate relationships are quite strong and significant.
Sustainability and environmental justice
This study shows that the burden of pollution has been spreadunevenly in Baltimore for a long time. One mechanism for address-ing environmental justice concerns is sustainability planning andimplementation. Equity is a core principle of sustainability (Vuce-tich & Nelson, 2010). Although equity for future generations isemphasized more in conceptualizations of sustainability thanequity for present populations, environmental justice can andshould contribute to sustainability plans and goals (Agyeman, Bul-lard, & Evans, 2003; Boone, 2010).
In 2009, the Baltimore City Council approved the Baltimore CitySustainability Plan. It includes 29 goals within the 7 key themes ofcleanliness, pollution prevention, resource conservation, greening,transportation, education & awareness, and green economy. Someof the goals have specific metrics or objectives, such as doublingtree canopy cover by 2037 or reducing the city’s energy use by15% by 2015, while others are aspirational, such as improving pub-lic transit services. All of the goals are tied to specific strategies. Forinstance, one strategy for improving public transit is to implementtransit signal priority systems to increase speeds and on-time per-formance of buses.
Transportation is the only theme in the plan where equity is ad-dressed explicitly. The fourth goal of the transportation theme is to‘‘measure and improve the equity of transportation’’ (City of Balti-more, 2009, p. 93). Strategies include measuring disparities oftransportation costs relative to income by neighborhoods, the cur-rent quality of transit service in neighborhoods with low vehicleownership, and exploring programs to improve car-sharing, walk-ability, and other transportation alternatives to reduce inequities.
On the issue of pollution prevention, germane to this paper, oneof the goals is to ‘‘reduce risk from hazardous materials’’ but thereis no mention of the uneven pollution burdens by neighborhood

Table 2Significant characteristics of census tracts with high and low Hazards Density Index(HDI) scores from 1960 to 2010.
Year High HDI Low HDI
1960 Lower income, renters Higher income, high school andcollege educated adults
1970 Lower income, 8th gradeeducation
Higher income, high school andcollege educated adults
1980 Lower income, 8th gradeeducation
Higher income, high school andcollege educated adults, owner-occupied houses
1990 White, 8th grade education,lower income
African American, college educated,higher income
2000 White, Hispanic, 8th gradeeducation, owner-occupiedhouses
African American, college educated,renters
2010 White, Hispanic, 8th gradeeducation
African American, college educated
48 C.G. Boone et al. / Cities 36 (2014) 41–49
(City of Baltimore, 2009, p. 50). However, the plan does recognizethat asthma rates are highest for children in ‘‘lower socioeconomicareas’’ (City of Baltimore, 2009, p. 52). Environmental justice israised in the section on minimizing production of waste, specifi-cally that landfills are ‘‘a serious environmental justice issue be-cause. . .most are placed in or near lower income communities’’(City of Baltimore, 2009, p. 63). However, there are no referencesto inequities by race or ethnicity even though these are fundamen-tal elements of environmental justice inquiries. Indeed, the plan in-cludes a definition of environmental justice in its glossary thatmakes reference to ‘‘the fair treatment of people of all races, cul-tures, incomes, and educational levels’’ and that fairness means‘‘no population should be forced to shoulder a disproportionateshare of exposure to the negative effects of pollution due to lackof political or economic strength’’ (City of Baltimore, 2009, p.127). Clearly, race and ethnicity can be sensitive subjects, espe-cially in cities like Baltimore that have a long history of racial injus-tice (McDougall, 1993). Rather than focus on inequities by race orethnicity, the report focuses on the overall benefit that can accruefrom efforts to reduce pollutants. ‘‘All who live, work, and visit inBaltimore’’, the plans states, ‘‘would benefit from a concerted effortto reduce the presence of hazardous materials in our environment’’(City of Baltimore, 2009, p. 50). Improving lives of all Baltimoreansand visitors is a laudable goal. However, a sustainability planguided by justice principles would commit to targeting efforts firstat populations and neighborhoods that have had to bear the bruntof pollution over the last 60 years, especially vulnerable popula-tions with low educational attainment.
It is important to note that environmental justice is as muchabout fairness of process as outcome (Boone, 2008a, 2008b; Young,1990). While Baltimore’s plan is not very explicit on environmentaljustice as an outcome, the process of creating the sustainabilityplan was inclusive. The Baltimore Office of Sustainability and theCommission on Sustainability developed the plan with an empha-sis on public engagement, providing multiple opportunities forcommunity priorities to be heard. In addition to seeking input fromcity agency personnel and sustainability experts, the public wereengaged through community meetings, a youth forum, providingfeedback to working groups, and a final sustainability forum.
Conclusion
Environmental inequity is a persistent phenomenon in Balti-more. From 1960 to 2010, the density of polluting facilities has re-mained high in neighborhoods with low educational attainment.The multivariate regressions for 2010 show a negative relationshipbetween density of polluting industry and the percent of residents
with a college degree but the relationship with low educationalattainment is not significant. The regression models for 1960 alsoshow a negative and significant relationship between HDI and col-lege education residents but curiously we see the same sign andsignificant result for all levels of education. In 1960, 1970, and1990 the density of polluting industry was significantly and nega-tively correlated with income. The 2010 regression model alsoshows a negative and significant relationship between incomeand HDI but the 1960 model shows the same for both a lowerand higher income category.
For the last 40 years, the density of polluting facilities has beenhigher in white than black neighborhoods. The 2010 regressionmodel confirms a strong negative relationship between percentblack or African American and HDI. This analysis supports earlierstudies on Baltimore that show that percent white is a key variablein explaining the presence of toxic industry (Boone, 2002, 2008a,2008b; Downey, 2007). However, using the Hazards Density Index,this study reveals that educational attainment is a significant cor-relate and explanatory variable for the density of polluting facili-ties in Baltimore neighborhoods. The persistent association ofpolluting facilities and low educational attainment is troubling gi-ven that education is an important resource for comprehendingand reacting to risk (Polsky, Neff, & Yarnal, 2007).
Sustainability plans offer an opportunity for municipalities toaddress inequities in a comprehensive, systematic manner. Balti-more’s sustainability plan acknowledges environmental justice asa sustainability concern but does not explicitly address present-day or long standing inequities of environmental burdens byneighborhood or demographics. Creating a sustainable Baltimorehas the potential to improve the lives of all Baltimoreans, but ame-liorating enduring inequities should be a priority if the justice prin-ciples of sustainability are taken seriously. Sustainability is neithercredible nor operational without specific attention to justice,including empirical bases of understanding distributive justicesuch as those offered in this study.
Acknowledgements
Research for this article was supported through awards fromthe National Science Foundation Long-Term Ecological ResearchProgram (DEB-1027188) and the National Science Foundation Hu-man and Social Dynamics Program (SBE-HSD 0624159).
References
Agyeman, J., Bullard, R. D., & Evans, B. (2003). Just sustainabilities: Development in anunequal world. Cambridge: The MIT Press.
Andra, S. S., Sarkar, D., Datta, R., & Saminathan, S. (2006). Lead in soils in paintcontaminated residential sites at San Antonio, Texas, and Baltimore, Maryland.Bulletin of Environmental Contamination and Toxicology, 77(5), 643–650.
Anselin, L. (1995). Local Indicators of Spatial Association – LISA. GeographicalAnalysis, 27, 93–116.
Baltimore Regional Planning Council. (1958). The Baltimore region: a look at thefuture–summary of technical reports nos. 1–4. Maryland State PlanningCommission, Report no. 1.
Bolin, B., Nelson, A., Hackett, E. J., Pijawka, K. D., Scott, C., Sicotte, D., Sadalla, E. K.,Matran, E., & O’Donnell, M. (2002). The ecology of technological risk in a Sunbeltcity. Environment and Planning A, 34(2), 317–339.
Boone, C. G. (2002). An assessment and explanation of environmental inequity inBaltimore. Urban Geography, 23(6), 581–595.
Boone, C. G. (2008a). Improving resolution of census data in metropolitan areasusing a dasymetric approach: Applications for the Baltimore Ecosystem Study.Cities and the Environment 1, 1: article 3. http://digitalcommons.lmu.edu/cate/vol1/iss1/3.
Boone, C. G. (2008b). Environmental justice as process and new avenues forresearch. Environmental Justice, 1(3), 149–154.
Boone, C. G. (2010). Environmental justice, sustainability and vulnerability.International Journal of Urban Sustainable Development, 2(1–2), 135–140.
Bowen, W. M. (2002). An analytical review of environmental justice research: Whatdo we really know? Environmental Management, 29(1), 3–15.

C.G. Boone et al. / Cities 36 (2014) 41–49 49
Bowen, W. M., Salling, M. J., Haynes, K. E., & Cyran, E. J. (1995). Towardenvironmental justice: Spatial equity in Ohio and Cleveland. Annals of theAssociation of American Geographers, 85(4), 641–663.
Brulle, R. J., David, N., & Pellow, D. N. (2006). Environmental justice: Human healthand environmental inequalities. Annual Review of Public Health, 27(102),103–124.
Buckley, G. L., Boone, C. G. (2011). To promote the material and moral welfare of thecommunity: Neighborhood Improvement Associations in Baltimore, Maryland,1900–1945. In Rodger, R., Massard-Guilbaud, G. (Eds.). Environmental and SocialJustice in the City: Historical Perspectives. Cambridge: White Horse Press, pp. 43–65.
Bullard, R. D. (1990). Dumping in dixie: Race, class and environmental quality.Westview: Boulder.
Bullard, R. D. (1996). Environmental justice: It’s more than waste facility siting.Social Science Quarterly, 77, 493–499.
City of Baltimore (2005). The Baltimore Sustainability Plan. Available online: http://www.baltimorecity.gov/Portals/0/agencies/planning/sustainability/public%20downloads/051509_BCS-001SustainabilityReport.pdf.
Downey, L. (2005). The unintended significance of race: Environmental racialinequality in Detroit. Social Forces, 83(3), 971–1007.
Downey, L. (2007). US metropolitan-area variation in environmental inequalityoutcomes. Urban Studies, 44(5), 953–977.
Downey, L., & Hawkins, B. (2008). Race, income, and environmental inequality inthe United States. Sociological Perspectives, 51(4), 759–781.
Fung, A., & O’Rourke, D. (2000). Reinventing environmental regulation from thegrassroots up: Explaining and expanding the success of the toxics releaseinventory. Environmental Management, 25(2), 115–127.
Gandy, M. (2002). Concrete and clay: Reworking nature in New York City. Cambridge:MIT Press.
Grineski, S., Bolin, B., & Boone, C. G. (2007). Criteria air pollution and marginalizedpopulations: Environmental inequity in Metropolitan Phoenix, Arizona, USA.Social Science Quarterly, 88(2), 535–554.
Hamilton, J. T. (2005). Regulation through revelation: The origin, politics, and impactsof the Toxics Release Inventory Program. New York: Cambridge University Press.
Hynes, H. P., & Lopez, R. (2007). Cumulative risk and a call for action inenvironmental justice communities. Journal of Health Disparities Research andPractice, 1(2), 29–57.
Krieg, E. J. (2005). Race and environmental justice in Buffalo, NY: A ZIP code andhistorical analysis of ecological hazards. Society & Natural Resources, 18,199–213.
Landry, S. M., & Chakraborty, J. (2009). Street trees and equity: Evaluating thespatial distribution of an urban amenity. Environment and Planning A, 41,2651–2670.
Lord, C. L., & Norquist, K. N. (2010). Cities as emergent systems: Race as a rule inorganized complexity. Environmental Law, 40, 551–597.
Maantay, J. (2002). Zoning law, health, and environmental justice: What’s theconnection. Journal of Law Medicine & Ethics, 30, 572–593.
Maantay, J., & Maroko, M. (2009). Mapping urban risk: Flood hazards, race, andenvironmental justice in New York. Applied Geography, 29(1), 111–124.
McDougall, H. A. (1993). Black Baltimore: A new theory of community. Philadelphia:Temple University Press.
Minnesota Population Center (2011). National Historical Geographic InformationSystem: Version 2.0. Minneapolis, MN: University of Minnesota. <http://www.nhgis.org>.
Mohai, P., & Saha, R. (2007). Racial inequality in the distribution of hazardouswaste: A national-level reassessment. Social Problems, 54(3), 343–370.
Olson, S. H. (1997). Baltimore: The building of an American city. Baltimore: The JohnsHopkins University Press.
Orser, W. E. (1994). Blockbusting in Baltimore: The Edmondson village story.Lexington: University of Kentucky Press.
Osiecki, K. M., Seijeoung, K., Ifeanyi, B. C., & Calhoun, E. A. (2013). Utilizingexploratory spatial data analysis to examine health and environmentaldisparities in disadvantaged neighborhoods. Environmental Justice, 6(3), 81–87.
Polsky, C., Neff, R., & Yarnal, B. (2007). Building comparable global changevulnerability assessments: The vulnerability scoping diagram. GlobalEnvironmental Change, 17(3–4), 472–485.
Power, G. (1983). Apartheid Baltimore style: The residential segregation ordinancesof 1910–1913. Maryland Law Review, 42, 289–328.
Pulido, L. (2000). Rethinking environmental racism: White privilege and urbandevelopment in Southern California. Annals of the Association of AmericanGeographers, 90(1), 12–40.
Romley, J. A., Cohen, D., Ringel, J., & Sturm, R. (2007). Alcohol and environmentaljustice: The density of liquor stores and bars in urban neighborhoods in theUnited States. Journal of Studies on Alcohol, 68(1), 48–55.
Schlosberg, D. (2007). Defining environmental justice: Theories, movements, andnature. Oxford: Oxford University Press.
Schwarz, K., Pickett, S. T. A., Lathrop, R. G., Weathers, K. C., Pouyat, R. V., &Cadenasso, M. L. (2012). The effects of the urban built environment on thespatial distribution of lead in residential soils. Environmental Pollution, 163,32–39.
Sobotta, R. R., Campbell, H. E., & Owens, B. J. (2007). Aviation noise andenvironmental justice: The barrio barrier. Journal of Regional Science, 47(1),125–154.
Vucetich, J. A., & Nelson, M. P. (2010). Sustainability: Virtuous or Vulgar? BioScience,60(7), 539–544.
Young, I. M. (1990). Justice and the politics of difference. Princeton, NJ: PrincetonUniversity Press.
Zhou, X., Boone, C. G., Shock, E. (2012). Soil lead distribution and environmentaljustice in the Phoenix metropolitan region. Environmental Justice.