A LITERATURE REVIEW OF CLIMATE CHANGE AND URBAN …
74
Southern Illinois University Carbondale OpenSIUC Research Papers Graduate School Spring 5-2017 A LITETURE REVIEW OF CLIMATE CHANGE AND URBAN SUSTAINABILITY Julia L. Sanabria Southern Illinois University Carbondale, [email protected] Follow this and additional works at: hp://opensiuc.lib.siu.edu/gs_rp is Article is brought to you for free and open access by the Graduate School at OpenSIUC. It has been accepted for inclusion in Research Papers by an authorized administrator of OpenSIUC. For more information, please contact [email protected]. Recommended Citation Sanabria, Julia L. "A LITETURE REVIEW OF CLIMATE CHANGE AND URBAN SUSTAINABILITY." (Spring 2017).
Transcript of A LITERATURE REVIEW OF CLIMATE CHANGE AND URBAN …
Southern Illinois University CarbondaleOpenSIUC
Research Papers Graduate School
Spring 5-2017
A LITERATURE REVIEW OF CLIMATECHANGE AND URBAN SUSTAINABILITYJulia L. SanabriaSouthern Illinois University Carbondale, [email protected]
Follow this and additional works at: http://opensiuc.lib.siu.edu/gs_rp
This Article is brought to you for free and open access by the Graduate School at OpenSIUC. It has been accepted for inclusion in Research Papers byan authorized administrator of OpenSIUC. For more information, please contact [email protected].
Recommended CitationSanabria, Julia L. "A LITERATURE REVIEW OF CLIMATE CHANGE AND URBAN SUSTAINABILITY." (Spring 2017).
A LITERATURE REVIEW OF CLIMATE CHANGE AND URBAN SUSTAINABILITY
By
Julia L. Sanabria
B.S., University of Iowa, 2014
A Research Paper Submitted in Partial Fulfillment of the Requirements for the
Master of Science
Department of Geography and Environmental Resources in the Graduate School
Southern Illinois University Carbondale May 2017
RESEARCH PAPER APPROVAL
A LITERATURE REVIEW OF CLIMATE CHANGE AND URBAN SUSTAINABILITY
By
Julia L. Sanabria
A Research Paper Submitted in Partial
Fulfillment of the Requirements
for the Degree of
Master of Science
in the field of Geography and Environmental Resources
Approved by:
Dr. Leslie A. Duram, Chair
Dr. Julie Weinert
Audrey Wagner
Graduate School Southern Illinois University Carbondale
April 4, 2017
i
AN ABSTRACT OF THE RESEARCH PAPER OF
JULIA L. SANABRIA, for the Master of Science degree in GEOGRAPHY AND ENVIRONMENTAL RESOURCES, presented on April 4, 2017, at Southern Illinois University Carbondale. TITLE: A LITERATURE REVIEW OF CLIMATE CHANGE AND URBAN SUSTAINABILITY MAJOR PROFESSOR: Dr. Leslie A. Duram
Cities are vulnerable to climate change, but they are also uniquely positioned to
lead the way in both mitigating and adapting to it. While there is no single solution to
climate change, cities have a responsibility to transition toward a more sustainable
future. This paper examines current literature in climate change and sustainability in
urban areas through a discussion of the urban heat island effect, human health, natural
hazards, urbanization trends, socioeconomic factors, urban energy, water and
wastewater, public transportation, waste management, green infrastructure and
governance. The paper has three key goals: (1) to examine how climate change is
affecting urban areas; (2) to assess how cities can enhance urban sustainability by
addressing climate change; (3) to discuss resources available for city leaders wanting to
transition to a sustainable city. These objectives are addressed using a literature review
and includes examples of current sustainable initiatives in cities. The paper concludes
with a discussion of limitations, recommendations, and future research in sustainable
cities.

ii
DEDICATION
This work is dedicated to my adviser, Dr. Leslie A. Duram, and research
committee, Dr. Julie Weinert and Audrey Wagner, who have provided me with guidance
and support. Thank you for your time and energy invested in my studies. You have all
been a positive presence in my life.
iii
ACKNOWLEDGMENTS
I have endless gratitude for the faculty, staff, and my colleagues at both the
Geography & Environmental Resources Department and SIU Sustainability. I want to
express my appreciation to my Department Chair, Justin Schoof, as well as
Sustainability Coordinator, Geory Kurtzhals, for fostering professional atmospheres full
of enthusiasm and encouragement. Both offices have provided me with a safe space to
work and grow in. I also want to thank my family for constantly challenging and
supporting me throughout my life. Lastly, a special thanks to Aleesandria Gonzalez and
Mercedes Gomez for the many brainstorming sessions and our time spent in the office
getting through it all together.
iv
TABLE OF CONTENTS
CHAPTER PAGE
ABSTRACT ..................................................................................................................... i
DEDICATION .................................................................................................................. ii
ACKNOWLEDGMENTS ................................................................................................. iii
LIST OF TABLES ............................................................................................................ v
LIST OF FIGURES .......................................................................................................... vi
CHAPTERS
CHAPTER 1 – Introduction ................................................................................... 1
CHAPTER 2 – How does climate change affect urban areas? ............................. 4
CHAPTER 3 – How can cities mitigate and adapt to climate change to enhance
urban sustainability? ........................................................................................... 14
CHAPTER 4 – Governance and Resources for Cities ........................................ 35
CHAPTER 5 – Discussion and Conclusion ........................................................ 44
REFERENCES .............................................................................................................. 52
APPENDICES
APPENDIX A ...................................................................................................... 61
APPENDIX B ...................................................................................................... 63
VITA ........................................................................................................................... 64

v
LIST OF TABLES
TABLE PAGE
Table 1 .......................................................................................................................... 38
Table 2 .......................................................................................................................... 43

vi
LIST OF FIGURES
FIGURE PAGE
Figure 1 ........................................................................................................................... 3
Figure 2 ........................................................................................................................... 6
Figure 3 ......................................................................................................................... 11
Figure 4 ......................................................................................................................... 13
Figure 5 ......................................................................................................................... 25
1
CHAPTER 1
INTRODUCTION
1.1 Background
Cities represent the majority of the global population and are the source of most
of the world’s greenhouse gas emissions (Stone, Vargo and Habeeb 2012; Macomber
2013; McCarthy, Best and Betts 2010; Rosenzweig et al. 2011a; World Economic and
Social Survey 2013). The heightened uncertainties of global and regional climate
change call for cities to incorporate sustainability into their current and long-term growth
and development plans. This paper will discuss urban sustainability in the context of
climate change and address the following research objectives: (1) to examine how
climate change is affecting urban areas; (2) to assess how cities can enhance urban
sustainability by addressing climate change; (3) to discuss resources available for city
leaders to transition to a sustainable city. These objectives are addressed using an in-
depth literature review and will include examples of current sustainable initiatives in
cities.
The first objective is to address how climate change affects cities specifically,
because responding to climate change in cities will require a knowledge-based
approach. This section (Chapter 2) demonstrates the degree of urgency in which these
challenges must be addressed through a discussion of the ‘urban heat island’ effect,
human health, natural hazards, and other topics. The second objective is to discuss the
ability of cities to aid the world in mitigating climate change through sustainable urban
practices. This section (Chapter 3) defines ‘urban sustainability’ and discusses five city
sectors within the context of climate change and urban sustainability: energy, water and
2
wastewater, transportation, waste management, and green infrastructure. The following
chapter (Chapter 4) discusses governance and resources currently available to city
representatives and planners. Finally, the paper concludes with a discussion of
recommendations, limitations and future research.
There are two appendices included at the end of this document. Appendix A
provides some definitions for basic terms used throughout the paper. Appendix B
includes a list of abbreviations also used in the paper.
1.2 Significance of Study
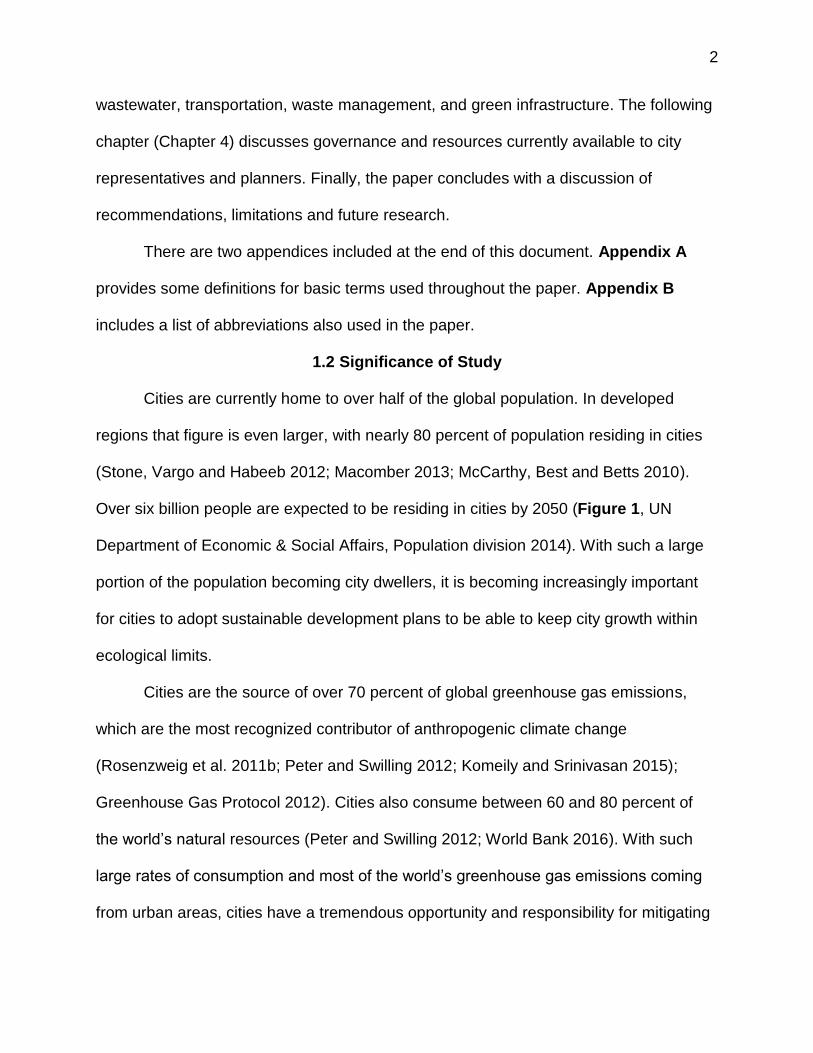
Cities are currently home to over half of the global population. In developed
regions that figure is even larger, with nearly 80 percent of population residing in cities
(Stone, Vargo and Habeeb 2012; Macomber 2013; McCarthy, Best and Betts 2010).
Over six billion people are expected to be residing in cities by 2050 (Figure 1, UN
Department of Economic & Social Affairs, Population division 2014). With such a large
portion of the population becoming city dwellers, it is becoming increasingly important
for cities to adopt sustainable development plans to be able to keep city growth within
ecological limits.
Cities are the source of over 70 percent of global greenhouse gas emissions,
which are the most recognized contributor of anthropogenic climate change
(Rosenzweig et al. 2011b; Peter and Swilling 2012; Komeily and Srinivasan 2015);
Greenhouse Gas Protocol 2012). Cities also consume between 60 and 80 percent of
the world’s natural resources (Peter and Swilling 2012; World Bank 2016). With such
large rates of consumption and most of the world’s greenhouse gas emissions coming
from urban areas, cities have a tremendous opportunity and responsibility for mitigating
3
climate change by reducing their emissions and levels of consumption (Peter and
Swilling 2012; Stone 2012).
Figure 1: Percent of world population living in cities from 1950-2050. (Source: UN
Department of Economic & Social Affairs, Population Division. 2014.)
4
CHAPTER 2
HOW DOES CLIMATE CHANGE AFFECT URBAN AREAS?
2.1 Introduction
This chapter will briefly discuss how global climate change impacts urban areas
with regard to the ‘urban heat island’ effect, human health, natural disasters,
urbanization trends and socioeconomic factors.
2.2 The Urban Heat Island Effect
Cities tend to be hotter than their surrounding suburbs and rural areas because
of heat absorption and retention as a consequence of impervious surfaces, such as
concrete, and dense populations. The reduced amount of vegetation and impermeable
surfaces, both of which provide evaporative cooling, plays a role as well. This results in
what is known as the ‘urban heat island’ effect, which is a warming effect in the
atmosphere surrounding urbanized areas (McCarthy, Best and Betts 2010). According
to the Urban Climate Change Research Network, “average temperatures [in urban
areas] are projected to increase by between 1 and 4 degrees Celsius by the
2050s”(Rosenzweig et al. 2011a). This added warming from the urban heat island effect
makes cities even more vulnerable to climate change, subjecting them to hotter, longer,
and more frequent heat waves (Rosenzweig et al. 2011a).
One way to measure the urban heat island effect in local areas is to use remote
sensing to monitor thermal radiation in cities. In remote sensing, sensors on airplanes or
satellites are used to collect data in the form of radiation intensity (Dempsey 2011). The
remotely sensed data is then integrated within a Geographic Information System (GIS)
to analyze the data to create an effective image of the urban heat island for the study
5
area. Individual cities could do this to get a better understanding of the urban heat
island effect as if pertains to their own urban micro-climates.
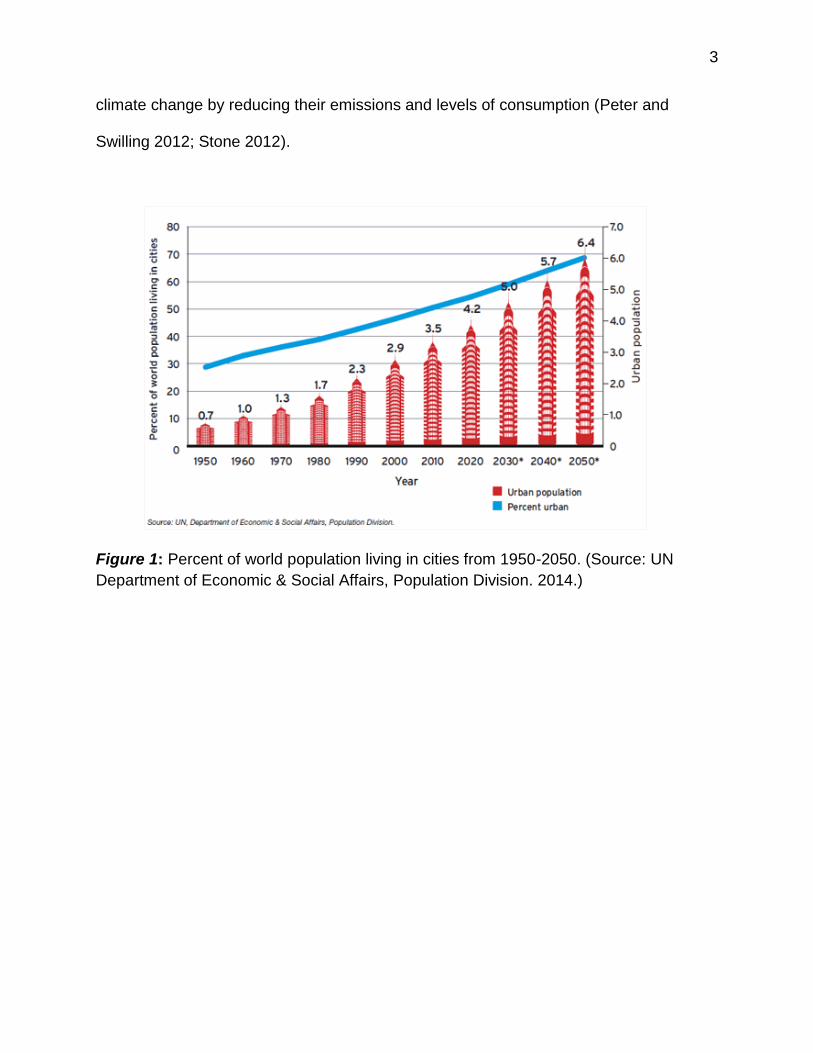
For example, in a report by Climate Central, analyzed temperature data collected
from both urban and rural stations between 1970 and 2013 were collected for 60 U.S
cities (Kenward et al. 2014). Stations were set up in cities with complete data records
and paired with three rural stations nearby for comparison. The report found that 57
cities had measurable urban heat island effects over the past 10 years. Of the 60 cities,
Louisville, Kentucky has shown to be one of the most intense urban heat islands in the
entire U.S. (See Figure 2). Louisville ranked in the top ten for categories such as: most
intense urban heat islands (2004-2013), most intense overnight urban heat islands
(2004-2013), most days above 90°F compared to nearby rural areas, and cities with
fastest growing urban heat islands (Kenward et al. 2014).
While many regions, rural or urban, are experiencing warming trends, localized
effects from urbanization and the urban heat island effect will increase thermal stress
and vulnerability considerably more in urban areas than in their rural counterparts. It is
crucial for cities to measure the impacts of both large-scale and local drivers of climate
change in their own urban environments, recognizing that these effects should not be
treated independently (McCarthy, Best and Betts 2010). Acquiring better knowledge
about the degree to which the urban heat island is affecting their city will aid planners in
responding more appropriately.
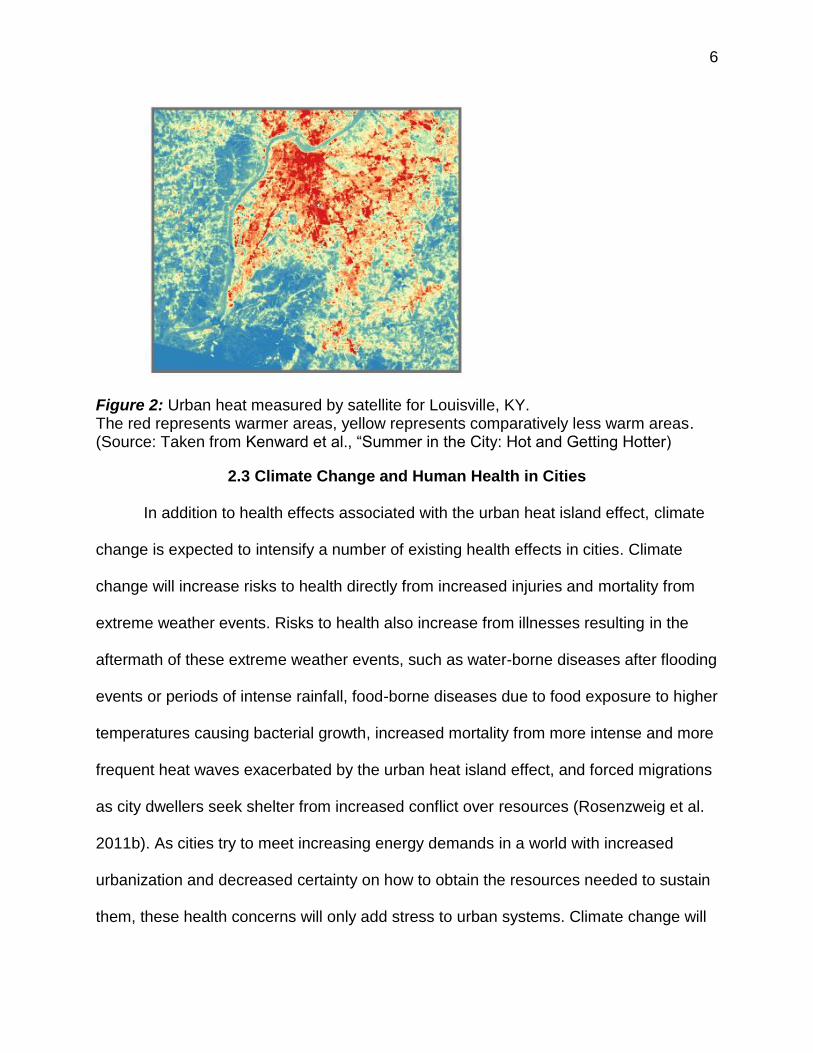
6
Figure 2: Urban heat measured by satellite for Louisville, KY. The red represents warmer areas, yellow represents comparatively less warm areas. (Source: Taken from Kenward et al., “Summer in the City: Hot and Getting Hotter)
2.3 Climate Change and Human Health in Cities
In addition to health effects associated with the urban heat island effect, climate
change is expected to intensify a number of existing health effects in cities. Climate
change will increase risks to health directly from increased injuries and mortality from
extreme weather events. Risks to health also increase from illnesses resulting in the
aftermath of these extreme weather events, such as water-borne diseases after flooding
events or periods of intense rainfall, food-borne diseases due to food exposure to higher
temperatures causing bacterial growth, increased mortality from more intense and more
frequent heat waves exacerbated by the urban heat island effect, and forced migrations
as city dwellers seek shelter from increased conflict over resources (Rosenzweig et al.
2011b). As cities try to meet increasing energy demands in a world with increased
urbanization and decreased certainty on how to obtain the resources needed to sustain
them, these health concerns will only add stress to urban systems. Climate change will
7
also increase risks to health indirectly and more discretely via respiratory illnesses from
poor air quality and increased allergens related to changes in temperature, precipitation,
and the buildup of smog from commercial and industrial practices (Barata et al. 2011;
Barnes et al. 2013).
As climate change continues to impact cities, it is becoming increasingly
important for physicians and all members of the healthcare system to be aware of the
increased risks to human health in cities, and anticipate climate change related
consequences to health so that they may incorporate this information into healthcare
systems (Barnes et al. 2013). For example, hot days, particularly those that reach over
90°F, are associated with poor air quality from increased ozone pollution levels, which
have serious health impacts and can increase asthma attacks, heart attacks, and heat
stroke (Kenward et al. 2014). This information will provide physicians with a better
understanding of the possible health risks in their area, allowing them to anticipate their
patients’ needs and make recommendations for improvements in outdoor and indoor air
quality (Barnes et al. 2013).
2.4 The Intersection of Climate Change and Natural Hazards in Cities
City infrastructure will be tested by increased extreme weather events such as
storms, flooding, hurricanes, and high winds. The increased frequency of these events
will have direct impacts on availability of food and water, human health, and facility
operations (Rosenzweig et al. 2011b). Drought conditions aggravated by climate
change will exert added stress on cities; especially those who import their water or rely
on remote sources to meet their demands. Because these events have the potential to
increase exposure to urban risks, disaster reduction strategies executed by city
8
planners will need to include these observed uncertainties with climate risks into their
adaptation plans (Rosenzweig et al. 2011b).
Short and medium term effects will be felt via increased variability and increased
frequency and intensity of extreme events. Long-term effects need to be considered as
well in order for cities to strategize for climate change adaptation and risk reduction
(Rosenzweig et al. 2011b). As urbanization continues, difficult decisions in urban
planning and development will be driven by resource availability and demand. For
example, as drought conditions intensify in the western part of the United States, it may
no longer be sustainable to rely on these lands for water intensive agricultural use.
Overdrawing of freshwater sources along coastlines can result in salt-water intrusion,
which damages crops and is even more costly to fix.
In certain areas, it will also be necessary to put a greater emphasis on health
risks and safety at the regional level; for example, coastal cities face the impending
consequences of sea level rise and flooding. A response to these threats could include
retrofits to buildings and homes to make them more resilient to natural hazards, or
ensuring proper building codes are utilized in the future. Therefore, the healthcare
community must adapt by anticipating needs and adopting practices that incorporate
changing environmental conditions and the associated increased risks (Barnes et al.
2013; Barata et al. 2011).
Often, natural hazards can be difficult to directly attribute to global or regional
climate change, but there is no doubt that when disasters occur in the human built
environment that the consequences can be drastic. The science of attributing natural
hazards to global and regional climate change is so complex, in part because of their
9
unpredictable nature, but mostly because there are countless direct and indirect
manifestations and observations of climate change in cities that are laborious to
measure. However, as urbanization and the built environment continues to expand,
vulnerability and risk exposure will increase in urban areas. The combination of larger
and denser populations with increased infrastructure such as buildings and roads
means that when a disaster does strike in cities it has a greater potential to cause more
damage, putting essential facilities out of operation. This will be costly in both monetary
value and human lives. Therefore, it is crucial to human health and well-being that
disaster reduction plans include the management of these negative consequences of
climate change (Blake et at. 2011).
Unsafe and unregulated urban development is another factor that when
combined with climate variability can have disastrous outcomes. According to the UN
Integrated Strategy for Disaster Reduction global assessment report, “the future
expected annual losses in the built environment resulting from disasters such as
earthquakes, tsunamis, cyclones and flooding are expected to rise from roughly USD
300 billion to USD 415 billion by 2030” (World Bank 2015). Fortunately, large strides
have been made in legislation for building codes, development and maintenance in
recent decades in more developed areas. However, local implementation can still be
improved. While this paper focuses on cities from more developed countries, it is
important to note that many areas in less developed regions are still relying on unsafe
and unregulated building structures and will likely experience greater disaster-related
fatalities because of it.
“In the last decade, low- and middle-income countries have experienced 53
percent of all disasters globally—but have accounted for 93 percent of disaster-
10
related fatalities. This disproportionate impact stems in large part from unsafe
and unregulated urban development.” (World Bank 2015).
It is important to acknowledge these observed differences between less and
more developed countries when addressing the needs of individual cities. As the world
undergoes a major urban development boom due to rapid urbanization, taking place
simultaneously with increased climate-related hazards, the hope is that cities
everywhere will put a focus on safety (World Bank 2015).
2.5 Urbanization Trends
Urbanization can take place in two main ways; either the inner city expands or
rural communities grow to become more urbanized. Cities are currently home to over
half of the global population, with over 6 billion city dwellers projected worldwide by
2050 (See Figure 1) (Stone, Vargo and Habeeb 2012; Macomber 2013; McCarthy, Best
and Betts 2010). One of the biggest appeals for urbanization is that cities provide a
locational advantage for jobs with more efficient public transportation. Other appeals to
city life include the opportunity for a greener lifestyle through the availability and closer
proximity of goods and services, and increased social interaction.
The added opportunities and amenities of city life have appealed to so many in
recent years that for the first time in almost a century the rate of urban population
growth is outpacing the suburbs (Peter and Swilling 2012). According to the World
Economic and Social Survey 2013, “Urban population growth is expected to continue
setting the pace of world population growth, and in the next 10-15 years, for the first
time in history, the world rural population is expected to decline” (World Economic and
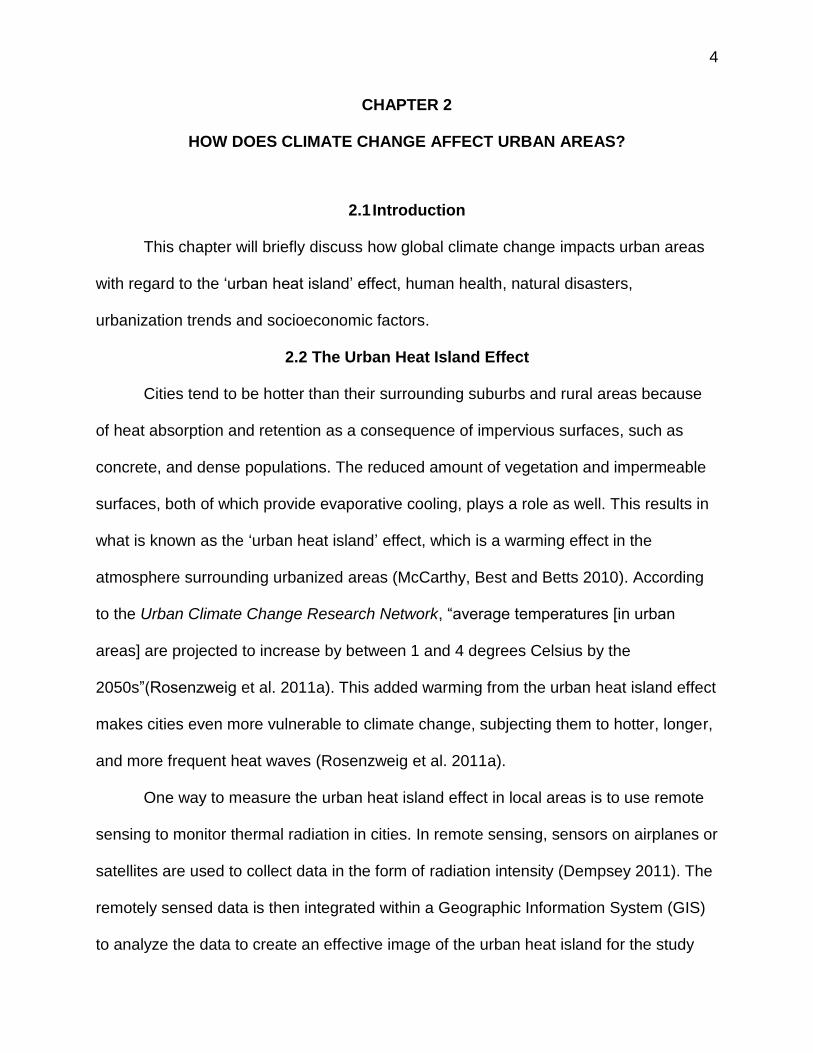
Social Survey 2013). For example, the pace of population growth in the U.S. is actually
slowing, however, population size in urban areas is still increasing (CBRE Global
11
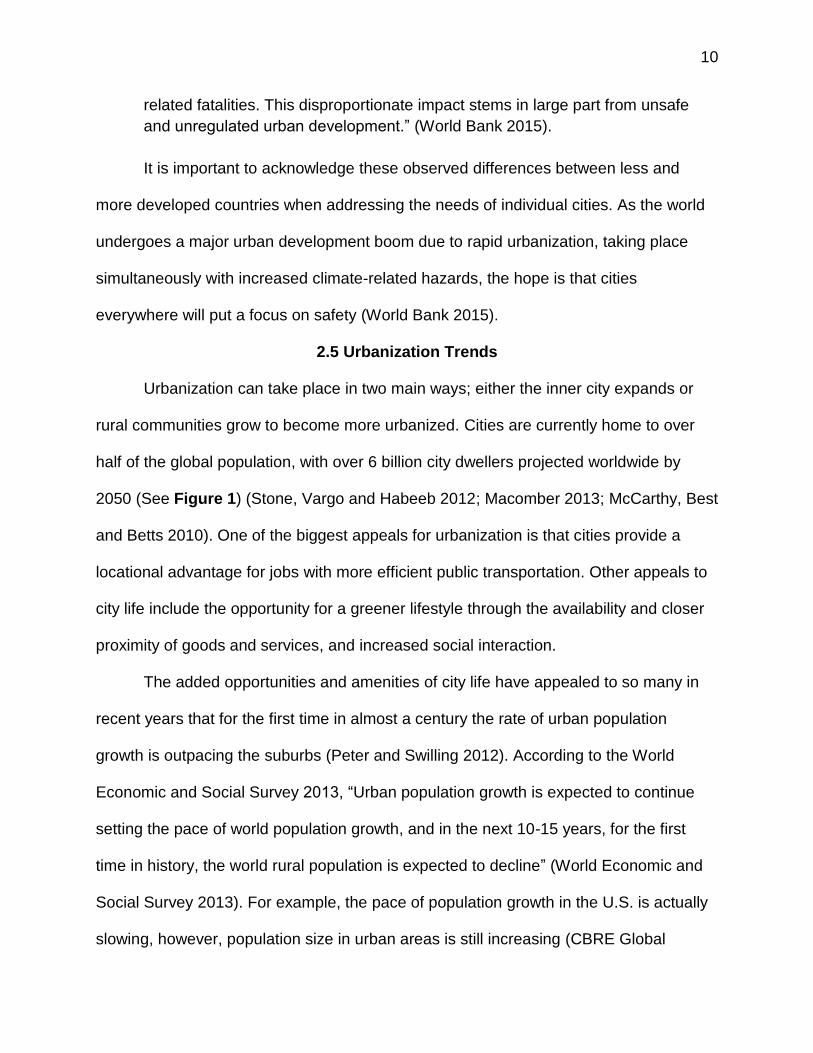
Investors 2015). Therefore, as shown in Figure 3, more of the population growth in the
U.S. can be attributed to urban areas.
Figure 3: The U.S. Urban Population Will Continue to Grow. (Source: United Nations. Taken from CBRE Global Investors. U.S. Urbanization Trends: Investment Implications for Commercial Real Estate. 2015.) As the urban environment continues to expand in order to accommodate the
influx of people, more buildings and roads will be built transforming landscapes and
contributing even more to the amount of waste heat in the area, which will exacerbate
the urban heat island effect (McCarthy, Best and Betts 2010). Management of
resources will define this century, especially with urbanization and the resulting strains
on city services such as electricity, gas, and water (Vanderveen 2014). Most of the
world’s Gross Domestic Product (GDP) comes from cities—about 80 percent. (World
Bank 2016). Urbanization can be managed sustainably by increasing productivity
through the utilization of innovative technology and creative thinking. (World Bank
2016). Often, cities are home to some of the world’s most creative and innovative
thinkers, allowing new ideas to emerge.
12
2.6 Climate Change and Socioeconomic Factors in Cities
Cities act as population hubs, often resulting in greater diversity. As a result,
there exist some social and economic pressures. Exposures to risk for the urban poor
are more extreme and their developmental needs are often not met due to a lack of
material resources and access to infrastructure.
“The choice of where to live within cities is driven by tradeoffs between what is
affordable, proximity to income-earning opportunities, and where individuals may
have social networks and kinship ties. Typically, the areas affordable to the poor
are those that others have deemed undesirable for residential purposes, or
unusable for other urban activities” (Baker 2012).
Distribution of city resources and decision making should be done in ways that minimize
discrimination based on social and economic factors. Part of this means enabling the
urban poor to participate in the decision-making and allowing them to benefit from urban
development. To accomplish this, dialogue between urban communities, the private
sector, and local governments need to improve. For example, if city leaders are
discussing the placement of a new facility within city limits and hold a public meeting in
which to discuss options or concerns during the day time, the urban poor may miss out
on the opportunity to express their concerns. If the urban poor work jobs with day time
hours, then it is likely that only those who can afford to be away from work, or perhaps
those who do not need the income from employment, would be able to attend the
meeting. These struggles affect the urban poor’s adaptive capacity to be able to
address and respond to climate change and disaster risk.
Inequities among socioeconomic groups are expected to become more evident
as climate change progresses (Mehrotra et al. 2011). For example, it is well researched
and documented that disaster events affect the urban poor and marginalized
13
populations disproportionately. This is in part due to increased exposure to unsafe
housing and working conditions (World Bank 2015). With the frequency and severity of
natural hazards likely to increase in the future due to climate change, these social
inequities must be addressed in cities in order to account for the social pillar of
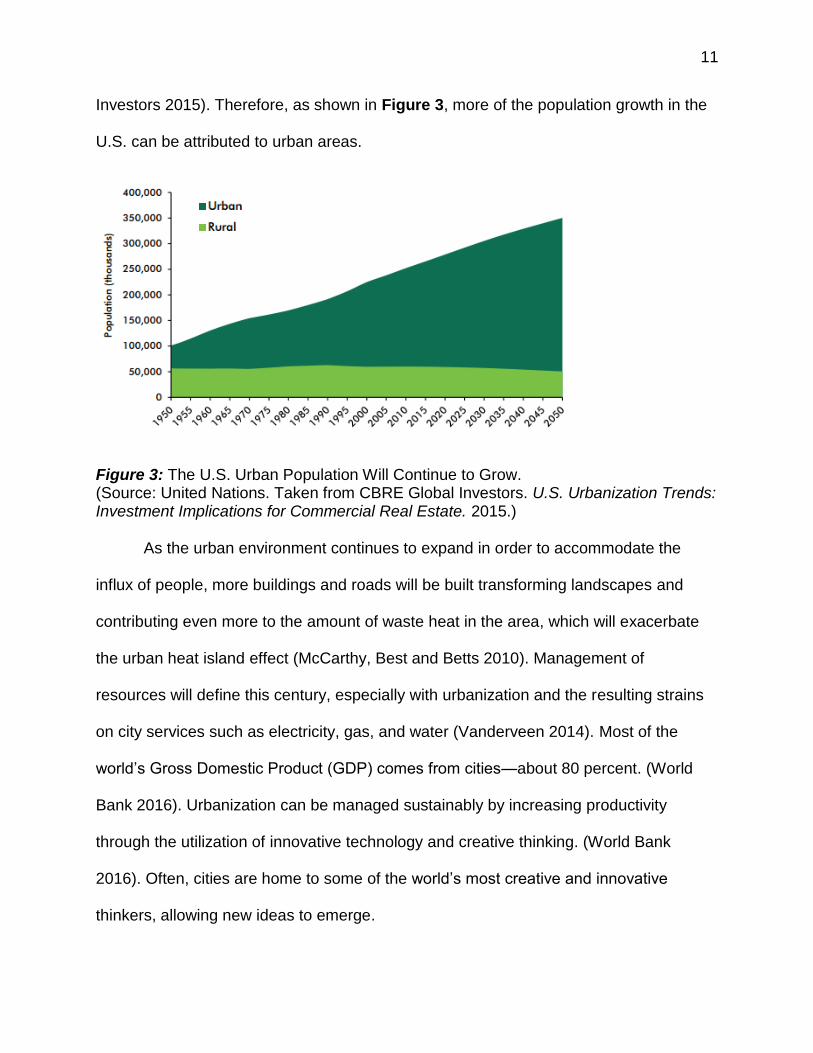
sustainability. (Mehrotra et al. 2011; World Economic and Social Survey 2013). More
information of the three pillars of sustainable development can be found in Figure 4.
Figure 4: The Three Pillars of Sustainability. This venn diagram highlights the importance of not just the environment, but also the economy and society. As can be seen by the red star, a combination of each pillar is desirable to achieve sustainable development. (Adapted from: Wilkson and Yeneken, 2000)
14
CHAPTER 3
HOW CAN CITIES MITIGATE AND ADAPT TO CLIMATE CHANGE TO ENHANCE
URBAN SUSTAINABILITY?
3.1 Defining ‘Urban Sustainability’
To define ‘urban sustainability’ for the context of this research paper, other
working definitions were carefully considered. The common theme among all
researched definitions is the relationship between sustainability at both the local and
global level. Cities must recognize that they are part of a global network, which they
both impact through their actions and rely on for resources (Alberti 1996). The definition
of urban sustainability must encompass both local and global sustainability demands.
The working definition of 'urban sustainability’ employed in this research paper is:
Organizing and managing a city in such a way that is economically, environmentally, and socially healthy and resilient. The city optimizes resource efficiency and conservation practices while maintaining public health and social equity. At the same time, urban sustainability minimizes consumption, waste and prevents pollution.
Urban sustainability is a process, rather than an end product, and requires continual
planning and adapting. In a best-case scenario, socioeconomic factors should be
addressed, poverty eradicated, social and environmental justice upheld, and human
health needs met. A sustainable city may look and function differently from place to
place. Some qualities of a sustainable city might include being inhabited by people
dedicated to minimizing resource use and consumption, well-planned and intelligently
designed, and infrastructure choices that are made with respect to energy, water,
transportation, waste management, green infrastructure, building design, and
governance.
15
3.2 Key City Sectors for Urban Sustainability
Climate change and increased climate variability will have many negative
consequences in the urban environment, many of which are already occurring.
According to the C40 Cities Climate Leadership Group, “70 percent of cities are already
dealing with the effects of climate change, and nearly all are at risk” (C40 Cities 2012a).
A city’s management plays a big role in determining its ability to respond to climate
change. Efficient and effective processes at the city level allow for more sustainable
practices than their rural counterparts.
While no two cities will be completely alike, there are some common city sectors
that must be managed successfully to produce a sustainable city. This section will
individually discuss five city sectors: urban energy, water/wastewater, transportation,
waste management and green infrastructure. The discussion of each sector will include
associated risks from climate change and the potential to overcome them through
sustainable urban practices. However, it will become apparent throughout the chapter
that these sectors are intricately connected and overlap in many contexts.
3.2.1 Urban Energy and Climate Change
Most literature on urban energy focuses on the fact that urban energy systems
are extremely carbon intensive and contribute to climate change via greenhouse gas
emissions. The other side to this story is that climate change is affecting urban energy
systems negatively, too. The most obvious way humans have observed climate risks to
urban energy systems is through natural hazards. Natural hazards such as floods,
hurricanes, wildfires, and storms threaten city economies by damaging infrastructure
and putting energy systems out of operation (Hammer et al. 2011). This directly impacts
16
urban energy systems in terms of associated costs with repairing or rebuilding, changes
in operating practices, and adapting these systems to these threats.
There are also indirect effects that climate change imposes on cities, such as
changes in energy demands. In addition to increases in global temperature and the
additional heat in cities resulting from the urban heat island effect, more extreme winter
temperatures and storms are expected as well, increasing energy demands for heating
and cooling. Because of the higher energy and consumption rates in cities, they are the
source of as much as 80 percent of global greenhouse gas emissions (Komeily and
Srinivasan 2015). The demands and costs for city services are expected to rise,
complicating the ability of cities to supply current and future needs while coping with
resource scarcity, food insecurity, and energy constraints. It is difficult to assess
whether or not utility companies have the capacity to meet these requirements because
energy lines can only sustain a certain amount of voltage for a certain amount of time
before risking equipment failure. Energy failures are more likely when high demand
surpasses equipment rating levels (Hammer et al. 2011).
Climate change will affect urban energy production and delivery (Hammer et al.
2011). Rising sea level and storm surges associated with climate change will increase
vulnerability of power plants along coastlines. Variations in climate patterns may also
reduce the reliability of power generation in cities, especially those relying on available
precipitation for hydropower systems (Hammer et al. 2011). Even cities that do not
directly rely on hydropower for their supply of electricity will feel some effects of
declining hydropower availability in their region. Because hydropower is generally a
17
lower-cost power source, replacing it with another form of power will drive up prices at
the regional level (National Hydropower Association 2017).
The key to addressing these concerns in the urban energy sector lies on further
implementation of sustainable urban practices. The urban energy sector is made more
sustainable by utilizing cleaner, less carbon intensive energy sources, improving energy
efficiency, and decreasing energy demand and consumption. Many cities around the
world have already begun setting emissions and consumption reductions goals and
employing renewable energy resources (Plaza 2015; UN-Habitat 2012). All other cities
need to follow suit at this pivotal point in the world’s energy resource security.
Post Carbon Institute is an organization that aims to lead the world towards a
more sustainable transition by providing valuable resources needed to understand the
global energy crisis in an ecological, economical, and equitable way.
“Energy is at the heart of the human predicament in the 21st Century. We are
now facing a transformational moment in our energy story. As we leave the age
of seemingly cheap and plentiful fossil fuels and enter an era of extreme energy,
the ever-rising financial, social, and environmental costs of fossil fuels can no
longer be ignored” (Post Carbon Institute 2017).
Because oil is a non-renewable energy source, to continue to deplete this resource is
unsustainable. While the coal and oil industries will undoubtedly continue to play a large
role in global energy supply, the current reliance on non-renewable, finite resources
must be divested in order to keep up with current energy demands and lifestyles
indefinitely. As the world transitions beyond the fossil fuel era into cleaner and
renewable types of energy, cities can lead the way through decisive action, innovative
thinking, reduced energy demands, and improved technology.
18
An organization called the American Council for an Energy-Efficient Economy
(ACEEE) has created the “City Energy Efficiency Scorecard,” which is a report that
ranks 51 U.S. cities on what they are doing to save energy (ACEEE 2016a).
“Policymakers, regulators, and citizens are increasingly recognizing that energy
efficiency is a crucially important resource. States and localities are leading the
way when it comes to implementing energy-efficient policies and programs.
ACEEE’s State and Local Policy Database includes comprehensive information
on energy efficiency policies currently implemented at the state and local level.
The database tracks policy activity across multiple sectors, including
government, utilities, transportation, buildings, combined heat and power, and
appliance standards” (ACEEE 2016c).
Cities are ranked out of 100 points on different categories such as local government,
community-wide initiatives, buildings policies, energy and water utilities, and
transportation. For example, Chicago scored a 69.50 out of 100 and ranked in 6th place
out of the 51 cities. ACEEE’s report page for energy programs in Chicago states:
“Currently, the Illinois Department of Commerce and Economic Opportunity
(DCEO) receives 25% of total funding for energy efficiency programs raised by
utility tariffs to administer public-sector and low-income energy efficiency
offerings. Beginning in 2018, responsibility for these programs will shift to electric
and natural gas utilities. On the state level, Chicago strongly advocates for
additional spending requirements for energy efficiency projects for all of its
utilities. The State of Illinois requires energy efficiency program spending and
energy savings targets for its utilities through an EERS” (ACEEE 2017c).
ACEE defines an EERS as “An Energy Efficiency Resource Standard (EERS)
establishes specific, long-term targets for energy savings that utilities or non-utility
program administrators must meet through customer energy efficiency programs”
(ACEEE 2016b). Chicago utilizes programs at both the state and local level which
resulted in one of the higher rankings out of the 51 cities. The city also offers rebates for
energy-saving equipment and a multi-family program called ‘Peoples Gas,’ which is a
19
comprehensive program that will install the energy efficient equipment at no cost.
Equipment includes high efficiency showerheads, faucet aerators, programmable
thermostats, pipe insulation and compact fluorescent bulbs (ACEEE 2017c).
Another example of energy conservation programs is in the City of Austin, Texas,
which maintained an ACEE score of 62.50 out of 100 and ranks 9th out of the 51 cities.
Over a quarter (29.7 percent) of total energy generation in Austin comes from
renewable energy (48.1 percent wind, 50.3 percent solar, 1.6 percent bio) (Austin
Energy 2017). The Austin City Council also requires that all future public building
projects costing over $2 million to be built to LEED (Leadership in Energy and
Environmental Design) Silver standards, and that the city must purchase ENERGY
STAR equipment if available (ACEEE 2017a). Other measures the city has taken,
similar to those found in Chicago, includes energy-use monitoring and year round
rebates to help offset energy efficiency changes made in homes and businesses (Austin
Energy 2017; ACEEE 2017a).
3.2.2 Urban Water/Wastewater and Climate Change
Water is arguably the most important resource on this planet. However, as
essential as water is for all environments, providing safe and clean water sustainably is
still a challenge for many cities (Zborel 2010). Increased flooding, storms, and sea level
rise will drastically increase vulnerability to urban water systems, contributing to the
degradation of materials important to urban water infrastructure (Thirlwell et al. 2007).
More intense precipitation events can overwhelm current infrastructure used to transport
water and wastewater in cities. For example, if sewer systems are overwhelmed with
20
precipitation, they risk backing up and leaking sewage into the streets. Natural disasters
and flooding give rise to unsanitary conditions and water-borne diseases.
Without available freshwater, cities are forced to import their water from far away,
increasing their carbon footprint. If available water sources are unsanitary or saline in
quality, additional treatment facilities are needed. Unfortunately, many regions of the
world are forced to rely on unsanitary water to meet their city’s water demands because
they lack resources or capital for treatment facilities. There are many other concerns
with regards to the urban water and wastewater sector and increased temperatures:
“Warmer air temperatures can lead to biological and chemical degradation of
water quality, e.g., by increased solubility and concentrations of contaminants
in fresh water or enhanced growth of algae, microbes, para-sites, and invasive
species. Increased temperatures will result in higher evapotranspiration rates that
will increase demands for landscape irrigation and additional human
consumption. Warmer temperatures will also result in additional demands for
cooling water in arid and semi- arid regions. Warmer temperatures will result in
greater summer peak demand and extended periods of increased demand during
longer and drier summers, and may result in decreased reservoir or lake levels,
which may require relocation of intake pipes that supply surface water from lakes
or reservoirs” (Thirlwell et al. 2007).
Most cities in the U.S. have large plumbing systems, sewers, treatment plants, and
storage systems. However, even with all this infrastructure climate change is still
influencing supply and water availability, making cities with formal systems vulnerable.
Cities that used to rely on nearby surface and groundwater resources are now finding it
necessary to import their water in order to meet their city’s demands.
Water scarcity becomes more extreme under drought conditions, and with sea
level rise underway even more freshwater will become too saline to drink. Water
scarcity leads to overdrawing of other water resources, further depleting the world’s
fresh surface water and groundwater supplies.
21
For example, water management has proven to be difficult in California. The
state has been struggling to cope and recover from extreme drought conditions since
January 17, 2014, when California State Governor, Jerry Brown, declared a state of
emergency for drought (California Drought 2016; Executive Order B-29-15 2014). The
record-breaking drought has affected over twenty-four million Californians, and the
state’s water managers face increasingly complex issues in the context of long-term
hydrologic, climatic, and environmental changes (USGS California Water Science
Center 2017; California Drought 2016; Executive Order B-29-15 2014). As a result, the
state has had to address its immediate water needs, adopting strict water saving rules
such as bans on watering lawns, or ‘water wasting’ fines for residential landscape and
pool use, for example (Reese, Kasler and Sabalow; USGS California Water Science
Center 2017; Executive Order B-29-15 2014).
Depletion of natural water sources can turn renewable sources of water into
nonrenewable ones. Over-drawing can also lead to issues such as salt-water intrusion
and subsidence, creating unsuitable conditions for drinking water or agriculture, which
would bring cause for a city to import its water as well. Many cities in areas of Mexico
and the Eastern Coast of the U.S. are currently dealing with the consequences of
subsidence from resource overuse (Major et al. 2011; Karegar, Dixon and Engelhart
2016). A study in Geophysical Research Letters using GPS and prehistoric data has
shown that nearly the entire east coast is being affected by sea level rise and
subsidence in tandem with groundwater pumping (Upton 2016; Karegar, Dixon and
Engelhart 2016). Subsidence creates infrastructure problems that are costly to fix.

22
Because climate change contributes to increased energy costs and increased
volumes of water going through a system at once (from increased precipitation or storm
frequency/intensity), all of this could become more expensive and problematic.
Therefore, it is important for cities to address their water and related energy needs early
on in their development plans for urban water and wastewater management, keeping
consumption and availability of resources in mind. Mitigation efforts for climate change
are especially important in cities because the water and energy sectors are so intricately
linked in urban areas.
To conserve water in cities, its inhabitants need to reduce demand. Less demand
will reduce emissions and costs and resources along every step of the way: less water
needed from reservoirs and aquifers, less water to be transported, less water to be
heated or cooled, less wastewater to be treated. Decreasing water demand will also
help ease some of the pressure to supply an urbanizing population in environments
where water resources and availability are uncertain due to climate change.
Although sustainable practices applied at the individual level are important, there
is a need for the alignment of water conservation policy and regulations at all levels to
enforce behavioral changes. Sustainable water management can be organized at the
city level around three major water uses: drinking water, wastewater, and stormwater
systems (Sustainable Cities Institute 2013). Major water laws such as the Clean Water
Act (CWA) and Safe Drinking Water Act (SDWA) have done much to improve concerns
of environmental aspects of water and regulate drinking water standards. “The U.S.
Environmental Protection Agency (EPA) is the primary federal agency in charge of
water quality, administering many of the regulations authorized by the CWA and Safe

23
Drinking Water Act” (Reimer 2013). Therefore, conservation programs must be put in
place at the regional and local levels to assign more accountability. Going back to the
example of California and their history of drought, water conservation programs are
especially important. Many cities in the sunshine state already have water conservation
programs, which include water use regulations and water meters, residential and
business rebates for smart water saving strategies, free water check-ups to reduce
leakages, drought tolerant landscaping, and water education programs (City of Santa
Barbara 2017).
Portland, Oregon has many programs that focus on investing in green
infrastructure in order to manage stormwater runoff, including the Green Streets
program, the “% for Green funding” program, the Green Street Steward program, the
Ecoroof program, the Innovative Wet Weather program, and the Clean River Rewards
rebate program (ACEE 2017d). Portland’s Grey to Green initiative, part of the Portland
Watershed Management Plan, was a $55 million commitment to ongoing investments in
green infrastructure projects in order to protect existing sewer and stormwater
infrastructure (ACEEE 2017d).
Other mitigation efforts in cities might also include water reclamation and
recycling, or increasing the efficiency of water supply. Water conservation programs
such as these should be implemented in all cities and backed by water conservation
policy at the state and national levels. An overall coping strategy including operations
and management, infrastructure, and conservation policy categories should be
assessed and implemented based on what is best for each city.
3.2.3 Urban Transportation and Climate Change
24
Another development priority for cities is the public transportation sector. Around
the world there are considerable variations in urban design and development practices
for the transportation sector of cities, but in recent decades climate change has created
a widespread desire to find ways to minimize the dependence on the automobile in
urban areas (Newman and Kenworthy 2006). Cities make for the most efficient
transportation hubs because denser populations allow for closer proximity of housing,
retail space and employment, reducing travelling distances and supporting alternative
travel options (Newman and Kenworthy 2006; APTA 2008). People living in cities
benefit from public transportation in ways that those in rural areas cannot because the
necessary infrastructure is already in place. Public transportation not only provides
people with a more sustainable means of transportation, but can do so without
sacrificing mobility, which is an amenity that plays a vital role to economic health and
quality of life in cities (APTA 2008). While there are many advantages for using public
transportation and decreasing automobile dependence, research tends to focus on its
ability to reduce greenhouse gas emissions.
“By reducing the growth in vehicle miles of travel, easing congestion and
supporting more efficient land use patterns, public transportation can reduce
harmful CO2 emissions by 37 million metric tons annually. These savings
represent the beginning of public transportation’s potential contribution to
national efforts to reduce greenhouse gas emissions and promote energy
conservation.” (Schrank and Lomax 2007).
Those who take public transportation not only reduce their carbon footprint through the
conservation of energy and reduced greenhouse gas emissions, but create benefits for
those around them as well (Davis and Hale 2007). The result is fewer miles travelled in
personal vehicles, reduced emissions, less time spent in traffic jams, and greater fuel
25
efficiency from less congested roads (Davis and Hale 2007). Improvements to public
health are yet another benefit to supporting alternative transportation options such as
walking or bicycling. Accessibility to alternative transportation not only improves public
health, but can also address air pollution, increase housing values, contribute to a
sense of place and community, promote economic development in the area, and save a
household money (APTA 2008). Because fuel costs often prohibits many from owning
their own private vehicle, alternative transportation becomes an absolute necessity for
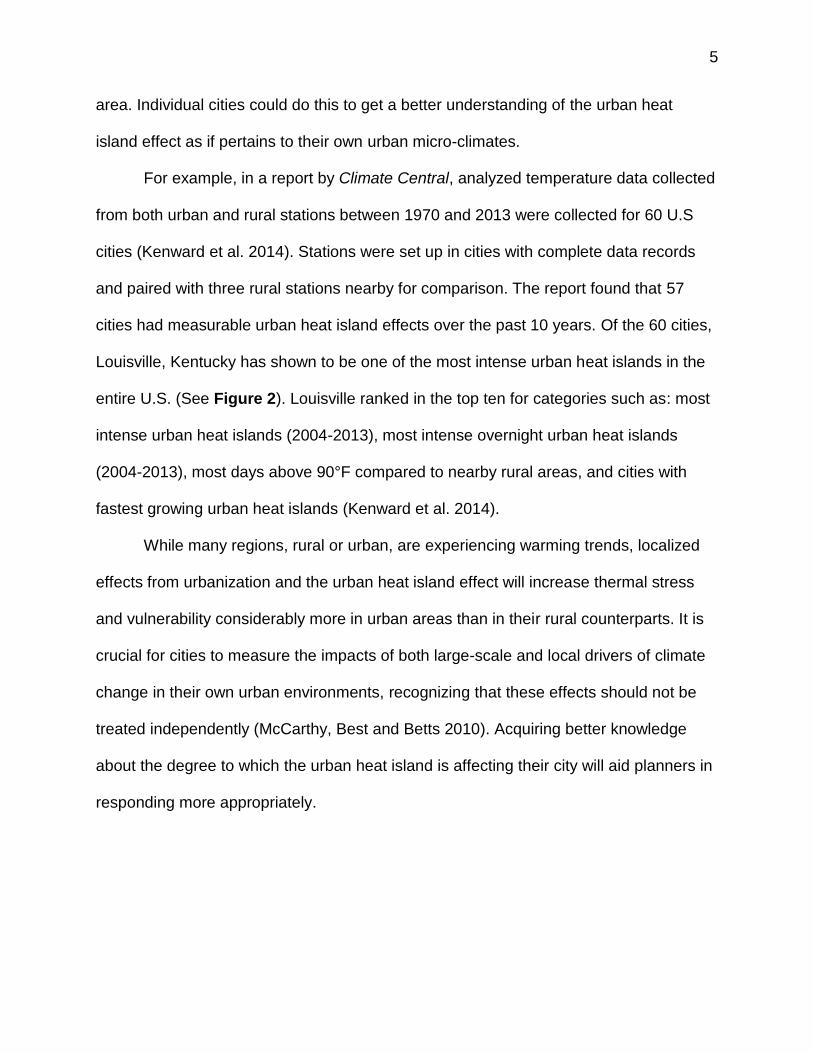
mobility. As the price of fuel rises, this may only get worse. In fact, “Public transportation
households save an average of $6,251 every year” (Bailey 2007). Public transportation
use is an affordable alternative to driving. Lastly, it reduces dependence on oil. The U.S.
saves over 4.2 billion gallons of gasoline every year through public transportation
(APTA 2008).
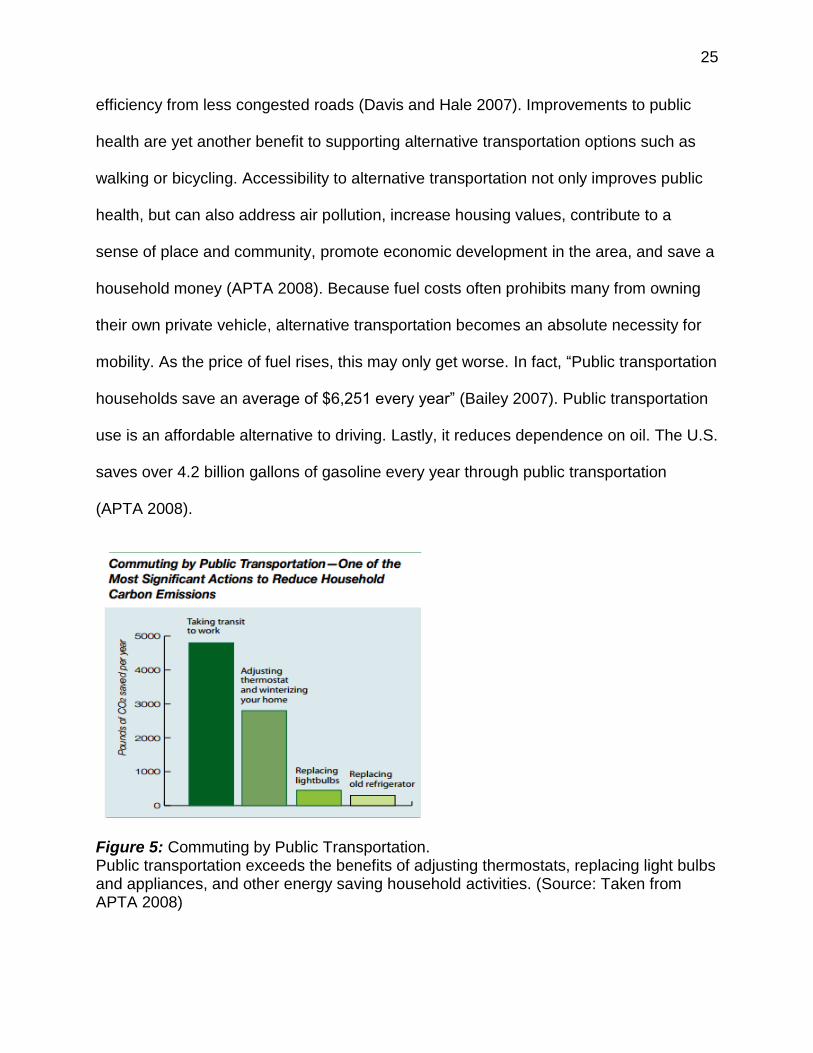
Figure 5: Commuting by Public Transportation. Public transportation exceeds the benefits of adjusting thermostats, replacing light bulbs and appliances, and other energy saving household activities. (Source: Taken from APTA 2008)
26
While energy and emissions reduction goals are becoming more common in the
urban transportation sector, transportation systems are complex and involve social,
economic, and environmental aspects (Cheng, Chang, and Lu 2015). It can be difficult
to convince people to change their behavioral patterns and switch to public
transportation over personal automobiles. However, incentives can be put in place to
further develop the transportation sector in a city, which in turn will encourage this
behavioral change. For example, the Chicago Department of Transportation administers
a program called Drive Clean Chicago, which delivers incentives to alternative fuel
projects such as Drive Clean Truck, Drive Clean Taxi and Drive Clean Station. These
programs encourage the purchases or leases of electric and hybrid vehicles through
vouchers and discounts. Chicago also already has 122 charging stations available for
public use, and offers a permit process for installing electric vehicle charging stations
that only take one day (ACEEE 2017c).
Another city implementing programs that benefit the transportation sector is
Boston with its car and bicycle sharing programs. “There are two car sharing programs
currently available to the residents and visitors of Boston, Enterprise Carshare,
and zipcar. The city is served by a bikesharing program, Hubway, which has over 160
operable bike stations with approximately 1600 bicycles in total” (ACEEE 2017b). The
city has set goals reduce greenhouse gas emissions from transportation by 25% by
2020, and 80% by 2050, and their bicycle sharing program is just one of the ways they
plan to meet that goal (ACEEE 2017b; City of Boston 2017). Another initiative called the
Inclusionary Development Policy (IDP) works to preserve access to affordable housing
opportunities in transit-served areas in all of Boston’s neighborhoods (ACEEE 2017b).
27
These initiatives work in harmony with affordable housing guidelines, helping to ensure
that the urban poor have equal access to mobility.
3.2.4 Urban Waste Management
One of the most important objectives of waste management is to protect people
and the environment from the negative effects associated with waste (World of Earth
Science 2003). Discarded materials that do not seem harmful can potentially become
hazardous if not managed properly. In order for waste management in cities to run
efficiently and sustainably, each step in the cycle—waste generation, collection and
disposal—must be addressed. “A city that cannot effectively manage its waste is rarely
able to manage more complex services such as health, education or transportation. And
no one wants to live in a city surrounded by garbage” (World Bank 2013). Reducing
overall outputs of trash will result in fewer trips to the landfill, saving in fuel costs and
emissions.
With most of the world’s people in cities, they produce a majority of the world’s
trash: one of the largest expenses in a city’s budget is solid waste management (World
Bank 2013). “Americans alone are responsible for producing a hopping 220 million tons
of waste a year” (CEF 2017). This number is greater than any other nation in the world.
Using the same data, the Center for Sustainability and Commerce at Duke University
estimated that of that 200 million tons of waste, approximately 55 percent winds up in
one of the 3,500 landfills scattered throughout the country (Duke Center for
Sustainability and Commerce 2017). How can cities, which inherently generate a lot of
waste, effectively manage it without sacrificing health and aesthetics? Waste
management includes making wise decisions about material use and disposal method
28
(EPA 2016). It is the process of treating solid wastes, disposing of substances in a safe
way, handling items that do not belong in the trash, and finding ways to repurpose them
(CEF 2017; Williams 2013).
Ultimately, prevention is the most effective way to minimize waste generation and
associated emissions (EPA 2016). While the solution may seem obvious, less trash
generation means less energy expenditures towards waste collection, transport, and
distribution. On a larger scale, government agencies at the state level enforce
regulations for guiding waste management, and are also responsible for educating the
public about proper waste management (World of Earth Science 2003). To reduce the
amount of waste generated in cities, these agencies must research their city’s
consumption patterns and invest their money in more sustainable materials sourced
from less carbon intensive companies and processes. Small businesses, store owners,
and individuals can all make commitments in reducing their dependence on material
goods, reducing their demand for them, and making informed consumer decisions.
There will always be some level of trash that needs to be dealt with. A 2012
World Bank Report estimates that “cities currently generate roughly 1.3 billion tonnes of
solid waste per year; with current urbanization trends, this figure will grow to 2.2 billion
tonnes per year by 2025 – an increase of 70 percent” (World Bank 2012). Because
waste increase is typically associated with the spread of disease, it is all the more
crucial that cities maintain a capacity to deal with increases in the waste stream (Gandy
1994; Dias 2016; World Bank 2012; Williams 2013).
The key to good urban waste management is providing waste collection services
in a consistent and ethical way (Dias 2016). Local agencies are tasked with providing
29
services for waste collection and recycling. They may also hire private companies to do
this as well. Waste consumption patterns, services offered, and the frequency in which
those services occur, will look different for each city. Incineration is a type of waste
disposal method in which the waste is burned and converted into gaseous products.
One advantage of incineration is that it can reduce the volume of solid waste by 70 to
80 percent and reduces stress put on landfills (CEF 2017). However, the remainder of
incinerated waste becomes ash and other toxic substances (World of Earth Science
2003). These costs and benefits will need to be closely measured to decide proper
course of action for cities.
Ultimately, non-disposal methods are the safest and most effective way to
improve the waste management sector.
“In the past 25 years, however, non-disposal methods such as waste prevention
and recycling have become more common. Because of public concerns and the
high costs of landfilling and burning (especially to build new facilities), local
governments want to reduce the amount of waste that must be disposed in these
ways” (World of Earth Science 2003).
Recycling is “the process of converting waste products into new products to prevent
energy usage and consumption of fresh raw materials” (CEF 2017). The idea behind
recycling is to reduce the amount of materials in the waste stream and reduce
associated energy costs, pollutants, and greenhouse gas emissions (CEF 2017).
Recycling programs have proven effective in reducing the amount of waste generated in
cities, helping communities and the environment by saving money, energy, and
preserving natural resources for future use (EPA 2017).
San Francisco has a mandatory recycling and composting ordinance. The city
adopted a series of waste reduction policies in the early 2000s to help them achieve
30
their goal of zero waste. In 2006 and 2007, they began to see significant improvements
in waste reduction thanks to their Food Service Waste Reduction Ordinance and their
Plastic Bag Reduction Ordinance. Other San Francisco waste reduction policies passed
during this time included a bottled water ban in which city funds could not be used to
purchase plastic water bottles, and the Precautionary Purchasing Ordinance, which
"requires city departments to purchase products that maximize post-consumer recycled
content and recyclable or compostable materials, and that favor durability, reparability,
and reuse" (San Francisco Department of the Environment 2016). In 2009, the
Mandatory Recycling and Composting Ordinance was passed. This ordinance requires
all citizens in San Francisco to sort their waste into recyclables, compostable material,
and landfilled waste. Participation in recycling and composting programs has increased
significantly since the passing of the ordinance. “Composting has increased by 45
percent, and the City is now sending nearly 600 tons of food scraps, soiled paper, and
yard trimmings to Recology's compost facilities daily, up from 400 tons a year ago" (San
Francisco Department of the Environment 2010).
In the U.S., residential curbside recycling is the dominant form of recycling, but
needs to be studied more for wider implementation in cities (Oskamp 2010). Recycling
performance in city recycling programs is not largely successful yet because behavioral
choices are not being enforced by policies and programs as they are in San Francisco.
Cities should look to San Francisco as an example, and adapt their methods to their
own city’s needs. More research must be conducted at the local level in order to help
individual cities incentivize their recycling programs with greater success. Providing
better educational programs to urban citizens about the benefits of recycling, as well as
31
resources to teach them how and where to recycle, will improve recycling performance
in cities.
3.2.5 Green Infrastructure
Green infrastructure is another city sector that, although is not required in the
discussion of urban sustainability, has been gaining a lot of attention in recent years for
its integration of creative thinking, art and design. Urban areas often lack horizontal
space for vegetation so they have to be innovative to incorporate green spaces. Green
infrastructure allows a city to address this issue with sustainable urban landscape and
other deviceful green practices.
In the context of climate change, green infrastructure can be used to improve
community resiliency, reduce pollution and runoff, and cut back on energy and water
supply, all while maintaining the original functionality of the walls, buildings, roofs, etc.
that they are incorporated into. Green roofs, for example, provide new innovative uses
and functionality to spaces that would otherwise go unused. They also increase
biodiversity in urban settings by creating habitats for birds and insects, and are an
excellent way to apply technologies to grow food in urban settings; creating a
sustainable and local source of food.
Vertical gardens, or green walls, act similarly to green roofs having many of the
same benefits, but they can be located both outdoors and indoors. There are studies
connecting indoor green spaces in urban areas to health, concluding that there are
many psychological benefits to having these green spaces (Maas et al. 2006). For
example, vertical gardens and green spaces in schools may help children with ADHD
focus better in school, reduce absenteeism and boost employee morale at work, and
32
speed recovery time for patients through biophilia, which is the notion that humans tend
to seek connections with nature. In the economic sense, vertical gardens can also
increase real estate value and foot traffic in retail spaces, helping to improve sales
(Plant Connection Inc. 2017).
Another type of sustainable landscape practice, permeable pavement, also
known as pervious pavement or porous pavement, acts as a pavement and a
stormwater management system all in one. It allows stormwater to re-enter the soil
instead of being carried around as runoff which could potentially cause flooding and
pollution in urban areas (Pervious Paving 2013). Permeable pavement helps mitigate
this issue and allows for improved soil moisture and the natural filtering of water through
the soil (Pervious Paving 2013). Permeable pavement also reduces costs that would
otherwise have to be spent on flood damages. “Pervious pavement often results in
lower overall construction costs due to elimination of the need for other stormwater
management measures” (Shamma 2015).
Implementing green roofs on buildings is one way to reduce the urban heat
island effect of the local area because the vegetation has an evaporative cooling effect.
They improve microclimates by cooling and humidifying the air of surrounding
communities (Zinco Green Roof 2014). Green infrastructure is also one of the possible
criteria used in LEED certification. Many buildings in cities around the world are
becoming LEED certified with the help of sustainable landscape design. For example, in
the heart of Viale Certosa, which is one of the most important business districts in Milan,
Italy, a highly sustainable office building named “Green Place” earned a Gold Status
LEED certification, in part because of its green roof. Environmental and social benefits
33
of the green roof include rainwater management, water run-off relief, and natural
filtration for smog. It also serves as a venue for recreational or sporting use, business
meetings, and parties, which can provide supplemental income for the building.
There are methods being employed by other cities using tree coverage to
minimize the urban heat island effect in their area. For example, In Charlotte, North
Carolina, their City Council formed ‘Trees Charlotte’ to help them reach their goal to
reach 50 percent urban tree canopy cover by the year 2050 (ACEEE 2015). The city
has also adopted a private tree protection ordinance, which requires the preservation
and planting of trees across the city. The ordinance emphasizes the importance of trees
for their many benefits in the city, including promoting clean air quality, reducing wind
turbulence and noise, minimizing increases in temperature from the urban heat island
effect, maintain moisture levels in the air and soil, and preserve groundwater reservoirs
(Charlotte Tree Ordinance 2010). Increasing tree canopy cover in the city helps to
mitigate the urban heat island because the increased vegetation has an evaporative
cooling effect on the microclimate of the city (Zinco Green Roof 2014).
Although implementing green Infrastructure into cities will have an upfront cost, in
the long term, the energy savings and other benefits ensure long-term cost savings and
increase both mitigation and adaptation measures in cities. There are often reservations
for investing in green roofs because people think they will not see a return on their
money. However, there evidence shows that green roofs provide a return on investment
(Breuning 2017). A Cost benefit analysis performed by Green Roof Technology shares,
“Modern green roofs have an equally positive effect ecologically and physically.
They protect the roof’s waterproofing membrane from external influences, which
may lead to serious damages, and prevents accelerated aging due to UV
degradation. The combination of the functional layers and the vegetation
34
insulates the building against heat loss and creates potential energy savings
during the intense air conditioning months in the summer. Above all else, the
stormwater retention capability of extensive green roofs is the number one
advantage in savings for the client and the community” (Breuning 2017).
Green Roof Technology concluded that for a minimal green roof their clients would see
returns of $8.00 per square foot within 40 years, and if they included a secondary
measure, such as photovoltaic panels, on their roofs, then they could expect to see a
return within as early as 10 years (Breuning 2017). In another study from Boston, MA,
an investment into an extensive green roof system that cost $112,500 to implement is
reported to have raised the value of the building by $2.4 Million (Blackwell 2012).
“The installation has proved to be a win-win for property managers, owners, and
residents, as well as the environment. The installation, which cost $112,500, is
generating an additional $300-$500 per month in revenue for about 25 units that
overlook what used to be a heat reflective, stark, white roof typical of building
construction four years ago” (Blackwell 2012).
Life cycle costing also indicates that green roofs cost the same—or even less—than
conventional roofing, plus they have the ability to buffer temperature extremes, protect
from damages related to waterproofing, climate extremes, UV exposure and mechanical
damage. All this saves money by improving the buildings energy performance and
increasing the life expectancy of the roof. And if that is not enough motivation, “A green
roof can reduce water run-off by 50–90 percent; any remaining water flows from the roof
with a delay. Outlets, pipes and drains can be reduced in capacity, thereby saving
construction costs” (Zinco Green Roof 2014). Clearly, the combined functionality, cost
and energy savings, aesthetically pleasing, and most importantly, environmental
sustainability of green infrastructure and sustainable urban landscape practices make
this city sector a hard one to ignore.
35
CHAPTER 4
GOVERNANCE AND RESOURCES FOR CITIES
4.1 Governance in Urban Areas
City governance plays a vital role in addressing and overseeing the different
working parts that make up a city. Ideally, city government should enhance the
cohesiveness and efficiency of city sectors in an equitable, environmentally conscious,
and economically viable way. New governance challenges for cities are stemming from
climate change and associated risks and vulnerabilities (McCarney et al. 2011). Each
city is uniquely impacted by climate change and associated risks so representatives
must find solutions in the context of their own cities. The ability for cities to combat
climate change and build resiliency requires effective long-term solutions based on an
empowered city governance approach. This approach is contingent on city
representatives’ ability to cross jurisdictional and administrative boundaries (McCarthy
2010; McCarney et al. 2011).
City leaders are often not at the table when international protocols or agreements
are being discussed with regards to climate change (McCarney et al. 2011).
Consequently, they miss out on the opportunity to represent themselves or cast votes
on policies that affect them and their ability to govern themselves (McCarney et al.
2011). This in part can be attributed to a fragmentation challenge that arises from a lack
of uniformity in defining urban areas. Currently, urban areas are defined by country, and
definitions vary considerably (World Economic and Social Survey 2013). Because there
is no consistent definition for “urban” or for what a “city” or “municipality” is, this creates
barriers at the global scale for governance. Overcoming this fragmentation challenge is
36
essential for creating consistent, comparable, and reliable frameworks for city
governance. Devolution of power, which is the transfer or delegation of power to the
lowest level with knowledge to make decisions, especially by central government to
local or regional administration, will continue to play a key role in empowering cities to
effectively govern themselves (Oxford Learner’s Dictionaries 2017).
Because climate change mitigation will depend so much on the local
responsibility of cities to reduce greenhouse gas emissions and consumption patterns, it
is pertinent that city leaders be treated as critical partners in international and global
decisions on climate change (McCarney et al. 2011). Delegation of power to the
municipal level allows a city to better address its own needs, granting city mayors and
planners new sources of revenue and authority to govern effectively.
Despite challenges, cities all around the world have already begun exercising
their right and ability to self-govern and align themselves with climate change mitigation
efforts and sustainability. For example, the C40 Cities Climate Leadership Group
represents cities across the world committed to addressing climate change (C40 Cities
2012b). Another network, the Compact of Mayors, is “an agreement led by city networks
to undertake a transparent and supportive approach to reduce city emissions and
enhance resilience to climate change” (Compact of Mayors 2017). Around 500 cities
have already joined.
Many cities have committed to emissions reduction targets, and are meeting
them by increasing use of renewable power generated within or imported to the city, or
replacing existing power plants with more efficient technology (Hammer et al. 2011).
City mayors and planners have powers in regulating and policymaking. They can
37
impose land use controls that reduce reliance on private vehicle use, providing
incentives for public transportation use. They can also support policy for higher
environmental standards as well as clean energy technology (Hammer et al. 2011).
Another significant advantage of cities is that there is a more direct line of
communication between citizens and city planners and representatives. City mayors are
nimbler than representatives at the state and national levels, and are more accountable
to residents’ concerns, ideas, and decisions. This allows action led by city planners and
representatives to have a more immediate and substantial (C40 Cities 2012c). Because
the challenges of climate change tend to vary regionally and call for society to act
quickly, a city’s ability to be nimble allows it to make a more efficient and successful
transition towards sustainable development.
Addressing climate change through city governance will require an
unprecedented level of cooperation, not only between different levels of governments
and the private sector, but through a broad range of actors as well (De Boer 2009).
Organizations already exist as resources and tools for cities, helping to empower city
representatives in advocating for urban sustainability and decision making on climate
change issues. This is a good step in securing better interactions between the national
and state levels, and strengthens communities between cities.
Table 1 summarizes actions that can be taken within the five city sectors for
urban sustainability as discussed in this paper.

38
Table 1. Actions Within the Five City Sectors for Urban Sustainability.
Actions Within the Five City Sectors for Urban Sustainability
City Sectors Actions Examples Provided
Urban Energy
Provide funding for Energy Efficiency Programs.
-Illinois Department of Commerce and Economic Opportunity (DCEO) -Energy Efficiency Resource Standards (EERS)
Require new development or redevelopment to meet LEED certification requirements.
Austin, Texas: Austin City Council
Require the purchase of Energy Star appliances.
Utilize renewable energy. Set city goals for percent renewables.
Austin, Texas: Energy Generation
Water and Wastewater
Clean Water Act (CWA)
Safe Drinking Water Act (SDWA)
Conservation Programs
Many California cities: water use regulations and water meters, rebates, free water check-ups, drought tolerant landscaping, water education programs
Stormwater Management Programs Portland, Oregon: Green Streets Program, Innovative Wet Weather Program, Clean River Rewards
Green Infrastructure Design Requirements Portland, Oregon: Grey to Green initiative
Transportation
Invest in infrastructure for effective and efficient public transportation.
Incentivize reduction in independent automobile use.
-Chicago Department of Transportation: Drive Clean Chicago program
Set greenhouse gas reduction goals for transportation.
Boston, Massachusetts: Climate Plan, includes bicycle sharing programs
Public-private partnerships Chicago CREATE Program
Link affordable housing to public transit locations.
Boston Massachusetts: Inclusionary Development Policy (IDP)
Waste Management
Mandatory Recycling and Composting San Francisco, California: Food Service Waste Reduction Ordinance, Plastic Bag Reduction Ordinance, Precautionary Purchasing Ordinance, Mandatory Recycling and Composting Ordinance
Reduce materials in the waste stream.
Governance Resources for city leaders and representatives (See Table 2).
39
4.2 Resources for City Leaders and Representatives
Resources exist for city leaders and representatives to transition to being a more
sustainable city. Before a city can implement sustainable development practices to
combat the challenges of climate change, they must first have a good understanding of
how climate change will specifically affect their city. Then with a knowledge based
approach, they can tackle sustainability more appropriately to their own needs. Many
organizations and initiatives have been established to help city leaders assess their own
situations in the context of climate change and address relevant challenges. For
example, Organizations like the Intergovernmental Panel on Climate Change (IPCC),
The National Oceanic and Atmospheric Administration (NOAA), and the Urban Climate
Change Research Network (UCCRN) are entities at the national and international levels
that focus their efforts on scientific research for understanding the risks of
anthropogenic climate change. The IPCC often publishes reports and other supporting
materials for city leaders, too. This research is important as it provides the world with a
scientific basis in which informed decisions can be made with regards to sustainable
development. Another group called The C40 Cities Climate Leadership Group,
represents cities across the world committed to addressing climate change. Their
website shares:
“C40 networks facilitate dialogue amongst city officials. This builds trusted
relationships, which in turn ensures that ideas, solutions, lessons, questions, and
even friendly competition can flow freely and responsively to cities’ needs. Rather
than end at a case study or report, C40 Networks create conversations, which
enable cities to tailor their own actions to their unique situations, and band
together to use their collective power to access partnership resources, including
technical and financial support. The result is that cities’ climate actions to reduce
GHGs and climate risks are bolder, more impactful, implemented faster, at a
lower cost and with less resources than if they were to go it alone. No other

40
organization facilitates such deep connections amongst city staff across 50+
countries, 20 time zones and 26 languages to accelerate local action with major
global impact” (C40 Cities 2012b).
The IPCC, UCCRN, and C40 Cities are great resources for cities and their
representatives to utilize early on in the process of sustainable development.
Networking allows for collaboration, the sharing of ideas and successes, and can
provide a community of advisers to cities in need of guidance with regards to climate
change mitigation and urban sustainability strategies. Joining networks such as C40
Cities will open doors to representatives and make a daunting task much easier.
Once a city identifies their local climate change risks and concerns, the next step
is to look to resources for implementing urban sustainability. One organization,
mentioned in the previous section, working towards climate action through urban
sustainability is the ICLEI (International Council for Local Environmental Initiatives).
They are an international association of local governments, as well as national and
regional local government organizations, that have made a commitment to sustainable
development (ICLEI 2017). Taken from their website, “ICLEI – Local Governments for
Sustainability is the leading global network of more than 1,500 cities, towns and regions
committed to building a sustainable future” (ICLEI 2017).
Other organizations include, but are not limited to, the US Green Building
Counsel (USGBC), Green Building Certification Inc. (GBCI), and the Association for the
Advancement of Sustainability in Higher Education (AASHE). The USGBC, GBCI, and
AASHE focus their efforts on creating tools such as Leadership in Energy and
Environmental Design (LEED), Performance Excellence in Electricity Renewal (PEER),
and the Sustainability Tracking Assessment & Rating System (STARS). Those tools
41
allow cities and communities to develop and implement sustainable practices through
certification programs. For example, “LEED certification projects earn points across
several areas that address sustainability issues. Based on the number of points
achieved, a project then receives one of four LEED rating levels: Certified, Silver, Gold
and Platinum” (USGBC 2016). PEER is a similar certification program geared towards
sustainable electricity initiatives, improving power systems, their performance, and
delivery systems (GBCI 2016). STARS is a framework for colleges and universities to
measure their sustainability performance (AASHE 2016). Certifications serve as a
measurable way for cities to be recognized as being sustainable in society.
Another organization, the Compact of Mayors, is “an agreement led by city
networks to undertake a transparent and supportive approach to reduce city emissions
and enhance resilience to climate change” (Compact of Mayors 2017). Around 500
cities have already joined. Joining requires the city to measure and report greenhouse
gas emissions using the Global Protocol for Community-Scale Greenhouse Gas
Emission Inventories (GPC) (Compact of Mayors 2017). They have an extensive action
statement outlining their goals, objectives and commitments.
“The Compact of Mayors is an agreement by city networks – and then by their
members – to undertake a transparent and supportive approach to reduce city-
level emissions, to reduce vulnerability and to enhance resilience to climate
change, in a consistent and complimentary manner to national level climate
protection efforts” (Compact of Mayors 2017).
Other big name entities, such as the Sierra Club, the Nature Conservancy, and
the World Wildlife Fund provide extension groups or platforms for cities. For example,
the Sierra Club provides extension groups for cities such as the Sierra Club New York
City Group. The Nature Conservancy states on their website, “…we will work with
42
communities, mayors, planners and developers to incorporate natural solutions into
cities and make them more resilient, livable and truly flourishing places” (The Nature
Conservancy 2017). Organizations such as these are becoming increasingly recognized
as a pivotal platform for both global actions and local responsibility for building climate
resilient cities and mitigating climate change (McCarney et al. 2011).
“Some of the largest cities in the country, including New York, Chicago, Atlanta
and 34 others have already set emissions reductions goals of 80 percent or
higher by 2050, aligning with the scientific consensus of what will be required to
avoid the most disastrous effects of climate change, finds a new report by World
Wildlife Fund (WWF) and ICLEI-Local Governments for Sustainability. The report
also finds that 62 cities are already committed to meet or exceed the emissions
targets announced by the federal government. Should all cities analyzed in the
report meet their 2050 targets, they will reduce carbon dioxide pollution by a
minimum of 328 million tons per year – the equivalent of switching 45 million
homes to solar power” (ICLEI 2017).
Other relevant resources for city leaders include, but are not limited to, the United
Cities and Local Governments (UCLG), The Compact of Mayors, The Covenant of
Mayors, The National League of Cities, and the Urban Sustainability Directors Network
(USDN). Table 2 summarizes the many organizations and resources listed in this
section
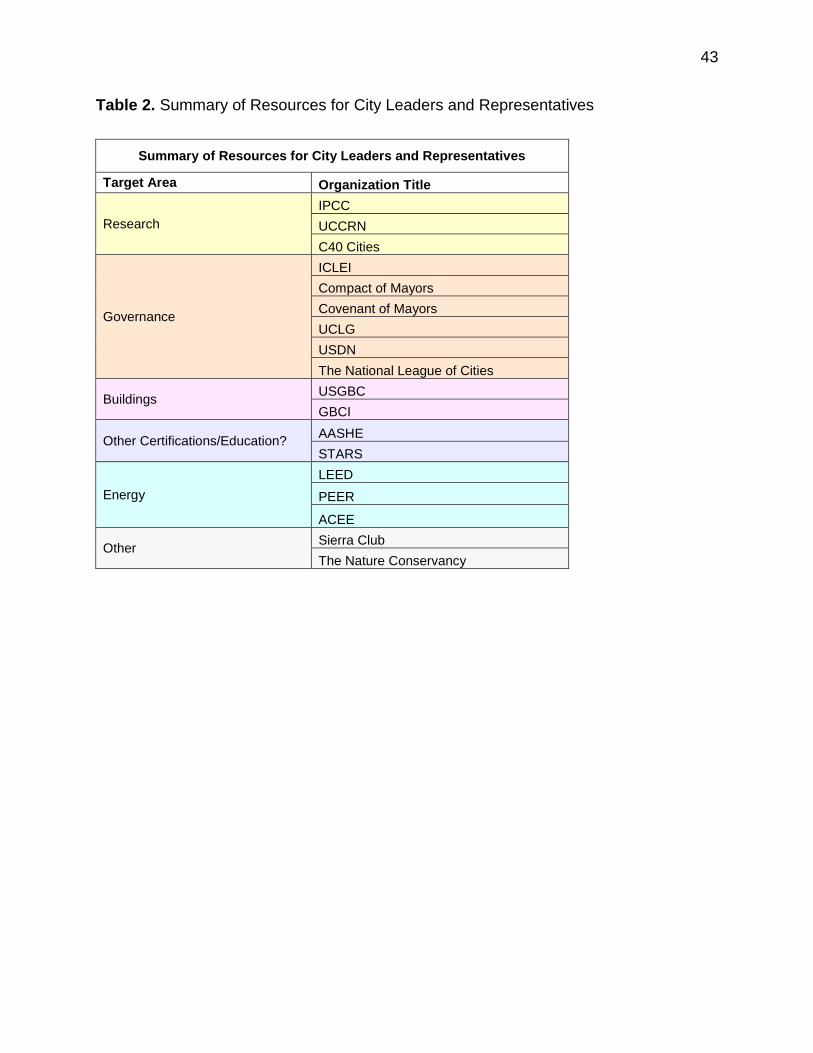
43
Table 2. Summary of Resources for City Leaders and Representatives
Summary of Resources for City Leaders and Representatives
Target Area Organization Title
Research
IPCC
UCCRN
C40 Cities
Governance
ICLEI
Compact of Mayors
Covenant of Mayors
UCLG
USDN
The National League of Cities
Buildings USGBC
GBCI
Other Certifications/Education? AASHE
STARS
Energy
LEED
PEER
ACEE
Other Sierra Club
The Nature Conservancy
44
CHAPTER 5
DISCUSSION AND CONCLUSION
5.1 Discussion
With large populations, high consumption rates and emissions, urban areas are
in a precarious position relative to the consequences of climate change. Cities also
have both a tremendous opportunity and responsibility to mitigate climate change by
reducing consumption and emissions. Physical manifestations of climate change, such
as the urban heat island effect, sea level rise, and natural hazards, are already affecting
most cities, increasing the urgency of the situation. Acquiring better knowledge about
the urban heat island effect and the degree to which it is affecting cities will aid city
planners in responding more appropriately to issues of climate change such as
respiratory illnesses exacerbated by the urban heat island effect. As climate change
continues to impact cities, it is crucial that public health officials are aware of risks to
human health and anticipate climate change related consequences to health.
In the short and medium term, increased variability, frequency and intensity of
extreme events including droughts, floods, and storms, can be expected in some areas.
Considerations for longer-term effects of climate change, such as sea level rise and
resource depletion, need to be considered as well. Natural hazards such as floods,
hurricanes, wildfires, and storms put cities at risk by damaging infrastructure and putting
energy systems out of operation. This has direct impacts on urban energy systems in
associated repair and building cost and disruptions in operations. Adapting these
systems to these threats is vital. The increased frequency of natural hazards will also
have direct impacts on availability of food and water, human health, and facility
45
operations. There are also indirect effects that climate change imposes on cities, such
as changes in energy demands. The demands and costs for city services are expected
to rise, complicating the ability of cities to supply current and future demands while
coping with resource scarcity, food insecurity, and energy constraints. Localized data
should be considered in combination with regional data in order for cities to more
appropriately address their needs and strategize for climate change adaptation and risk
reduction.
There are many appeals to urban life that draw people in to cities, contributing to
urbanization trends. Cities offer a greater range of jobs, social attractions, and can act
as cultural hubs with greater access and variety to amenities. Many of the appeals to
urban life also give the opportunity for a more sustainable lifestyle through the
availability and closer proximity of goods and services, as well as more efficient
infrastructure and planning that are utilized by a denser population. Cities can manage
all of their utilities and services in bulk, reducing unit costs per person.
A common theme between city sectors showed that sustainability can be
improved through reduced demand and consumption practices. Mitigation efforts are
especially important in the water and energy sectors because they are so intricately
linked in urban areas. Similarly, in the waste management sector, diverting materials
from the landfill is an effective practice. Ultimately, reducing the amount of waste
generated in cities is the most effective method for minimizing waste generation and
associated emissions. To conserve resources in all of the sectors, agencies must
research their city’s consumption patterns and invest their money in more sustainable
materials sourced from less carbon intensive companies and processes. Sustainable
46
practices should be encouraged through recycling programs, affordable transportation
options, and green infrastructure implementation as often as possible to encourage
small businesses, store owners, and individuals to make informed and environmentally
conscious consumer decisions.
Examples of incentives in the urban transportation sector include use of public
transportation, which conserves energy and reduces greenhouse gas emissions and
creates additional benefits: fewer miles travelled in personal vehicles, less time spent in
traffic jams, and greater fuel efficiency from less congested roads. This, in turn, saves in
costs for fuel and reduces emissions. Cost savings tend to provide business owners
with the greatest incentive to implement sustainable practices.
While waste prevention and reduced consumption was widely encouraged
throughout the paper, it was emphasized that cities must have conservation programs
and other policies to enforce behavioral changes. Many cities were discussed for their
successes in programs of their own. San Francisco has had great success in nearly
achieving their zero waste goal, in part thanks to its recycling and composting
ordinance. Other examples included Chicago and Boston for their transportation
initiatives, and Portland for its water conservation via green infrastructure and
stormwater management.
Lastly, the role of governance was discussed with regards to its role in climate
change mitigation. Devolution of power from central government to local or regional
representatives and administration will play a key role in empowering cities to act
sustainably and effectively self-govern themselves. Because climate change mitigation
will depend so much on the local responsibility of cities to reduce greenhouse gas
47
emissions and consumption patterns, city leaders must be given a larger voice for
international and global decision making on climate change.
Resources for cities and their representatives exist to aid them in exercising their
rights to self-govern and align themselves with climate change mitigation efforts. Many
cities around the world have committed to emissions reduction goals, and are meeting
them by exercising their powers in regulating and planning, imposing land use controls
to reduce reliance on private vehicle use, and by putting their support behind
environmental policy.
5.2 Limitations and Delimitations
While this paper focuses on cities from more developed regions, it is important to
acknowledge that the range of issues affecting cities in the context of climate change
vary drastically when compared to areas of lesser developed regions. Lesser developed
regions often lack the infrastructure that developed regions, such as the United States
and European cities, have common access too. Cities without proper waste
management and infrastructure, for example, tend to suffer more in the public health
department. Literature agrees that for cities in lesser developed countries, which often
lack formal sewage systems and reliable services for water and wastewater
management, cases of waterborne diseases such as cholera and typhoid are more
common and severe (Gandy 1994). It is not uncommon in lesser developed countries
for trash to be piled up in their environments, simply because they have no
management system in place. However, in the more developed countries like the U.S.,
waste collection and disposal is currently a public service in urban areas.
48
Some uniformity between cities was assumed for this paper in discussing the
application of policies or sustainable practices, whereas in reality, no two cities are
alike. Without assuming some uniformity, the concept of urban sustainability would be
even more complex. The application of sustainable practices varies considerably from
city to city because each city has its own unique makeup and different combination of
the city sectors discussed. One city due to its geographical location may be at great risk
to flooding, so their focus might fall more to addressing natural hazards. Another city
might face a greater urban heat island effect, and thus choose to focus more on the
transportation sector and green infrastructure sector to try and reduce waste heat in
their city in order to address public health concerns with heat waves, smog, asthma,
and allergies. All cities have different demographics giving rise to different
socioeconomic factors. Economic standing and resources available to city
representatives will also affect their ability to respond to climate change.
Lastly, while this paper addressed physical manifestations and other potential
influences of climate change in cities, this was by no means a complete discussion of all
possible effects. Similarly, there are many other factors that contribute to urban
sustainability. For example, non-governmental organizations (NGOs) play a large role in
contributing to urban sustainability. They often have a more directed focus and can
excel in certain areas such as outreach and education, whereas local governments
might have more administrative restrictions.
5.3 Future Research: Could Small Cities Lead the Way?
Current literature fails to acknowledge the significance and potential for
sustainability in smaller cities, particularly those with a population of 500,000 or less.
49
This is a crucial area for future research. “Close to half of the world’s urban dwellers
reside in relatively small settlements of less than 500,000 inhabitants, while only around
one in eight live in the 28 mega-cities with more than 10 million inhabitants” (Jackson
2016). While this paper provides information on climate change and urban sustainability
that is applicable to cities of all sizes, much of the literature seemed to be in support of
smaller cities for their potential to more effectively mitigate climate change. “The
predominance of small- and medium-sized cities provides an opportunity to invest in
green infrastructures, bypassing old energy technologies, and in social development,
before social inequities become unsustainable” (World Economic and Social Survey
2013). Smaller cities stand a better chance of implementing sustainable practices for
the mitigation of climate change—arguably more so than their larger counterparts.
Smaller cities are more agile than larger cities. There is a more direct line of
communication between citizens and city planners and representatives, making it easier
to navigate around city laws and jurisdictions. They can also help to limit the potential of
the urban heat island effect by reducing the population density factor.
Action led by city planners and representatives can have a more immediate
impact in smaller cities because they are more flexible than state and national elected
officials. Smaller cities also have the opportunity of learning from larger cities; they can
implement sustainable development as they grow, rather than retrofitting unsustainable
infrastructure already in place in some larger cities. Retrofitting can be costly and time
consuming, allowing less time for other pressing issues. Thus, smaller cities are able to
make a more efficient and successful transition to a sustainable city and economy.
50
Another argument in favor of small cities is based on the population distribution
between small, medium, and large cities. “Globally, a net 1.3 billion people was added
to small urban centers during 1950-2010, more than double the number of people
added in medium (632 million) or large urban centers ($570 million)” (World Economic
and Social Survey 2013). With so many people moving to smaller cities that have the
potential to grow into even bigger cities, it stands that targeting small cities for climate
change mitigation may have the greatest effect with the quickest results. The reason
this has not been discussed more in literature is because there are less localized
climate studies, weather stations, or data collection available for these smaller cities, as
they often lack the resources or personnel to conduct them and gather the data.
Incorporating sustainable development and smart urban planning is much easier in
small cities, whereas retrofitting larger cities is a much more daunting challenge.
5.4 Conclusions
While this research paper focuses on the capacity of urban sustainability to
address and mitigate issues surrounding climate change, there is no one single
solution. In general, geographic features, consumption patterns, energy system
vulnerability, and influences of climate change will vary from city to city. This mainly
results from the wide range of sizes, densities, geographic locations, urbanizations
trends, and socioeconomic factors that a city may face. Ultimately, careful collaboration
will need to take place between city planners and urban dwellers and all levels of
government to define sustainable development initiatives that will best serve their
needs. In addition, these plans must have some level of cooperation with state, national
and international levels of government.
51
Localized climate studies would be extremely beneficial for city planners to
properly address their risks to the urban heat island effect, natural hazards, and their
implications to human health and urban energy systems. There is also currently a lack
of consensus on how successful strategies in a particular city can be adapted and
applied to many cities on a larger scale. There likely never will be. That being said, local
authorities should draw on these facts to enhance climate resiliency and decrease
affluence in cities. Conservation programs, regulations and other policies implemented
in some cities have been quite successful. Many cities were discussed, such as San
Francisco for its recycling and composting ordinance, Boston for its transportation
initiatives, and Portland for its water conservation via green infrastructure and
stormwater management. Cities already successful in implementing urban sustainability
like these ones should be looked to as examples for other cities looking to follow suit.
There are many certification programs and other resources already available to cities
that can serve as guidelines for sustainable practices, but their popularity and
implementation are still up and coming. While there are still a number of challenges,
cities have an incredible capacity to lead the way towards a more sustainable future.
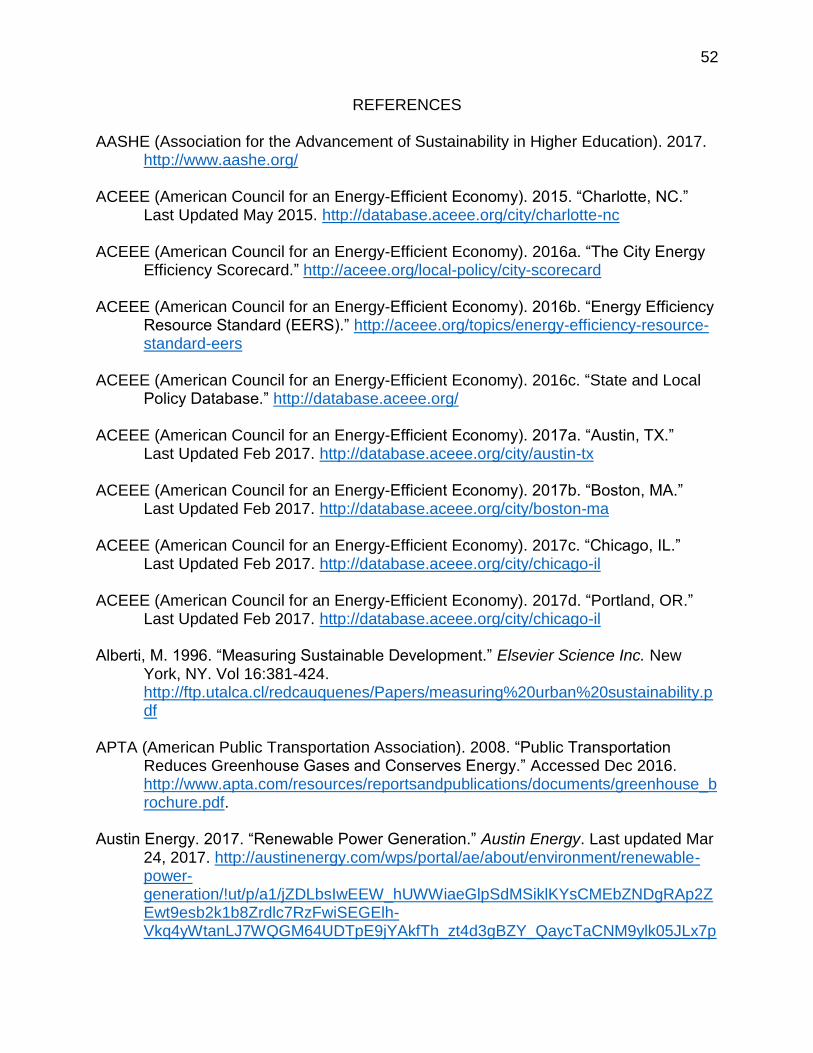
52
REFERENCES AASHE (Association for the Advancement of Sustainability in Higher Education). 2017.
http://www.aashe.org/ ACEEE (American Council for an Energy-Efficient Economy). 2015. “Charlotte, NC.”
Last Updated May 2015. http://database.aceee.org/city/charlotte-nc
ACEEE (American Council for an Energy-Efficient Economy). 2016a. “The City Energy Efficiency Scorecard.” http://aceee.org/local-policy/city-scorecard
ACEEE (American Council for an Energy-Efficient Economy). 2016b. “Energy Efficiency
Resource Standard (EERS).” http://aceee.org/topics/energy-efficiency-resource-standard-eers
ACEEE (American Council for an Energy-Efficient Economy). 2016c. “State and Local
Policy Database.” http://database.aceee.org/ ACEEE (American Council for an Energy-Efficient Economy). 2017a. “Austin, TX.”
Last Updated Feb 2017. http://database.aceee.org/city/austin-tx ACEEE (American Council for an Energy-Efficient Economy). 2017b. “Boston, MA.”
Last Updated Feb 2017. http://database.aceee.org/city/boston-ma ACEEE (American Council for an Energy-Efficient Economy). 2017c. “Chicago, IL.”
Last Updated Feb 2017. http://database.aceee.org/city/chicago-il ACEEE (American Council for an Energy-Efficient Economy). 2017d. “Portland, OR.”
Last Updated Feb 2017. http://database.aceee.org/city/chicago-il Alberti, M. 1996. “Measuring Sustainable Development.” Elsevier Science Inc. New
York, NY. Vol 16:381-424. http://ftp.utalca.cl/redcauquenes/Papers/measuring%20urban%20sustainability.pdf
APTA (American Public Transportation Association). 2008. “Public Transportation
Reduces Greenhouse Gases and Conserves Energy.” Accessed Dec 2016. http://www.apta.com/resources/reportsandpublications/documents/greenhouse_brochure.pdf.
Austin Energy. 2017. “Renewable Power Generation.” Austin Energy. Last updated Mar
24, 2017. http://austinenergy.com/wps/portal/ae/about/environment/renewable-power-generation/!ut/p/a1/jZDLbsIwEEW_hUWWiaeGlpSdMSiklKYsCMEbZNDgRAp2ZEwt9esb2k1b8Zrdlc7RzFwiSEGElh-Vkq4yWtanLJ7WQGM64UDTpE9jYAkfTh_zt4d3gBZY_QaycTaCNM9ylk05JLx7p
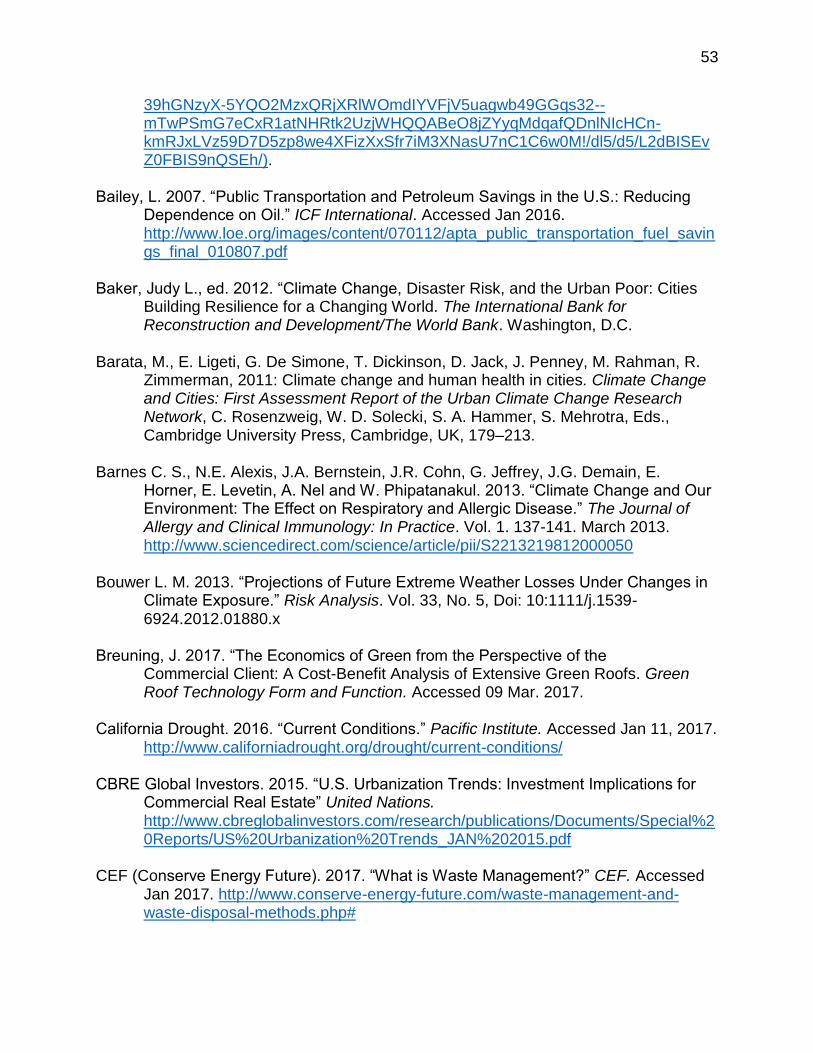
53
39hGNzyX-5YQO2MzxQRjXRlWOmdIYVFjV5uagwb49GGqs32--mTwPSmG7eCxR1atNHRtk2UzjWHQQABeO8jZYyqMdqafQDnlNIcHCn-kmRJxLVz59D7D5zp8we4XFizXxSfr7iM3XNasU7nC1C6w0M!/dl5/d5/L2dBISEvZ0FBIS9nQSEh/).
Bailey, L. 2007. “Public Transportation and Petroleum Savings in the U.S.: Reducing
Dependence on Oil.” ICF International. Accessed Jan 2016. http://www.loe.org/images/content/070112/apta_public_transportation_fuel_savings_final_010807.pdf
Baker, Judy L., ed. 2012. “Climate Change, Disaster Risk, and the Urban Poor: Cities
Building Resilience for a Changing World. The International Bank for Reconstruction and Development/The World Bank. Washington, D.C.
Barata, M., E. Ligeti, G. De Simone, T. Dickinson, D. Jack, J. Penney, M. Rahman, R.
Zimmerman, 2011: Climate change and human health in cities. Climate Change and Cities: First Assessment Report of the Urban Climate Change Research Network, C. Rosenzweig, W. D. Solecki, S. A. Hammer, S. Mehrotra, Eds., Cambridge University Press, Cambridge, UK, 179–213.
Barnes C. S., N.E. Alexis, J.A. Bernstein, J.R. Cohn, G. Jeffrey, J.G. Demain, E.
Horner, E. Levetin, A. Nel and W. Phipatanakul. 2013. “Climate Change and Our Environment: The Effect on Respiratory and Allergic Disease.” The Journal of Allergy and Clinical Immunology: In Practice. Vol. 1. 137-141. March 2013. http://www.sciencedirect.com/science/article/pii/S2213219812000050
Bouwer L. M. 2013. “Projections of Future Extreme Weather Losses Under Changes in
Climate Exposure.” Risk Analysis. Vol. 33, No. 5, Doi: 10:1111/j.1539-6924.2012.01880.x
Breuning, J. 2017. “The Economics of Green from the Perspective of the
Commercial Client: A Cost-Benefit Analysis of Extensive Green Roofs. Green Roof Technology Form and Function. Accessed 09 Mar. 2017.
California Drought. 2016. “Current Conditions.” Pacific Institute. Accessed Jan 11, 2017.
http://www.californiadrought.org/drought/current-conditions/ CBRE Global Investors. 2015. “U.S. Urbanization Trends: Investment Implications for
Commercial Real Estate” United Nations. http://www.cbreglobalinvestors.com/research/publications/Documents/Special%20Reports/US%20Urbanization%20Trends_JAN%202015.pdf
CEF (Conserve Energy Future). 2017. “What is Waste Management?” CEF. Accessed
Jan 2017. http://www.conserve-energy-future.com/waste-management-and-waste-disposal-methods.php#
54
Charlotte Tree Ordinance. 2010. Charlotte, North Carolina, Municipal Code No. 4521. Article I, section 21. https://www.municode.com/library/nc/charlotte/codes/code_of_ordinances?nodeId=PTIICOOR_CH21TR).
Chang, K. T. Introduction to Geographic Information Systems. 7th ed. Boston: McGraw-
Hill, 2008. Print. Cheng, Y. H., Chang, Y. H., and I. J. Lu. 2015. “Urban transportation energy and carbon
dioxide emission reduction strategies.” Elsevier. Vol. 157, pp 953-973. Accessed Jan 2017. http://www.sciencedirect.com/science/article/pii/S0306261915001658
City of Boston. 2017. “Boston’s Climate Plan.”
http://www.cityofboston.gov/climate/bostonsplan/ City of Santa Barbara. 2017. “Water Conservation.” Last updated Mar 21, 2017.
http://www.santabarbaraca.gov/gov/depts/pw/resources/conservation/ Compact of Mayors. 2014. “Cities Mayors Compact Action Statement.” Climate Summit
14. http://www.un.org/climatechange/summit/wp-content/uploads/sites/2/2014/09/CITIES-Mayors-compact.pdf
Compact of Mayors. 2017. “About” Accessed Jan 2016.
https://www.compactofmayors.org/history/ C40 Cities. 2017a. Accessed January 13, 2016. http://www.c40.org/ C40 Cities. 2012b. “Cities.” http://www.c40.org/cities C40 Cities. 2012c. “Why Cities? Ending Climate Change Begins in the City.” C40 Cities.
Last updated 2017.July 12. http://www.c40.org/ending-climate-change-begins-in-the-city
De Boer, Y. 2009. Keynote Speech, Sustainable Development in Times of Crises –
Opposition or Opportunity, Bonn, 23 November 2009. Dangermond, J. "Climate Change Is a Geographic Problem That Requires a
Geographic Solution." ESRI. 2011. <https://www.esri.com/library/ebooks/climate-change.pdf>
Davis, T. and M. Hale. 2007. “Public Transportation’s Contribution to U.S. Greenhouse
Gas Reduction.” SAIC (Science Applications International Corporation). Accessed Jan 2016. http://www.apta.com/resources/reportsandpublications/documents/climate_change.pdf
55
Dempsey, Caitlin. 2011. “Urban Heat Island Analysis.” GISlounge.com, September 29,
2011. https://www.gislounge.com/urban-heat-island-analysis/ Dias, S. M. 2016. “Waste pickers and cities.” Environment and Urbanization. Sep 12,
2016. Accessed Jan 2017. http://wiego.org/sites/wiego.org/files/publications/files/Dias-wastepickers-cities-2016.pdf
Duke Center for Sustainability and Commerce. 2017. “How much do we waste daily?”
Duke University. Accessed Jan 2016. https://center.sustainability.duke.edu/resources/green-facts-consumers/how-much-do-we-waste-daily
(Environmental Protection Agency (EPA). 2016a. “Climate Change and Waste.” EPA
(United States Environmental Protection Agency). Last updated on Sep 29, 2016. https://www.epa.gov/climatechange/climate-change-and-waste
Environmental Protection Agency (EPA). 2016b. “Overview of Greenhouse Gases.”
<https://www3.epa.gov/climatechange/ghgemissions/gases/co2.html> Environmental Protection Agency (EPA). “Reduce, Reuse, Recycle.” Last updated on Jan 4, 2017. https://www.epa.gov/recycle Executive Order B-29-15 of January 17, 2014, Establishing the State Water Resources
Control Board (Water Board), the Department of Water Resources and the California Energy Commision. Mandatory Water Conservation. 2014. https://www.gov.ca.gov/docs/4.1.15_Executive_Order.pdf.
Gandy, Matthew. 1994. Recycling and the Politics of Urban Waste. New York: Earthscan. https://books.google.com/books?hl=en&lr=&id=wUe4AwAAQBAJ&oi=fnd&pg=PP1&dq=urban+waste+and+recycling+and+sustainability&ots=PtDtnx8tD6&sig=9GsEU9_rXN9i5gb2j1fCrGPjRyo#v=onepage&q=urban%20waste%20and%20recycling%20and%20sustainability&f=false
GBCI (Green Business Certification Inc.). 2017. https://www.gbci.org/ Greenhouse Gas Protocol. 2012. “GHG Protocol for Cities.” GHG Protocol.
http://www.ghgprotocol.org/city-accounting Hammer, S. A., J. Keirstead, S. Dhakal, J. Mitchell, M. Colley, R. Connell, R. Gonzalez,
M. Herve-Mignucci, L. Parshall, N. Schulz, M. Hyams, 2011: Climate change and Urban Energy Systems. Climate Change and Cities: First Assessment Report of the Urban Climate Change Research Network, C. Rosenzweig, W. D. Solecki, S.

56
A. Hammer, S. Mehrotra, Eds., Cambridge University Press, Cambridge, UK, 85-111.
ICLEI (Local Governments for Sustainability). 2017. http://iclei.org IPCC (Intergovernmental Panel on Climate Change). 2017. http://www.ipcc.ch/ Maas, J., R. A. Verheij, P. P. Groenewegen, S. D. Vries, P. Spreeuwenberg. 2006.
“Green space, urbanity, and health: how strong is the relation?” Journal of Epidemiology & Community Health. 2006; Vol. 6, Issue 7. http://jech.bmj.com/content/60/7/587.short
Jackson, D. 2016. “The new urban imperative for secondary cities.” Citiscope. Nov 14, 2016. http://citiscope.org/habitatIII/commentary/2016/11/new-urban-imperative-
secondary-cities
Joshi P. K. and Singh T. P. 2011. Geoinformatics for Climate Change Studies. The Energy and Resources Institute (TERI). ISBN 9788179934098
Karegar, M. A., T. H. Dixon, and S. E. Engelhart. 2016. “Subsidence along the Atlantic
Coast of North America: Insights from GPS and late Holocene relative sea level data. Geophysical Research Letters. 43, 3126–3133. doi:10.1002/2016GL068015.
Kenward, A., Y. Daniel, S. Todd, and R. Wang. 2014. “Summer in the City: Hot and
Getting Hotter.” Climate Central. 2014. http://assets.climatecentral.org/pdfs/UrbanHeatIsland.pdf)
Komeily, A.; Srinivasan, R.S. A need for balanced approach to neighborhood
sustainability assessments: A critical review and analysis. Sustain. Cities Soc. 2015, 18, 32–43.
Macomber, John D. 2013. “Building Sustainable Cities.” Harvard Business Review. 01
July 2013. https://hbr.org/2013/07/building-sustainable-cities/
Major, D. C., A. Omojola, M. Dettinger, R. T. Hanson, R. Sanchez-Rodriguez, 2011: Climate change, water, and wastewater in cities. Climate Change and Cities: First Assessment Report of the Urban Climate Chane Research Network, C. Rosenzweig, W.D. Solecki, S.A. Hammer, S. Mehrotra, Eds., Cambridge University Press, Cambridge, UK, 113-143.
McCarthy M. P, M. J. Best, and R. A. Betts. 2010. “Climate change in cities due to global warming and urban effects.” Geophysical Research Letter. Vol. 37, L09705. Doi: 10.1029/2010GL042845.
McCarney, P., H. Blanco, J. Carmin, M. Colley, 2011: Cities and climate change.
57
Climate Change and Cities: First Assessment Report of the Urban Climate Change Research Network, C. Rosenzweig, W.D. Solecki, S. A. Hammer, S. Mehrotra, Eds., Cambridge University Press, Cambridge, UK, 249-269.
Mehrotra, S., C. Rosenzweig, W. D. Solecki, C. E. Natenzon, A. Omojola, R.
Folorunsho, J. Gilbride, 2011a: Cities, disasters and climate risk. Climate Change and Cities: First Assessment Report of the Urban Climate Change Research Network, C. Rosenzweig, W. D. Solecki, S. A. Hammer, S. Mehrotra, Eds., Cambridge University Press, Cambridge, UK, 15–42.
National Hydropower Association. 2017. “Affordable.” Last updated 2017.
http://www.hydro.org/why-hydro/affordable/
Newman, P. and Kenworthy, J. 2006. “Urban Design to Reduce Automobile Dependence.” Opolis, Vol. 2, No. 1, Article 3. Pp 35-52. http://escholarship.org/uc/item/2b76f089
Oxford Learner’s Dictionaries. 2017. “Devolution of Power.” http://www.oxfordlearnersdictionaries.com/definition/english/devolution Peter, Camaren. and Swilling, Mark. 2012. “Sustainable, Resource Efficient Cities –
Making it Happen!” United Nations Environment Programme. http://www.unep.org/urban_environment/PDFs/SustainableResourceEfficientCities.pdf
Plant Connection Inc. 2017. “Plan Connection, Long Island NY, Benefits of Green Walls
or Vertical Gardens.” http://myplantconnection.com/green-wall-benefits.php Plaza, C. 2015. “Biggest US Cities Setting Unprecedental Emissions Reductions Goals
to Fight Climate Change.” ICLEI. Aug 6, 2015. http://icleiusa.org/citytalkusa-measuring-up/
Post Carbon Institute. 2017. “Our Energy Reality” Accessed
http://www.postcarbon.org/program/erc/). Reese, P., D. Kasler and R. Sabalow. 2015. “California adopts strict lawn-reduction
rules for drought savings.” The Sacramento Bee. July 15, 2015. http://www.sacbee.com/news/state/california/water-and-drought/article27301948.html
Reimer, A. 2013. “U.S. Water Policy: Trends and Future Directions.” National
Agricultural & Rural Development Policy Center (NARDeP). http://www.nardep.info/uploads/WaterPolicy_Reimer.pdf
Rosenzweig, C., W. D. Solecki, S. A. Hammer, S. Mehrotra, 2011a: Executive Summary
58
to Climate Change and Cities: First Assessment Report of the Urban Climate Change Research Network, ARC3, C. Rosenzweig, W. D. Solecki, S. A. Hammer, S. Mehrotra, Eds., Cambridge University Press, Cambridge, UK, xvi-xxiii.
Rosenzweig, C., W. D. Solecki, S. A. Hammer, S. Mehrotra, 2011b: Urban Climate
Change in Context. Climate Change and Cities: First Assessment Report of the Urban Climate Change Research Network, ARC3, C. Rosenzweig, W. D. Solecki, S. A. Hammer, S. Mehrotra, Eds., Cambridge University Press, Cambridge, UK, 3-11. http://uccrn.org/files/2015/01/ARC3-Frontmatter-Final.pdf
San Francisco Department of the Environment. "SF Attains 77 Percent Recycling". SF
Environmental. Aug 27, 2010. https://sfenvironment.org/news/press-release/sf-attains-77-percent-recycling).
San Francisco Department of the Environment. "Zero Waste Legislation and
Initiatives." Accessed April 8 2016. https://sfenvironment.org/our_programs/program_info.html?ssi=3#LegislationInitiatives
Schrank, D. and T. Lomax. 2007. “ The 2007 Annual Urban Mobility Report.”
Transportation Institute, Texas A&M University. Accessed Jan 2016. http://financecommission.dot.gov/Documents/Background%20Documents/mobility_report_2007_wappx.pdf
Stone, Brian, Vargo, Jason and Habeeb, Dana. 2012. “Managing climate change in
cities: Will climate action plans work?” Landscape and Urban Planning 107:263-271. doi: http://dx.doi.org/10.1016/j.landurbplan.2012.05.014.
Sustainable Cities Institute. 2013. “Water and Green Infrastructure.” National League of
Cities. Accessed Nov 2016. http://www.sustainablecitiesinstitute.org/topics/water-and-green-infrastructure/water-101
Thirlwell, G. M., C. A. Madramootoo, I. W. Heathcote, and E. R. Osann. 2007. Coping
with climate change: short-term efficiency technologies. Canada-US Water Conference, Washinfton, DC, USA.
UN-Habitat. 2012. “Climate Change.” UN-Habitat Urban Themes.”
https://unhabitat.org/urban-themes/climate-change/ Upton, John. 2016. “Sinking Atlantic Coastline Meets Rapidly Rising Seas.” Climate
Central. April 14, 2016. http://www.climatecentral.org/news/sinking-atlantic-coastline-meets-rapidly-rising-seas-20247
USGBC (The US Green Building Counsel). 2017. http://www.usgbc.org/
59
USGS California Water Science Center. 2017. “California Drought.” Last modified Feb 8, 2017. https://ca.water.usgs.gov/data/drought/
Vanderveen, Chad. 2014. “What it Takes to Become a Smart City.” Future Structure,
Everything is Connected. 14 March, 2014. Web. http://www.govtech.com/fs/news/Becoming-a-Smart-City.html
Williams, Paul T, 2013: Waste Treatment and Disposal. John Wiley and Sons. Ed. 2.
Accessed Jan 2016. https://books.google.com/books?id=ZH9kkhd56IcC&printsec=frontcover#v=onepage&q&f=false
World Bank. 2015. “Building Regulation for Resilience: Managing Risks for Safer Cities.”
World Bank Group, GFDRR. https://www.gfdrr.org/sites/default/files/publication/BRR%20report.pdf
World Bank. 2013. “Solid Waste Management” World Bank Urban Development. Dec
21, 2013. Last updated 2017. http://www.worldbank.org/en/topic/urbandevelopment/brief/solid-waste-management
World Bank. 2016. “Urban Development Overview”. Last Updated Oct 10,2016.
http://www.worldbank.org/en/topic/urbandevelopment/overview World Bank. 2012. “What a Waste: A Global Review of Solid
Waste Management.” World Bank’s Urban Development Series. No. 15. Accessed Jan 2016. http://siteresources.worldbank.org/INTURBANDEVELOPMENT/Resources/336387-1334852610766/What_a_Waste2012_Final.pdf
World of Earth Science. 2003. “Waste Disposal.” The Gale Group, Inc. Last updated 2016. Accessed Jan 2016. http://www.encyclopedia.com/history/united-states-/and-canada/us-history/waste-disposal
World Economic and Social Survey, 2013: Towards Sustainable Cities. UN (United
Nations) Sustainable Development Challenges. pp 53-84 http://www.un.org/en/development/desa/policy/wess/wess_current/wess2013/Chapter3.pdf
Zborel, Tammy. 2010. Sustainable Cities: 10 Steps Forward. National League of Cities. Municipal Action Guide. June 2010. Accessed Nov 14, 2015. http://www.nlc.org/documents/Find%20City%20Solutions/Research%20Innovation/Sustainability/sustainable-cities-ten-steps-forward-mag-jun10.pdf
Zinco Green Roof. 2014. “Zinco Green Roof Projects.” Zinco Global Website.

60
http://www.zinco-greenroof.com/EN/references/companies_intensive_green_roofs.php

APPENDICES
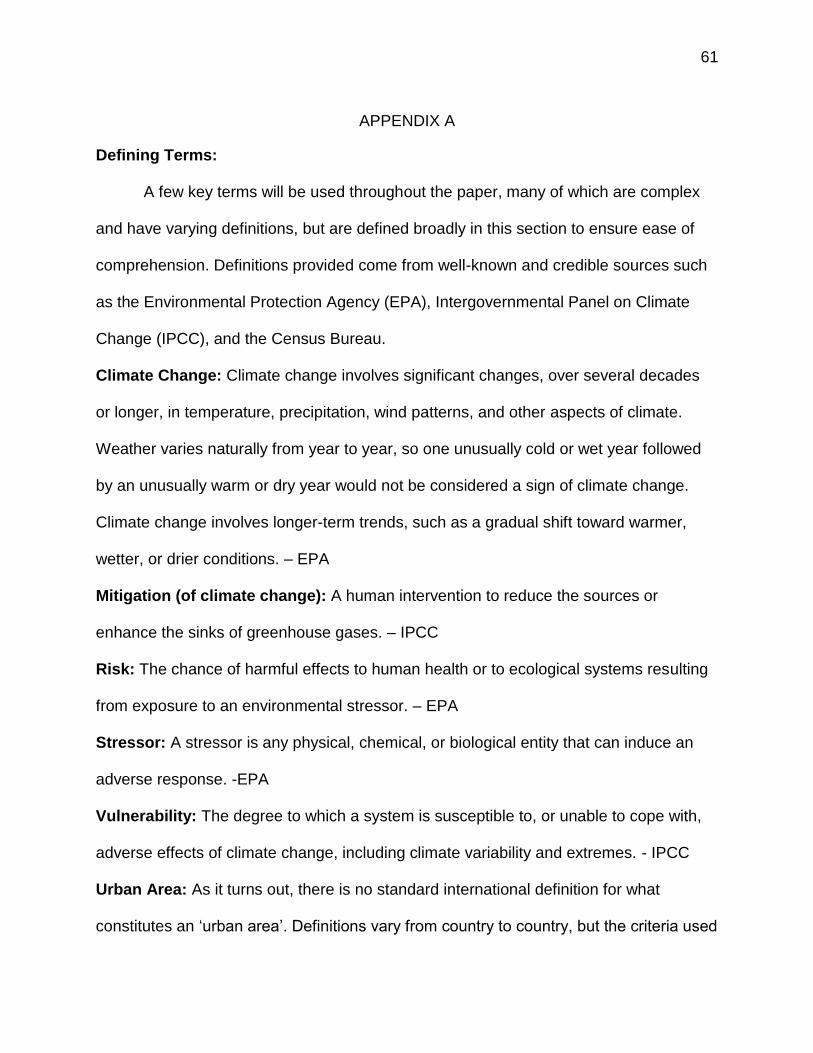
61
APPENDIX A
Defining Terms:
A few key terms will be used throughout the paper, many of which are complex
and have varying definitions, but are defined broadly in this section to ensure ease of
comprehension. Definitions provided come from well-known and credible sources such
as the Environmental Protection Agency (EPA), Intergovernmental Panel on Climate
Change (IPCC), and the Census Bureau.
Climate Change: Climate change involves significant changes, over several decades
or longer, in temperature, precipitation, wind patterns, and other aspects of climate.
Weather varies naturally from year to year, so one unusually cold or wet year followed
by an unusually warm or dry year would not be considered a sign of climate change.
Climate change involves longer-term trends, such as a gradual shift toward warmer,
wetter, or drier conditions. – EPA
Mitigation (of climate change): A human intervention to reduce the sources or
enhance the sinks of greenhouse gases. – IPCC
Risk: The chance of harmful effects to human health or to ecological systems resulting
from exposure to an environmental stressor. – EPA
Stressor: A stressor is any physical, chemical, or biological entity that can induce an
adverse response. -EPA
Vulnerability: The degree to which a system is susceptible to, or unable to cope with,
adverse effects of climate change, including climate variability and extremes. - IPCC
Urban Area: As it turns out, there is no standard international definition for what
constitutes an ‘urban area’. Definitions vary from country to country, but the criteria used
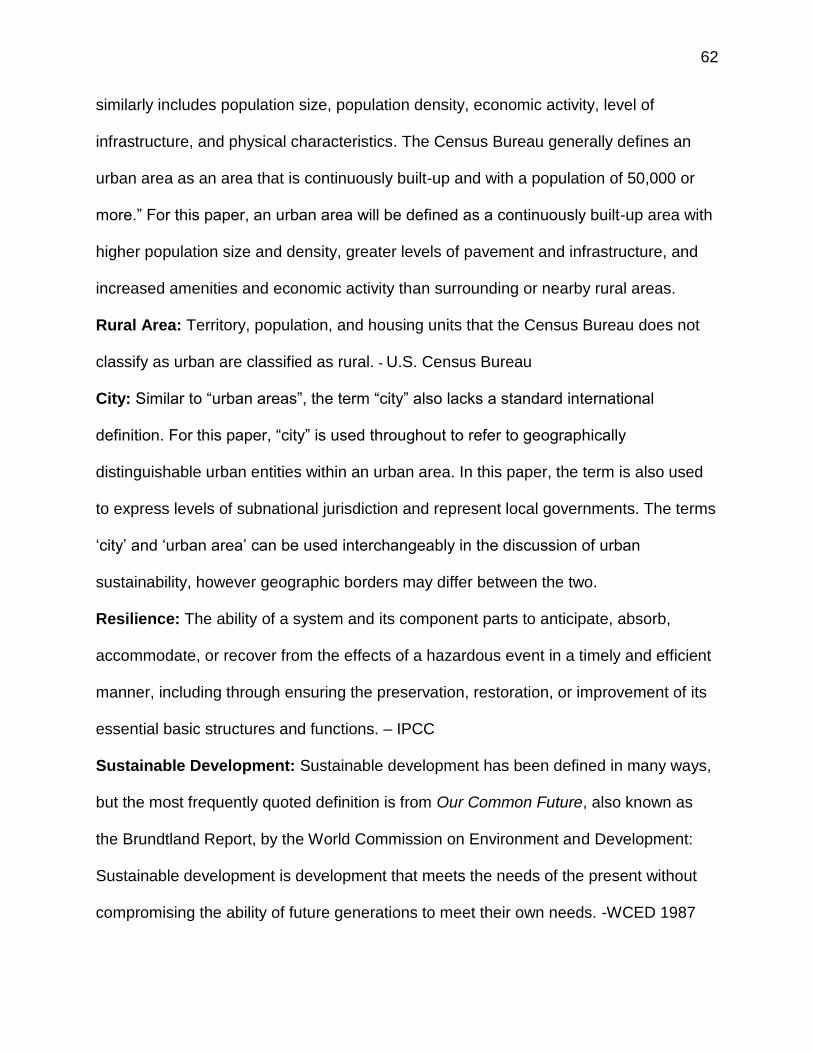
62
similarly includes population size, population density, economic activity, level of
infrastructure, and physical characteristics. The Census Bureau generally defines an
urban area as an area that is continuously built-up and with a population of 50,000 or
more.” For this paper, an urban area will be defined as a continuously built-up area with
higher population size and density, greater levels of pavement and infrastructure, and
increased amenities and economic activity than surrounding or nearby rural areas.
Rural Area: Territory, population, and housing units that the Census Bureau does not
classify as urban are classified as rural. - U.S. Census Bureau
City: Similar to “urban areas”, the term “city” also lacks a standard international
definition. For this paper, “city” is used throughout to refer to geographically
distinguishable urban entities within an urban area. In this paper, the term is also used
to express levels of subnational jurisdiction and represent local governments. The terms
‘city’ and ‘urban area’ can be used interchangeably in the discussion of urban
sustainability, however geographic borders may differ between the two.
Resilience: The ability of a system and its component parts to anticipate, absorb,
accommodate, or recover from the effects of a hazardous event in a timely and efficient
manner, including through ensuring the preservation, restoration, or improvement of its
essential basic structures and functions. – IPCC
Sustainable Development: Sustainable development has been defined in many ways,
but the most frequently quoted definition is from Our Common Future, also known as
the Brundtland Report, by the World Commission on Environment and Development:
Sustainable development is development that meets the needs of the present without
compromising the ability of future generations to meet their own needs. -WCED 1987
63
APPENDIX B
Abbreviations:
ACEEE (American Council for an Energy-Efficient Economy)
ADHD (Attention Deficit/Hyperactivity Disorder)
AASHE (The Association for the Advancement of Sustainability in Higher Education)
CWA (Clean Water Act)
EPA (Environmental Protection Agency)
EERS (Energy Efficiency Resource Standards)
GIS (Geographic Information System)
GPC (Global Protocol for Community-Scale Greenhouse Gas Emission Inventories)
GBCI (Green Building Certification Inc.)
ICLEI (International Council for Local Environmental Initiatives)
IDP (Inclusionary Development Policy)
IPCC (Intergovernmental Panel on Climate Change)
LEED (Leadership in Energy and Environmental Design)
NOAA (The National Oceanic and Atmospheric Administration)
PEER (Performance Excellence in Electricity Renewal)
SDWA (Safe Drinking Water Act)
STARS (Sustainability Tracking Assessment & Rating System)
UCCRN (The Urban Climate Change Research Network)
UCLG (The United Cities and Local Governments)
USDN (Urban Sustainability Directors Network)
USGBC (The US Green Building Counsel)
64
VITA
Graduate School Southern Illinois University
Julia L. Sanabria [email protected] University of Iowa Bachelor of Science, Geoscience, August 2014 Special Honors and Awards: Environmental Ambassador’s Award, April 2017 Title: A Literature Review of Climate Change and Urban Sustainability Major Professor: Leslie A. Duram Publications: Sustainable Saluki Newsletter December 2015-May 2017