![The Solar System’s Motion in the Galactic Tidal Field 597[3].pdfThe Solar System’s Motion in the Galactic Tidal Field ... parameters for the solar system’s motion were taken](https://static.fdocuments.us/doc/165x107/5ab63e5c7f8b9a1a048d9cc1/the-solar-systems-motion-in-the-galactic-tidal-field-5973pdfthe-solar-systems.jpg)
A link between oxygen, calcium and titanium isotopes in ...wiscsims/pdfs/Koop_GCA2016-2.pdf ·...
26
A link between oxygen, calcium and titanium isotopes in 26 Al-poor hibonite-rich CAIs from Murchison and implications for the heterogeneity of dust reservoirs in the solar nebula Levke Ko ¨o ¨p a,b,c,⇑ , Andrew M. Davis a,b,c,d , Daisuke Nakashima e,f , Changkun Park g,h , Alexander N. Krot g , Kazuhide Nagashima g , Travis J. Tenner e , Philipp R. Heck a,b,c , Noriko T. Kita e a Department of the Geophysical Sciences, The University of Chicago, Chicago, IL, USA b Chicago Center for Cosmochemistry, The University of Chicago, Chicago, IL, USA c Robert A. Pritzker Center for Meteoritics and Polar Studies, Field Museum of Natural History, Chicago, IL, USA d Enrico Fermi Institute, The University of Chicago, Chicago, IL, USA e Dept. Geoscience, University of Wisconsin-Madison, WI, USA f Division of Earth and Planetary Materials Science, Tohoku University, Sendai, Japan g HIGP/SOEST University of Hawai‘i at M anoa, Honolulu, HI, USA h Korea Polar Research Institute, Incheon, Republic of Korea Received 30 July 2015; accepted in revised form 6 May 2016; Available online 13 May 2016 Abstract PLACs (platy hibonite crystals) and related hibonite-rich calcium-, aluminum-rich inclusions (CAIs; hereafter collectively referred to as PLAC-like CAIs) have the largest nucleosynthetic isotope anomalies of all materials believed to have formed in the solar system. Most PLAC-like CAIs have low inferred initial 26 Al/ 27 Al ratios and could have formed prior to injection or widespread distribution of 26 Al in the solar nebula. In this study, we report 26 Al– 26 Mg systematics combined with oxygen, calcium, and titanium isotopic compositions for a large number of newly separated PLAC-like CAIs from the Murchison CM2 chondrite (32 CAIs studied for oxygen, 26 of these also for 26 Al– 26 Mg, calcium and titanium). Our results confirm (1) the large range of nucleosynthetic anomalies in 50 Ti and 48 Ca (our data range from 70‰ to +170‰ and 60‰ to +80‰, respectively), (2) the substantial range of D 17 O values (28‰ to 17‰, with D 17 O= d 17 O 0.52 d 18 O), and (3) general 26 Al-depletion in PLAC-like CAIs. The multielement approach reveals a relationship between D 17 O and the degree of variability in 50 Ti and 48 Ca: PLAC-like CAIs with the highest D 17 O(17‰) show large positive and negative 50 Ti and 48 Ca anomalies, while those with the lowest D 17 O(28‰) have small to no anomalies in 50 Ti and 48 Ca. These observations could suggest a physical link between anomalous 48 Ca and 50 Ti carriers and an 16 O-poor reservoir. We suggest that the solar nebula was isotopically heterogeneous shortly after collapse of the protosolar molecular cloud, and that the primordial dust reservoir, in which anomalous carrier phases were heterogeneously distributed, was 16 O-poor (D 17 O P 17‰) relative to the primordial gaseous (CO + H 2 O) http://dx.doi.org/10.1016/j.gca.2016.05.014 0016-7037/Ó 2016 Elsevier Ltd. All rights reserved. ⇑ Corresponding author at: Department of the Geophysical Sciences, The University of Chicago, Chicago, IL, USA. E-mail address: [email protected] (L. Ko ¨o ¨p). www.elsevier.com/locate/gca Available online at www.sciencedirect.com ScienceDirect Geochimica et Cosmochimica Acta 189 (2016) 70–95
Transcript of A link between oxygen, calcium and titanium isotopes in ...wiscsims/pdfs/Koop_GCA2016-2.pdf ·...

Available online at www.sciencedirect.com
www.elsevier.com/locate/gca
ScienceDirect
Geochimica et Cosmochimica Acta 189 (2016) 70–95
A link between oxygen, calcium and titanium isotopesin 26Al-poor hibonite-rich CAIs from Murchison
and implications for the heterogeneity of dust reservoirsin the solar nebula
Levke Koop a,b,c,⇑, Andrew M. Davis a,b,c,d, Daisuke Nakashima e,f,Changkun Park g,h, Alexander N. Krot g, Kazuhide Nagashima g, Travis J. Tenner e,
Philipp R. Heck a,b,c, Noriko T. Kita e
aDepartment of the Geophysical Sciences, The University of Chicago, Chicago, IL, USAbChicago Center for Cosmochemistry, The University of Chicago, Chicago, IL, USA
cRobert A. Pritzker Center for Meteoritics and Polar Studies, Field Museum of Natural History, Chicago, IL, USAdEnrico Fermi Institute, The University of Chicago, Chicago, IL, USA
eDept. Geoscience, University of Wisconsin-Madison, WI, USAfDivision of Earth and Planetary Materials Science, Tohoku University, Sendai, Japan
gHIGP/SOEST University of Hawai‘i at M�anoa, Honolulu, HI, USAhKorea Polar Research Institute, Incheon, Republic of Korea
Received 30 July 2015; accepted in revised form 6 May 2016; Available online 13 May 2016
Abstract
PLACs (platy hibonite crystals) and related hibonite-rich calcium-, aluminum-rich inclusions (CAIs; hereafter collectivelyreferred to as PLAC-like CAIs) have the largest nucleosynthetic isotope anomalies of all materials believed to have formed inthe solar system. Most PLAC-like CAIs have low inferred initial 26Al/27Al ratios and could have formed prior to injection orwidespread distribution of 26Al in the solar nebula. In this study, we report 26Al–26Mg systematics combined with oxygen,calcium, and titanium isotopic compositions for a large number of newly separated PLAC-like CAIs from the MurchisonCM2 chondrite (32 CAIs studied for oxygen, 26 of these also for 26Al–26Mg, calcium and titanium). Our results confirm(1) the large range of nucleosynthetic anomalies in 50Ti and 48Ca (our data range from �70‰ to +170‰ and �60‰ to+80‰, respectively), (2) the substantial range of D17O values (�28‰ to �17‰, with D17O = d17O � 0.52 � d18O), and (3)general 26Al-depletion in PLAC-like CAIs.
The multielement approach reveals a relationship between D17O and the degree of variability in 50Ti and 48Ca: PLAC-likeCAIs with the highest D17O (��17‰) show large positive and negative 50Ti and 48Ca anomalies, while those with the lowestD17O (��28‰) have small to no anomalies in 50Ti and 48Ca. These observations could suggest a physical link betweenanomalous 48Ca and 50Ti carriers and an 16O-poor reservoir. We suggest that the solar nebula was isotopically heterogeneousshortly after collapse of the protosolar molecular cloud, and that the primordial dust reservoir, in which anomalous carrierphases were heterogeneously distributed, was 16O-poor (D17O P �17‰) relative to the primordial gaseous (CO + H2O)
http://dx.doi.org/10.1016/j.gca.2016.05.014
0016-7037/� 2016 Elsevier Ltd. All rights reserved.
⇑ Corresponding author at: Department of the GeophysicalSciences, The University of Chicago, Chicago, IL, USA.
E-mail address: [email protected] (L. Koop).

L. Koop et al. /Geochimica et Cosmochimica Acta 189 (2016) 70–95 71
reservoir (D17O < �35‰). However, other models such as CO self-shielding in the protoplanetary disk are also considered toexplain the link between oxygen and calcium and titanium isotopes in PLAC-like CAIs.� 2016 Elsevier Ltd. All rights reserved.
Keywords: Platy hibonite crystals (PLACs); CAI; Meteorites; Solar nebula; Oxygen isotopes; Titanium isotopes; Calcium isotopes;Aluminum-26
1. INTRODUCTION
Oxygen is unique among the chemical elements in thesolar system in that significant fractions were present insolid and gaseous states over a large range of temperaturesin the solar nebula. Meteoritic materials show mass-independent variations in oxygen isotopes that are ofextraordinary magnitude for a major rock-formingelement. For example, many calcium-, aluminum-richinclusions (CAIs), the oldest dated materials that formedin the solar system (e.g., Connelly et al., 2012), are enrichedin 16O by �5% compared to terrestrial planets and aster-oids (Clayton et al., 1973; MacPherson et al., 2008;Makide et al., 2009; Ushikubo et al., 2011). The degreeof enrichment/depletion in 16O is commonly expressedusing the D17O value, (D17O = d17O � 0.52 � d18O, withd-values being defined as diO = [(iO/16O)unknown/(iO/16O)VSMOW � 1] � 1000, for isotope i and whereVSMOW corresponds to Vienna standard mean oceanwater; Baertschi, 1976), which allows for comparison of16O-enrichment even for materials with mass-dependentisotope fractionation in oxygen. Analyses of solar windcollected by NASA’s Genesis mission confirmed a predic-tion (Clayton, 2002) that the Sun, like most CAIs, isenriched in 16O relative to the Earth and terrestrial planets(McKeegan et al., 2011). As the Sun contains most of themass of the solar system and is thus representative of itsaverage composition, it is not CAIs but terrestrial planetsthat are highly aberrant in their oxygen isotopic composi-tion. Several models have been proposed to explain thisdiscrepancy, which are either based on inheritance of dis-tinct nucleosynthetic oxygen isotope reservoirs from themolecular cloud core (Krot et al., 2010) or isotopicallyselective gas phase reactions. The latter include self-shielding during photodissociation of CO molecules fol-lowed by water ice/CO gas fractionation and thermal pro-cessing of silicate dust in a gaseous reservoir enriched in17O and 18O (Clayton, 2002; Yurimoto and Kuramoto,2004; Lyons and Young, 2005), as well as symmetry-based reactions (Thiemens, 2006).
Many CAIs seem to have formed in a uniform oxygenisotopic reservoir that was slightly depleted in 16O com-pared to the solar D17O value of �28.4 ± 3.6‰ (±2r;McKeegan et al., 2011). For example, CAIs from CR chon-drites and the primitive ungrouped chondrite Acfer 094commonly show a D17O value of approximately �23‰(Makide et al., 2009; Ushikubo et al., 2011). Many CVCAIs likely formed in a similar reservoir, as indicated bythe common D17O value of ��23‰ in spinel, hibonite, fas-saite (Al, Ti-diopside), and forsterite grains (e.g.,MacPherson et al., 2008). More 16O-poor compositions in
melilite and anorthite in the same CV CAIs are commonlyinterpreted as subsequent mineral-dependent exchange withor remelting in a 16O-poor reservoir (Krot et al., 2009, andreferences therein). However, D17O variations in some CVand CO CAIs have also been attributed to fluctuations inthe isotopic composition of the CAI formation region(e.g., Simon et al., 2011; Kawasaki et al., 2012; Parket al., 2012). Additional important exceptions from theuniform CAI value are several grossite-rich CAIs and achondrule from CH carbonaceous chondrites that are16O-enriched relative to the Sun’s value (D17O as low as�37‰; Kobayashi et al., 2003; Krot et al., 2008, 2015;Gounelle et al., 2009).
In addition to oxygen isotopes, CAIs provide importantinformation about the presence of various nucleosyntheticcomponents in the solar nebula. For example, most CVCAIs incorporated the short-lived (half-life of �0.7 Ma)radionuclide 26Al at a uniform 26Al/27Al ratio of�5.2 � 10�5, called the canonical ratio (Jacobsen et al.,2008; MacPherson et al., 2012). In addition, CAIs showsmall-scale anomalies in stable isotopes like 50Ti, 96Zr,and 92Mo, typically within �1‰ of the terrestrial values(e.g., Schonbachler et al., 2003; Trinquier et al., 2009;Burkhardt et al., 2011; Akram et al., 2013). In the contextof this study, we define ‘‘regular CAIs” as those having(1) a uniform D17O of about �23‰, (2) a canonical26Al/27Al ratio, and (3) small-scale nucleosyntheticanomalies.
When compared to regular CAIs, FUN (fractionatedand unidentified nuclear effects) CAIs and PLACs (platyhibonite crystals) are isotopically distinct. In particular,both FUN CAIs and PLACs have lower inferred 26Al/27Alratios than regular CAIs, and some have evidence for for-mation in the absence of 26Al (e.g., Wasserburg et al.,1977; Ireland, 1990; Liu et al., 2009; Park et al., 2013). This26Al deficiency is commonly attributed to an early forma-tion prior to arrival of 26Al rather than a late formationafter 26Al decay, because FUN CAIs and PLACs preservelarger nucleosynthetic anomalies than regular CAIs(Wood, 1998; Sahijpal and Goswami, 1998). In PLACs,nucleosynthetic anomalies can be up to two orders of mag-nitude greater than in CV CAIs (e.g., PLACs have a d50Tirange of �300‰; Hinton et al., 1987; Ireland, 1990; Liuet al., 2009); in FUN CAIs, the range of anomalies is inter-mediate between PLACs and regular CV CAIs (e.g., FUNCAIs have a d50Ti range of �35‰; Krot et al., 2014; Parket al., 2014). The D17O values of these 26Al-poor, anoma-lous CAIs also span a wide range from ��28‰ to �0‰(Liu et al., 2009; Krot et al., 2008, 2010, 2014, 2015), indi-cating oxygen isotopic heterogeneity in the earliest stages ofsolar system history.
72 L. Koop et al. /Geochimica et Cosmochimica Acta 189 (2016) 70–95
PLACs may be uniquely suited to constrain the origin ofthe solar system’s early variation in oxygen isotopes. Theirlarge nucleosynthetic anomalies indicate that they could beamong the first objects that formed inside the solar system.In addition, and in contrast to FUN CAIs, their isotopicsignatures have not been overprinted by high degrees ofmass-dependent fractionation (Ireland, 1990; Liu et al.,2009). While the oxygen isotopic compositions of FUNCAIs are generally consistent with pre-evaporation compo-sitions close to the carbonaceous chondrite anhydrous min-eral (CCAM; Clayton et al., 1977) line (Mendybaev et al.,2013), the exact position of their precursors relative to theline remains unclear. A recent study found that the oxygenisotopic compositions of PLACs fall along the CCAM linelike regular CAIs and chondrules (Liu et al., 2009), suggest-ing that a single process could have been responsible for theoxygen isotope variations in the early solar system.
Based on their potential as a robust recorder of the iso-topic evolution of the early solar system, we present preciseoxygen isotopic compositions obtained with high spatialresolution for a large number of newly recovered, carefullyprepared PLACs from the Murchison CM2 chondrite. Inaddition, we analyzed many of these CAIs for magnesium,calcium, and titanium isotopes to better characterize theirformation environment and the relationships between dif-ferent isotopic components in the early solar system. Theresults show a clear relationship between the oxygen iso-topic composition and the magnitude of anomalies in cal-cium and titanium isotopes, which may be indicative ofthe processes responsible for oxygen isotopic variation inthe early solar system. In addition, we confirm the differ-ences between the titanium isotopic patterns in PLACsand in other solar system materials and use our calciumand titanium isotopic patterns to investigate the stellarsources that contributed material to the early solar system.
2. METHODS
2.1. Sample recovery and selection
Many of the hibonite-rich CAIs were separated from a92 g piece of the Murchison meteorite from the FieldMuseum meteorite collection (FMNH ME 2644). Thiswas achieved by disaggregation with dental tools, whichincluded removal of the fusion crust, followed by repeatedfreezing and thawing while immersed in high purity water(Fisher OptimaTM grade). The hibonite-rich CAIs were con-centrated by density separation using an organic heavy liq-uid (Cargille Labs, density 3.31 g cm�3). The heavy fractionwas then washed in high purity acetone and isopropanol(both Fisher OptimaTM grade) and distributed among 25dishes, from which CAI candidates were picked. Additionalhibonite-rich objects were recovered from an existingMurchison acid-residue (Amari et al., 1994). The sampleswere mounted on conductive carbon tape and their mineralchemistry was confirmed by energy-dispersive X-ray spec-troscopy (EDS). The focus of this study is on the refractory,26Al-poor and isotopically anomalous types of hibonite-rich CAIs. Other hibonite-bearing objects, such as SHIBsand highly mass-fractionated hibonites, were obtained in
the same process and were isotopically and chemically ana-lyzed in the same sessions (Koop et al., 2015, 2016).
2.2. Sample preparation
After removal from the conductive tape, the hibonite-rich CAIs were cleaned with high purity isopropanol(Fisher OptimaTM grade) and dried. Together with terrestrialmineral standards, the hibonite-rich CAIs were mounted inone-inch diameter epoxy disks. During polishing with acombination of lapping films and polishing pads, care wastaken to prepare flat surfaces to avoid instrumental massfractionation due to topography (Kita et al., 2009). Thepolishing relief was checked using a Zygo profilometer atthe University of Wisconsin and was found to be minimalin nine randomly selected mounts. Specifically, height dif-ferences between grains and epoxy were 62 lm, and thetypical profile over a one-inch disk surface was 610 lm.The polished mounts were carbon-coated for chemicaland isotopic analyses.
2.3. Electron microscopy
The hibonite-rich CAIs were characterized using scan-ning electron microscopy (SEM) with a Zeiss EVO 60 atthe Field Museum and a JEOL JSM-5800LV at the Univer-sity of Chicago, both equipped with Oxford InstrumentsEDS systems. Backscattered electron (BSE) images, sec-ondary electron images, and EDS analyses were collectedon both unpolished and polished samples for petrologiccharacterization and for identifying the most suitable loca-tions for isotope analysis.
2.4. Electron microprobe analysis
Quantitative chemical analyses were performed with aCAMECA SX-50 electron probe microanalyzer (EPMA)at the University of Chicago. Most of the samples were ana-lyzed with a 100 nA beam and an acceleration voltage of20 kV; only the inclusions with small grain sizes were ana-lyzed with a 50 nA beam and a 15 kV acceleration voltage.Mineral standards were manganese hortonolite for magne-sium and iron, corundum for aluminum, and anorthite forcalcium. We observed negative magnesium contents on thecorundum standard due to curvature in the backgroundcaused by the intense aluminum peak, therefore, we cor-rected for the curvature using data obtained from multiplepeak scans of a magnesium-free corundum standard. Theeffect of this correction is negligible for all CAIs presentedhere.
2.5. Isotopic analyses
2.5.1. Oxygen
Oxygen isotope analyses were performed with theWiscSIMS CAMECA IMS 1280 (Kita et al., 2009, 2010)using a protocol similar to that of Nakashima et al.(2011). A small primary Cs+ beam (�20 pA, �3 � 4 lm2)was chosen, primarily to preserve material for furtherisotopic analysis and to avoid sampling of adjacent
L. Koop et al. /Geochimica et Cosmochimica Acta 189 (2016) 70–95 73
minerals or alteration phases. Simultaneous detection of thethree oxygen isotopes was achieved using a Faraday cup(FC) for 16O� and electron multipliers (EM) for 17O� and18O�. San Carlos olivine was used as a running standardand a WiscSIMS hibonite standard was used for instrumen-tal bias correction. Two to four spot analyses were collectedin each CAI, and nine to thirteen unknown analyses werebracketed by eight analyses of the San Carlos olivine stan-dard. The external reproducibility of the running standard(�1‰ (2 standard deviation (SD)) for d18O, d17O, andD17O) was assigned as the analytical uncertainty ofunknown samples (see Kita et al., 2009). The contributionof the tailing of 16OH� interference to 17O� signal wascorrected using the method of Heck et al. (2010), thoughthe contribution was negligibly small (60.5‰). Afteroxygen isotope analysis, the SIMS pits were checked withthe SEM to verify that only primary, single phases had beensampled. Analyses from questionable pits (i.e., pits thatwere found to contain epoxy or other primary or secondaryphases) were rejected. Oxygen was the first element studiedby SIMS in all CAIs to avoid problems with ion implanta-tion from the primary 16O� beam, which was used for mag-nesium, calcium, and titanium isotopic measurements.Analyses of oxygen isotope standards are presented inTable EA.1.
2.5.2. Aluminum–magnesium
Magnesium isotopes in hibonite were analyzed with theWiscSIMS CAMECA IMS-1280 using monocollection EMdetection combined with an additional multicollector FCdetector for simultaneous detection of 27Al (Kita et al.,2012; Ushikubo et al., 2013). The measurements were per-formed in two separate sessions, both of which used a�9 lm diameter primary O� beam. The primary beamintensity was 0.15 nA, secondary 24Mg+ signals were withina range of (0.3–1.7) � 105 cps. The Madagascar hibonite(MH) standard was analyzed to determine relative sensitiv-ity factors (RSF) between 27Al+ and 24Mg+ signals, as wasdone in previous studies (Ireland, 1988; Liu et al., 2012).The 24Mg+ signal of the hibonite standard was at the highend of the acceptable EM range (4 � 105 cps), which wouldresult in a dead time correction inaccuracy of �1‰. There-fore, we used an anorthite glass standard with MgO con-tents comparable to unknown hibonites (1 wt%; Kitaet al., 2012) to estimate the instrumental bias correctionfor excess 26Mg (d26Mg*), in order to avoid any potentialinaccuracy of EM dead time brought about by analyzingthe hibonite standard with a much higher Mg+ secondaryion intensity. We also used anorthite to correct for instru-mental mass fractionation in d25Mg, which could haveintroduced a systematic bias due to the matrix effectbetween anorthite and hibonite. However, a comparisonof anorthite and Madagascar hibonite standard measure-ments shows that this effect is small. Counting times of indi-vidual ions for each cycle were 3 s for 24Mg+ and 10 s for25Mg+, 26Mg+, and 27Al+, respectively; the total numberof cycles for each magnesium isotope analysis was between20 and 40, with resulting uncertainties of 2.9‰ and 2.5‰on d26Mg*, 1.5‰ and 1.4‰ on both d25Mg and d26Mg.As the primary objective was to evaluate whether the
studied CAIs belong to the 26Al-poor population or not,we sometimes chose to acquire fewer cycles (i.e., 20 insteadof 40) to maximize the number of analyzed unknowns.
Excess 26Mg was calculated using the relationshipd26Mg* = d26Mg � [(1 + d25Mg/1000)1/b � 1] � 1000 (Kitaet al., 2012; Davis et al., 2015). We used the updated b valueof 0.5128 (Davis et al., 2015), however, no difference out-side of quoted uncertainties is observed when the previouslyrecommended b value of 0.514 (Davis et al., 2005) isapplied. As most analyzed CAIs are single hibonite crystals,initial 26Al/27Al ratios can only be inferred from model iso-chrons by assuming an initial magnesium isotopic composi-tion (the common assumption is that d26Mg*
0 = 0‰).However, this assumption is only relevant for a limitednumber of samples, as most unknowns do not show excess26Mg, despite high 27Al/24Mg ratios. Analyses of magne-sium isotope standards are presented in Table EA.1.
2.5.3. Calcium and titanium
The calcium and titanium isotopic compositions weremeasured with a CAMECA IMS-1280 at the Universityof Hawai‘i at M�anoa in 26 of the hibonite-rich CAIs thathad been studied for oxygen isotopes. The analytical proto-col used was similar to that of Park et al. (2014), which isbased on previous studies of hibonite-rich CAIs (Faheyet al., 1987a,b; Ireland, 1990). A primary 16O� beam witha current of 0.4–0.6 nA and a diameter of 15–18 lm wasused for both MH standards and unknowns. 40Ca ((1.5–4) � 106 cps) was detected by FC; all other isotopes ofcalcium and titanium as well as 51V+, 52Cr+, 53Cr+ and87Sr2+ were measured sequentially using the monocollectionEM detector (count-rates for calcium and titanium isotopeswere between 2 � 103 and <1 � 105 cps on EM). 60 cycleswere acquired with counting times of 2 s for 40Ca, 44Ca,and 48Ti, 4 s for 42Ca, 4.96 s for 46Ti, 47Ti, 48Ca, 49Ti,50Ti, 51V, 52Cr, and 53Cr, 10 s for 43Ca, and 0.96 s for87Sr2+, resulting in a total of �1.5 h for each analysis.The relative detection efficiency of the FC relative to theEM was determined from calcium isotopic measurementson standards assuming that D40Ca plots on a linear massfractionation line defined by D42Ca, D43Ca, and D48Ca(D-values are defined as DiCa = [(iCa/44Ca)measured/(
iCa/44Ca)terrestrial � 1] � 1000); the calculated FC yield using22 standard measurements is 1.011 ± 0.025 (2 standarderrors, SE). An EM dead time of 28.9 ± 2.1 ns (2 SE) wasdetermined from titanium isotopic measurements on aTiO2 standard and was corrected using methods similarto Fahey et al. (1987a) and Fahey (1998); the effect of theuncertainty in the dead time measurement is negligiblysmall for the CAIs studied. The magnification of the trans-fer optics was �160. Contrast and field aperture sizes of 400and 3000 lm, respectively, were chosen to transmit mostsecondary ions but to avoid transmission of scattered ionsand ions with large emitted angles. The entrance and exitslits were set to 31 and 94 lm, respectively, which resultedin a mass resolving power (MRP) of �11,170 defined at10% of peak height. Compared to fully opened entranceslits and field aperture, the resulting transmission was�11%. The MRP was similar to that of Liu et al. (2009)and was chosen to resolve 48Ca from 48Ti. With this

74 L. Koop et al. /Geochimica et Cosmochimica Acta 189 (2016) 70–95
MRP, the tail of the 48Ti peak at the center of the 48Ca peakhad decreased by a factor of �4 � 10�5, which correspondsto a contribution of the 48Ti tail to 48Ca of less than �1.5‰in this study and is thus not resolvable within 2r uncertain-ties. A few isobaric interferences on other masses cannot be
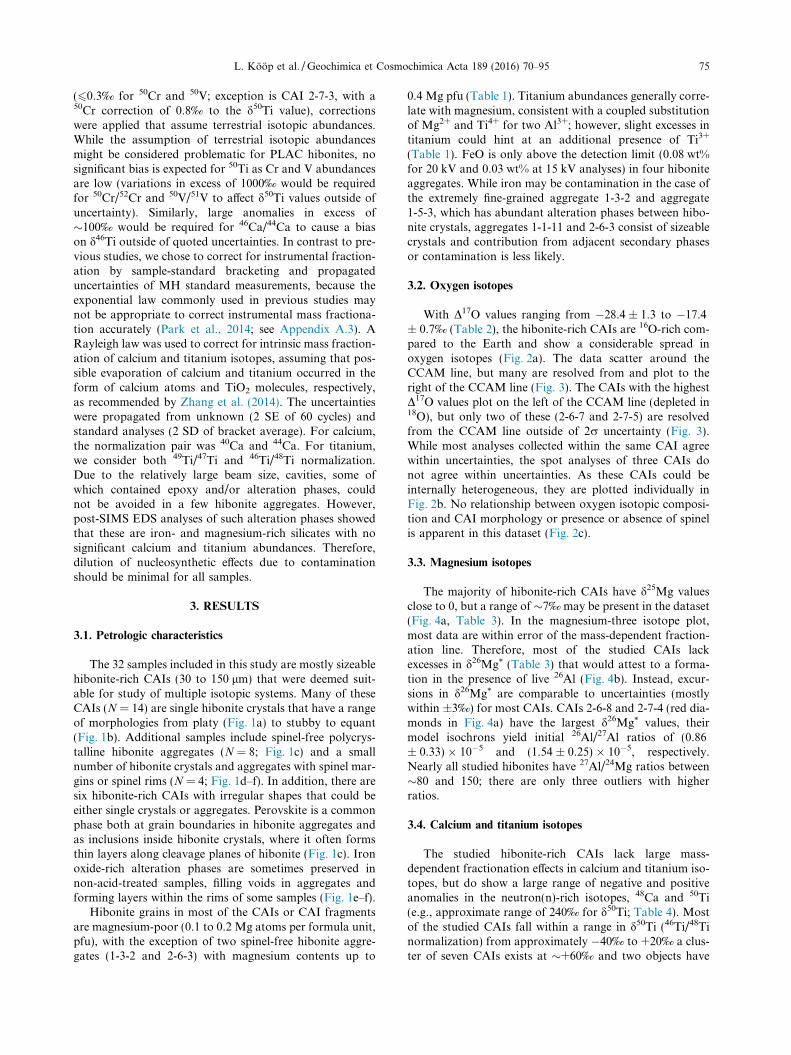
Fig. 1. BSE images of unpolished and polished hibonite-rich CAIs wiunpolished. (b) Stubby hibonite crystal, partially surrounded by a silicatehibonite aggregate with perovskite inclusions. (d) Hibonite plate with spi(e) and after polishing (f). The aggregate is partially surrounded by a rimmagnesium-rich silicate (possibly diopside).
resolved at this MRP and required correction. Interferenceof 46Ca on 46Ti was corrected by assuming a terrestrial46Ca/44Ca ratio for unknowns. 52Cr and 51V were moni-tored during analysis for possible interference of 50Cr and50V on 50Ti. While contributions are mostly insignificant
th scale bars corresponding to 50 lm. (a) Platy hibonite crystal,rim containing small crystals of perovskite and spinel. (c) Polished
nel margin (dark gray, left). (e, f) Hibonite aggregate (2-6-9) beforeof alteration phases (FeO-rich silicates), spinel and a calcium- and
L. Koop et al. /Geochimica et Cosmochimica Acta 189 (2016) 70–95 75
(60.3‰ for 50Cr and 50V; exception is CAI 2-7-3, with a50Cr correction of 0.8‰ to the d50Ti value), correctionswere applied that assume terrestrial isotopic abundances.While the assumption of terrestrial isotopic abundancesmight be considered problematic for PLAC hibonites, nosignificant bias is expected for 50Ti as Cr and V abundancesare low (variations in excess of 1000‰ would be requiredfor 50Cr/52Cr and 50V/51V to affect d50Ti values outside ofuncertainty). Similarly, large anomalies in excess of�100‰ would be required for 46Ca/44Ca to cause a biason d46Ti outside of quoted uncertainties. In contrast to pre-vious studies, we chose to correct for instrumental fraction-ation by sample-standard bracketing and propagateduncertainties of MH standard measurements, because theexponential law commonly used in previous studies maynot be appropriate to correct instrumental mass fractiona-tion accurately (Park et al., 2014; see Appendix A.3). ARayleigh law was used to correct for intrinsic mass fraction-ation of calcium and titanium isotopes, assuming that pos-sible evaporation of calcium and titanium occurred in theform of calcium atoms and TiO2 molecules, respectively,as recommended by Zhang et al. (2014). The uncertaintieswere propagated from unknown (2 SE of 60 cycles) andstandard analyses (2 SD of bracket average). For calcium,the normalization pair was 40Ca and 44Ca. For titanium,we consider both 49Ti/47Ti and 46Ti/48Ti normalization.Due to the relatively large beam size, cavities, some ofwhich contained epoxy and/or alteration phases, couldnot be avoided in a few hibonite aggregates. However,post-SIMS EDS analyses of such alteration phases showedthat these are iron- and magnesium-rich silicates with nosignificant calcium and titanium abundances. Therefore,dilution of nucleosynthetic effects due to contaminationshould be minimal for all samples.
3. RESULTS
3.1. Petrologic characteristics
The 32 samples included in this study are mostly sizeablehibonite-rich CAIs (30 to 150 lm) that were deemed suit-able for study of multiple isotopic systems. Many of theseCAIs (N = 14) are single hibonite crystals that have a rangeof morphologies from platy (Fig. 1a) to stubby to equant(Fig. 1b). Additional samples include spinel-free polycrys-talline hibonite aggregates (N = 8; Fig. 1c) and a smallnumber of hibonite crystals and aggregates with spinel mar-gins or spinel rims (N = 4; Fig. 1d–f). In addition, there aresix hibonite-rich CAIs with irregular shapes that could beeither single crystals or aggregates. Perovskite is a commonphase both at grain boundaries in hibonite aggregates andas inclusions inside hibonite crystals, where it often formsthin layers along cleavage planes of hibonite (Fig. 1c). Ironoxide-rich alteration phases are sometimes preserved innon-acid-treated samples, filling voids in aggregates andforming layers within the rims of some samples (Fig. 1e–f).
Hibonite grains in most of the CAIs or CAI fragmentsare magnesium-poor (0.1 to 0.2 Mg atoms per formula unit,pfu), with the exception of two spinel-free hibonite aggre-gates (1-3-2 and 2-6-3) with magnesium contents up to
0.4 Mg pfu (Table 1). Titanium abundances generally corre-late with magnesium, consistent with a coupled substitutionof Mg2+ and Ti4+ for two Al3+; however, slight excesses intitanium could hint at an additional presence of Ti3+
(Table 1). FeO is only above the detection limit (0.08 wt%for 20 kV and 0.03 wt% at 15 kV analyses) in four hiboniteaggregates. While iron may be contamination in the case ofthe extremely fine-grained aggregate 1-3-2 and aggregate1-5-3, which has abundant alteration phases between hibo-nite crystals, aggregates 1-1-11 and 2-6-3 consist of sizeablecrystals and contribution from adjacent secondary phasesor contamination is less likely.
3.2. Oxygen isotopes
With D17O values ranging from �28.4 ± 1.3 to �17.4± 0.7‰ (Table 2), the hibonite-rich CAIs are 16O-rich com-pared to the Earth and show a considerable spread inoxygen isotopes (Fig. 2a). The data scatter around theCCAM line, but many are resolved from and plot to theright of the CCAM line (Fig. 3). The CAIs with the highestD17O values plot on the left of the CCAM line (depleted in18O), but only two of these (2-6-7 and 2-7-5) are resolvedfrom the CCAM line outside of 2r uncertainty (Fig. 3).While most analyses collected within the same CAI agreewithin uncertainties, the spot analyses of three CAIs donot agree within uncertainties. As these CAIs could beinternally heterogeneous, they are plotted individually inFig. 2b. No relationship between oxygen isotopic composi-tion and CAI morphology or presence or absence of spinelis apparent in this dataset (Fig. 2c).
3.3. Magnesium isotopes
The majority of hibonite-rich CAIs have d25Mg valuesclose to 0, but a range of �7‰ may be present in the dataset(Fig. 4a, Table 3). In the magnesium-three isotope plot,most data are within error of the mass-dependent fraction-ation line. Therefore, most of the studied CAIs lackexcesses in d26Mg* (Table 3) that would attest to a forma-tion in the presence of live 26Al (Fig. 4b). Instead, excur-sions in d26Mg* are comparable to uncertainties (mostlywithin ±3‰) for most CAIs. CAIs 2-6-8 and 2-7-4 (red dia-monds in Fig. 4a) have the largest d26Mg* values, theirmodel isochrons yield initial 26Al/27Al ratios of (0.86± 0.33) � 10�5 and (1.54 ± 0.25) � 10�5, respectively.Nearly all studied hibonites have 27Al/24Mg ratios between�80 and 150; there are only three outliers with higherratios.
3.4. Calcium and titanium isotopes
The studied hibonite-rich CAIs lack large mass-dependent fractionation effects in calcium and titanium iso-topes, but do show a large range of negative and positiveanomalies in the neutron(n)-rich isotopes, 48Ca and 50Ti(e.g., approximate range of 240‰ for d50Ti; Table 4). Mostof the studied CAIs fall within a range in d50Ti (46Ti/48Tinormalization) from approximately �40‰ to +20‰ a clus-ter of seven CAIs exists at �+60‰ and two objects have

Table 1Hibonite mineral chemistry obtained by electron microprobe analysis. In the case of multiple analyses in the same grain, average concentrations are given (in weight percentages, wt%, withuncertainties corresponding to two standard deviations).
Name Na Vb Ions per formula unit Weight percents
Ca2+ Al3+ Mg2+ Ti4+ O2� Cation CaO Al2O3 MgO TiO2 FeO Sum(kV) Sum (wt%) (wt%) (wt%) (wt%) (wt%) (wt%)
1-1-11 3 15, 20 1.0 11.7 0.1 0.2 19 13.00 8.5 ± 0.2 87.9 ± 1.3 0.8 ± 0.0 1.9 ± 0.7 0.13 ± 0.19 99.31-3-2 1 15 1.0 11.2 0.4 0.3 19 13.01 8.4 84.3 2.2 4.1 0.12 99.51-4-2 2 15 1.0 11.6 0.2 0.2 19 13.01 8.5 ± 0.2 87.0 ± 0.7 1.0 ± 0.2 2.1 ± 0.6 b.d. 98.61-4-3 3 15 1.0 11.7 0.1 0.1 19 13.01 8.6 ± 0.2 88.5 ± 1.6 0.7 ± 0.2 1.4 ± 0.7 b.d. 99.21-4-5 4 15 1.0 11.7 0.1 0.1 19 13.00 8.4 ± 0.1 87.6 ± 1.1 0.7 ± 0.1 1.7 ± 0.3 b.d. 98.51-5-3 4 15 1.1 11.6 0.1 0.2 19 13.01 8.7 ± 0.4 87.8 ± 1.1 0.9 ± 0.2 2.0 ± 0.8 0.14 ± 0.15 99.61-6-1 3 15 1.0 11.7 0.1 0.2 19 13.00 8.5 ± 0.2 88.5 ± 0.9 0.9 ± 0.1 1.9 ± 0.3 b.d. 99.91-9-3 1 20 1.0 11.5 0.2 0.2 19 13.00 8.6 87.4 1.2 2.7 b.d. 99.91-9-4 2 20 1.0 11.6 0.2 0.2 19 13.00 8.5 ± 0.0 87.8 ± 0.5 1.1 ± 0.0 2.4 ± 0.1 b.d. 99.92-2-7 2 20 1.0 11.7 0.1 0.1 19 12.98 8.3 ± 0.1 89.6 ± 1.9 0.6 ± 0.1 1.7 ± 0.0 b.d. 100.32-2-9 2 20 1.0 11.7 0.1 0.1 19 13.00 8.5 ± 0.1 89.1 ± 1.4 0.8 ± 0.1 1.7 ± 0.0 b.d. 100.02-6-2 2 20 1.0 11.6 0.2 0.2 19 12.99 8.4 ± 0.0 89.1 ± 2.2 1.1 ± 0.2 2.4 ± 0.6 b.d. 101.12-6-3 2 20 1.0 11.4 0.3 0.3 19 13.00 8.6 ± 0.1 86.0 ± 1.4 1.6 ± 0.0 3.2 ± 0.2 0.05 ± 0.03 99.52-6-5 2 20 1.0 11.6 0.2 0.2 19 13.00 8.6 ± 0.2 88.4 ± 0.1 0.9 ± 0.0 2.2 ± 0.3 b.d. 100.22-6-7 2 20 1.0 11.6 0.2 0.2 19 13.00 8.7 ± 0.9 88.7 ± 0.7 1.0 ± 0.1 2.4 ± 0.7 b.d. 100.82-6-9 2 20 1.0 11.6 0.2 0.2 19 13.00 8.6 ± 0.0 88.3 ± 1.6 1.0 ± 0.2 2.2 ± 0.7 b.d. 100.12-7-1 3 20 1.0 11.7 0.1 0.2 19 12.99 8.5 ± 0.0 89.8 ± 0.6 0.7 ± 0.1 1.9 ± 0.2 b.d. 101.02-7-3 3 20 1.0 11.7 0.1 0.2 19 13.00 8.7 ± 0.5 89.3 ± 1.5 0.8 ± 0.6 2.0 ± 0.5 b.d. 100.82-7-4 2 20 1.0 11.6 0.2 0.2 19 12.98 8.5 ± 0.1 88.7 ± 0.4 0.9 ± 0.1 2.6 ± 0.1 b.d. 100.72-7-5 2 20 1.0 11.7 0.1 0.1 19 13.00 8.5 ± 0.0 90.3 ± 0.5 0.7 ± 0.1 1.4 ± 0.4 b.d. 100.92-7-7 2 20 1.0 11.6 0.2 0.2 19 13.00 8.5 ± 0.0 88.9 ± 2.3 0.9 ± 0.3 2.2 ± 0.8 b.d. 100.52-8-1 4 15, 20 1.0 11.6 0.2 0.2 19 12.99 8.4 ± 0.2 87.6 ± 0.9 1.0 ± 0.0 2.6 ± 0.2 b.d. 99.72-8-2 33 15, 20 1.0 11.6 0.1 0.2 19 12.99 8.5 ± 0.2 88.4 ± 1.0 0.8 ± 0.0 2.1 ± 0.2 b.d. 99.82-8-5 2 20 1.0 11.6 0.2 0.2 19 13.00 8.6 ± 0.1 88.6 ± 0.6 1.0 ± 0.2 2.2 ± 0.4 b.d. 100.42-9-1 2 20 1.0 11.6 0.2 0.2 19 12.99 8.5 ± 0.0 89.1 ± 1.1 0.9 ± 0.0 2.3 ± 0.1 b.d. 100.82-9-2 2 20 1.0 11.6 0.2 0.2 19 12.99 8.5 ± 0.3 88.7 ± 0.2 1.0 ± 0.1 2.4 ± 0.4 b.d. 100.62-9-3 2 20 1.0 11.6 0.2 0.2 19 12.98 8.5 ± 0.2 88.0 ± 0.8 1.0 ± 0.1 2.7 ± 0.1 b.d. 100.22-9-4 1 20 1.0 11.7 0.2 0.2 19 13.00 8.5 88.8 0.9 2.0 b.d. 100.22-9-7 1 20 1.0 11.6 0.2 0.2 19 13.00 8.6 88.5 1.0 2.3 b.d. 100.4
a N: Number of analyses.b V: Acceleration voltage.
76L
.K
oop
etal./
Geo
chim
icaet
Cosm
och
imica
Acta
189(2016)
70–95
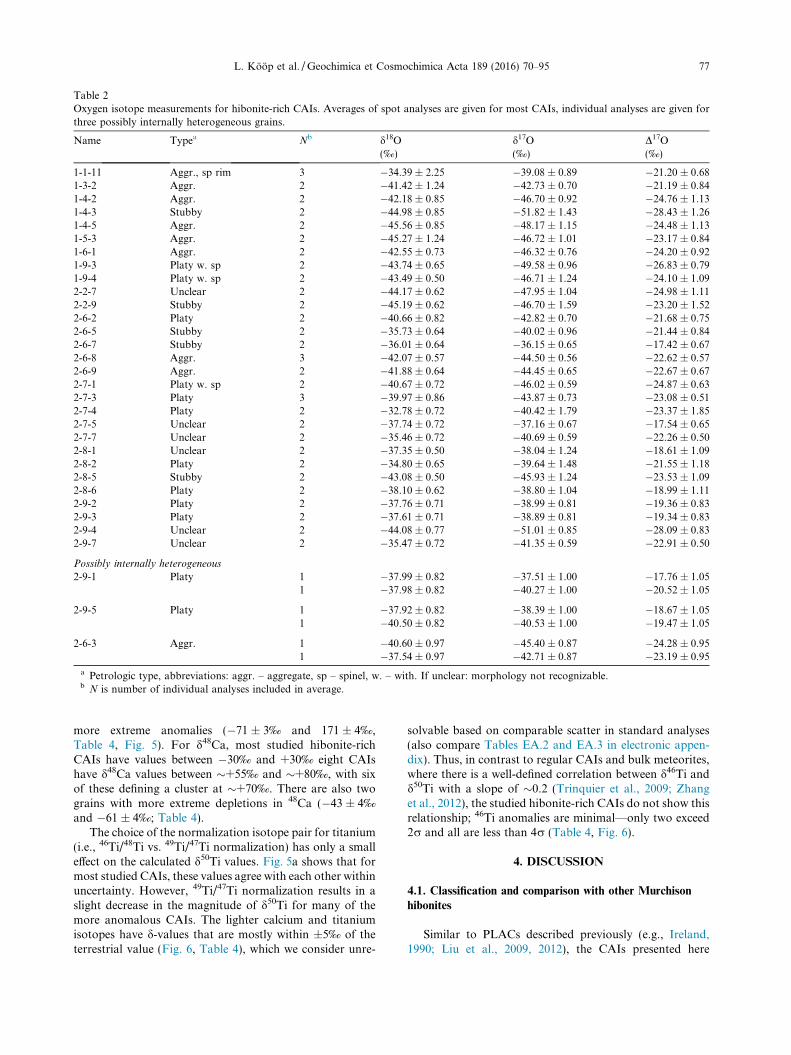
Table 2Oxygen isotope measurements for hibonite-rich CAIs. Averages of spot analyses are given for most CAIs, individual analyses are given forthree possibly internally heterogeneous grains.
Name Typea Nb d18O d17O D17O(‰) (‰) (‰)
1-1-11 Aggr., sp rim 3 �34.39 ± 2.25 �39.08 ± 0.89 �21.20 ± 0.681-3-2 Aggr. 2 �41.42 ± 1.24 �42.73 ± 0.70 �21.19 ± 0.841-4-2 Aggr. 2 �42.18 ± 0.85 �46.70 ± 0.92 �24.76 ± 1.131-4-3 Stubby 2 �44.98 ± 0.85 �51.82 ± 1.43 �28.43 ± 1.261-4-5 Aggr. 2 �45.56 ± 0.85 �48.17 ± 1.15 �24.48 ± 1.131-5-3 Aggr. 2 �45.27 ± 1.24 �46.72 ± 1.01 �23.17 ± 0.841-6-1 Aggr. 2 �42.55 ± 0.73 �46.32 ± 0.76 �24.20 ± 0.921-9-3 Platy w. sp 2 �43.74 ± 0.65 �49.58 ± 0.96 �26.83 ± 0.791-9-4 Platy w. sp 2 �43.49 ± 0.50 �46.71 ± 1.24 �24.10 ± 1.092-2-7 Unclear 2 �44.17 ± 0.62 �47.95 ± 1.04 �24.98 ± 1.112-2-9 Stubby 2 �45.19 ± 0.62 �46.70 ± 1.59 �23.20 ± 1.522-6-2 Platy 2 �40.66 ± 0.82 �42.82 ± 0.70 �21.68 ± 0.752-6-5 Stubby 2 �35.73 ± 0.64 �40.02 ± 0.96 �21.44 ± 0.842-6-7 Stubby 2 �36.01 ± 0.64 �36.15 ± 0.65 �17.42 ± 0.672-6-8 Aggr. 3 �42.07 ± 0.57 �44.50 ± 0.56 �22.62 ± 0.572-6-9 Aggr. 2 �41.88 ± 0.64 �44.45 ± 0.65 �22.67 ± 0.672-7-1 Platy w. sp 2 �40.67 ± 0.72 �46.02 ± 0.59 �24.87 ± 0.632-7-3 Platy 3 �39.97 ± 0.86 �43.87 ± 0.73 �23.08 ± 0.512-7-4 Platy 2 �32.78 ± 0.72 �40.42 ± 1.79 �23.37 ± 1.852-7-5 Unclear 2 �37.74 ± 0.72 �37.16 ± 0.67 �17.54 ± 0.652-7-7 Unclear 2 �35.46 ± 0.72 �40.69 ± 0.59 �22.26 ± 0.502-8-1 Unclear 2 �37.35 ± 0.50 �38.04 ± 1.24 �18.61 ± 1.092-8-2 Platy 2 �34.80 ± 0.65 �39.64 ± 1.48 �21.55 ± 1.182-8-5 Stubby 2 �43.08 ± 0.50 �45.93 ± 1.24 �23.53 ± 1.092-8-6 Platy 2 �38.10 ± 0.62 �38.80 ± 1.04 �18.99 ± 1.112-9-2 Platy 2 �37.76 ± 0.71 �38.99 ± 0.81 �19.36 ± 0.832-9-3 Platy 2 �37.61 ± 0.71 �38.89 ± 0.81 �19.34 ± 0.832-9-4 Unclear 2 �44.08 ± 0.77 �51.01 ± 0.85 �28.09 ± 0.832-9-7 Unclear 2 �35.47 ± 0.72 �41.35 ± 0.59 �22.91 ± 0.50
Possibly internally heterogeneous
2-9-1 Platy 1 �37.99 ± 0.82 �37.51 ± 1.00 �17.76 ± 1.051 �37.98 ± 0.82 �40.27 ± 1.00 �20.52 ± 1.05
2-9-5 Platy 1 �37.92 ± 0.82 �38.39 ± 1.00 �18.67 ± 1.051 �40.50 ± 0.82 �40.53 ± 1.00 �19.47 ± 1.05
2-6-3 Aggr. 1 �40.60 ± 0.97 �45.40 ± 0.87 �24.28 ± 0.951 �37.54 ± 0.97 �42.71 ± 0.87 �23.19 ± 0.95
a Petrologic type, abbreviations: aggr. – aggregate, sp – spinel, w. – with. If unclear: morphology not recognizable.b N is number of individual analyses included in average.
L. Koop et al. /Geochimica et Cosmochimica Acta 189 (2016) 70–95 77
more extreme anomalies (�71 ± 3‰ and 171 ± 4‰,Table 4, Fig. 5). For d48Ca, most studied hibonite-richCAIs have values between �30‰ and +30‰ eight CAIshave d48Ca values between �+55‰ and �+80‰, with sixof these defining a cluster at �+70‰. There are also twograins with more extreme depletions in 48Ca (�43 ± 4‰and �61 ± 4‰; Table 4).
The choice of the normalization isotope pair for titanium(i.e., 46Ti/48Ti vs. 49Ti/47Ti normalization) has only a smalleffect on the calculated d50Ti values. Fig. 5a shows that formost studied CAIs, these values agree with each other withinuncertainty. However, 49Ti/47Ti normalization results in aslight decrease in the magnitude of d50Ti for many of themore anomalous CAIs. The lighter calcium and titaniumisotopes have d-values that are mostly within ±5‰ of theterrestrial value (Fig. 6, Table 4), which we consider unre-
solvable based on comparable scatter in standard analyses(also compare Tables EA.2 and EA.3 in electronic appen-dix). Thus, in contrast to regular CAIs and bulk meteorites,where there is a well-defined correlation between d46Ti andd50Ti with a slope of �0.2 (Trinquier et al., 2009; Zhanget al., 2012), the studied hibonite-rich CAIs do not show thisrelationship; 46Ti anomalies are minimal—only two exceed2r and all are less than 4r (Table 4, Fig. 6).
4. DISCUSSION
4.1. Classification and comparison with other Murchison
hibonites
Similar to PLACs described previously (e.g., Ireland,1990; Liu et al., 2009, 2012), the CAIs presented here

Fig. 2. Oxygen three-isotope diagrams. (a) All studied PLAC-like CAIs are 16O-rich relative to the terrestrial fractionation line, but define aconsiderable spread in oxygen isotopes. (b) The enlargement of the PLAC-like CAI region from (a) shows that the data scatter aroundcommonly cited lines of slope �1 (i.e., CCAM; Young & Russell (Y&R), Young and Russell, 1998; and primitive chondrule mixing (PCM),Ushikubo et al., 2012). For comparison, the average composition of 36 SHIBs analyzed in the same session is plotted as well. (c) The color-coding shows that there is no obvious relationship between morphology and oxygen isotopes for the studied CAIs. Plots (a) and (b) show theaverage oxygen isotopic compositions from multiple analyses in the same PLAC-like CAIs, except for grains 2-6-3, 2-9-1 and 2-9-5, for whichindividual analyses are plotted as they may be heterogeneous in oxygen isotopes. In (c), average compositions are plotted for all PLAC-likeCAIs. (For interpretation of the references to color in this figure legend, the reader is referred to the web version of this article.)
Fig. 3. Oxygen isotopes in PLAC-like CAIs. (a) Same as Fig. 2c, but with color-coding indicating other isotopic properties (i.e., redcorresponds to PLAC-like CAIs with the highest d26Mg* values, orange and yellow to the largest positive and negative anomalies in 50Ti,respectively, blue to six grains with indistinguishable calcium and titanium isotopic compositions). The same color-coding is used insubsequent figures. (b) This D17O versus d18O plot shows the data as well as the CCAM line. If the precursors (e.g., solids or gases) of theseCAIs were initially on the CCAM line, subsequent processing resulted in isotopically light characters only for CAIs with enhanced D17Ovalues (yellow and orange diamonds, possibly also blue diamonds), while processing imprinted isotopically heavy signatures on many CAIswith low D17O. (For interpretation of the references to color in this figure legend, the reader is referred to the web version of this article.)
78 L. Koop et al. /Geochimica et Cosmochimica Acta 189 (2016) 70–95
consist predominantly of hibonite, show a large range ofd50Ti and d48Ca values, lack large radiogenic excesses in26Mg and show limited variation in magnesium contents(i.e., 27Al/24Mg ratios were typically 80–180; Fig. 4b). Thesecharacteristics were found in hibonite-rich CAIs with avariety of morphologies (Fig. 2c, Tables 2–4), i.e., singlehibonite crystals ranging from platy to equant, hibonite
aggregates, and objects in which hibonite is associated withspinel (usually margins or rims of spinel). Petrologicallysimilar inclusions have been classified as PLACs by otherauthors (Ireland, 1988, 1990; Liu et al., 2009, 2012). Butsince two-thirds of the CAIs studied here do not exhibitplaty morphologies, we classify these CAIs collectively asPLAC-like CAIs. The observation that most PLAC-like

Fig. 4. (a) Magnesium three-isotope diagram. Most PLAC-like CAIs show only small degrees of variation in 25Mg and 26Mg and plot withinuncertainty of the line defined by mass-dependent fractionation processes. Only two PLAC-like CAIs (red) show clear enrichments in 26Mgrelative to the array, possibly due to radioactive decay of 26Al. (b) All spot analyses of PLAC-like CAIs fall below the isochron defined byCAIs with a canonical abundance of 26Al (MacPherson et al., 2012). Most PLAC-like CAIs have d26Mg* values within uncertainty of 0‰, afew have values that are marginally resolved from 0‰, consistent with formation in a 26Al-free or -poor environment. Only two CAIs(red diamonds) have larger positive d26Mg* values, which could be a result of incorporation of 26Al or nucleosynthetic magnesium anomalies.(For interpretation of the references to color in this figure legend, the reader is referred to the web version of this article.)
L. Koop et al. /Geochimica et Cosmochimica Acta 189 (2016) 70–95 79
CAIs are not platy is consistent with the common descrip-tion of PLACs as crystal fragments, which implies theyhave broken off larger crystals or aggregates. Six PLAC-like CAIs studied here have identical isotopic compositionsin all four elements (within 2r uncertainty; blue diamondsin Figs. 2d, 4, 6 and 7), which also supports the idea thatmany single crystals may have been liberated from largerobjects by fragmentation, alteration on the parent bodyand/or sample preparation processes like disaggregationand in some cases acid treatment.
The four hibonite-rich CAIs that are associated with spi-nel were classified as PLAC-like CAIs instead of SHIBsbecause their isotopic properties closely resemble those ofPLAC-like CAIs (Figs. 2c and 5). Hibonite grains in theseCAIs also have uniformly low magnesium contents, similarto hibonite grains in spinel-free PLAC-like CAIs and differ-ent from SHIB hibonites (locally, magnesium contents insome SHIB hibonite grains may be similarly low, but such
grains are usually strongly zoned; Fig. A.2). A clear differ-ence between PLAC-like CAIs and SHIBs that were studiedin the same sessions is that PLAC-like CAIs show a largerrange and clear offsets from the CCAM line, while allSHIBs cluster near the CCAM line at a D17O of ��23‰(e.g., Koop et al., 2016).
4.2. Mass-dependent fractionation and nucleosynthetic effects
in PLAC-like CAIs
4.2.1. Oxygen isotopes
This study confirms the spread in D17O found in themost recent study of PLACs or PLAC-like CAIs (Liuet al., 2009). The observed range (�28‰ to �17‰) is morerestricted and on average more 16O-rich than D17O valuesof 26Al-poor FUN and F CAIs, which extend to �0‰(e.g., Krot et al., 2008, 2010, 2014, 2015).

Table 3Al–Mg isotope analyses, including 26Al/27Al ratios inferred from model isochrons. An anorthite standard was used for normalization.
Name Typea Phaseb Sessionc Cyclesd d25Mg d26Mg 27Al/24Mg d26Mg* 26Al/27Al(‰) (‰) (‰) (‰) (10�5)
1-1-11 Aggr., sp rim Hib July 14 20 2.2 ± 0.8 1.1 ± 1.7 123.9 ± 2.4 �3.3 ± 2.6 �0.4 ± 0.31-4-2 Aggr. Hib July 14 20 �0.3 ± 1.4 1.4 ± 1.4 111.5 ± 1.7 2.0 ± 3.4 0.2 ± 0.41-4-3 Stubby Hib Feb 14 39 �0.8 ± 1.8 1.9 ± 1.8 180.2 ± 2.7 3.4 ± 2.8 0.3 ± 0.21-4-5 Aggr. Hib July 14 20 �1.2 ± 1.5 �0.8 ± 1.5 144.5 ± 2.1 1.5 ± 2.5 0.1 ± 0.21-5-3 Aggr. Hib July 14 20 �0.8 ± 1.5 0.1 ± 1.5 106.1 ± 2.2 1.7 ± 2.6 0.2 ± 0.31-6-1 Aggr. Hib July 14 20 �1.8 ± 1.2 �1.0 ± 1.2 111.5 ± 2.3 2.6 ± 2.6 0.3 ± 0.31-9-3 Platy w. sp Hib Feb 14 37 �1.4 ± 1.5 0.7 ± 1.5 101.4 ± 2.9 3.3 ± 2.6 0.5 ± 0.42-2-7 Unclear Hib July 14 20 �2.2 ± 1.7 �0.1 ± 1.7 181.6 ± 2.5 4.2 ± 3.4 0.3 ± 0.32-2-9 Stubby Hib July 14 20 �2.0 ± 1.5 �2.7 ± 1.5 125.9 ± 1.8 1.2 ± 3.0 0.1 ± 0.32-6-2 Platy Hib July 14 20 0.0 ± 1.4 �0.5 ± 1.4 81.8 ± 1.6 �0.5 ± 2.7 �0.1 ± 0.52-6-5 Stubby Hib July 14 20 2.2 ± 1.5 2.6 ± 1.5 102.2 ± 2.0 �1.6 ± 2.5 �0.2 ± 0.32-6-7 Stubby Hib Feb 14 39 5.4 ± 1.6 7.1 ± 1.6 104.0 ± 1.8 �3.5 ± 2.5 �0.5 ± 0.32-6-8 Aggr. Hib July 14 20 1.7 ± 1.6 11.4 ± 1.6 114.6 ± 1.8 8.1 ± 3.1 1.0 ± 0.42-7-1 Platy w. sp Hib July 14 20 �0.3 ± 1.3 1.6 ± 1.3 135.1 ± 2.3 2.0 ± 2.3 0.2 ± 0.22-7-3 Platy Hib July 14 20 �2.7 ± 2.4 �6.6 ± 2.4 413.0 ± 5.3 �1.3 ± 4.6 0.0 ± 0.22-7-4 Platy Hib July 14 39 �0.7 ± 1.1 10.7 ± 1.1 103.3 ± 1.4 12.1 ± 2.2 1.6 ± 0.32-7-5 Unclear Hib July 14 39 0.1 ± 1.1 �0.4 ± 1.1 139.2 ± 1.4 �0.7 ± 2.1 �0.1 ± 0.22-8-1 Unclear Hib Feb 14 39 1.2 ± 1.8 2.5 ± 1.8 101.6 ± 1.4 0.2 ± 2.6 0.0 ± 0.42-8-2 Platy Hib July 14 20 3.1 ± 1.4 6.3 ± 1.4 122.1 ± 1.8 0.2 ± 2.2 0.0 ± 0.32-8-5 Stubby Hib July 14 20 �1.9 ± 1.6 �1.1 ± 1.6 114.3 ± 1.7 2.6 ± 3.1 0.3 ± 0.42-8-6 Platy Hib July 14 20 2.0 ± 1.8 2.4 ± 1.8 101.8 ± 1.2 �1.6 ± 3.9 �0.2 ± 0.52-9-1 Platy Hib July 14 39 0.3 ± 1.1 0.8 ± 1.1 105.2 ± 1.6 0.2 ± 2.1 0.0 ± 0.32-9-2 Platy Hib July 14 20 1.2 ± 1.5 1.2 ± 1.5 105.3 ± 2.1 �1.3 ± 2.8 �0.2 ± 0.42-9-3 Platy Hib July 14 39 0.8 ± 1.2 1.4 ± 1.2 96.5 ± 1.4 �0.1 ± 2.3 0.0 ± 0.32-9-4 Unclear Hib July 14 39 �2.2 ± 1.2 -1.8 ± 1.2 88.9 ± 1.4 2.5 ± 2.2 0.4 ± 0.32-9-5 Platy Hib July 14 20 �2.0 ± 1.5 �1.3 ± 1.5 146.5 ± 1.8 2.6 ± 3.3 0.3 ± 0.3
a Petrologic type with abbreviations as in Table 1.b Phase analyzed.c SIMS analysis session.d Number of cycles.
80 L. Koop et al. /Geochimica et Cosmochimica Acta 189 (2016) 70–95
The resolved D17O variations among PLAC-like CAIsare in clear contrast to regular CAIs as defined in Section 1.The trend of the PLAC-like CAI data is along the CCAMline and therefore resembles trends described by some CAIsand Wark-Lovering (WL) rims from the altered CV3.6chondrite Allende (e.g., Clayton et al., 1977; Simon et al.,2011; Park et al., 2012). However, recent studies focusedon CAIs and WL rims from the least metamorphosed chon-drites commonly have found more uniform compositionsclose to the common D17O values of �23‰; this indicatesthat most of the variations found in Allende CAIs may haveresulted from mineral-dependent exchange with or remelt-ing in a 16O-poor reservoir (Krot et al., 2009; Bodenanet al., 2014). Similarly, our high spatial resolution analysesof a large number of SHIBs revealed that their D17O rangeis more restricted (�24.5 ± 1.0 to �22.0 ± 0.8‰; Koopet al., 2016) than previously thought (�27‰ to �16‰;Liu et al., 2009). Yet, PLAC-like CAIs we analyzed andprepared under identical conditions as SHIBs show aD17O range of �11‰ and thus substantiate the inferencesthat: (1) PLAC-like CAIs are distinct from regular CAIsand SHIBs in oxygen isotopes; and (2) while the oxygenisotopic composition may have been uniform during forma-tion of regular CAIs, considerable variations existed duringformation of PLAC-like CAIs.
The distribution of PLAC-like CAIs (Liu et al., 2009;this study) is largely consistent with a line of slope �1
in the oxygen-three isotope diagram (e.g., CCAM, PCM(Ushikubo et al., 2012), and Young & Russell (Youngand Russell, 1998) lines), similar to more evolved (i.e.,more homogeneous) chondritic components like AllendeCAIs and chondrules. However, we also find resolveddeviations to both sides of the CCAM line in somePLAC-like CAIs (Figs. 2 and 3). Most of these are dis-placed towards heavier compositions relative to theCCAM line (right side), but at least two grains are isotopi-cally light (Figs. 2 and 3). Six hibonite grains (blue dia-monds in Fig. 3) also plot to the left but overlap withthe CCAM line within 2r uncertainty. These six grainsmay have been liberated from the same CAI (see Sec-tion 4.1) and their clustering to the left of the CCAM linecould indicate that they are isotopically light. These excur-sions from a single mixing line are unlikely to be due toinstrumental or secondary effects (for a thorough discus-sion, see Appendix A.2). Instead, the deviations couldreflect mass-dependent fractionation processes associatedwith their formation, i.e., condensation and melt evapora-tion (Richter et al., 2002). However, it is unclear whyPLAC-like CAIs would show a relationship betweenD17O and mass-fractionation effects. Furthermore, thereis no correlation between the magnitude of oxygen iso-topic deviation from the CCAM line and d25Mg (Tables2 and 3), which might be expected for condensation orevaporation. Alternatively, deviations from a single mixing

Table 4Calcium and titanium isotope data, the latter is given in two commonly used normalizations (46Ti/48Ti and 49Ti/47Ti) to facilitate comparisons with other studies and materials. The data listed hereis corrected by sample-standard bracketing and a Rayleigh law. Internally corrected data using the exponential law can be found in Electronic Appendix Table EA.2.
Name Ca d47Ti d49Ti d50Ti FTib d46Ti d48Ti d50Ti FTi d42Ca d43Ca d48Ca FCa
(‰) (‰) (‰) (‰/amu) (‰) (‰) (‰) (‰/amu) (‰) (‰) (‰) (‰/amu)
46Ti/48Ti normalizationc 49Ti/47Ti normalization 40Ca/44Ca normalization
1-1-11 Cleavage 0.7 ± 5.2 2.1 ± 3.9 9.7 ± 6.8 �1.2 ± 3.3 0.4 ± 4.3 �1.7 ± 4.7 6.3 ± 9.1 �0.2 ± 2.6 �0.1 ± 3.0 0.4 ± 2.2 19.8 ± 6.8 �0.1 ± 0.41-4-2 Pv, cleavage �0.5 ± 5.2 �2.1 ± 3.9 5.4 ± 6.9 0.8 ± 3.3 �0.3 ± 4.2 1.4 ± 4.8 8.9 ± 9.3 �0.1 ± 2.6 v2.8 ± 3.0 �0.5 ± 1.9 �3.6 ± 6.5 0.2 ± 0.41-4-3 0.0 ± 5.3 �2.9 ± 4.1 4.5 ± 6.9 0.1 ± 3.3 �0.8 ± 4.4 1.4 ± 4.9 8.9 ± 9.5 �1.3 ± 2.7 �3.6 ± 3.0 �0.4 ± 2.2 �8.7 ± 6.5 �0.3 ± 0.41-4-5 Pv, cleavage �1.3 ± 5.1 �2.3 ± 3.9 3.2 ± 6.8 0.8 ± 3.3 0.6 ± 4.2 1.8 ± 4.8 6.1 ± 9.2 0.3 ± 2.6 �3.3 ± 2.9 �1.4 ± 2.0 �4.7 ± 6.6 �0.3 ± 0.41-5-3 Boundary �2.9 ± 2.7 �3.8 ± 2.8 �39.9 ± 3.0 2.5 ± 1.2 2.2 ± 2.9 3.4 ± 2.8 �35.3 ± 4.3 2.0 ± 1.2 �3.1 ± 2.7 �4.5 ± 3.2 �43.4 ± 4.1 0.2 ± 1.01-6-1 �0.1 ± 2.1 �1.3 ± 2.3 4.5 ± 3.1 2.3 ± 1.2 �0.5 ± 2.9 0.7 ± 2.0 6.4 ± 3.9 1.6 ± 1.2 �0.5 ± 2.4 �0.6 ± 3.3 �0.1 ± 3.3 0.4 ± 0.52-2-7 Crack �0.7 ± 5.1 �1.5 ± 4.0 0.4 ± 7.0 �0.5 ± 3.3 0.2 ± 4.4 1.3 ± 4.8 2.5 ± 9.3 �1.1 ± 2.6 �1.5 ± 2.9 0.6 ± 2.1 �5.5 ± 6.6 0.6 ± 0.42-2-9 �2.8 ± 5.1 �2.1 ± 3.9 �7.2 ± 6.7 1.1 ± 3.3 3.3 ± 4.3 2.4 ± 4.8 �5.3 ± 9.1 1.5 ± 2.6 �3.6 ± 3.0 �2.8 ± 2.2 �17.4 ± 6.5 �0.6 ± 0.42-6-2 Crack �0.9 ± 2.0 2.4 ± 2.4 18.8 ± 3.4 1.2 ± 1.0 2.5 ± 2.6 �0.6 ± 2.3 14.9 ± 4.6 2.8 ± 1.2 �1.2 ± 4.7 0.3 ± 2.7 15.0 ± 4.4 0.7 ± 1.02-6-5 Pv �0.7 ± 2.2 4.3 ± 2.4 9.5 ± 2.9 �0.7 ± 1.2 3.3 ± 3.0 �1.8 ± 2.2 2.6 ± 4.2 1.8 ± 1.3 1.8 ± 2.4 0.9 ± 3.5 27.1 ± 3.7 �0.2 ± 0.52-6-7 Pv �2.1 ± 2.0 �1.5 ± 2.2 �71.3 ± 3.0 �1.4 ± 1.0 2.3 ± 2.3 2.0 ± 2.3 �70.1 ± 4.2 �1.1 ± 1.2 0.9 ± 4.9 1.6 ± 2.9 �61.2 ± 3.9 �0.6 ± 1.02-6-8 Pv 2.6 ± 2.0 0.9 ± 2.3 �18.1 ± 3.3 �1.8 ± 1.0 �3.5 ± 2.2 �1.6 ± 2.2 �18.1 ± 4.3 �2.7 ± 1.2 �1.0 ± 4.9 0.2 ± 2.7 �20.4 ± 4.2 1.0 ± 1.02-7-3 Pv 3.2 ± 2.7 �1.7 ± 3.0 �26.8 ± 3.8 �1.8 ± 1.2 �5.8 ± 3.2 �0.7 ± 2.8 �22.8 ± 5.8 �4.2 ± 1.5 �0.8 ± 3.1 0.3 ± 2.9 �23.9 ± 5.1 2.1 ± 0.72-7-4 1.0 ± 1.6 4.9 ± 1.8 58.5 ± 2.8 �0.2 ± 0.7 1.0 ± 2.2 �2.9 ± 1.9 51.3 ± 4.7 1.8 ± 1.2 0.5 ± 3.2 1.5 ± 2.8 81.2 ± 5.7 �0.3 ± 0.62-7-5 SIMS pit 0.3 ± 2.1 6.2 ± 2.5 171.0 ± 4.0 �0.2 ± 0.9 2.8 ± 2.6 �3.2 ± 2.3 160.4 ± 6.0 2.7 ± 1.3 �3.0 ± 3.1 0.4 ± 3.1 56.5 ± 5.7 �0.3 ± 0.72-8-1 0.3 ± 2.0 5.5 ± 2.1 62.2 ± 3.0 0.2 ± 0.9 2.4 ± 2.2 �2.9 ± 2.1 53.6 ± 4.3 2.8 ± 1.0 �1.1 ± 2.3 0.0 ± 3.6 71.1 ± 5.5 �0.6 ± 0.52-8-2 0.2 ± 2.1 4.0 ± 2.1 14.3 ± 2.9 �2.1 ± 1.0 2.0 ± 2.4 �2.1 ± 2.2 8.4 ± 4.3 �0.1 ± 1.1 3.2 ± 2.4 2.3 ± 3.6 31.5 ± 5.1 �0.2 ± 0.52-8-5 �0.7 ± 1.9 �3.8 ± 2.1 �8.6 ± 3.3 2.5 ± 1.0 �1.1 ± 2.2 2.7 ± 2.1 �2.6 ± 4.3 0.6 ± 1.1 �2.7 ± 4.8 �0.7 ± 2.5 �18.0 ± 4.0 1.3 ± 1.02-8-6 �0.4 ± 2.1 2.4 ± 2.6 60.4 ± 2.8 1.1 ± 0.8 2.1 ± 2.4 �1.0 ± 2.3 56.3 ± 4.2 2.6 ± 1.1 0.1 ± 2.4 �0.1 ± 3.0 70.0 ± 4.5 �0.7 ± 0.92-9-1 Crack 0.7 ± 2.2 3.4 ± 2.4 64.6 ± 3.3 1.9 ± 1.3 0.6 ± 2.9 �2.0 ± 2.1 59.3 ± 4.1 3.2 ± 1.2 �1.6 ± 2.6 0.3 ± 3.4 70.7 ± 3.8 �0.2 ± 0.52-9-2 Crack �0.1 ± 2.0 5.4 ± 2.3 64.2 ± 3.2 1.4 ± 1.2 2.6 ± 2.8 �2.6 ± 1.9 55.7 ± 4.2 4.1 ± 1.2 0.8 ± 2.5 1.8 ± 3.3 72.6 ± 3.5 �0.3 ± 0.52-9-3 Cleavage 1.1 ± 2.0 2.0 ± 2.1 61.2 ± 3.2 3.4 ± 1.2 �0.6 ± 2.8 �1.6 ± 1.9 58.5 ± 3.8 3.9 ± 1.1 �0.9 ± 2.5 �0.9 ± 3.4 69.7 ± 3.5 0.2 ± 0.52-9-4 Pv 0.5 ± 2.1 �0.8 ± 2.6 �2.0 ± 3.2 2.1 ± 1.3 �1.1 ± 2.9 0.1 ± 2.1 �0.6 ± 4.3 1.5 ± 1.3 �1.0 ± 2.7 �1.0 ± 3.7 �0.3 ± 3.5 0.6 ± 0.52-9-5 Epoxy 0.0 ± 2.0 3.4 ± 2.3 60.5 ± 3.1 2.2 ± 1.2 1.8 ± 2.9 �1.7 ± 2.0 55.1 ± 4.1 3.9 ± 1.2 �0.4 ± 2.5 �0.9 ± 3.4 71.9 ± 3.6 �0.2 ± 0.51-9-3 Pv 1.3 ± 1.8 �0.1 ± 2.1 �4.5 ± 2.7 1.7 ± 0.7 �1.9 ± 2.2 �0.8 ± 2.0 �3.9 ± 4.3 1.1 ± 1.1 �1.5 ± 3.1 �0.3 ± 3.2 �4.0 ± 5.4 0.8 ± 0.72-7-1 1.0 ± 2.0 �0.9 ± 2.0 �0.6 ± 2.9 2.4 ± 0.7 �1.9 ± 2.3 0.0 ± 2.2 1.2 ± 4.6 1.4 ± 1.2 �0.8 ± 3.1 0.6 ± 3.1 5.6 ± 5.3 0.7 ± 0.7
a Description of imperfections found in analysis pit post SIMS. Abbreviations: Pv – perovskite, RMN – refractory metal nugget.b Intrinsic fractionation in Ti.c Favored normalization for Ti isotopes.
L.K
oop
etal./
Geo
chim
icaet
Cosm
och
imica
Acta
189(2016)
70–9581

Fig. 5. (a) This figure illustrates the effects of choosing different normalization pairs on d50Ti values. While most PLAC-like CAIs plot on orwithin uncertainty of the 1:1 line (i.e., the magnitude of d50Ti values is not significantly affected by choosing 46Ti/48Ti or 49Ti/47Tinormalization), the magnitudes are typically slightly smaller in 49Ti/47Ti normalization, particularly for grains with larger anomalies. (b) Thed47Ti versus d49Ti plot shows that the spread in d47Ti appears to be smaller than in d49Ti.
Fig. 6. Comparison of 50Ti anomalies with effects in 49Ti (a) and 46Ti (b). (a) d49Ti and d50Ti correlate in sign (46Ti/48Ti normalization). (b) In49Ti/47Ti normalization, d46Ti and d50Ti values do not correlate for most PLAC-like CAIs. Both the CAIs studied here as well as literaturedata for PLACs deviate from the extrapolated correlation line defined by more homogeneous solar system materials (Trinquier et al., 2009).However, some of the data with smaller anomalies in 50Ti (|d50Ti| 6 �25‰) appears to plot on the correlation line. Literature data is fromSteele and Boehnke (2015) and references therein and limited to grains labeled ‘PLACs’.
82 L. Koop et al. /Geochimica et Cosmochimica Acta 189 (2016) 70–95
line could represent mixing between distinct anomalousnucleosynthetic oxygen components. The origin of theseoxygen isotopic variations is discussed in more detail inSection 4.3.
4.2.2. Magnesium isotopes
With an average inferred 26Al/27Al ratio of (1.7± 1.6) � 10�6, PLAC-like CAIs are not only 26Al-poor rel-ative to many regular CAIs, but also appear to have formed
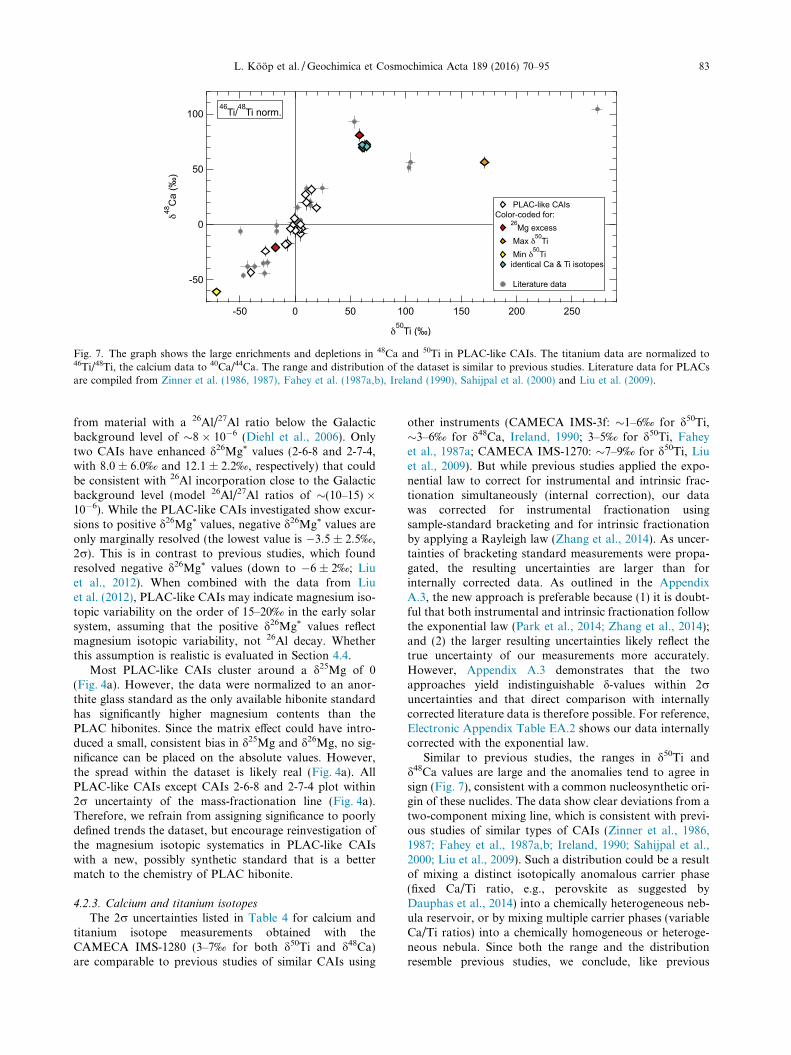
Fig. 7. The graph shows the large enrichments and depletions in 48Ca and 50Ti in PLAC-like CAIs. The titanium data are normalized to46Ti/48Ti, the calcium data to 40Ca/44Ca. The range and distribution of the dataset is similar to previous studies. Literature data for PLACsare compiled from Zinner et al. (1986, 1987), Fahey et al. (1987a,b), Ireland (1990), Sahijpal et al. (2000) and Liu et al. (2009).
L. Koop et al. /Geochimica et Cosmochimica Acta 189 (2016) 70–95 83
from material with a 26Al/27Al ratio below the Galacticbackground level of �8 � 10�6 (Diehl et al., 2006). Onlytwo CAIs have enhanced d26Mg* values (2-6-8 and 2-7-4,with 8.0 ± 6.0‰ and 12.1 ± 2.2‰, respectively) that couldbe consistent with 26Al incorporation close to the Galacticbackground level (model 26Al/27Al ratios of �(10–15) �10�6). While the PLAC-like CAIs investigated show excur-sions to positive d26Mg* values, negative d26Mg* values areonly marginally resolved (the lowest value is �3.5 ± 2.5‰,2r). This is in contrast to previous studies, which foundresolved negative d26Mg* values (down to �6 ± 2‰; Liuet al., 2012). When combined with the data from Liuet al. (2012), PLAC-like CAIs may indicate magnesium iso-topic variability on the order of 15–20‰ in the early solarsystem, assuming that the positive d26Mg* values reflectmagnesium isotopic variability, not 26Al decay. Whetherthis assumption is realistic is evaluated in Section 4.4.
Most PLAC-like CAIs cluster around a d25Mg of 0(Fig. 4a). However, the data were normalized to an anor-thite glass standard as the only available hibonite standardhas significantly higher magnesium contents than thePLAC hibonites. Since the matrix effect could have intro-duced a small, consistent bias in d25Mg and d26Mg, no sig-nificance can be placed on the absolute values. However,the spread within the dataset is likely real (Fig. 4a). AllPLAC-like CAIs except CAIs 2-6-8 and 2-7-4 plot within2r uncertainty of the mass-fractionation line (Fig. 4a).Therefore, we refrain from assigning significance to poorlydefined trends the dataset, but encourage reinvestigation ofthe magnesium isotopic systematics in PLAC-like CAIswith a new, possibly synthetic standard that is a bettermatch to the chemistry of PLAC hibonite.
4.2.3. Calcium and titanium isotopes
The 2r uncertainties listed in Table 4 for calcium andtitanium isotope measurements obtained with theCAMECA IMS-1280 (3–7‰ for both d50Ti and d48Ca)are comparable to previous studies of similar CAIs using
other instruments (CAMECA IMS-3f: �1–6‰ for d50Ti,�3–6‰ for d48Ca, Ireland, 1990; 3–5‰ for d50Ti, Faheyet al., 1987a; CAMECA IMS-1270: �7–9‰ for d50Ti, Liuet al., 2009). But while previous studies applied the expo-nential law to correct for instrumental and intrinsic frac-tionation simultaneously (internal correction), our datawas corrected for instrumental fractionation usingsample-standard bracketing and for intrinsic fractionationby applying a Rayleigh law (Zhang et al., 2014). As uncer-tainties of bracketing standard measurements were propa-gated, the resulting uncertainties are larger than forinternally corrected data. As outlined in the AppendixA.3, the new approach is preferable because (1) it is doubt-ful that both instrumental and intrinsic fractionation followthe exponential law (Park et al., 2014; Zhang et al., 2014);and (2) the larger resulting uncertainties likely reflect thetrue uncertainty of our measurements more accurately.However, Appendix A.3 demonstrates that the twoapproaches yield indistinguishable d-values within 2runcertainties and that direct comparison with internallycorrected literature data is therefore possible. For reference,Electronic Appendix Table EA.2 shows our data internallycorrected with the exponential law.
Similar to previous studies, the ranges in d50Ti andd48Ca values are large and the anomalies tend to agree insign (Fig. 7), consistent with a common nucleosynthetic ori-gin of these nuclides. The data show clear deviations from atwo-component mixing line, which is consistent with previ-ous studies of similar types of CAIs (Zinner et al., 1986,1987; Fahey et al., 1987a,b; Ireland, 1990; Sahijpal et al.,2000; Liu et al., 2009). Such a distribution could be a resultof mixing a distinct isotopically anomalous carrier phase(fixed Ca/Ti ratio, e.g., perovskite as suggested byDauphas et al., 2014) into a chemically heterogeneous neb-ula reservoir, or by mixing multiple carrier phases (variableCa/Ti ratios) into a chemically homogeneous or heteroge-neous nebula. Since both the range and the distributionresemble previous studies, we conclude, like previous
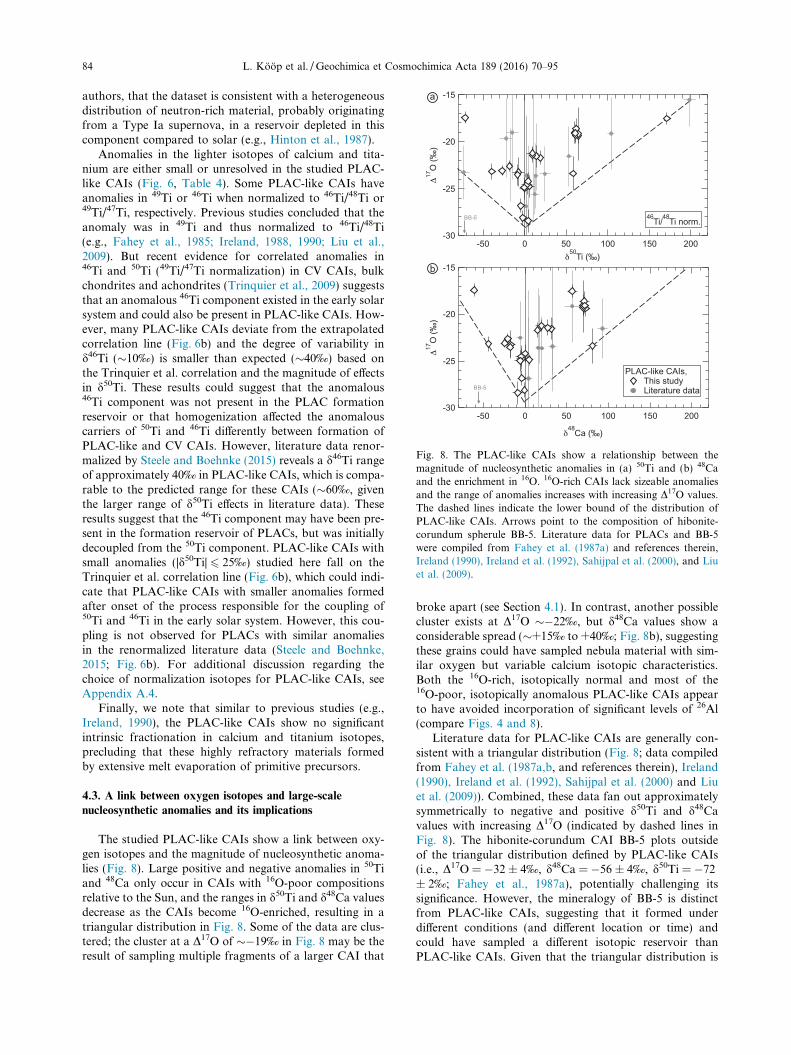
Fig. 8. The PLAC-like CAIs show a relationship between themagnitude of nucleosynthetic anomalies in (a) 50Ti and (b) 48Caand the enrichment in 16O. 16O-rich CAIs lack sizeable anomaliesand the range of anomalies increases with increasing D17O values.The dashed lines indicate the lower bound of the distribution ofPLAC-like CAIs. Arrows point to the composition of hibonite-corundum spherule BB-5. Literature data for PLACs and BB-5were compiled from Fahey et al. (1987a) and references therein,Ireland (1990), Ireland et al. (1992), Sahijpal et al. (2000), and Liuet al. (2009).
84 L. Koop et al. /Geochimica et Cosmochimica Acta 189 (2016) 70–95
authors, that the dataset is consistent with a heterogeneousdistribution of neutron-rich material, probably originatingfrom a Type Ia supernova, in a reservoir depleted in thiscomponent compared to solar (e.g., Hinton et al., 1987).
Anomalies in the lighter isotopes of calcium and tita-nium are either small or unresolved in the studied PLAC-like CAIs (Fig. 6, Table 4). Some PLAC-like CAIs haveanomalies in 49Ti or 46Ti when normalized to 46Ti/48Ti or49Ti/47Ti, respectively. Previous studies concluded that theanomaly was in 49Ti and thus normalized to 46Ti/48Ti(e.g., Fahey et al., 1985; Ireland, 1988, 1990; Liu et al.,2009). But recent evidence for correlated anomalies in46Ti and 50Ti (49Ti/47Ti normalization) in CV CAIs, bulkchondrites and achondrites (Trinquier et al., 2009) suggeststhat an anomalous 46Ti component existed in the early solarsystem and could also be present in PLAC-like CAIs. How-ever, many PLAC-like CAIs deviate from the extrapolatedcorrelation line (Fig. 6b) and the degree of variability ind46Ti (�10‰) is smaller than expected (�40‰) based onthe Trinquier et al. correlation and the magnitude of effectsin d50Ti. These results could suggest that the anomalous46Ti component was not present in the PLAC formationreservoir or that homogenization affected the anomalouscarriers of 50Ti and 46Ti differently between formation ofPLAC-like and CV CAIs. However, literature data renor-malized by Steele and Boehnke (2015) reveals a d46Ti rangeof approximately 40‰ in PLAC-like CAIs, which is compa-rable to the predicted range for these CAIs (�60‰, giventhe larger range of d50Ti effects in literature data). Theseresults suggest that the 46Ti component may have been pre-sent in the formation reservoir of PLACs, but was initiallydecoupled from the 50Ti component. PLAC-like CAIs withsmall anomalies (|d50Ti| 6 25‰) studied here fall on theTrinquier et al. correlation line (Fig. 6b), which could indi-cate that PLAC-like CAIs with smaller anomalies formedafter onset of the process responsible for the coupling of50Ti and 46Ti in the early solar system. However, this cou-pling is not observed for PLACs with similar anomaliesin the renormalized literature data (Steele and Boehnke,2015; Fig. 6b). For additional discussion regarding thechoice of normalization isotopes for PLAC-like CAIs, seeAppendix A.4.
Finally, we note that similar to previous studies (e.g.,Ireland, 1990), the PLAC-like CAIs show no significantintrinsic fractionation in calcium and titanium isotopes,precluding that these highly refractory materials formedby extensive melt evaporation of primitive precursors.
4.3. A link between oxygen isotopes and large-scale
nucleosynthetic anomalies and its implications
The studied PLAC-like CAIs show a link between oxy-gen isotopes and the magnitude of nucleosynthetic anoma-lies (Fig. 8). Large positive and negative anomalies in 50Tiand 48Ca only occur in CAIs with 16O-poor compositionsrelative to the Sun, and the ranges in d50Ti and d48Ca valuesdecrease as the CAIs become 16O-enriched, resulting in atriangular distribution in Fig. 8. Some of the data are clus-tered; the cluster at a D17O of ��19‰ in Fig. 8 may be theresult of sampling multiple fragments of a larger CAI that
broke apart (see Section 4.1). In contrast, another possiblecluster exists at D17O ��22‰, but d48Ca values show aconsiderable spread (�+15‰ to +40‰; Fig. 8b), suggestingthese grains could have sampled nebula material with sim-ilar oxygen but variable calcium isotopic characteristics.Both the 16O-rich, isotopically normal and most of the16O-poor, isotopically anomalous PLAC-like CAIs appearto have avoided incorporation of significant levels of 26Al(compare Figs. 4 and 8).
Literature data for PLAC-like CAIs are generally con-sistent with a triangular distribution (Fig. 8; data compiledfrom Fahey et al. (1987a,b, and references therein), Ireland(1990), Ireland et al. (1992), Sahijpal et al. (2000) and Liuet al. (2009)). Combined, these data fan out approximatelysymmetrically to negative and positive d50Ti and d48Cavalues with increasing D17O (indicated by dashed lines inFig. 8). The hibonite-corundum CAI BB-5 plots outsideof the triangular distribution defined by PLAC-like CAIs(i.e., D17O = �32 ± 4‰, d48Ca = �56 ± 4‰, d50Ti = �72± 2‰; Fahey et al., 1987a), potentially challenging itssignificance. However, the mineralogy of BB-5 is distinctfrom PLAC-like CAIs, suggesting that it formed underdifferent conditions (and different location or time) andcould have sampled a different isotopic reservoir thanPLAC-like CAIs. Given that the triangular distribution is
L. Koop et al. /Geochimica et Cosmochimica Acta 189 (2016) 70–95 85
defined by a large number of PLAC-like CAIs (literaturedata and this study), it seems unlikely that it is coincidental.
Below, we explore a number of scenarios that couldexplain the link between nucleosynthetic anomalies andoxygen isotopes in PLAC-like CAIs. This interpretation ischallenging as oxygen isotopic compositions of gases andsolids in the early solar system are unknown and modelsmake conflicting assumptions and predictions. For exam-ple, nebular self-shielding models typically assume that attime zero, CO, H2O and dust had uniform compositions(i.e., solar D17O; Clayton, 2002; Lyons and Young, 2005),while Krot et al. (2010) suggest that the solar nebula gas(i.e., CO + H2O) was enriched in 16O and primitive dustwas 16O-poor relative to the Sun. Furthermore, isotopicself-shielding may have occurred in the parent molecularcloud, and models predict that the isotopic compositionof material falling onto the forming protoplanetary diskwas likely variable in time (Lee et al., 2008; Yang et al.,2011). Unless otherwise stated, we assume that the inferredD17O value for the Sun (��28‰; McKeegan et al., 2011)represents the average composition of the solar nebula.From this perspective, the most 16O-rich PLAC-like CAIs,which lack anomalies in calcium and titanium isotopes, canbe viewed as isotopically normal in oxygen and refractoryelements, while the 16O-poor ones are viewed as isotopicallyanomalous in oxygen. In addition, we assume that PLAC-like CAIs formed prior to regular CAIs, based on consider-ations described in Section 1.
4.3.1. A nucleosynthetic link between anomalies in oxygen,
calcium and titanium
The link between oxygen isotopes and anomalies in 48Caand 50Ti in PLAC-like CAIs could be a result of mixingbetween a solar component (D17O of ��28‰, d50Ti andd48Ca of �0‰) and distinct presolar carrier phases with iso-tope anomalies in all three elements. Such a mixing modelrequires at least two distinct 16O-poor components (oneenriched, the other depleted in both 50Ti and 48Ca). Weconsider this scenario unlikely for two reasons. First, thesymmetry of the distribution calls for two complementarycomponents, which seems coincidental given that other tita-nium, calcium or magnesium isotopes do not show compa-rable effects (Figs. 4 and 6). Second, it is difficult to identifysuitable sources for the two components. For example, typeIa supernovae (SN) are not expected to produce 50Ti- and48Ca-rich oxide grains (see Dauphas et al., 2010) and whileType II SN may produce 16O-poor material with depletionsand enrichments in 50Ti, such material should have enrich-ments in 46Ti. In addition, 48Ca is not produced in these SN(Rauscher et al., 2002).
4.3.2. Symmetry-dependent fractionation of oxygen isotopes
Since it is unlikely that the variations in oxygen,calcium, and titanium isotopes were introduced by thepresolar components with anomalies in all three elements,we now consider separate origins for the variations inD17O and refractory elements. For oxygen, chemical reac-tions can introduce symmetry-dependent fractionation(e.g., Thiemens, 2006). Such reactions could have takenplace in the solar nebula and would have resulted in both
sub- and supersolar D17O values in oxygen-bearing species.Any aberration from the solar value would then indicatethat the material experienced processing. As we expect thatunprocessed material is more likely to retain nucleosyn-thetic anomalies than processed materials, it is unclearwhy large anomalies would be associated with nonsolar(i.e., processed) oxygen isotopic compositions in PLAC-like CAIs. While symmetry-dependent fractionation of oxy-gen isotopes cannot be excluded, we see no direct supportfor this scenario in the dataset.
4.3.3. Isotopic self-shielding
Isotopic self-shielding is another process often consid-ered to explain the D17O variations of solar system materi-als (e.g., Clayton, 2002; Yurimoto and Kuramoto, 2004;Lyons and Young, 2005). Nebular self-shielding modelsassume that prior to its initiation, dust and gas had solarD17O values. Upon onset of self-shielding, 16O-rich COand 16O-poor H2O reservoirs are hypothesized to haveformed, resulting in an isotopic zonation of nebular H2Oand CO that likely varied in time (Clayton, 2002; Lyonsand Young, 2005). To account for the link between D17Oand anomalies in 50Ti and 48Ca, isotopically anomalousprecursors could have equilibrated with 16O-poor H2O,while isotopically uniform precursors either avoided equili-bration, or fully equilibrated with both 16O-rich CO and16O-poor H2O. Based on these considerations, three scenar-ios can be explored to explain the isotopic characteristics ofPLAC-like CAIs.
(1) Thermal processing: 16O-rich PLAC-like CAIs mayhave experienced high degrees of thermal processingresulting in a solar D17O due to full equilibration withboth 16O-rich CO and 16O-poor H2O and efficientdilution of isotopic anomalies in refractory elements(e.g., during full volatilization and recondensationof dust). In contrast, 16O-poor, isotopically anoma-lous PLAC-like CAIs could have experienced lowerdegrees of processing that did not result in efficientdilution of anomalies and only allowed for oxygenisotopic exchange with 16O-poor H2O, but not 16O-rich CO.
(2) Temporal D17O variations: Nebular regions mayhave experienced a rise and fall in the D17O of H2O(Lyons and Young, 2005). If PLAC-like CAIsformed over an extended period of time, they mayhave tracked the initial evolution of H2O from solarto 16O-poor compositions. However, the linkbetween D17O values and the degree of heterogeneityin 50Ti and 48Ca would then suggest that their forma-tion region evolved from an isotopically homoge-nized to a highly heterogeneous state (indicated bydashed arrows in Fig. 9a). Alternatively, if PLAC-like CAIs tracked the fall of D17O, the relationshipin Fig. 8 would be consistent with PLAC-like CAIshaving formed in a nebula that experienced continu-ous homogenization of nucleosynthetic anomalies(i.e., highly anomalous 16O-poor PLAC-like CAIsformed prior to 16O-rich, homogeneous PLAC-likeCAIs; solid arrows in Fig. 9). However, this scenario

Fig. 9. Illustration of the chronological explanations for the linkbetween oxygen isotopes and anomalies in 48Ca (squares) and 50Ti(diamonds). (a) Arrows indicate how the degree of isotopicheterogeneity in the CAI formation would have changed ifPLAC-like CAIs formed either while D17O values were increasing(dashed arrows, e.g., due to self-shielding) or decreasing (solidarrows). (b) Illustration of the nonuniform oxygen isotopicevolution of the nebula inferred if a chronology is assigned basedon the degree of isotopic heterogeneity in refractory elements.Assuming that the nebula started with a solar oxygen isotopiccomposition and that mixing processes continuously homogenizednucleosynthetic anomalies, the data would suggest that the CAIformation region evolved from a solar oxygen isotopic compositionto a D17O of �17‰ or higher (this phase was not sampled byPLAC-like CAIs). Then, the first PLAC-like CAIs formed,recording elevated D17O values and large anomalies in 48Ca and50Ti. The dataset then indicates that while the CAI formation wasbecoming increasingly homogenized in refractory elements, it alsobecame continuously enriched in 16O, returning to a solar D17O. (c)The nonuniform oxygen isotopic evolution of the CAI formationregion inferred from PLAC-like, regular and FUN CAIs. After theinitial reversal and evolution of the CAI formation region to aD17O of ��28‰ as inferred in (b), a second reversal may haveresulted in an evolution to a D17O of ��23‰ before a canonicaldistribution of 26Al was achieved, as indicated by FUN and otherfractionated CAIs with low 26Al/27Al ratios and small or unre-solved nucleosynthetic anomalies (Park et al., 2013, 2014; Koopet al., 2015). The CAI formation region may have remained orfluctuated around a D17O of ��23‰ until a canonical abundancehad been achieved and regular CAIs formed.
86 L. Koop et al. /Geochimica et Cosmochimica Acta 189 (2016) 70–95
would likely require a subsequent reversal and evolu-tion to a D17O value of ��23‰ to account for thecompositions of regular CAIs if they formed afterPLAC-like CAIs in the same region (Fig. 9c).
(3) Radial D17O variations: The predicted radial zona-tion in the D17O of nebular H2O (Clayton, 2002;Lyons and Young, 2005) may have allowed PLAC-like CAIs to inherit different D17O values if they ortheir precursors formed at different distances fromthe Sun. For example, at larger distances, precursorsof 16O-poor, anomalous CAIs may have formed asaggregates of 16O-poor H2O ice and unprocessed, iso-topically anomalous dust. In contrast, the more iso-topically uniform, 16O-rich PLAC-like CAIs mayhave formed closer to the Sun in a region that wasnot affected by self-shielding. Higher ambient tem-peratures near the Sun and mixing during a possiblylonger transit through the disk could account for theisotopically uniform compositions of these CAIs.However, this model would require that PLAC-likeCAIs with indistinguishable chemical and morpho-logical characteristics could form at both small andlarge distances from the Sun (e.g., shock waves) orthat the 16O-poor, icy anomalous precursorsmigrated inward and were transformed into CAIsin the hot regions close to the Sun while preservingthe isotopic properties of both ice and dust. The lat-ter scenario might be complicated by the differentcondensation temperatures of ice and dust (silicateand oxide). As ice is expected to evaporate duringtransit before reaching the CAI formation region,the volatilized H2O could have fractionated fromthe dust phase, mixed with more 16O-rich CO andH2O in the inner solar system, leaving behind16O-rich, anomalous dust.
In summary, if isotopic self-shielding was responsible forthe oxygen isotopic variations in PLAC-like CAIs, a num-ber of scenarios could be invoked that may explain the linkbetween oxygen isotopes and the degree of isotopic hetero-geneity in refractory elements. The newly established sys-tematics should be taken as additional constraints for theearly isotopic evolution of the solar nebula.
4.3.4. Presolar reservoirs model
As an alternative to self-shielding, the relationshipbetween oxygen isotopes and 48Ca and 50Ti anomaliescould be the result of a physical link between anomalouspresolar phases and a 16O-poor reservoir. As both calciumand titanium are refractory elements (Grossman, 1972;Lodders, 2003) and are thus present in solids over a largerange of nebula temperatures, this 16O-poor reservoir mayhave been the primordial solar nebular dust. In this model,large anomalies in 48Ca and 50Ti would have been caused bya heterogeneous distribution of anomalous isotopic carriersin the unprocessed dust reservoir. If unprocessed nebulardust was 16O-poor compared to the Sun, the nebular gas(likely CO + H2O) must have been relatively enriched in16O (Fig. 10a). These considerations are similar to a modelproposed by Krot et al. (2010) that explains the difference inD17O between the Sun and terrestrial planets and asteroidsas a result of isotopically distinct presolar dust and gasreservoirs. The model suggests that variations in D17Oresult from exchange between the dust and gas reservoirs

Fig. 10. Illustration of the presolar reservoirs model based on Krotet al. (2010), but extended to explain the compositions of PLAC-like CAIs. Initially, the solar system’s oxygen is present in twodistinct reservoirs, i.e., 16O-rich gas (cloud symbol) and 16O-poorprimordial dust (gray band, e.g., at D17O = 0‰). The dust spans arange of anomalies in 48Ca and 50Ti because of heterogeneousdistribution of neutron-rich carrier phase(s) in the dust reservoir(indicated by pattern in primitive dust band). (a) Completeequilibration between dust and gas leads to a solar D17O andhomogenization of nucleosynthetic anomalies (star symbol). (b)The compositions of the PLAC-like CAIs (diamonds for 50Ti,squares for 48Ca) can be explained by mixing between equilibratedand primitive dust. The data constrains a lower limit for the D17Ovalue of the primitive dust (�17‰).
L. Koop et al. /Geochimica et Cosmochimica Acta 189 (2016) 70–95 87
during thermal processing (Fig. 10a). Assuming thatanomalies in 50Ti and 48Ca are efficiently diluted by suchthermal processing, the triangular distribution (Fig. 8)found in PLAC-like CAIs could be explained if they formedas mixtures between highly processed and unprocesseddust. Unprocessed dust would be 16O-poor with large vari-ations in 50Ti and 48Ca (Fig. 10b), while highly processeddust had no or minimal anomalies in refractory elementsand a solar D17O if it equilibrated with the gas reservoirat a solar dust-to-gas ratio.
The assumption that thermal processing results in effi-cient dilution of nucleosynthetic anomalies in calcium andtitanium isotopes is in contrast to a model proposed byTrinquier et al. (2009). Specifically, Trinquier et al. (2009)propose that preferential volatilization of less-stableanomalous carriers and subsequent fractionation of gasfrom remaining dust could have created isotopicallyanomalous reservoirs. However, the refractory nature of
calcium and titanium suggests that they would be amongthe last elements to evaporate and among the first elementsto recondense, which may limit the efficiency of thermalprocessing as a mechanism for creating isotopic anomaliesin these elements. Instead, we expect that thermal process-ing (e.g., complete volatilization and recondensation) wasefficient in homogenizing isotopic anomalies in a poorlymixed reservoir. For PLAC-like CAIs, the anomalies arelikely a result of heterogeneous distribution of 50Ti and48Ca enriched carriers from a Type Ia SN in a reservoir thatwas depleted in these isotopes (Hinton et al., 1987; Sec-tion 4.2.3). Type Ia SN ejecta are likely among the mostfragile presolar components (coatings on preexisting ISMgrains (Nozawa et al., 2011) or small, reactive metal grains),and were likely susceptible to being destroyed and dilutedby the thermal processes that lead to oxygen isotopeexchange between gas and dust (see Huss et al., 2003, fora discussion on mineralogy-dependent loss of presolar car-riers due to nebular thermal processing). This may also bethe reason why this presolar component has yet to be iso-lated and identified in a meteorite.
If distinct presolar oxygen isotopic components werepresent and heterogeneously distributed in the primordialdust reservoir, the presolar reservoirs model can alsoaccount for the observed deviations from a single mixingline in oxygen isotopes (Fig. 3a). This interpretation is sup-ported by studies of presolar oxide and silicate grains,which are on average 16O-poor and show additional varia-tion in 17O and 18O (e.g., Nittler et al., 2008). In theabsence of mass-dependent fractionation, the datasetwould be expected to fan out symmetrically to both sidesof a mixing line defined by the average compositions ofthe primordial gas and dust reservoirs. This is not observedin the PLAC-like CAIs (Fig. 2b), possibly because of con-tributions from mass-dependent isotope fractionation (e.g.,due to melt evaporation). This could also be the reasonwhy PLAC-like CAIs with solar D17O are displaced fromthe CCAM line. However, it is not known whether thecomposition of the Sun, and therefore the composition ofcompletely equilibrated dust, is on or displaced from theCCAM line (McKeegan et al., 2011). The possibility ofnucleosynthetic oxygen isotope anomalies complicates theinterpretation of calculated D17O-values. In D17O notation,deviations of nucleosynthetic origin to the left (18O-poor or17O-rich) or right (18O-rich or 17O-poor) of a slope-one linewould be interpreted as lower or higher enrichment in 16O,respectively, while the anomalies are actually in 18O or 17O.However, the fluctuations around a slope-one line are toosmall to affect the triangular distribution in Fig. 8significantly.
Finally, we note that the isotopic composition of BB-5(Fahey et al., 1987a; Fig. 8) is not directly consistent withthe model as this inclusion is 16O-rich in spite of beinghighly depleted in 48Ca and 50Ti. This may require addi-tional processing (e.g., the CAI might have equilibratedwith the 16O-rich gas reservoir after formation at high tem-peratures) or could be an indicator against the presolarreservoirs model. Reanalysis of BB-5 with modern instru-mentation is desirable.
88 L. Koop et al. /Geochimica et Cosmochimica Acta 189 (2016) 70–95
4.4. The degree of isotopic heterogeneity at the time of
introduction of 26Al
Most PLAC-like CAIs show a mutual exclusivity rela-tionship between potential radiogenic 26Mg excesses andanomalies in 50Ti and 48Ca (e.g., Clayton et al., 1988;Ireland, 1988; Liu et al., 2009; this work), suggesting thatthe concentration of 26Al was low in their formation region.PLAC-like CAIs 2-6-8 and 2-7-4 have considerable anoma-lies, but also enhanced d26Mg* values (�10‰; red dia-monds in Figs. 4–7), possibly indicative of 26Alincorporation at a level of (1–1.5) � 10�5. However, posi-tive d26Mg* values can also result from magnesium isotopicheterogeneity (excesses in 26Mg and 24Mg, or depletions in25Mg). Based on their position relative to other PLAC-likeCAIs in Fig. 4a, excesses in 26Mg are more likely than in24Mg, which allows for both radiogenic and nucleosyntheticorigins. If the excesses are radiogenic, they could be (1) dueto admixture of fresh 26Al that eventually resulted in acanonical 26Al/27Al ratio of �5 � 10�5 in regular CAIs or(2) small heterogeneities in the background level of 26Al.If fresh 26Al was admixed into the CAI formation regionwhile PLAC-like CAIs formed (1), more of these CAIsshould show positive d26Mg* values and d26Mg* variationsshould be larger. This is contrary to observations. Instead,small fluctuations in the distribution of the 26Al back-ground may be possible, as the model 26Al/27Al for 2-6-8and 2-7-4 are only slightly larger than the Galactic back-ground level (Diehl et al., 2006).
5. CONCLUSIONS
(1) Our study confirms the 26Al-poor character ofPLAC-like CAIs, the large range of anomalies in50Ti and 48Ca (>100‰) as well as the range in D17Ofrom solar (��28‰) to ��17‰. However, the high-er precision achieved in this study reveals deviationsfrom the CCAM line, mostly to the right, but in atleast two cases also to the left of the line. We primar-ily ascribe these deviations from a two-componentmixing line to nucleosynthetic effects in oxygen iso-topes rather than solely to signatures of condensationand evaporation.
(2) Our study reveals a new, systematic relationshipbetween the D17O value and the magnitude of 50Tiand 48Ca anomalies in these 26Al-poor CAIs, whichcould suggest a physical link between anomalous48Ca and 50Ti carriers and a 16O-poor reservoir.The distribution could be a result of varying degreesof equilibration between isotopically distinct inher-ited presolar dust and gas reservoirs, similar to amodel proposed by Krot et al. (2010). However, thedata can also be explained in the context of isotopicself-shielding, but seems to require additional condi-tions to be met (e.g., prolonged formation of theseobjects, reversals in the oxygen isotopic evolutionof the CAI formation region, transient heating eventsin colder nebula regions, or different degrees of ther-mal processing).
(3) The 26 PLAC-like CAIs studied for titanium isotopeslack the large variations in 46Ti that would beexpected by extrapolation from the variation in solarsystem materials that formed after arrival of 26Al(Trinquier et al., 2009). This may suggest that theanomalous 46Ti and 50Ti components were initiallydecoupled.
(4) Small fluctuations in d26Mg* exist in PLAC-like CAIsand may be the result of magnesium isotopic hetero-geneity or 26Al decay. While we conclude that PLAC-like CAIs formed prior to arrival of fresh 26Al thatled to a canonical abundance in regular CAIs, smalld26Mg* variations could be due to variations in the26Al background level.
(5) PLAC-like CAIs appear to record an era of solarnebular history prior to isotopic homogenizationand introduction of 26Al and may be the oldest objectto have formed in the solar system.
ACKNOWLEDGEMENTS
We thank Christine Floss, Ming-Chang Liu, and two anony-mous reviewers for their insightful comments that greatly improvedthe paper. Editorial handling by Munir Humayun was greatlyappreciated. We also thank Ian Steele for assistance with electronmicroprobe analyses and Nicolas Dauphas and Michael Footefor helpful discussions. L. Koop and A.M. Davis were funded bythe NASA Cosmochemistry Program (grant NNX09AG39G, toA.M. Davis) and NASA Laboratory Analysis of Returned SamplesProgram (grant NNX15AF78G, to A.M. Davis). L. Koop was alsosupported through a NASA Earth and Space Science Fellowship.N.T. Kita acknowledges funding from the NASA CosmochemistryProgram (grants NNX11AG62G, NNX14AG29G). A.N. Krotacknowledges funding from the NASA Cosmochemistry andEmerging Worlds Programs (grants NNX10AH76G andNNX15AH38G). WiscSIMS is partly supported by NSF(EAR03-19230, EAR10-53466, EAR13-55590). P.R. Heckacknowledges funding from the Tawani Foundation.
APPENDIX A
A.1. Preparing flat epoxy grain mounts for small samples
Most SIMS applications require preparation of samplesthat have a minimal profile over a large surface area(<10 lm variation in the inner 7 mm of a polished mount;Kita et al., 2009). This is necessary as changes in the relativeelevation of analysis areas result in distortions of theelectric field lines that lead to additional instrumentalmass-fractionation, which cannot be corrected for usingstandards. To avoid these effects, grains or rock fragmentscan be cast in the center of one-inch epoxy rounds, whichare then polished flat and coated with a conductive material(e.g., gold or carbon). For small samples (<�30 lm), it isdifficult to mount multiple grains in a single mount becausethey need to be placed at the same level, otherwise polishingleads to loss of samples and/or exposure of only part of themounted samples. If samples are precious, a commonapproach is thus mounting and polishing small grains indi-vidually or depositing them on or pressing them into metal

L. Koop et al. /Geochimica et Cosmochimica Acta 189 (2016) 70–95 89
mounts. Preparing samples in individual mounts is inconve-nient for SIMS analyses as it requires frequent samplechanges, and preparation in metal mounts can be highlylabor intensive because grains need to be polished individ-ually prior to pressing them into the metal if flat surfacesare required.
Therefore, we have developed a new technique thatallows mounting of multiple small or thin samples in thesame mount. The approach presented here has worked verywell for preparing the thin, platy hibonite crystals for anal-ysis, but it was also used to mount larger samples (>1 mm).
For this technique which is illustrated in Fig. A1, acleaned, thick (>1 mm) microscope slide is attached to asteady surface (e.g., an aluminum block works well). Usinga cleaned razor blade, a piece of thin one-sided tape issmoothly attached to the slide and the aluminum block(commercially available, clear acetate packaging tape wasfound to work well), with the sticky side facing down. Noair bubbles should be trapped between the glass and thetape. The tape surface is then cleaned and dried. Using aclean hair, a thin line of epoxy is applied to the center ofthe slide covered with tape. The samples (cleaned and dried)are then placed on the epoxy lines. If grains are very small(<5 lm), it was found to be good practice to first place thegrain on the line, but then push the grains off the line sothey were only attached to the tape by the minimal amountof epoxy adhering to the grain. After attaching all grains tothe tape surface, commercially available one-inch ringmolds were added (and fixed to the tape using a layer ofclay on the outside), the assemblage was covered with aclean beaker and the epoxy was left to cure for 3–4 h atroom temperature (this was a fraction of the required cur-ing time of �24 h). We then filled the molds with freshlyprepared epoxy. After curing, the mount can be easily
Fig. A1. Illustration of major steps required for the preparation of
removed from the tape. Grains are usually already partiallyexposed, only a small amount of polishing is necessary tofully expose small grains. We therefore polished the mountsby hand, often using a combination of lapping film and pol-ishing pads, starting at a 6 or 9 lm grid, but the grid sizeneeds to be adjusted based on the size of the samplesmounted. Frequent checks of the polishing progress undera petrographic microscope are required.
The main advantages of the described technique are (1)easy removal of the cured epoxy round from the tape, (2)extremely flat surface of the epoxy round even prior to pol-ishing, (3) only minimal amounts of the epoxy need to beremoved to fully expose small grains, (4) the tape is flatenough that multiple small samples can be mounted onthe same level and evenly exposed during polishing. Wehave tested this for samples that are as thin as �5 lm. Moretests are necessary to determine the minimum grain size thisapproach can be used for.
A.2. Evaluation of possible instrumental and secondary
effects on oxygen and magnesium isotopes
The PLAC-like CAIs show deviations from the CCAMline to both lighter and heavier compositions and a small,yet resolvable spread in magnesium isotopes (�7‰ amu�1).These variations could be indicative of the formationprocesses of PLAC-like CAIs or of oxygen and magnesiumisotopic heterogeneity in the early solar system (see Sections4.2.1 and 4.2.2), but could also be a result of improper cor-rection of measured isotope ratios by SIMS.
Due to mass-dependent fractionation processes insidethe mass spectrometer, measured isotope ratios typicallydeviate from true ratios. For the oxygen and magnesiumisotopes in Figs. 2 and 4, these deviations would result in
flat grain mounts of micron-sized samples (described in text).

90 L. Koop et al. /Geochimica et Cosmochimica Acta 189 (2016) 70–95
shifts along lines of slope �0.5. Quantities that could poten-tially be affected include d17O, d18O, d26Mg, d25Mg and27Al/24Mg ratios, while the D17O, radiogenic excessd26Mg* and d-values for calcium and titanium isotopes willbe largely unaffected as they were internally corrected foradditional mass fractionation after sample-standard brack-eting. The bias in d-values for oxygen and magnesium iso-topes can arise in two ways. (1) Instrumental bias canaffect unknowns individually due to differences in unknownchemistry (e.g., variable magnesium and titanium contents)or geometric effects (Kita et al., 2009), which could poten-tially account for different degrees of fractionation within
the sample set, i.e., isotopically heavy and isotopically lightcompositions with respect to the CCAM line and some ofthe spread in the d25Mg vs. d26Mg diagram. (2) A constantbias can affect the data set as a whole and shift it towardsheavy or light compositions due to differences in the chem-ical compositions of the standard and unknowns (e.g.,higher FeO and REE contents in standard in the case ofMadagascar hibonite, higher Si and Ca contents in the caseof anorthite).
(1) First, we will exclude the possibility that variations inMurchison hibonite mineral chemistry are responsible forvariations in the degree of fractionation within theunknown dataset. As there are resolvable mass-independentvariations (spread in D17O) in addition to possible mass-dependent fractionation effects in oxygen isotopes, an eval-uation of possible mass-dependent fractionation effectsrequires assumptions regarding the initial composition ofthe PLAC-like CAI precursors. Since the primary variationof the dataset is along a mass-independent line of slope �1similar to the CCAM line, the most reasonable choice is toassume that the precursors of PLAC-like CAIs initially fellalong the CCAM line. Possible fractionation effects canthen be compared by calculating the deviation of data fromthe CCAM line (in d18O in Fig. A2a). Using this notation, it
Fig. A2. Hibonite analyses show no relationship between mineral chemagnesium (b). Magnesium is a good proxy for the chemical variation of Mare opposite to variations in aluminum (coupled substitution), and variaobtained by EPMA (a) and by SIMS (b).
becomes obvious that there is no relationship between min-eral chemistry and the degree of fractionation in oxygenisotopes in the studied hibonites (Fig. A2a). In Fig. A2a,the Mg content is plotted, which can be used to assess thechemical variability in the studied grains as it is coupledwith the abundances of Ti4+and Al3+ (Mg+2 + Ti+4 = 2Al+3), and no major variation in other elements wasobserved. The lack of a relationship between mineral chem-istry and mass fractionation in oxygen isotopes (Fig. A2a)suggests that mineral chemistry did not influence instru-mental fractionation for the studied hibonites. This is eventhe case for SHIB hibonites measured in the same session,which have a significantly larger range of magnesium andtitanium contents than the PLAC-like CAIs but show min-imal mass fractionation effects (Fig. A2a; Koop et al.,2016). Similar to oxygen, there is no correlation betweenmineral chemistry and the degree of fractionation in magne-sium isotopes (Fig. A2b). The data therefore suggest thatvariations in hibonite chemistry have no significant effecton instrumental fractionation of unknown measurements.
Similarly, geometric effects such as polishing relief orcharging effects that could introduce additional fractiona-tion for individual samples can be ruled out as topographywas found to be minimal in the grain mounts (see Sec-tion 2.2). This is further substantiated by the consistentlylow values for the automatically adjusted deflector settingsfor all measurements, which can become elevated duringautomatic centering of the secondary beam in cases ofuneven surfaces.
(2) While we can exclude that variations in unknownchemistry affect instrumental fractionation of individualhibonite analyses, the possibility remains that the datasetas a whole could be offset from true values in oxygen ormagnesium because we had to use the FeO-rich Madagas-car hibonite for fractionation correction. For oxygen, sucha shift can likely be ruled out using the SHIB dataset, as
mistry and the degree of mass fractionation in oxygen (a) andurchison hibonites as titanium abundances mirror magnesium and
tions in other elements are minimal. The magnesium contents were

L. Koop et al. /Geochimica et Cosmochimica Acta 189 (2016) 70–95 91
analyses of spinel and hibonite within the same SHIB typ-ically agree within uncertainty and no consistent biasbetween hibonite and spinel analyses was found. Since spi-nel and hibonite SHIB data are on or only slightly offsetfrom the CCAM line, using a Madagascar hibonite stan-dard appears to introduce no or only a minimal a bias foroxygen isotopes.
Due to the lack of a suitable standard, we did notattempt to assess absolute d25Mg for the dataset. Whilethe average d25Mg value in PLAC-like CAIs is indistin-guishable from zero (0.0 ± 0.8‰), we used anorthite fornormalization and thus expect that the dataset as a wholecould be lighter or heavier by up to �2‰ amu�1 due tothe matrix effect. In contrast, the internal variations inPLAC-like CAIs of �5‰ amu�1 in magnesium isotopes(Fig. 4) are likely intrinsic as chemical variation or topogra-phy in these samples is minimal (see above).
Similarly, the difference in unknown and standard com-position can affect 27Al/24Mg ratios measured by SIMS.Based on SHIB data, we infer that the RSF bias is at theorder of 5% at most, but due to the 26Al-poor nature ofthe sample set, this small potential bias does not affect theconclusions of this study.
Finally, the possibility exists that some variations, inparticular the mass-independent range in D17O of �11‰,are due to secondary processes or contamination. Whileexchange during aqueous alteration on the Murchison par-ent body could technically result in variations in oxygenisotopes (Clayton and Mayeda, 1984), the lack of isotopicvariation in SHIB hibonites regardless of petrologic setting(fine-grained, coarse-grained, rimmed, located in the centeror at edge of the inclusion as well as in direct proximity toalteration phases; Koop et al., 2016) suggests that hibonitegrains did not readily exchange with 16O-poor liquids. Sim-ilarly, contamination can be excluded as the SHIBs andPLAC-like CAIs experienced the same preparation stepsand because the small primary spot size of the Cs+ primarybeam during oxygen isotope analysis allowed us to effi-ciently avoid sampling of secondary phases, which was con-firmed with the SEM after the analysis. We thereforeconclude that the oxygen isotope data presented in Fig. 2and Table 2 reflects the true composition of the studiedCAIs. Deviations from the CCAM line are intrinsic andeither due to isotope fractionation inherent from their for-mation processes or nucleosynthetic anomalies in oxygenisotopes.
A.3. Mass-fractionation correction for calcium and titanium
isotopes
As outlined in Section 2.5.3, instrumental fractionationof calcium and titanium analyses was corrected bysample-standard bracketing and any potential intrinsicfractionation was corrected using a Rayleigh law. This isin contrast to previous studies, which corrected for bothsources of mass-fractionation simultaneously by applyingthe exponential law (internal normalization). We decidedto deviate from this convention for four main reasons. (1)It has been shown that evaporation of calcium and titaniumfrom experimental melts results in isotopic fractionation
that follows a Rayleigh law, not the exponential law(Zhang et al., 2014). (2) A number of standard analyses cor-rected with the exponential law yield d-values that areresolved from 0‰ beyond calculated 2r uncertainties (com-pare Table EA.2). This may indicate that fractionation ofcalcium and titanium isotopes inside the CAMECA IMS-1280 follows a law that is different from the exponentiallaw. Nonzero standard d50Ti values are more oftenobserved in 46Ti/48Ti normalization than in 49Ti/47Ti nor-malization (EA.2), possibly because of increased extrapola-tion using a law that does not accurately describefractionation inside the instrument. If true, it is better toestimate the degree of instrumental fractionation forunknowns from bracketing standard measurements. (3)The range of d50Ti and d48Ca values is approximately 7‰for standards corrected with the exponential law (compareEA.2). Given this spread, we believe that the 2r uncertain-ties calculated for internally normalization data (on average�2‰ for unknowns) underestimate the true uncertainty ofour analyses. By sample-standard bracketing, we propagatethe uncertainties associated with the bracketing standards,which yields larger uncertainties that probably reflect thetrue uncertainty of our measurements more accurately. (4)Finally, this data treatment is consistent with magnesiumisotopic analyses, in which instrumental fractionation iscorrected using sample-standard bracketing followed bycorrection of intrinsic fractionation using an appropriatelaw obtained from experiments (Davis et al., 2015).
Comparison of the two approaches: Sample-standardbracketing followed by correction with the Rayleigh lawyields larger uncertainties (3–7‰ on both d50Ti andd48Ca) than internal correction with the exponential law(2–3‰ on both d50Ti and d48Ca). As noted above, this isbecause uncertainties of the bracketing standard analysesare propagated and is believed to reflect the true measure-ment uncertainties more accurately. As illustrated inFig. A3 for titanium, the different approaches for fraction-ation correction have only small effects on calculatedd-values and the values overlap within 2r uncertainties.This suggests that the newly obtained data can be comparedwith data from previous studies that used different mass-fractionation correction schemes.
A.4. Choice of normalization isotope pairs for titanium
Some of the studied PLAC-like CAIs have small anoma-lies in 49Ti or 46Ti when normalized to 46Ti/48Ti or49Ti/47Ti, respectively. Previous studies concluded that theanomaly was in 49Ti and thus normalized to 46Ti/48Ti(e.g., Fahey et al., 1985; Ireland, 1988, 1990; Liu et al.,2009), but the presence of small anomalies in 46Ti in CVchondrite CAIs (Trinquier et al., 2009) casts doubts onwhether 46Ti should be used as a normalization isotopefor PLAC-like CAIs. Anomalies in 46Ti would produce arti-ficial anomalies in 49Ti of the same sign if the data are nor-malized to 46Ti/48Ti. The variation in PLAC-like CAIscould therefore be in 46Ti rather than 49Ti. For example,a +5‰ anomaly in 46Ti would introduce artificial anoma-lies in 49Ti and 50Ti of +2.4‰ and +5‰ in 46Ti/48Ti nor-malization. Similarly, a +5‰ anomaly in 49Ti would
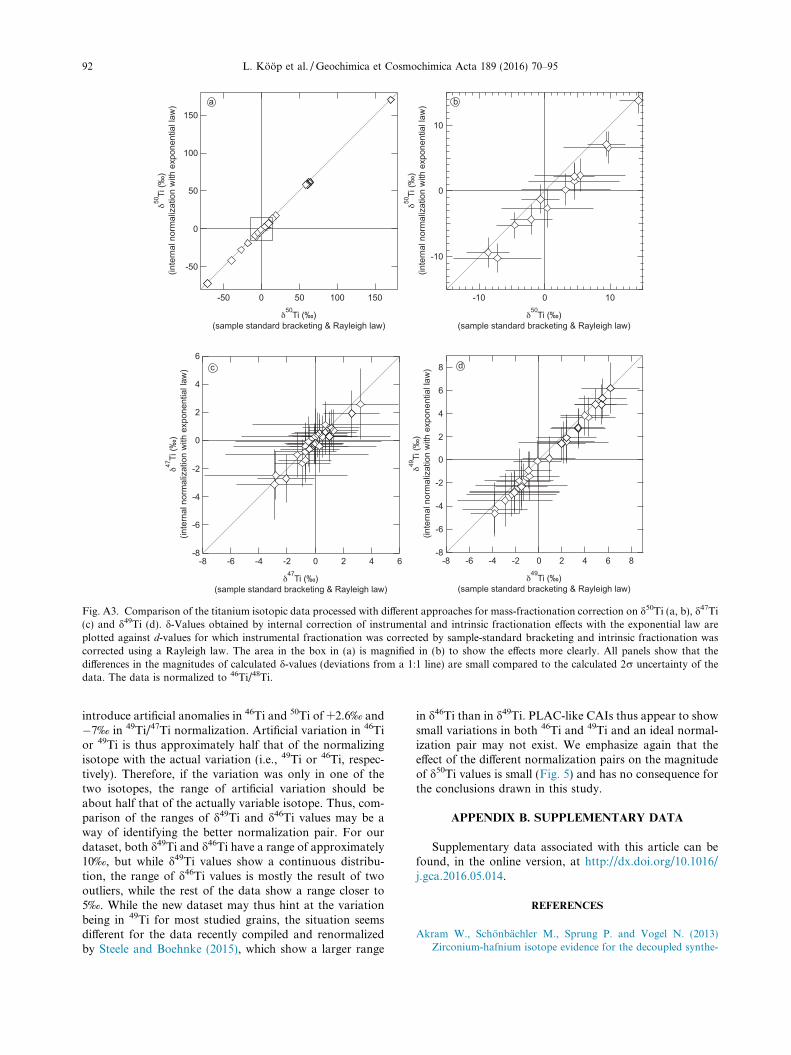
Fig. A3. Comparison of the titanium isotopic data processed with different approaches for mass-fractionation correction on d50Ti (a, b), d47Ti(c) and d49Ti (d). d-Values obtained by internal correction of instrumental and intrinsic fractionation effects with the exponential law areplotted against d-values for which instrumental fractionation was corrected by sample-standard bracketing and intrinsic fractionation wascorrected using a Rayleigh law. The area in the box in (a) is magnified in (b) to show the effects more clearly. All panels show that thedifferences in the magnitudes of calculated d-values (deviations from a 1:1 line) are small compared to the calculated 2r uncertainty of thedata. The data is normalized to 46Ti/48Ti.
92 L. Koop et al. /Geochimica et Cosmochimica Acta 189 (2016) 70–95
introduce artificial anomalies in 46Ti and 50Ti of +2.6‰ and�7‰ in 49Ti/47Ti normalization. Artificial variation in 46Tior 49Ti is thus approximately half that of the normalizingisotope with the actual variation (i.e., 49Ti or 46Ti, respec-tively). Therefore, if the variation was only in one of thetwo isotopes, the range of artificial variation should beabout half that of the actually variable isotope. Thus, com-parison of the ranges of d49Ti and d46Ti values may be away of identifying the better normalization pair. For ourdataset, both d49Ti and d46Ti have a range of approximately10‰, but while d49Ti values show a continuous distribu-tion, the range of d46Ti values is mostly the result of twooutliers, while the rest of the data show a range closer to5‰. While the new dataset may thus hint at the variationbeing in 49Ti for most studied grains, the situation seemsdifferent for the data recently compiled and renormalizedby Steele and Boehnke (2015), which show a larger range
in d46Ti than in d49Ti. PLAC-like CAIs thus appear to showsmall variations in both 46Ti and 49Ti and an ideal normal-ization pair may not exist. We emphasize again that theeffect of the different normalization pairs on the magnitudeof d50Ti values is small (Fig. 5) and has no consequence forthe conclusions drawn in this study.
APPENDIX B. SUPPLEMENTARY DATA
Supplementary data associated with this article can befound, in the online version, at http://dx.doi.org/10.1016/j.gca.2016.05.014.
REFERENCES
Akram W., Schonbachler M., Sprung P. and Vogel N. (2013)Zirconium-hafnium isotope evidence for the decoupled synthe-

L. Koop et al. /Geochimica et Cosmochimica Acta 189 (2016) 70–95 93
sis of light and heavy neutron-rich nuclei. Astrophys. J. 777,#169 (12 pp).
Amari S., Lewis R. S. and Anders E. (1994) Interstellar grains inmeteorites. I. Isolation of SiC, graphite, and diamond; sizedistributions of SiC and graphite. Geochim. Cosmochim. Acta
58, 459–470.Baertschi P. (1976) Absolute 18O content of standard mean ocean
water. Earth Planet. Sci. Lett. 31, 341–344.Bodenan J.-D., Starkey N. A., Russell S. S., Wright I. P. and
Franchi I. A. (2014) An oxygen isotope study of Wark-Lovering rims on Type A CAIs in primitive carbonaceouschondrites. Earth Planet. Sci. Lett. 401, 327–336.
Burkhardt C., Kleine T., Oberli F., Pack A., Bourdon B. andWieler R. (2011) Molybdenum isotope anomalies in meteorites:constraints on solar nebula evolution and origin of the Earth.Earth Planet. Sci. Lett. 312, 390–400.
Clayton R. N. (2002) Solar system: self-shielding in the solarnebula. Nature 415, 860–861.
Clayton R. N. and Mayeda T. K. (1984) The oxygen isotope recordin Murchison and other carbonaceous chondrites. Earth Planet.Sci. Lett. 67, 151–161.
Clayton R. N., Grossman L. and Mayeda T. K. (1973) Acomponent of primitive nuclear composition in carbonaceousmeteorites. Science 182, 485–488.
Clayton R. N., Onuma N., Grossman L. and Mayeda T. K. (1977)Distribution of the presolar component in Allende and othercarbonaceous chondrites. Earth Planet. Sci. Lett. 34, 209–224.
Clayton R. N., Hinton R. W. and Davis A. M. (1988) Isotopicvariations in the rock-forming elements in meteorites. Phil.
Trans. R. Soc. Lond. A325, 483–501.Connelly J. N., Bizzarro M., Krot A. N., Nordlund A., Wielandt
D. and Ivanova M. A. (2012) The absolute chronology andthermal processing of solids in the solar protoplanetary disk.Science 338, 651.
Dauphas N., Remusat L., Chen J. H., Roskosz M., PapanastassiouD. A., Stodolna J., Guan Y., Ma C. and Eiler J. M. (2010)Neutron-rich chromium isotope anomalies in supernovananoparticles. Astrophys. J. 720, 1577.
Dauphas N., Chen J. H., Zhang J., Papanastassiou D. A., Davis A.M. and Travaglio C. (2014) Calcium-48 isotopic anomalies inbulk chondrites and achondrites: evidence for a uniformisotopic reservoir in the inner protoplanetary disk. Earth
Planet. Sci. Lett. 407, 96–108.Davis A. M., Richter F. M., Mendybaev R. A., Janney P. E.,
Wadhwa M. and McKeegan K. D. (2005) Isotopic massfractionation laws and the initial solar system 26Al/27Al ratio.Lunar Planet. Sci. 36, #2334.
Davis A. M., Richter F. M., Mendybaev R. A., Janney P. E.,Wadhwa M. and McKeegan K. D. (2015) Isotopic massfractionation laws for magnesium and their effects on26Al–26Mg systematics in solar system materials. Geochim.
Cosmochim. Acta 158, 245–261.Diehl R., Halloin H., Kretschmer K., Lichti G. G., Schonfelder V.,
Strong A. W., von Kienlin A., Wang W., Jean P., KnodlsederJ., Roques J.-P., Weidenspointner G., Schanne S., HartmannD. H., Winkler C. and Wunderer C. (2006) Radioactive 26Alfrom massive stars in the Galaxy. Nature 439, 45–47.
Fahey A. J. (1998) Measurements of dead time and characteriza-tion of ion counting systems for mass spectrometry. Rev. Sci.Instrum. 69, 1282–1288.
Fahey A. J., Goswami J. N., McKeegan K. D. and Zinner E. (1985)Evidence for extreme 50Ti enrichments in primitive meteorites.Astrophys. J. 296, L17–L20.
Fahey A. J., Goswami J. N., McKeegan K. D. and Zinner E.(1987a) 16O excess in Murchison and Murray hibonites: a case
against a late supernove injection origin of isotopic anomaliesin O, Mg, Ca, and Ti. Astrophys. J. 323, L91–L95.
Fahey A. J., Goswami J. N., McKeegan K. D. and Zinner E.(1987b) 26Al, 244Pu, 50Ti, REE, and trace element abundancesin hibonite grains from CM and CV meteorites. Geochim.
Cosmochim. Acta 51, 329–350.Gounelle M., Krot A. N., Nagashima K. and Kearley A. (2009)
Extreme 16O-enrichment in refractory inclusions from theIsheyevo meteorite: implication for oxygen isotope compositionof the Sun. Astrophys. J. 698, L18–L22.
Grossman L. (1972) Condensation in the primitive solar nebula.Geochim. Cosmochim. Acta 36, 595–619.
Heck P. R., Ushikubo T., Schmitz B., Kita N. T., Spicuzza M. J.and Valley J. W. (2010) A single asteroidal source forextraterrestrial Ordovician chromite grains from Sweden andChina: high-precision oxygen three-isotope SIMS analysis.Geochim. Cosmochim. Acta 74, 497–509.
Hinton R. W., Davis A. M. and Scatena-Wachel D. E. (1987)Large negative 50Ti anomalies in refractory inclusions from theMurchison carbonaceous chondrite: evidence for incompletemixing of neutron-rich supernova ejecta into the solar system.Astrophys. J. 313, 420–428.
Huss G. R., Meshik A. P., Smith J. B. and Hohenberg C. M. (2003)Presolar diamond, silicon carbide, and graphite in carbona-ceous chondrites: implications for thermal processing in thesolar nebula. Geochim. Cosmochim. Acta 67, 4823–4848.
Ireland T. R. (1988) Correlated morphological, chemical, andisotopic characteristics of hibonites from the Murchisoncarbonaceous chondrite. Geochim. Cosmochim. Acta 52, 2827–2839.
Ireland T. R. (1990) Presolar isotopic and chemical signatures inhibonite-bearing refractory inclusions from the Murchisoncarbonaceous chondrite. Geochim. Cosmochim. Acta 54, 3219–3237.
Ireland T. R., Zinner E. K., Fahey A. J. and Esat T. M. (1992)Evidence for distillation in the formation of HAL and relatedhibonite inclusions. Geochim. Cosmochim. Acta 56, 2503–2520.
Jacobsen B., Yin Q., Moynier F., Amelin Y., Krot A. N.,Nagashima K., Hutcheon I. D. and Palme H. (2008) 26Al–26Mgand 207Pb–206Pb systematics of Allende CAIs: canonical solarinitial 26Al/27Al ratio reinstated. Earth Planet. Sci. Lett. 272,353–364.
Kawasaki N., Sakamoto N. and Yurimoto H. (2012) Oxygenisotopic and chemical zoning of melilite crystals in a Type ACa–Al-rich inclusion of Efremovka CV3 chondrite. Meteorit.
Planet. Sci. 47, 2084–2093.Kita N. T., Ushikubo T., Fu B. and Valley J. W. (2009) High
precision SIMS oxygen isotope analysis and the effect of sampletopography. Chem. Geol. 264, 43–57.
Kita N. T., Nagahara H., Tachibana S., Tomomura S., SpicuzzaM. J., Fournelle J. H. and Valley J. W. (2010) High precisionSIMS oxygen three isotope study of chondrules in LL3chondrites: role of ambient gas during chondrule formation.Geochim. Cosmochim. Acta 74, 6610–6635.
Kita N. T., Ushikubo T., Knight K. B., Mendybaev R. A., DavisA. M., Richter F. M. and Fournelle J. H. (2012) Internal26Al–26Mg isotope systematics of a Type B CAI: remelting ofrefractory precursor solids. Geochim. Cosmochim. Acta 86, 37–51.
Kobayashi S., Imai H. and Yurimoto H. (2003) An extreme 16O-rich chondrule from Acfer 214 CH chondrite. Lunar Planet. Sci.34, #1536.
Koop L., Davis A. M., Heck P. R., Kita N. T., Krot A. N., ManeP., Nagashima K., Nakashima D., Park C., Tenner T. J. andWadhwa M. (2015) Multiple generations of fractionated
94 L. Koop et al. /Geochimica et Cosmochimica Acta 189 (2016) 70–95
hibonite-rich CAIs sampled the solar nebula at different degreesof isotopic heterogeneity. Lunar Planet. Sci 46, #2750.
Koop L., Nakashima D., Heck P. R., Kita N. T., Tenner T. J.,Krot A. N., Nagashima K., Park C. and Davis A. M. (2016)New constraints on the relationship between 26Al and oxygen,calcium, and titanium isotopic variation in the early SolarSystem from a multielement isotopic study of spinel-hiboniteinclusions. Geochim. Cosmochim. Acta 184, 151–172.
Krot A. N., Nagashima K., Bizzarro M., Huss G. R., Davis A.M., Meyer B. S. and Ulyanov A. A. (2008) Multiplegenerations of refractory inclusions in the metal-rich carbona-ceous chondrites Acfer 182/214 and Isheyevo. Astrophys. J.
672, 713–721.Krot A. N., Amelin Y., Bland P., Ciesla F. J., Connelly J., Davis A.
M., Huss G. R., Hutcheon I. D., Makide K., Nagashima K.,Nyquist L. E., Russell S. S., Scott E. R. D., Thrane K.,Yurimoto H. and Yin Q.-Z. (2009) Origin and chronology ofchondritic components: a review. Geochim. Cosmochim. Acta
73, 4963–4997.Krot A. N., Nagashima K., Ciesla F. J., Meyer B. S., Hutcheon I.
D., Davis A. M., Huss G. R. and Scott E. R. D. (2010) Oxygenisotopic composition of the Sun and mean oxygen isotopiccomposition of the protosolar silicate dust: evidence fromrefractory inclusions. Astrophys. J. 713, 1159–1166.
Krot A. N., Nagashima K., Wasserburg G. J., Huss G. R.,Papanastassiou D., Davis A. M., Hutcheon I. D. and BizzarroM. (2014) Calcium–aluminum-rich inclusions with fractiona-tion and unknown nuclear effects (FUN CAIs): I. Mineralogy,petrology, and oxygen isotopic compositions. Geochim. Cos-
mochim. Acta 145, 206–247.Krot A. N., Nagashima K., van Kooten E. M. M. E. and Bizzarro
M. (2015) Refractory inclusions recycled during formation ofporphyritic chondrules from CH carbonaceous chondrites.Lunar Planet. Sci 46, #1596.
Lee J.-E., Bergin E. A. and Lyons J. R. (2008) Oxygen isotopeanomalies of the Sun and the original environment of the solarsystem. Meteorit. Planet. Sci. 43, 1351–1362.
Liu M.-C., McKeegan K. D., Goswami J. N., Marhas K. K.,Sahijpal S., Ireland T. R. and Davis A. M. (2009) Isotopicrecords in CM hibonites: implications for timescales of mixingof isotope reservoirs in the solar nebula. Geochim. Cosmochim.
Acta 73, 5051–5079.Liu M.-C., Chaussidon M., Gopel C. and Lee T. (2012) A
heterogeneous solar nebula as sampled by CM hibonite grains.Earth Planet. Sci. Lett. 327, 75–83.
Lodders K. (2003) Solar system abundances and condensationtemperatures of the elements. Astrophys. J. 591, 1220–1247.
Lyons J. R. and Young E. D. (2005) CO self-shielding as the originof oxygen isotope anomalies in the early solar nebula. Nature
435, 317–320.MacPherson G. J., Nagashima K., Bullock E. S. and Krot A. N.
(2008) Mass-dependent oxygen isotopic fractionation in non-FUN forsterite-bearing Type B CAIs. Lunar Planet. Sci. 39,#2039.
MacPherson G. J., Kita N. T., Ushikubo T., Bullock E. S. andDavis A. M. (2012) Well-resolved variations in the formationages for Ca–Al-rich inclusions in the early solar system. EarthPlanet. Sci. Lett. 331, 43–54.
Makide K., Nagashima K., Krot A. N., Huss G. R., Hutcheon I.D. and Bischoff A. (2009) Oxygen- and magnesium-isotopecompositions of calcium–aluminum-rich inclusions from CR2carbonaceous chondrites. Geochim. Cosmochim. Acta 73, 5018–5050.
McKeegan K. D., Kallio A. P. A., Heber V. S., Jarzebinski G.,Mao P. H., Coath C. D., Kunihiro T., Wiens R. C., Nordholt J.E., Moses R. W., Reisenfeld D. B., Jurewicz A. J. G. and
Burnett (2011) The oxygen isotopic composition of the Suninferred from captured solar wind. Science 332, 1528–1532.
Mendybaev R. A., Richter F. M., Georg R. B., Janney P. E.,Spicuzza M. J., Davis A. M. and Valley J. W. (2013)Experimental evaporation of Mg- and Si-rich melts: implica-tions for the origin and evolution of FUN CAIs. Geochim.
Cosmochim. Acta 123, 368–384.Nakashima D., Ushikubo T., Gowda R. N., Kita N. T., Valley J.
W. and Nagao K. (2011) Ion microprobe analyses of oxygenthree-isotope ratios of chondrules from the Sayh al Uhaymir290 CH chondrite using a multiple-hole disk. Meteorit. Planet.
Sci. 46, 857–874.Nittler L. R., Alexander C. M. O., Gallino R., Hoppe P., Nguyen
A. N., Stadermann F. J. and Zinner E. K. (2008) Aluminum-,calcium- and titanium-rich oxide stardust in ordinary chondritemeteorites. Astrophys. J. 682, 1450–1478.
Nozawa T., Maeda K., Kozasa T., Tanaka M., Nomoto K. andUmeda H. (2011) Formation of dust in the ejecta of Type Iasupernovae. Astrophys. J. 736, 45.
Park C., Wakaki S., Sakamoto N., Kobayashi S. and Yurimoto H.(2012) Oxygen isotopic composition of the solar nebula gasinferred from high-precision isotope imaging of melilite crystalsin an Allende CAI. Meteorit. Planet. Sci. 47, 2070–2083.
Park C., Nagashima K., Hutcheon I. D., Wasserburg G. J.,Papanastassiou D. A., Davis A. M., Huss G. R. and Krot A. N.(2013) Heterogeneity of Mg isotopes and variable 26Al/27Alratio in FUN CAIs. Meteor. Planet. Sci. Suppl. 76, #5085.
Park C., Nagashima K., Wasserburg G. J., Papanastassiou D. A.,Hutcheon I. D., Davis A. M., Huss G. R., Bizzarro M. andKrot A. N. (2014) Calcium and titanium isotopic compositionsof FUN CAIs: implications for their origin. Lunar Planet. Sci45, #2656.
Rauscher T., Heger A., Hoffman R. D. and Woosley S. E. (2002)Nucleosynthesis in massive stars with improved nuclear andstellar physics. Astrophys. J. 576, 323–348.
Richter F. M., Davis A. M., Ebel D. S. and Hashimoto A. (2002)Elemental and isotopic fractionation of Type B calcium-,aluminum-rich inclusions: experiments, theoretical considera-tions, and constraints on their thermal evolution. Geochim.
Cosmochim. Acta 66, 521–540.Sahijpal S. and Goswami J. N. (1998) Refractory phases in primitive
meteorites devoid of 26Al and 41Ca: representative samples offirst solar system solids? Astrophys. J. 509, L137–L140.
Sahijpal S., Goswami J. N. and Davis A. M. (2000) K, Mg, Ti andCa isotopic compositions and refractory trace element abun-dances in hibonites from CM and CV meteorites: implicationsfor early solar system processes. Geochim. Cosmochim. Acta 64,1989–2005.
Schonbachler M., Lee D.-C., Rehkamper M., Halliday A. N., FehrM. A., Hattendorf B. and Gunther D. (2003) Zirconium isotopeevidence for incomplete admixing of r-process components inthe solar nebula. Earth Planet. Sci. Lett. 216, 467–481.
Simon J. I., Hutcheon I. D., Simon S. B., Matzel J. E. P., RamonE. C., Weber P. K., Grossman L. and DePaolo D. J. (2011)Oxygen isotope variations at the margin of a CAI recordscirculation within the solar nebula. Science 331, 1175–1178.
Steele R. C. J. and Boehnke P. (2015) Titanium isotope sourcerelations and the extent of mixing in the proto-solar nebulaexamined by independent component analysis. Astrophys. J.
802, 80–93.Thiemens M. H. (2006) History and applications of mass-
independent isotope effects. Ann. Rev. Earth Planet. Sci. 34,217–262.
Trinquier A., Elliott T., Ulfbeck D., Coath C., Krot A. N. andBizzarro M. (2009) Origin of nucleosynthetic isotope hetero-geneity in the solar protoplanetary disk. Science 324, 374–376.

L. Koop et al. /Geochimica et Cosmochimica Acta 189 (2016) 70–95 95
Ushikubo T., Kimura M., Kita N. T. and Valley J. W. (2011)Primordial oxygen isotope reservoirs of the solar nebularecorded in chondrules from Acfer 094 carbonaceous chondrite.Lunar Planet. Sci. 42, #1183.
Ushikubo T., Kimura M., Kita N. T. and Valley J. W. (2012)Primordial oxygen isotope reservoirs of the solar nebularecorded in chondrules in Acfer 094 carbonaceous chondrite.Geochim. Cosmochim. Acta 90, 242–264.
Ushikubo T., Nakashima D., Kimura M., Tenner T. J. and Kita N.T. (2013) Contemporaneous formation of chondrules in distinctoxygen isotope reservoirs. Geochim. Cosmochim. Acta 109, 280–295.
Wasserburg G., Lee T. and Papanastassiou D. (1977) Correlated Oand Mg isotopic anomalies in Allende inclusions: II. Magne-sium. Geophys. Res. Lett. 4, 299–302.
Wood J. A. (1998) Meteoritic evidence for the infall of largeinterstellar dust aggregates during the formation of the solarsystem. Astrophys. J. 503, L101–L104.
Yang L., Ciesla F. J., Lyons J. R., Lee J.-E. and Bergin E. A. (2011)Oxygen isotope anomalies in the solar nebula inherited from theproto-solar cloud. Lunar Planet. Sci. 42, #1602.
Young E. D. and Russell S. S. (1998) Oxygen reservoirs in the earlysolar nebula inferred froman AllendeCAI.Science 282, 452–455.
Yurimoto H. and Kuramoto K. (2004) Molecular cloud origin forthe oxygen isotope heterogeneity in the solar system. Science305, 1763–1766.
Zinner E. K., Fahey A. J., McKeegan K. D., Goswami J. N. andIreland T. R. (1986) Large 48Ca anomalies are associated with50Ti anomalies in Murchison and Murray hibonites. Astrophys.J. 311, L103–L107.
Zinner E. K., Fahey A. J., McKeegan K. D. and Goswami J. N.(1987) Isotopic structures in Murchison hibonites: O, Ca, andTi. Meteoritics 22, 542–543.
Zhang J., Davis A. M. and Dauphas N. (2012) Titanium isotopiccompositions in calcium–aluminum-rich inclusions. Meteor.
Planet. Sci. Suppl. 47, #5286.Zhang J., Huang S., Davis A. M., Dauphas N., Hashimoto A. and
Jacobsen S. B. (2014) Calcium and titanium isotopic fraction-ations during evaporation. Geochim. Cosmochim. Acta 140,365–380.
Associate editor: Munir Humayun