Sockeye salmon investigations and limnological sampling on ...

A LIMNOLOGICAL STUDY OF TEMENGOR
RESERVOIR WITH SPECIAL REFERENCE TO
THE APHOTIC ZONE
NOR AISYAH BINTI OMAR
UNIVERSITI SAINS MALAYSIA
2015
A LIMNOLOGICAL STUDY OF TEMENGOR
RESERVOIR WITH SPECIAL REFERENCE TO
THE APHOTIC ZONE
by
NOR AISYAH BINTI OMAR
Thesis submitted in fulfillment of the
requirements for the degree of
Master of Science
OCTOBER 2015

ii
ACKNOWLEDGEMENT
In the name of Allah, the Most Beneficent, the Most Merciful.
As I compose this, I am truly indebted to several people that help me
throughout the publication of this thesis. Millions of thanks to the Malaysian
Meteorogical Department for Department of Survey and Mapping Malaysia for
permission to obtain data collection and to collaborate their research in Temengor
Reservoir, Perak. It is an honourable experience to have worked with these two
organizations that are prominent in the conservation of biodiversity of Temengor
Reservoir. Special thanks to Pulau Banding foundation for funding this study.
I would like to extend my gratitude to my main supervisor, Professor
Mashhor Mansor for his tremendous support and guidance throughout the whole
project. I would also like to thank my co-supervisor, Associate Professor Dr Wan
Maznah Wan Omar, for her advice and guidance. Thank you Muzzalifah Abd
Hamid, Mohd Syaiful and Mr Rashid Othman from School of Biological Sciences
for their help and support.
This research is financially supported by Universiti Sains Malaysia through
an external grant entitled “A Limnological Study with Special Reference to Dark
Zone” 304/PBIOLOGI/650649/P134. The thesis was improved by suggestions and
comments from anonymous reviewers.

iii
TABLE OF CONTENTS
Page
ACKNOWLEDGEMENTS ii
TABLE OF CONTENTS iii
LIST OF TABLES vi
LIST OF FIGURES vii
LIST OF PLATES xi
LIST OF UNITS AND ABBREVIATIONS xii
ABSTRAK xiii
ABSTRACT xv
CHAPTER 1: INTRODUCTION
1.1 General introduction 1
1.2 The scope of the study 5
1.3 The importance of the study 5
1.4 Research objectives 6
CHAPTER 2: LITERATURE REVIEW
2.1 Reservoir characteristics 7
2.2 Reservoir zonation 9
2.2.1 Lentic physical structure 14
2.3 Nutrient dynamics 19
2.3.1 Phosphorus 20
2.3.2 Nitrogen 21
2.3.3 Chlorophyll a 22
2.4 Lake trophic state 22
2.5 Bathymetric study 23

iv
CHAPTER 3: MATERIALS AND METHODS
3.1 Study site 24
3.2 Sampling design 25
3.3 Field analysis 28
3.4 Laboratory analysis 30
3.5 Bathymetric study 31
3.6 Descriptive statistic, one-way anova and post-hoc analysis 32
CHAPTER 4: RESULTS
4.1 Rainfall (mm) and water level (m) 34
4.2 Water transparency (m) 36
4.3 Temperature (ºC) 38
4.4 Dissolved oxygen (mg/L) 42
4.5 pH 46
4.6 Conductivity (mS/cm) 50
4.7 Total dissolved solids (g/L) 54
4.8 Orthophosphate, PO4-P (mg/L) 58
4.9 Nitrate-nitrogen, NO3-N (mg/L) 61
4.10 Nitrite-nitrogen, NO2-N (mg/L) 64
4.11 Chlorophyll a (mg/L) 67
4.12 Correlations between the measured parameters 71
4.13 Bathymetric study 74
CHAPTER 5: DISCUSSION
5.1 Rainfall (mm) and water level (m) 78
5.2 Water transparency (m) 78
5.3 Temperature (ºC) 79
5.4 Dissolved oxygen (mg/L) 81
5.5 pH 83
5.6 Conductivity (mS/cm) 84

v
5.7 Total dissolved solids (g/L) 86
5.8 Orthophosphate, PO4-P (mg/L) 87
5.9 Nitrate-nitrogen, NO3-N and Nitrite-nitrogen, NO2-N (mg/L) 89
5.10 Chlorophyll a (mg/L) 90
5.11 Bathymetric study 91
CHAPTER 6: CONCLUSION AND RECOMMENDATION 94
REFERENCES 95
APPENDICES 111
LIST OF PUBLICATION 116

vi
LIST OF TABLES
Table 3.1 GPS coordinates for five sampling stations of the study site
26
Table 4.1 The mean Secchi disc reading (m) and ± s.d. at all sampling stations
37
Table 4.2 The mean of all measured parameters during dry and wet season
70
Table 4.3
Pearson’s correlation coefficients between all measured water quality
parameters at surface during the study period
73

vii
LIST OF FIGURES
Figure 2.1 Definite zones which are determined by the distance from shore
gradients and depth in reservoir (Sigee, 2005).
10
Figure 2.2 Longitudinal cross section view showing three distinct zones
defined by the slope of a dam (Thornton et al., 1990).
12
Figure 2.3 The thermal stratification of a tropical reservoir (Payne, 1986)
.
15
Figure 3.1 Location of five sampling stations in (Station 1 – Station 5)
Temengor Reservoir
26
Figure 3.2 The mean of rainfall received every month (mm) from 2000
until 2012 in Temengor Reservoir (MET Malaysia)
29
Figure 4.1 The monthly rainfall (mm) and water level (m) at Temengor
Reservoir during the study period (MET Malaysia, 2012)
35
Figure 4.2
The monthly Secchi depth (m) at all sampling stations during
the study period (November 2011-June 2012).
37
Figure 4.3 The vertical profile of mean (±st.d) temperature (ºC) at all
sampling stations during the study period
39
Figure 4.4
The vertical profiles for monthly temperature (ºC) measured
from surface to 30 m at all sampling stations
40
Figure 4.5
The pattern of monthly water temperature (ºC) distribution in
Temengor Reservoir
41

viii
Figure 4.6
The vertical profile of mean (±s.d) dissolved oxygen (mg/L) at
all sampling stations during the study period
43
Figure 4.7 The vertical profiles for monthly dissolved oxygen (mg/L)
measured from surface to 30 m at all sampling stations.
44
Figure 4.8 The pattern of monthly dissolved oxygen (mg/L) distribution in
Temengor Reservoir.
45
Figure 4.9 The vertical profile of mean (±s.d) pH at all sampling stations
during the study period.
47
Figure 4.10 The vertical profiles for monthly pH measured from surface to
30 m at all sampling stations.
48
Figure 4.11 The pattern of monthly pH distribution in Temengor Reservoir.
49
Figure 4.12 The vertical profile of mean (±s.d) conductivity (mS/cm) at all
sampling stations during the study period.
51
Figure 4.13 The vertical profiles for conductivity (mS/cm) measured from
surface to 30 m at all sampling stations.
52
Figure 4.14 The pattern of monthly conductivity (mS/cm) distribution in
Temengor Reservoir.
53
Figure 4.15 The vertical profile of mean (±s.d) total dissolved solids (g/L) at
all sampling stations during the study period.
55
Figure 4.16 The vertical profiles for monthly total dissolved solids (g/L)
measured from surface to 30 m at all sampling stations.
56

ix
Figure 4.17 The pattern of monthly total dissolved solids (g/L) distribution
in Temengor Reservoir.
57
Figure 4.18 The mean (±s.d) concentration of orthophosphate, PO4-P
(mg/L) at six different sampling depths at all sampling stations.
59
Figure 4.19 The vertical profile of mean (±s.d) orthophosphate,PO4-P
(mg/L) at all sampling stations during the study period.
59
Figure 4.20 The pattern of monthly orthophosphate (mg/L) distribution in
Temengor Reservoir.
60
Figure 4.21 The mean (±s.d) concentration of nitrate-nitrogen, NO3-N
(mg/L) at six different sampling depths at all sampling stations.
62
Figure 4.22
The vertical profile of mean (±s.d) nitrate-nitrogen,NO3-N
(mg/L) at all sampling stations during the study period.
62
Figure 4.23 The pattern of monthly nitrate-nitrogen (mg/L) distribution in
Temengor Reservoir.
63
Figure 4.24
The mean concentration (±s.d) of nitrite-nitroge, NO2-N (mg/L)
at six different sampling depths at all sampling stations.
65
Figure 4.25 The vertical profile of mean (±s.d) nitrite-nitrogen,NO2-N
(mg/L) at all sampling stations during the study period.
65
Figure 4.26 The pattern of monthly nitrite-nitrogen (mg/L) distribution in
Temengor Reservoir.
66
Figure 4.27 The mean (±s.d) concentration of chlorophyll a (mg/L) at six
different sampling depths at all sampling stations.
68

x
Figure 4.28 The vertical profile of mean (±s.d) chlorophyll a (mg/L) at all
sampling stations during the study period.
68
Figure 4.29 The pattern of monthly chlorophyll a (mg/L) distribution in
Temengor Reservoir.
69
Figure 4.30 Contour maps of the benthic elevation in Station 1, Station 2,
Station 3, Station 4 and Station 5.
75
Figure 4.31 Three-dimensional data of the topography in all sampling
stations
77

xi
LIST OF PLATES
Plate 3.1
All five sampling stations studied in Temengor Reservoir. 27

xii
LIST OF UNITS AND ABBREVIATION
Cº = Celcius
g/L = gram per litre
ha = hectare
Hz = Hertz
km/hour = kilometre per hour
L = litre
m = metre
m2= metre squared
m3= metre cubic
mg/L = milligram per litre
mm = millimetre
mS/cm = milliSiemens
OD = optical density
s.d = standard deviation

xiii
KAJIAN LIMNOLOGI DI TASIK TEMENGOR DENGAN RUJUKAN KHAS
KEPADA ZON AFOTIK
ABSTRAK
Kajian bulanan terhadap kesan perubahan musim dan kedalaman ke atas
proses fizikal dan kimia air tasik di Tasik Temengor telah dijalankan dari bulan
November 2011 sehingga Jun 2012 untuk meliputi musim kering (Disember 2011,
Januari 2012, Febuari 2012 dan Jun 2012) dan musim panas (November 2011, Mac
2011, April 2012 dan Mei 2012) berdasarkan data taburan bulanan hujan. Dalam
kajian ini, parameter fizikal telah diukur secara in-situ manakala parameter kimia,
sampel air diambil dari kedalaman yang berbeza (permukaan air, kedalaman Secchi,
5 m, 10 m, 15 m dan 20 m) di lima stesen kajian. Berdasarkan keputusan yang
diperolehi, purata kedalaman Secchi berjulat 2.01 m sehingga 2.31 m. Dalam kajian
ini, parameter fizikal seperti suhu air berjulat 29.8ºC sehingga 30.0ºC,
kandunganoksigenterlarutberjulat 6.8 sehingga 7.6 mg/L dan pH berjulat 7.82
sehingga 8.76. Secara kasarnya, bacaan untukketiga-tiga parameter ini adalah tinggi
di permukaan air tetapi berkurangan secara beransur-ansur dengan kedalaman.
Manakala, konduktiviti berjulat 0.033 sehingga 0.039 mS/cm, paras
pepejalterlarutberjulat 0.019 sehingga 0.023 mg/L, kandungan ortofosfatberjulat
0.022 sehingga 0.059 mg/L, nitrat-nitrogen berjulat 0.015 sehingga 0.028 mg/L,
nitrit-nitrogen berjulat 0.0006 sehingga 0.0016 mg/L dan klorofil a berjulat 1.55
sehingga 3.52 mg/L. Keenam-enam parameter ini adalah rendah di permukaan air
dan semakin meningkat apabila kedalaman air bertambah. Parameter fizikal yang
diukur kecuali suhu (ºC) adalah lebih rendah semasa musim hujan manakala
parameter kimia yang diukur adalah lebih tinggi semasa musim kering kecuali

xiv
kepekatan nitrat-nitrogen. Kajian batimetrik dijalankan untuk memetakan kedalaman
dasar lima stesen kajian di TasikTemengor. Kedalaman maksima yang direkod
adalah di Stesen 3 dan Stesen 4 sedalam 80 meter. Berdasarkan keputusan parameter
fizikal dan kimia yang diukur dalam kajian ini, Tasik Temengor boleh
diklasifikasikan sebagai tasik mesotrofik. Asas ekologi yang kukuh dapat
memastikan Tasik Temengor beroperasi secara optimum. Penambaikan kajian yang
lebih mendalam tentang proses eko-hidrologi di TasikTemengor dapat dijadikan
sebagai asas untuk merangka program pengurusan, pemulihan dan konservasi yang
lebih baik.

xv
A LIMNOLOGICAL STUDY OF TEMENGOR RESERVOIR WITH
SPECIAL REFERENCE TO THE APHOTIC ZONE
ABSTRACT
A monthly study was conducted to analyze the influence of seasonal change
and water depths on physical and chemical processes in the water column of
Temengor Reservoir from November 2011 until June 2012 to cover the dry
(December 2011, January 2012, February 2012 and June 2012) and wet season
(November 2011, March 2012, April 2012, and May 2012) based on the monthly
rainfall distribution obtained. In this study, the physical parameters were taken in-situ
whereas for chemical analysis, water samples from different depths (surface water,
Secchi depth, 5 m, 10 m, 15 m and 20 m) of five sampling stations were collected.
Based on the results, mean of Secchi depth ranged from 2.01 m to 2.31 m. For
physical parameters such as water temperature, it ranged from 29.8 to 30.0ºC,
dissolved oxygen ranged from 6.8 to 7.6 mg/L and pH ranged from 7.82 to 8.76.
Roughly, the values for these three parameters were high at surface water but
decreased gradually with depths. On the other hand, conductivity ranged from 0.033
to 0.039 mS/cm, total dissolved solids level ranged from 0.019 to 0.023 mg/L,
concentrations of orthophosphate ranged from 0.022 to 0.059 mg/L, nitrate-nitrogen
ranged from 0.015 to 0.028 mg/L, nitrite-nitrogen ranged from 0.0006 to 0.0016
mg/L and chlorophyll a ranged from 1.55 to 3.52 mg/L. These parameters were low
at surface and increased with deeper water depths. The measured physical parameters
except temperature (ºC) were slightly lower during wet season whereas the measured
chemical parameters except nitrate-nitrogen were slightly higher during the dry
season. Bathymetry study was conducted to map the benthic elevation of five

xvi
sampling stations in Temengor Reservoir. The maximum depth recorded was at
Station 3 and Station 4 with 80 metres. Based on the findings of measured physical
and chemical parameters from this study, Temengor Reservoir can be classified as a
mesotrophic lake. A solid ecological foundation can achieve the utmost operation of
Temengor Reservoir. Improvement of in-depth research works studying the eco-
hydrological process of Temengor Reservoir would provide a basic tool necessary to
frame a better management, restoration and conservation programme.

1
CHAPTER 1
INTRODUCTION
1.1 General introduction
Limnology refers to the study of inland aquatic systems involving freshwater
ecosystems which include reservoirs, rivers, streams, ponds and wetlands. Basic
ecological study covers the physical, chemical, biological and geological
characteristics of an ecosystem. Comprehension on the complex reactions between
these basic attributes of inland waters is vital as they can be viewed as important
factors that will manage an ecosystem by providing and maintaining the available
conditions (Wetzel, 2001). In order to maintain the sustainability of a reservoir, basic
ecological information is necessary. Data regarding water quality and nutrient levels
are essential to develop a wise management plan.
A new aquatic ecosystem is developed due to the technology of dam
construction. Generally, when a dam is constructed, changes will occur resulting in
transformation of a free-flowing river ecosystem to a reservoir habitat (Wetzel, 1983;
Haas et al., 2010). Besides, it also causes the terrestrial habitat to turn into aquatic
and lotic habitat turns into lentic with significant hydrological changes such as water
flow, water volume and depth. Thus, the biodiversity of an aquatic system may be
altered due to changes in physical forces (Bunn and Arthington, 2002). Construction
of a dam also influences the local people who live surrounding the area especially in
terms of its social economic. It has numerous socio-economic benefits and in many
places, it has undoubtedly contributed to economic development.
In a tropical reservoir, water column is usually divided into two major zones
known as photic and aphotic (dark) zone. Photic zone is the layers that receive

2
enough light penetration to perform photosynthetic activity whereas aphotic zone is
the lower layers of water column that receive no light penetration (Lokman, 1992).
Therefore, planktonic microalgae from nutrient-rich deep water may be separated
due to stratification. Consequently, their ability to harvest light photosynthetically is
impaired.
Geographical location plays a major role in determining the limnological
character of lakes and reservoirs and it has been long recognized and well-
documented (Horne and Goldman, 1994; Jorgensen, 2005; Tranvik et al., 2009).
Generally, climate is divided into two main regions which are temperate and tropical
areas. Climatic conditions play major role in regulating the physical characteristics of
lakes in terms of light duration and intensity, wind activity and atmospheric
temperature (Sigee, 2005). A tropical lake shows several similar characteristics to
temperate lakes in summer. In tropical areas, seasonal climatic changes are reduced
and show seasonality in terms of rainfall (Jorgensen et al., 2005).
Geographically, Malaysia is located near the equator, 5º on the north side.
The average wind speed ranges from a high 8 m/s during Monsoon and a low 3 m/s
in between the Monsoon (Nor et al., 2014). Due to its geographical location,
Malaysia receives abundant of sunlight every year. Monsoon dominates the climate
of this country, also known as tropical wet and dry season marks the seasonal
differences. There are two main seasons in Malaysia which is wet and dry season
(Abd Hamid, 2012).
A shift in species abundance and composition of the flora and fauna is an
inevitable effect due to the impoundment of a water body (Agostinho et al., 1999).
The ecological characteristic of the reservoir is significantly influenced by the

3
sediment transport and deposition (Thornton et al., 1990). Sedimentation is enhanced
due to formation of a reservoir which will reduce the flow velocity (McCartney,
2009). According to Kimmel and Groeger (1986), unique characteristics of a dam
such as the ratio of the catchment area to surface area, nutrient loadings and high
sedimentation rate will cause the dam to experience degradation much faster than
natural lakes. This situation negatively affects the water body and its relationship
with other ecosystem.
Bathymetric study is vital to obtain better understanding on the impacts of
land processes on the hydrology of lakes. It is an integral part in ecohydrological
knowledge of surveying and charting bodies of water. Accelerated eutrophication
and sedimentation of inland water is now greatly discussed all over the world
(Setiawan, 2012). Application of remote sensing technique can provide spatial
distribution of water quality distribution
Vertical profiling studies could provide a sturdy tool in order to obtain a
better understanding of limnology and hydrogeochemical processes (Dodson, 2005).
One of the significantly important gradients for biological and chemical processes is
oxidation and reduction (Agostinho et al., 1999). A process which involves organic
materials breaking down in waterways, increase in water temperatures or night-time
respiration by dense algal blooms in nutrient-rich waters will eventually lead to
oxygen depletion ( ller et al., 2012).
Limnological study of the lentic systems in Malaysia had been carried out for
more than forty years (Ho, 1994). Inland water in Malaysia is governed by various
sectors (Sharip and Zakaria, 2008). Clean water is made sure to be provided as local
supply. Therefore, few agencies were established in the efforts to manage water

4
withdrawals. The enforcement of laws such as Environmental Quality Act 1974
(EQA), Environmental Quality (Prescribed Activities) (Environmental Impact
Assessment) Order 1987, Fisheries Act 1985 (Fisheries Maritime Regulations 1967;
Amended 1987 and Fisheries: Marine Culture System Regulation) and National
Forestry Act 1984 were implemented (Sharip and Zakaria, 2008).
There are many studies conducted by Malaysian scientist with interest to
conserving and sustaining the diversity of Malaysia freshwater habitats. Information
obtained from these research works is very important in determining the status and
quality of freshwater system (Chong et al., 2010; Lim et al., 2011; Shah et al., 2012;
Székely, 2012; Karim and Mansor, 2013; Bhuiyan et al., 2014; Wan Maznah and
Makhlough, 2014; Zakeyuddin et al., 2014).
Reservoirs in Malaysia were mainly built to meet the high demand of clean
water supply for domestic needs, irrigation and especially generation of hydroelectric
power (Ali, 1997; Ismail and Najib, 2011; Kamaruddin et al., 2011; Pillay and
Zullyadini, 2014). Lake Bera and Lake Chini located in Pahang are the only natural
lake in Malaysia, with Lake Bera studied intensively under the International
Biological Programme/Productivity of Freshwater Communities (IPB/PF) Program
(Sharip and Zakaria, 2008). Kenyir Lake is the largest man-made lake in Malaysia
with surface area of 37, 000 ha (Ho, 1994).
A number of studies in Temengor Reservoir were recorded over the recent
years. Most of the earliest researches were focused on aquatic pollution and water
quality, biodiversity of the reservoir as well as water resource development and
management (Ali, 1996; Grinang, 1998; Akhir, 1999). However, a number of studies
conducted mainly focused on the photic zone of the water body. One of the early

5
attempts of limnological study in Temengor Reservoir was done by Grinang (1998).
His work provided useful information on the use of aquatic insect as water quality
indicator at the catchment area in Temengor Reservoir.
1.2 The scope of the study
This study covered two parts; water quality and bathymetry at five sampling
stations. For water quality chapter, physical and chemical parameters at photic and
aphotic zone were measured. Bathymetric mapping of five stations was conducted to
determine the current maximum depths as comparison to previous study.
1.3 The importance of the study
Various works on the health quality of freshwater system were reported over
the recent years (Othman, 2009; Hashim et al., 2012; Karim and Mansor, 2013; Che
Salmah et al., 2014). With this in consideration, this study was conducted to
investigate the water quality status of Temengor Reservoir for better management
and monitoring plans. Information on the topography of Temengor Reservoir is
important in order to understand hydrological processes effects on biological and
chemical interactions. Therefore, benthic elevation of selected areas in this reservoir
could be provided as supportive baseline data for future studies related to bathymetry
and sedimentation. Knowing the current status of Temengor Reservoir especially the
lake floor will hence initiate a better and effective management plan to be designed
in order to govern its sustainability.

6
1.4 Objectives
This limnological study of Temengor Reservoir was conducted to obtain the
current status of the physico-chemical parameters of water column especially in the
aphotic zone and to gain new information such as the benthic elevation of the lake
floor.
Hence, the objectives of this study are as follows:
a) To determine the physical and chemical parameters at five sampling stations.
b) To identify the seasonal changes in physical and chemical parameters at five
sampling stations.
c) To map the bathymetry of five sampling stations.

7
CHAPTER 2
LITERATURE REVIEW
2.1 Reservoir characteristics
Reservoir is man-made water body which is formed by the construction of a
dam across a river or stream, resulting in the impoundment of the water behind the
dam structure whereas lakes occurred naturally which was over geologic time.
(Wetzel, 2001). Nevertheless, both lakes and reservoirs experience processes such as
exchange of gas across the air-water interface, predator-prey interaction, primary
production and internal mixing (Thornton et al., 1990).
Reservoirs range in size from pond-like to large lakes, and share some
characteristics with natural lakes. Generally, all reservoirs are governed for water
quality requirements concerning to a variety of human uses. A thorough
understanding of the physical, chemical and biological interactions acting within the
system is essential for a detailed analysis (Kopp et al., 2009).
Determination of lake and reservoir’s shape and structure is based on how
they are formed. Both systems undergo distinct physical, biological and chemical
process in terms of the interactions of the biotic and abiotic components. In contrast
to natural lakes, reservoirs and the dams that impound them are engineered system
operated to meet specific needs (Van Looy et al., 2014).
In order to meet specific uses, an engineered system of reservoirs and
impounding dam is designed. As a reliable water supply, reservoir is important in
providing water to meet a spectrum of economic, social and environmental needs
(Kennedy and Walker, 1990). Reservoirs which play important role in the economy
8
of many nations require great management and protection plan as they are prone to
the impacts of loadings of silt, nutrients and organic matter (Cooke et al., 2005).
With today’s advanced and improved technology, reservoirs are built for
different purposes such as generating hydroelectric power, irrigation and as part of
transportation to name a few (Mekonnen and Hoekstra, 2010; Raje and Mujumdar,
2010; Rangel et al., 2012). According to Sharip and Zakaria (2008), in addition to
functioning as storage basins for domestic and industrial water supply, some
reservoirs were constructed to control flood by acting as a buffer to regulate different
flow during dry and wet season. Besides that, lakes and reservoirs also uphold
important ecosystem that harbours biodiversity of rare, endemic and endangered
species.
Connections between the requirement to construct a reservoir at a location
and the manner in which they are effectively operated provide insight to their
limnological character. Understanding these connections provides an improved
knowledge of reservoir limnology and proposes the means to develop and implement
efficient management strategies (Kennedy, 1999). Limnological approach to study
the characteristics of a reservoir is usually similar to analysis conducted for natural
lakes (Thornton, 1990).
According to Jorgensen et al. (2005), a reservoir is generally similar and as
important as natural lake. Findings obtained from studies on reservoir would usually
be explained in such of a lake manner. Structures and functions of a lentic ecosystem
are greatly discussed in various studies such as Limnology (Wetzel, 1983),
Restoration and Management of Lakes and Reservoirs (Cooke et al., 2005), Lake and
Reservoir Management (Jorgensen et al., 2005) and Lake Ecosystem Ecology

9
(Likens, 2010). Internal process such as water mixing, change of gas at the surface
and exchange of heat through the trophic level occurred in both lake and reservoir
ecosystem were discussed in these writings.
2.2 Reservoir zonation
Lake and river ecosystem is generally differentiated by its habitat based on
the movement of water flow (Goldman and Horne, 1983). Lake ecosystem is lentic
where there is relatively no water flow or stagnant and the physical, chemical and
biological characteristics are low in variation. On the other hand, for river ecosystem,
these characteristics will fluctuate due to the movement of water or also known as
lotic habitat (Sigee, 2005). Identification of reservoir zonation is of great practical
importance to design an efficient plan for reservoir managing and utilization.
Different zone shows different sensitivity to eutrophication. Accordingly, a specific
methodology and standards for nutrient assessment should be constructed for each
zone respectively (Shao et al., 2010).
Lake is divided vertically into three major zones depending upon the amount
of light penetrating through; littoral zone, limnetic zone and aphotic or profundal
zone (Figure 2.1). The littoral zone refers to the area closest to the shore. Shallow
water in littoral zone allows light penetration to the sediments. Therefore, this area is
characterized by the presence of beds of submerged and emergent macrophytes
vegetation that are able to survive strong wave action. In addition, littoral zone has a
rich microbial community and high biological diversity with large numbers of
aquatic organisms (Sigee, 2005; Sorf and Devetter, 2011).

10
Figure 2.1 Definite zones which are determined by the distance from shore gradients
and depth in reservoir (Sigee, 2005).

11
Limnetic zone is the area that has limited light penetration and receives no
influence from the shore. Free-floating organisms such as plankton dominated this
zone where it comprises of a vertical water column with an air-water interface at the
top and lake sediments at the bottom. The water column is closely related to the
sediment in terms of nutrient cycling and interchange of aquatic populations. The
primary producer in this ecosystem is planktonic algae (Sigee, 2005). As one
descends deeper in the limnetic zone, the amount of light penetration decreases until
a depth is reached where photosynthetic gain is equal to respiratory loss, also known
as light compensation level. Bacteria are particularly important in sediments that
receive no light (aphotic zone) and no oxygen (anoxic) in the limnetic zone (Sazak
and Sahin, 2012).
Aphotic or the profundal zone is the water zone beyond the layers receiving
effective light penetration, thereby it accepts insufficient or no amount of light to
carry out photosynthesis. Besides that, level of dissolved oxygen in this zone is low
also has low dissolved oxygen content (Agrawal, 1999). A large population of
bacteria and fungi dominated this zone where decomposers break down the organic
matter subsided from top layer of water column and subsequently releasing inorganic
nutrients for recycling. This zone has negative net photosynthesis or negligible total
photosynthesis due to no light penetration (Likens, 2010).
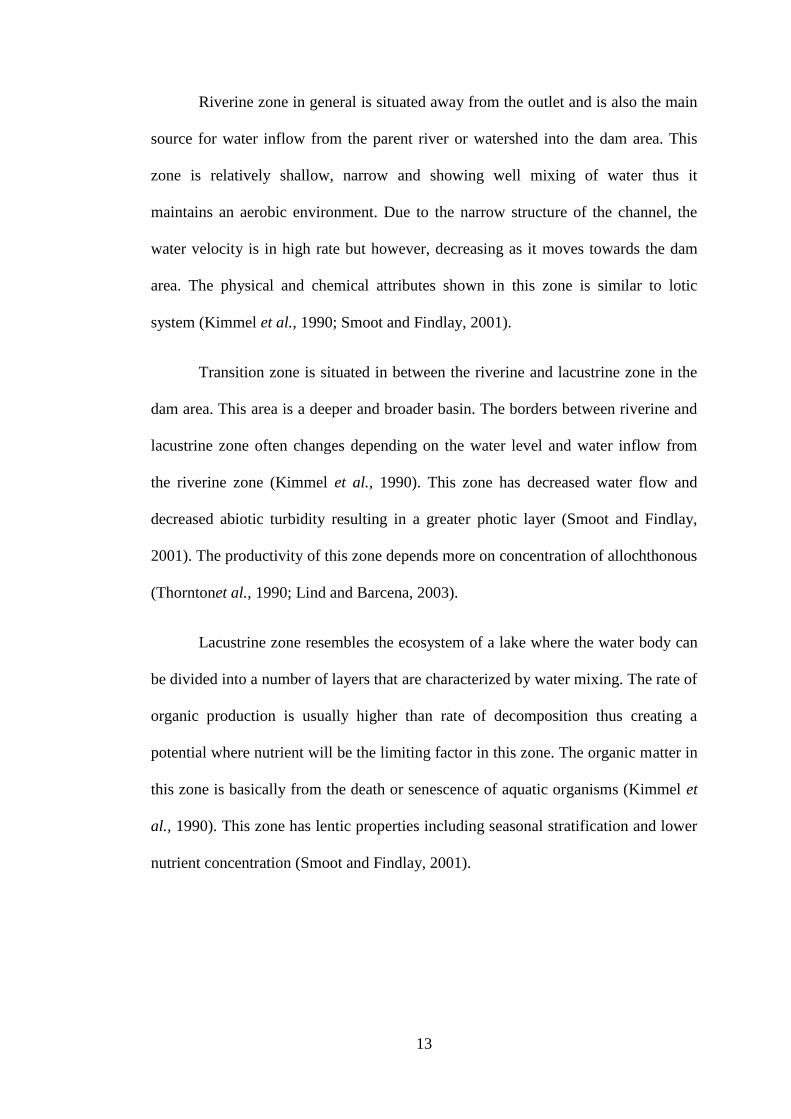
Dam areas are usually explained in three zones based on a longitudinal cross
section from the water source that flows into dam structure known as the lacustrine
zone which resembles the lentic habitat, riverine zone which resembles the river
ecosystem and transition zone (Figure 2.2) (Thornton et al., 1990). All these three
zones have unique physical, chemical and physical characteristics that differentiate
the limnology of a dam from one another (Ford, 1990; Wang et al., 2011).

12
Figure 2.2 Longitudinal cross section view showing three distinct zones defined by
the slope of a dam (Thornton et al., 1990).
13
Riverine zone in general is situated away from the outlet and is also the main
source for water inflow from the parent river or watershed into the dam area. This
zone is relatively shallow, narrow and showing well mixing of water thus it
maintains an aerobic environment. Due to the narrow structure of the channel, the
water velocity is in high rate but however, decreasing as it moves towards the dam
area. The physical and chemical attributes shown in this zone is similar to lotic
system (Kimmel et al., 1990; Smoot and Findlay, 2001).
Transition zone is situated in between the riverine and lacustrine zone in the
dam area. This area is a deeper and broader basin. The borders between riverine and
lacustrine zone often changes depending on the water level and water inflow from
the riverine zone (Kimmel et al., 1990). This zone has decreased water flow and
decreased abiotic turbidity resulting in a greater photic layer (Smoot and Findlay,
2001). The productivity of this zone depends more on concentration of allochthonous
(Thorntonet al., 1990; Lind and Barcena, 2003).
Lacustrine zone resembles the ecosystem of a lake where the water body can
be divided into a number of layers that are characterized by water mixing. The rate of
organic production is usually higher than rate of decomposition thus creating a
potential where nutrient will be the limiting factor in this zone. The organic matter in
this zone is basically from the death or senescence of aquatic organisms (Kimmel et
al., 1990). This zone has lentic properties including seasonal stratification and lower
nutrient concentration (Smoot and Findlay, 2001).

14
2.2.1 Lentic physical structure
Lentic ecosystem is generally divided into three layers which are epilimnion,
metalimnion and hypolimnion (Figure 2.3) due to stratification (Payne, 1986). It is
created due to temperature-density differences (Boulton et al., 2014). The layers are
situated in the limnetic zone and created due to temperature fluctuations influenced
by water movement and heat distribution (Goldman and Horne, 1983). Heat
exchange from the atmosphere to the water body causes the imbalance of
temperature distribution, where the temperature will be high in the upper layer of
water column and the values decrease with depth. Therefore, warmer water column
which are less in density will be on the surface and higher density colder water
column will be below it. Changes in temperature will cause density differences hence
influencing the physical process in standing water (Boulton et al., 2014). The thermal
stratification dictates a control on the vertical fluxes due to partitions in the water
column (Yeates and Imberger, 2003).
Epilimnion is characterized by warmer and less in density water column with
essentially uniformed temperature. In many lakes, the growth of phytoplankton
mainly occurs in this area as it receives enough light penetration for photosynthetic
activity. Consequently, this leads to severe nutrient depletion and limited
replenishment from the hypolimnion.
Metalimnion exists between these two layers and is characterized by the rate
of sudden change in water temperature with depth. The sudden decrease in water
temperature creates a slope that shows a slant in a vertical profiling of water
temperature. Metalimnion, a also known as thermocline acts to separate the warmer
and colder water column. According to (Wetzel, 1983), thermocline exists where
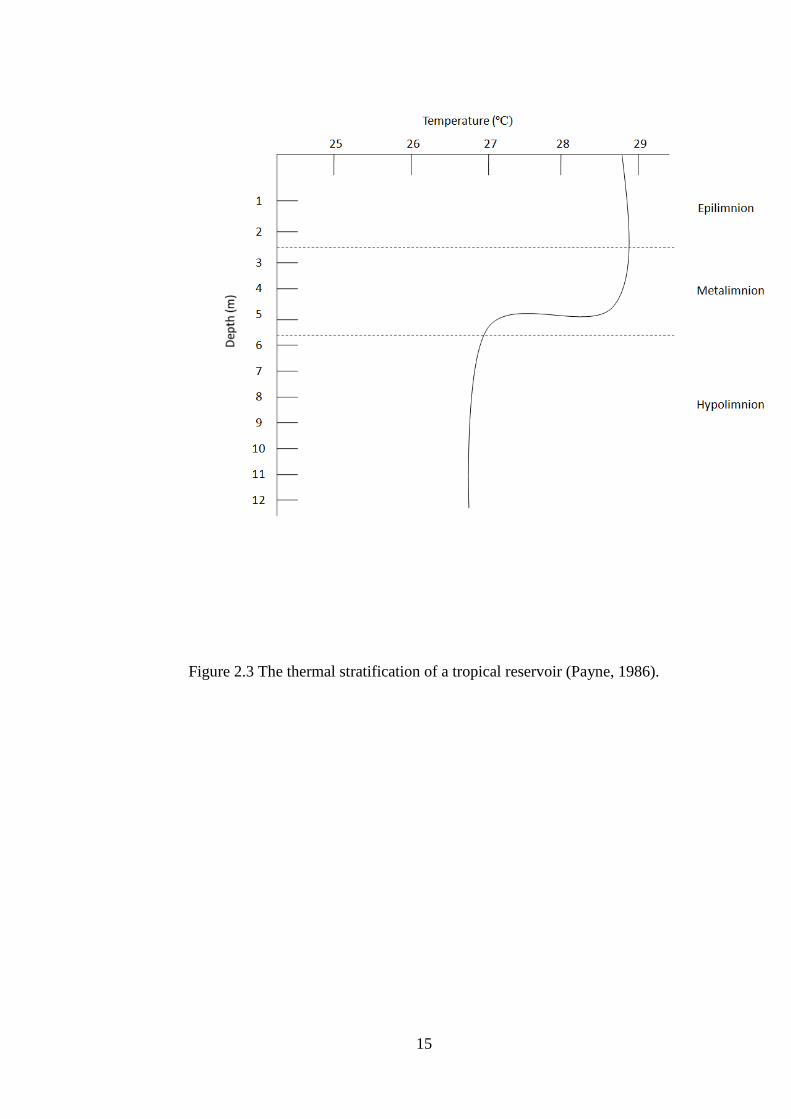
15
Figure 2.3 The thermal stratification of a tropical reservoir (Payne, 1986).

16
there the temperature change is more than 1ºC in every 1 m depth of water column.
Thermocline functions as a physicochemical barrier to water circulation and nutrients
passage and reduces the exchange of oxygen between surface and deep water
(Wetzel and Likens, 1991).
Hypolimnion is situated near the bottom layer of water column and has colder
water and is more densed. The dissolved oxygen level decrease in the deeper depths
of water column (Henry, 1999). Decomposition of organic material such as dead
phytoplankton that sinked through metalimnion usually occurred at this part of water
column. Thus, it is usually cold and photosynthetic production is minimal (Sigee,
2005).
Freshwater ecosystem is frequently altered to due to climatic changes
(Brooks et al., 2011). World climate changes based on latitudes as well as solar
radiation which are highly correlated to latitude and also one of the main factors that
control the changes in physical, chemical and biological process in water body (Eum
and Simonovic, 2010). Therefore, varieties of patterns in temperature change
vertically and pattern of water mixing according to latitudes. According to Lewis
(1987), this is important as the different temperature of water mass, mixing and
chemical alteration will influence the competency of habitats to tolerate temperature
for the survival of aquatic organisms. The importance of climate and geomorphology
which has influence on the limnology and geochemical characteristics in a reservoir
is well discussed in previous studies (Dodson, 2005; Mwaura, 2010; Ashraf et al.,
2012).
Generally, climate is divided into two main areas which are temperate and
tropical. Tropical areas which are located near the equator are differentiated by

17
having high humidity and rainy seasons, temperature which is high and stable
relatively and small change of season. On the other hand, the characteristics of a
temperate area are rotation of four seasons and obvious temperature change between
the seasons. Variance in temperature in different season generated by solar radiation
is considered as the main factor controlling biotic and abiotic interactions in an
aquatic ecosystem (Thornton et al., 1990). Seasonal fluctuations in mean
temperature, hydrology, nutrient delivery, utilization and retention have significant
impacts for nutrient management (Bukaveckas and Isenberg, 2013) and considered as
most important variables which determine plankton abundance (Offem et al., 2011).
In a tropical area, light intensity and period of solar radiation increase during
dry season. Light wavelength that is not reflected will be absorbed by water surface
until a known depth and spread in the form of heat (Sanderson and Taylor, 2003).
Some of the solar energy will also be absorbed by algae and other suspended
particles (Reynolds, 1984). Light intensity decreases exponentially with depth. Water
surface will be warmer and low in density due to the absorption of the light. Water
layers that do not receive solar radiation will have higher temperature and more
dense which stay at the bottom of the water body (Sigee, 2005).
Characteristics explained will change in temperate area based on the amount
of solar radiation received (Wetzel, 1983). For tropical areas, stratification is stable
due to high solar radiation all year except for ecosystem that is located on a higher
altitude (Lewis, 1996). Besides absorption of the solar energy, stratification also
occurs due to thermal conduction or diffusion, turbulent thermal conduction and
inflow and outflow thermal transfer from the system (Ford, 1990; Boehrer and
Schultze, 2008).

18
Dissolved oxygen is an important element that involves in chemical and
biological reactions in aquatic environment (Goldman and Horne, 1983). Water
quality of a dam usually depends on dissolved oxygen as the existence of this
element will be the catalyst to degradation process that occurs in water. The
concentration of dissolved oxygen in aquatic system presumably indicates more
about their metabolism than any other assessment (Rankovic et al., 2010).
The distribution of dissolved oxygen in a water column is influenced by a few
factors which are temperature, current, morphology of a dam, wind movement,
photosynthesis and respiration (Cole and Hannan, 1990). Photosynthesis process
which is carried out by phytoplankton is enhanced at euphotic zone due to higher
light intensity thus contributes to a higher oxygen concentration as compared to the
aphotic zone which received limited light penetration (Lokman, 1992).
Additionally, wet and dry seasons also influence the distribution of dissolved
oxygen. In a study conducted by Uzoukwu et al. (2004), it was stated that dissolved
oxygen levels were higher in wet season as compared to dry season. Catchment areas
that receive heavy rainfall would cause strong water turbulence and therefore affects
the concentration of dissolved oxygen. Generally, most water body in tropical areas
have lower dissolved oxygen level due to a higher concentration of organic
components as compared to temperate areas (Dudgeon, 2008).
2.3 Nutrient dynamics
Both natural lake and reservoirs receive extensive quantity of organic matter
(Forbes et al., 2012). Quantity and quality of external nutrient loadings mainly
regulate the water quality and productivity of a reservoir (Kennedy and Walker,
1990). Nutrients are elements which are consumed by plants and animals for

19
metabolism process and highly influence the primary production of a water body
(Goldman and Home, 1983). Nutrients such as ammonium, nitrite, nitrate and
orthophosphate exist in water column as inorganic nutrients which are elements that
can be dissolved (Qualls, 2000).
Inflow of nutrients to water is divided into two; either naturally from the
ground or as a result of human activities. Additionally, other nonpoint sources such
as pollution, agricultural activity, urban runoff and wastewater also contribute to the
enhancement of nutrients contents in the water body. An increase in the nutrient
input would boost lake productivity leaving detrimental impacts to other trophic
levels (Wan Maznah, 2002; Søndergaard et al., 2003). Phosphorus and nitrogen are
the most important nutrients prior to eutrophication (Smith, 2003).
Eutrophication is a phenomenon of nutrient enrichment over time and is
considered as an aquatic ecosystems response to nutrient loading, which can cause
naturally or accelerated by human factors. Natural eutrophication is the process by
which lakes gradually become aged and more productive, whereas excess nutrients
from human activities are called “cultural eutrophication” (Sheela et al., 2011).
Enhancement of nutrient availability would augment the growth of phytoplankton.
Consequently, water turbidity will increase which then impoverish the light condition
(Balali et al., 2013).
Tropical systems are more sensitive to eutrophication than temperate systems,
given the higher propensity to hypoxia in the deeper depths, therefore making it
essential to exercise stricter control of nutrient loads (Rangel et al., 2012).
Accordingly, these changes contribute to the loss of aquatic animals such as fish kills
due to irregular oxygen content and high content of toxic compound (Hart et al.,
20
2002). Eutrophication is a serious problem since it contributes to environmental
problems world-wide as the status of eutrophication is more than 60% in Malaysia
(Malek et al., 2011). The enhancement of nitrite and nitrate concentration in an
aquatic ecosystem will influence the water quality. Impacts such as toxic algal
bloom, death of phytoplankton and other aquatic wildlife, promoting the
decomposition process by the microbes, occurrence of objectionable taste and odour
events and the decrease in dissolved oxygen level will lead to diseases and fish kill
(Shanmugam et al., 2007; Jeppesen et al., 2012).
2.3.1 Phosphorus
Phosphorus is unique compared to nitrogen due to its cycle in water which
does not involve any oxidation process but remains permanent in P-O form both
organic and inorganic in particles or dissolved phase. It can be found in soil, water
and sediments in the form of chemical compound and is identified as a limiting
factor nutrient for algal growth in lakes and reservoirs (Hanrahan et al., 2002; Carey
and Rydin, 2011).
Bostrom et al. (1988) explained few forms of phosphorus that exist in water.
Phosphorus in particle phase includes live and dead plankton, condensed phosphate,
absorbed phosphorus in suspended particles and amorphous phosphorus. Dissolved
phosphorus is divided into organic and inorganic phosphorus. Phosphorus found in
natural water is usually in form of (PO43-
). Some dissolved phosphorus is restored to
the surface layers when aquatic organisms die and sink to the bottom through
upwelling and some are buried in sediments (Round, 1981; Krohne, 2001).
Phosphate is among the nutrients that influence the productivity of a lentic
body. Orthophosphate is the main component of phosphate that influences lake

21
productivity. It is the only form of phosphorus that can be used up directly by
planktonic algae and bacteria (Smith, 2003) and easily assimilated to organic
phosphate and other living cellular organism component (Sigee, 2005).
Generally, nutrient cycles in an aquatic system involve exchange activity of
organic and inorganic materials back to the production of living matter. In a lentic
system, nutrient flux between the areas will create a vertical and horizontal profiling
of nutrient species (Kennedy and Walker, 1990). Temperature and concentration of
dissolved oxygen are among the main factors that influence nutrients in few phases
of nutrient cycles. These biotic factors will give a vertical profiling of nutrient
concentration in a lentic system for both shallow and deep water.
2.3.2 Nitrogen
Nitrogen makes up about 78% of atmospheric gas (Krohne, 2001). Nitrogen
in water exist in few forms which are dissolved gaseous molecules (N2), inorganic
ammonia ion (NH4+), nitrate (NO3
-) and nitrite (NO2
-), as well as organic nitrogen
element (Riley et al., 2001). Ammonia and nitrate are the elements used up by plant
for biological process. Nitrate however is a vital element for growth consumed by
aquatic plants especially algae (Pidwirny, 2006).
Assimilation from aquatic plants and mineralisation from bacteria species
towards existing nitrogen component are part of the cycles that will determine the
composition of nitrogen found in water column. Decomposition process carried out
by the heterotrophic bacteria and nitrogen gas accumulation by bacteria species will
release ammonia. Nitrification process that used up oxygen carried out by microbes
will oxidize ammonia to nitrate. This process is important to control the form of
nitrogen in a lake or dam ecosystem. (Qualls, 2000; Pidwirny, 2006; Moss, 2008).

22
On the other hand, denitrification process will change nitrate to gas and loss of this
important nutrient for lake productivity will be balanced by accumulation of
nitrogen. Nitrosomonas and Nitrosospira are the best-known aerobic ammonia
oxidizers and Nitrobacter and Nitrospira are well known nitrite oxidizers (Sliekers et
al., 2002).
2.3.3 Chlorophyll a
Chlorophyll a is the major photosynthetic pigment in a lot of phytoplankton
in an aquatic system. Chlorophyll a is frequently used as an indicator of algal
blooms. High algal growth in a reservoir indicates high lake productivity. An
increase in Chlorophyll a concentration indicates eutrophication in lakes,
subsequently associated with low biodiversity and therefore deprives the aquatic
environment of sufficient ecosystem services. Chlorophyll a is considered one of the
main factors that contribute to turbidity in aquatic ecosystem (Ndungu et al., 2013).
2.4 Lake trophic state
Lakes can be classified into three states based on the available nutrients
which will determine the lake fertility. More nutrients are found in more fertile lakes
and therefore more plants and algae. A eutrophic lake is a well-nourished lake with
high nutrients and high plant growth. Oxygen is low in a eutrophic lake since it has
so much biomass. On the other hand, an oligotrophic lake has low nutrient contents
and low plant growth. In an oligotrophic lake, high level of oxygen is found at
surface layer. Mesotrophic lakes behave differently than oligotrophic lakes in that
they stratify especially in tropical areas. In addition, it also has medium amount of
nutrient content (Lee et al., 1995; Cako et al., 2013) (Appendix A).

23
2.5 Bathymetric study
A detailed knowledge of wide scale distribution patterns of population,
communities and habitats of the seafloor is fundamental for impact assessment,
conservation and studies of ecological patterns and processes (Sandwell and Smith,
1999; Hewitt et al., 2004). In many lakes, bottom sediments consist of materials from
precipitation of chemical and biological processes.
According to Golterman et al. (1983), characteristics of sediment may differ
slightly under various climatic conditions but however may be used on a worldwide
basis. Determination of component concentrations in bed sediments is a broadly used
approach to monitor and assess contaminant distributions in streams (Feltz, 1980;
Groot et al., 1982).
Prior to having a better knowledge on the effects of land processes on the
hydrology of lakes and to obtain a clearer indication of environmental changes, the
information on multitemporal bathymetric on lakes is essentially needed. In
hydrology and sediment studies, lake morphometry parameters gives beneficial
information to determine lake life expectancy, residence time, water balance and
sedimentation rate (Yesuf et al., 2013).
The topography of lake surface area and morphometrical parameters are
discussed in various studies such as Moreno and Garcia-Berthou (1989), Lawniczak
et al. (2011) and Zhang et al. (2011). According to Sharif and Mahmud (1995), the
slow production of different types of hydrographic surveying products in Malaysia is
due several reasons such as lack of skilled and qualified organization, the application
of aged method and unsophisticated equipment as well as shortage of appropriate
hydrographic surveying coaching.

24
CHAPTER 3
MATERIALS AND METHODS
3.1 Study site
Temengor Reservoir is situated in the north of West Malaysia between N
05º32.595’, E101º20.454’ and 263 m above sea level. It is the second largest man-
made lake after Tasik Kenyir as it covers approximately 15,200 ha of area. This
reservoir was created by the impoundment of a dam to store water and generate
hydroelectric power.
This study site is situated on the upper elevation of Sungai Perak and
surrounded by pristine tropical forest that harbours variety of endemic and rare
species of flora and fauna. The maximum depth of Temengor Reservoir was recorded
to be 90 metre deep. In addition to generating hydroelectric power, the reservoir
supplies water to nearby human settlement, as well as playing a major role in flood
control.
The main inflows of the reservoir are from three water catchment area known
as Belum Reserve Forest (134, 167 ha), Grik Reserve Forest (37, 220 ha) and
Temengor Reserve Forest (148, 870 ha) which received an average annual rainfall of
more than 2000 mm (Davidson et al., 1995). Sungai Kejar, Sungai Sara, Sungai
Singor and Sungai Tiang are several of the rivers flowing into the reservoir.