a Light-Duty Diesel Aftertreatment System Published ... - … · fuels are potential poisons for...
14
ABSTRACT Alkali and alkaline earth metal impurities found in diesel fuels are potential poisons for diesel exhaust catalysts. Using an accelerated aging procedure, a set of production exhaust systems from a 2011 Ford F250 equipped with a 6.7L diesel engine have been aged to an equivalent of 150,000 miles of thermal aging and metal exposure. These exhaust systems included a diesel oxidation catalyst (DOC), selective catalytic reduction (SCR) catalyst, and diesel particulate filter (DPF). Four separate exhaust systems were aged, each with a different fuel: ULSD containing no measureable metals, B20 containing sodium, B20 containing potassium and B20 containing calcium. Metals levels were selected to simulate the maximum allowable levels in B100 according to the ASTM D6751 standard. Analysis of the aged catalysts included Federal Test Procedure emissions testing with the systems installed on a Ford F250 pickup, bench flow reactor testing of catalyst cores, and electron probe microanalysis (EPMA). The thermo-mechanical properties of the aged DPFs were also measured. EPMA imaging of aged catalyst parts found that both the Na and K penetrated into the washcoat of the DOC and SCR catalysts, while Ca remained on the surface of the washcoat. Bench flow reactor experiments were used to measure the standard NOx conversion, NH 3 storage and NH 3 oxidation for each of the aged SCR catalysts. Flow reactor results showed that the first inch of the SCR catalysts exposed to Na and K had reduced NOx conversion through a range of temperatures and also had reduced NH 3 storage capacity. The SCR catalyst exposed to Ca had similar NOx conversion and NH 3 storage performance compared to the catalyst aged with ULSD. Using a chassis dynamometer, vehicle emissions tests were conducted with each of the aged catalyst systems installed onto a Ford F250 pickup. Regardless of the evidence of catalyst deactivation seen in flow reactor experiments and EPMA imaging, the vehicle successfully passed the 0.2 gram/ mile NOx emission standard with each of the four aged exhaust systems. This indicates that total catalyst volume is adequate to accommodate the catalyst activity loss observed in the flow reactor experiments. INTRODUCTION Biodiesel can be made from various renewable sources such as vegetable oil, animal fat, or waste cooking oil. It is produced through transesterification of the oil or fat with methanol, resulting in mono-alkyl esters and the co-product glycerin. The process occurs in the presence of a catalyst, Impact of Fuel Metal Impurities on the Durability of a Light-Duty Diesel Aftertreatment System 2013-01-0513 Published 04/08/2013 Aaron Williams, Jonathan Burton and Robert L. McCormick National Renewable Energy Laboratory Todd Toops, Andrew A. Wereszczak, Ethan E. Fox and Michael J. Lance Oak Ridge National Laboratory Giovanni Cavataio, Douglas Dobson and Jim Warner Ford Motor Co Rasto Brezny Manufacturers of Emission Controls Assoc K. Nguyen and D. William Brookshear University of Tennessee - Knoxville doi: 10.4271/2013-01-0513 NREL/CP-5400-57585. Posted with permission. Presented at the SAE 2013 World Congress and Exhibition
Transcript of a Light-Duty Diesel Aftertreatment System Published ... - … · fuels are potential poisons for...

ABSTRACTAlkali and alkaline earth metal impurities found in dieselfuels are potential poisons for diesel exhaust catalysts. Usingan accelerated aging procedure, a set of production exhaustsystems from a 2011 Ford F250 equipped with a 6.7L dieselengine have been aged to an equivalent of 150,000 miles ofthermal aging and metal exposure. These exhaust systemsincluded a diesel oxidation catalyst (DOC), selective catalyticreduction (SCR) catalyst, and diesel particulate filter (DPF).Four separate exhaust systems were aged, each with adifferent fuel: ULSD containing no measureable metals, B20containing sodium, B20 containing potassium and B20containing calcium. Metals levels were selected to simulatethe maximum allowable levels in B100 according to theASTM D6751 standard. Analysis of the aged catalystsincluded Federal Test Procedure emissions testing with thesystems installed on a Ford F250 pickup, bench flow reactortesting of catalyst cores, and electron probe microanalysis(EPMA). The thermo-mechanical properties of the agedDPFs were also measured.
EPMA imaging of aged catalyst parts found that both the Naand K penetrated into the washcoat of the DOC and SCRcatalysts, while Ca remained on the surface of the washcoat.
Bench flow reactor experiments were used to measure thestandard NOx conversion, NH3 storage and NH3 oxidationfor each of the aged SCR catalysts. Flow reactor resultsshowed that the first inch of the SCR catalysts exposed to Naand K had reduced NOx conversion through a range oftemperatures and also had reduced NH3 storage capacity. TheSCR catalyst exposed to Ca had similar NOx conversion andNH3 storage performance compared to the catalyst aged withULSD. Using a chassis dynamometer, vehicle emissions testswere conducted with each of the aged catalyst systemsinstalled onto a Ford F250 pickup. Regardless of the evidenceof catalyst deactivation seen in flow reactor experiments andEPMA imaging, the vehicle successfully passed the 0.2 gram/mile NOx emission standard with each of the four agedexhaust systems. This indicates that total catalyst volume isadequate to accommodate the catalyst activity loss observedin the flow reactor experiments.
INTRODUCTIONBiodiesel can be made from various renewable sources suchas vegetable oil, animal fat, or waste cooking oil. It isproduced through transesterification of the oil or fat withmethanol, resulting in mono-alkyl esters and the co-productglycerin. The process occurs in the presence of a catalyst,
Impact of Fuel Metal Impurities on the Durability ofa Light-Duty Diesel Aftertreatment System
2013-01-0513Published
04/08/2013
Aaron Williams, Jonathan Burton and Robert L. McCormickNational Renewable Energy Laboratory
Todd Toops, Andrew A. Wereszczak, Ethan E. Fox and Michael J. LanceOak Ridge National Laboratory
Giovanni Cavataio, Douglas Dobson and Jim WarnerFord Motor Co
Rasto BreznyManufacturers of Emission Controls Assoc
K. Nguyen and D. William BrookshearUniversity of Tennessee - Knoxville
doi:10.4271/2013-01-0513
NREL/CP-5400-57585. Posted with permission. Presented at the SAE 2013 World Congress and Exhibition
rweisbru
Rectangle

typically sodium hydroxide or potassium hydroxide [1].Following transesterification and separation of the glycerin,the biodiesel must be purified by extraction of the impuritiesinto water or other means. In this process, residual amountsof sodium (Na) or potassium (K) from the catalyst can be leftbehind. In addition, small amounts of calcium (Ca) ormagnesium (Mg) can be added to the fuel from thepurification process [2,3]. Na and Ca may also be present inconventional diesel fuel and have been implicated in internalinjector deposits [4,5]. Regardless of the source, thesemetallic fuel contaminants are converted to oxides, sulfates,hydroxides or carbonates in the combustion process to forman inorganic ash that can be deposited onto the exhaustemission control devices found in modern diesel engines.Alkali metals are well known poisons for catalysts and havebeen shown to negatively impact the mechanical properties ofceramic substrates [6,7]. Furthermore, alkali metalhydroxides such as Na and K are volatilized in the presenceof steam and can, therefore, penetrate the catalyst washcoator substrate. Early results showed no negative short-termimpact of biodiesel on the performance of emission controlsystem components [8,9,10,11]. Here, we examine long-termimpacts with a focus on the effects of residual metals.
Phase I StudyIn 2011, a study led by the National Renewable EnergyLaboratory (NREL) investigated the impact of these alkaliand alkaline earth metals on the durability of catalysts in aheavy-duty diesel application [12]. This study used anaccelerated aging method to expose catalysts to theequivalent of 435,000 miles of fuel metal and thermalexposure. The aftertreatment system consisted of a dieseloxidation catalyst (DOC), diesel particulate filter (DPF), anda selective catalytic reduction (SCR) catalyst placed at theend. Several key findings in this study created the motivationfor further research, which is the purpose of the workdescribed in this paper. This previous study found that acordierite DPF exposed to the equivalent of 435,000 milesthrough accelerated aging with Na, K and Ca in the fuelexperienced a 69% decrease in thermal shock resistance,relative to a system aged with no metals in the fuel. Thisstudy also found that the DOC exposed to the equivalent of150,000 miles with fuel containing metals experienced a lossof catalytic activity for hydrocarbons (HC) and NO oxidationwhen compared with a catalyst aged with no metals. Thestudy showed that an SCR catalyst aged to 435,000 mileswith fuel containing metals showed a slight loss in NOxconversion when compared with one aged with no metals.
This first phase of work studied a typical heavy-dutyconfiguration where the SCR catalyst is placed downstreamof the DPF. However, a light-duty system typically places theSCR catalyst upstream of the DPF where it would experiencemore exposure to metals and high DPF regenerationtemperatures. While the U.S. Environmental ProtectionAgency's “full useful life” requirement is much shorter for a
light-duty application, the system configuration couldpotentially represent a worst-case scenario for durability. Thepurpose of the work presented in this paper is to investigatethis possibility.
TEST METHODSCatalyst AgingThe exhaust catalysts selected for accelerated aging studieswere from a production 2011 Ford F250 pickup equippedwith a 6.7L diesel engine. These systems included a DOC,SCR, and a DPF. The DOC consisted of two bricks mountedin series with a total volume of 4.35 L. The SCR systemincluded a pair of Cu/zeolite bricks mounted in series with atotal volume of 9.88 L. The DPF was a catalyzed SiCsubstrate and had a total volume of 8.2 L. Further catalystdetails are listed in Table 1. Four OEM exhaust systems werepurchased from a local dealership to be used for acceleratedaging. Each system was instrumented for temperature andpressure measurements and for exhaust sampling. Thesesystems, as purchased from the dealership, were welded fromend to end with no access to the individual catalyst bricks.Therefore, the DPF section was cut and flanged from the restof the exhaust to allow for weighing of the DPF to quantifyash loading. A schematic of the exhaust system is shown inFigure 1.
Table 1. Catalyst Specification
Figure 1. Schematic of exhaust system
For accelerated aging, these full exhaust systems were placedonto an accelerated aging platform that was described in thePhase 1 study [12]. The accelerated aging platform consistedof a Caterpillar 2008 C9 ACERT engine. This is an 8.8L,300-hp engine calibrated to meet the Tier III off-roademissions limit. The engine is turbocharged and directinjected and does not use an exhaust catalyst in its baseconfiguration. By retrofitting the engine with exhaustemission controls, it served as a platform for exposingvarious catalysts and filters to biodiesel exhaust gas. The
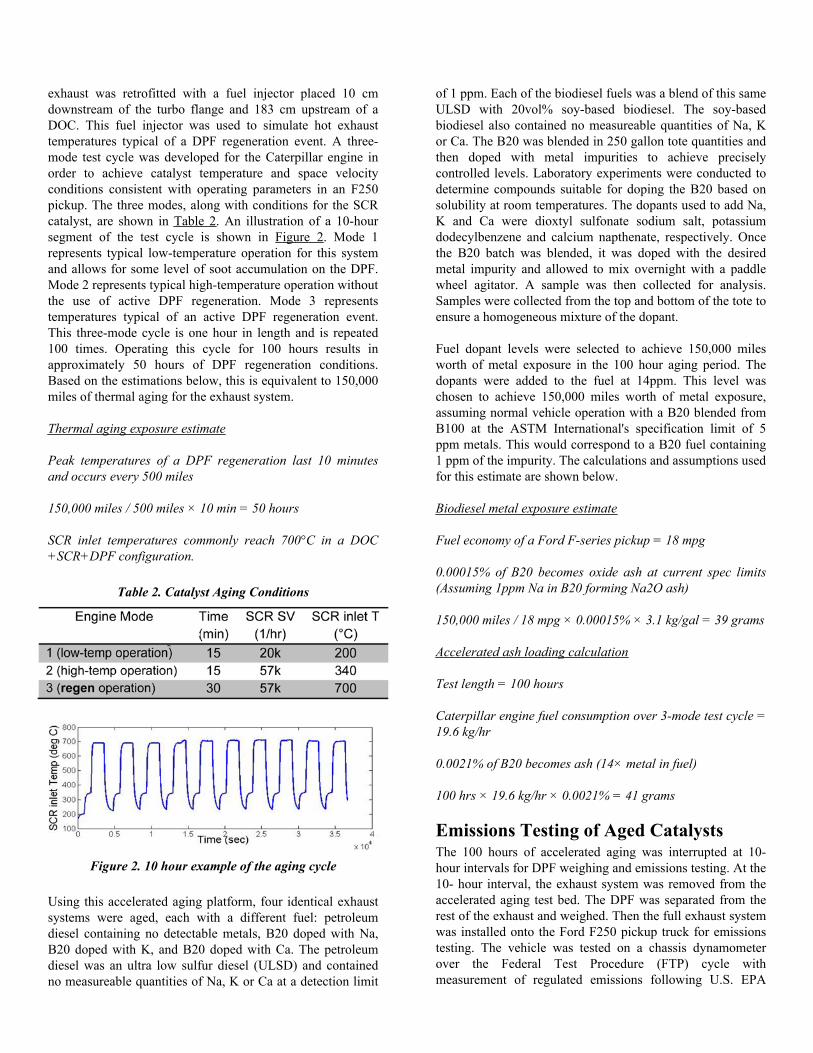
exhaust was retrofitted with a fuel injector placed 10 cmdownstream of the turbo flange and 183 cm upstream of aDOC. This fuel injector was used to simulate hot exhausttemperatures typical of a DPF regeneration event. A three-mode test cycle was developed for the Caterpillar engine inorder to achieve catalyst temperature and space velocityconditions consistent with operating parameters in an F250pickup. The three modes, along with conditions for the SCRcatalyst, are shown in Table 2. An illustration of a 10-hoursegment of the test cycle is shown in Figure 2. Mode 1represents typical low-temperature operation for this systemand allows for some level of soot accumulation on the DPF.Mode 2 represents typical high-temperature operation withoutthe use of active DPF regeneration. Mode 3 representstemperatures typical of an active DPF regeneration event.This three-mode cycle is one hour in length and is repeated100 times. Operating this cycle for 100 hours results inapproximately 50 hours of DPF regeneration conditions.Based on the estimations below, this is equivalent to 150,000miles of thermal aging for the exhaust system.
Thermal aging exposure estimate
Peak temperatures of a DPF regeneration last 10 minutesand occurs every 500 miles
150,000 miles / 500 miles × 10 min = 50 hours
SCR inlet temperatures commonly reach 700°C in a DOC+SCR+DPF configuration.
Table 2. Catalyst Aging Conditions
Figure 2. 10 hour example of the aging cycle
Using this accelerated aging platform, four identical exhaustsystems were aged, each with a different fuel: petroleumdiesel containing no detectable metals, B20 doped with Na,B20 doped with K, and B20 doped with Ca. The petroleumdiesel was an ultra low sulfur diesel (ULSD) and containedno measureable quantities of Na, K or Ca at a detection limit
of 1 ppm. Each of the biodiesel fuels was a blend of this sameULSD with 20vol% soy-based biodiesel. The soy-basedbiodiesel also contained no measureable quantities of Na, Kor Ca. The B20 was blended in 250 gallon tote quantities andthen doped with metal impurities to achieve preciselycontrolled levels. Laboratory experiments were conducted todetermine compounds suitable for doping the B20 based onsolubility at room temperatures. The dopants used to add Na,K and Ca were dioxtyl sulfonate sodium salt, potassiumdodecylbenzene and calcium napthenate, respectively. Oncethe B20 batch was blended, it was doped with the desiredmetal impurity and allowed to mix overnight with a paddlewheel agitator. A sample was then collected for analysis.Samples were collected from the top and bottom of the tote toensure a homogeneous mixture of the dopant.
Fuel dopant levels were selected to achieve 150,000 milesworth of metal exposure in the 100 hour aging period. Thedopants were added to the fuel at 14ppm. This level waschosen to achieve 150,000 miles worth of metal exposure,assuming normal vehicle operation with a B20 blended fromB100 at the ASTM International's specification limit of 5ppm metals. This would correspond to a B20 fuel containing1 ppm of the impurity. The calculations and assumptions usedfor this estimate are shown below.
Biodiesel metal exposure estimate
Fuel economy of a Ford F-series pickup = 18 mpg
0.00015% of B20 becomes oxide ash at current spec limits(Assuming 1ppm Na in B20 forming Na2O ash)
150,000 miles / 18 mpg × 0.00015% × 3.1 kg/gal = 39 grams
Accelerated ash loading calculation
Test length = 100 hours
Caterpillar engine fuel consumption over 3-mode test cycle =19.6 kg/hr
0.0021% of B20 becomes ash (14× metal in fuel)
100 hrs × 19.6 kg/hr × 0.0021% = 41 grams
Emissions Testing of Aged CatalystsThe 100 hours of accelerated aging was interrupted at 10-hour intervals for DPF weighing and emissions testing. At the10- hour interval, the exhaust system was removed from theaccelerated aging test bed. The DPF was separated from therest of the exhaust and weighed. Then the full exhaust systemwas installed onto the Ford F250 pickup truck for emissionstesting. The vehicle was tested on a chassis dynamometerover the Federal Test Procedure (FTP) cycle withmeasurement of regulated emissions following U.S. EPA
certification test methods [13]. The purpose of intermittentemissions evaluation was to identify the onset of catalystfailure due to metal exposure. Prior to each emission test, thesystem was prepped to ensure that the catalysts were at thesame state. The catalyst prep procedure consisted of (1)conducting a forced DPF regeneration event while driving theHighway Fuel Economy Test (HWFET) cycle, followed by(2) conducting two repeats of the LA4 test cycle, and finally,(3) a minimum 7-hour soak period. This system conditioningensured that the vehicle did not initiate a DPF regenerationevent during the FTP and that the SCR catalysts had the sameopportunity for ammonia (NH3) adsorption prior to the FTPemissions test.
Emissions concentrations were measured at multiplelocations in the exhaust, as indicated in Figure 1, to allow forcalculation of percent conversion. Dilute bag emissions weremeasured for all three phases of the FTP and a finalcalculation was made in grams/mile of NOx, carbonmonoxide (CO), total HC, and carbon dioxide (CO2). Allsystem prep work and emissions testing was conducted with astandard ULSD, regardless of the fuel type used to age thecatalyst.
Postmortem Analysis of Aged Catalysts
Figure 3. Sample location for postmortem analysis
Following the end of simulated aging and the final emissionstests on the F250 pickup truck, each of the four exhaustsystems was sent to Oak Ridge National Laboratory (ORNL)and Ford for further postmortem analysis. In preparation forpostmortem analysis core sections were harvested from eachof the catalyst bricks. One inch diameter cores were takendown the length of each of the DOC and SCR bricks. Thesecores were taken close to the radial center of each brick.Electron probe microanalysis (EPMA) was used to determinethe location and concentration of the metal species and ash.Bench flow reactor experiments were used to investigatecatalytic activity for the aged parts. The relative locations for
samples harvested for each of these analyses are shown inFigure 3. Further description of methods for postmortemanalysis is included in the Results section of this paper.
RESULTSThermal and Metal ExposureFollowing every 10 hours of catalyst aging, the DPF wasremoved from the exhaust system and weighed to determinetotal ash loading. The weighing took place following 30minutes of operation with temperatures around 700°C (Mode3). This ensured that minimal soot was present on the filter atthe time of weighing. The filter was above 200°C at the timeof weighing to prevent water adsorption. Table 3 shows thetotal amount of ash collected by the end of the 100 hours ofsimulated aging. The system aged with ULSD collected 28grams of ash, which would primarily come from the engine'slubricant. As expected, each of the systems aged with B20doped with metals collected higher levels of ash. It isexpected that a portion of this ash on the B20 aged filterswould also come from the lubricant oil with the rest comingfrom the metals doped into the fuel. The system aged withB20 containing 14 ppm of Ca collected the most ash, at 82grams. The DPF was the final component in the exhaustsystem; thus, the DOCs and SCRs ahead of the filter wouldhave been exposed to these levels of ash at a minimum. Table3 also shows thermal exposure data for each of the foursystems. This table shows the time where the temperature isgreater than 600°C, generally considered to be DPFregeneration conditions, and the average temperaturemeasured at the inlet to the SCR catalyst. As can be seenfrom this data, the thermal aging is very similar for each ofthe four systems. Thus, the primary difference between thesesystems is the amount and type of metal ash to which theywere exposed.
Table 3. Thermal and Ash Exposure
Vehicle EmissionsFollowing the DPF weighing procedure, the exhaust systemwas reassembled and installed onto a Ford F250 pickup truckfor emissions testing. This occurred at 10-hour intervalsthroughout the accelerated aging and was always conductedutilizing ULSD fuel without biodiesel or doped metals. Thefirst emissions test was conducted after 1 hour of aging toallow for some catalyst de-greening. Figure 4 shows the NOxemissions from the vehicle, measured in grams/mile,throughout the accelerated aging process. The final test
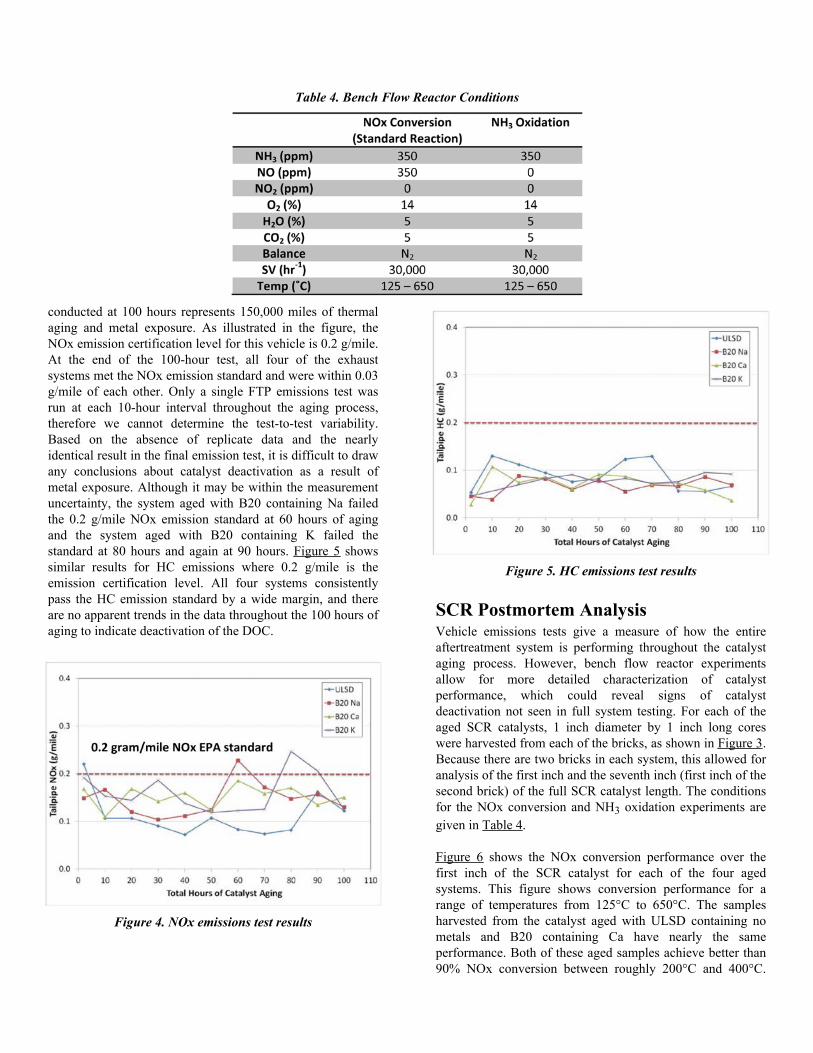
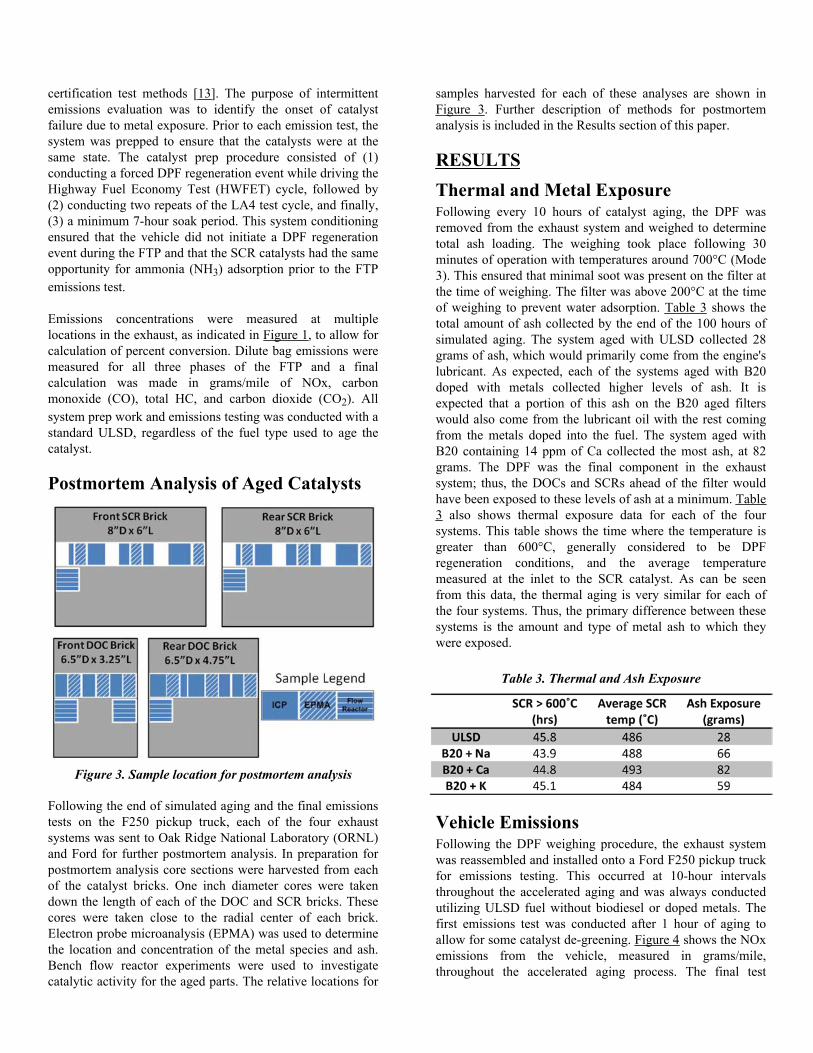
conducted at 100 hours represents 150,000 miles of thermalaging and metal exposure. As illustrated in the figure, theNOx emission certification level for this vehicle is 0.2 g/mile.At the end of the 100-hour test, all four of the exhaustsystems met the NOx emission standard and were within 0.03g/mile of each other. Only a single FTP emissions test wasrun at each 10-hour interval throughout the aging process,therefore we cannot determine the test-to-test variability.Based on the absence of replicate data and the nearlyidentical result in the final emission test, it is difficult to drawany conclusions about catalyst deactivation as a result ofmetal exposure. Although it may be within the measurementuncertainty, the system aged with B20 containing Na failedthe 0.2 g/mile NOx emission standard at 60 hours of agingand the system aged with B20 containing K failed thestandard at 80 hours and again at 90 hours. Figure 5 showssimilar results for HC emissions where 0.2 g/mile is theemission certification level. All four systems consistentlypass the HC emission standard by a wide margin, and thereare no apparent trends in the data throughout the 100 hours ofaging to indicate deactivation of the DOC.
Figure 4. NOx emissions test results
Figure 5. HC emissions test results
SCR Postmortem AnalysisVehicle emissions tests give a measure of how the entireaftertreatment system is performing throughout the catalystaging process. However, bench flow reactor experimentsallow for more detailed characterization of catalystperformance, which could reveal signs of catalystdeactivation not seen in full system testing. For each of theaged SCR catalysts, 1 inch diameter by 1 inch long coreswere harvested from each of the bricks, as shown in Figure 3.Because there are two bricks in each system, this allowed foranalysis of the first inch and the seventh inch (first inch of thesecond brick) of the full SCR catalyst length. The conditionsfor the NOx conversion and NH3 oxidation experiments aregiven in Table 4.
Figure 6 shows the NOx conversion performance over thefirst inch of the SCR catalyst for each of the four agedsystems. This figure shows conversion performance for arange of temperatures from 125°C to 650°C. The samplesharvested from the catalyst aged with ULSD containing nometals and B20 containing Ca have nearly the sameperformance. Both of these aged samples achieve better than90% NOx conversion between roughly 200°C and 400°C.
Table 4. Bench Flow Reactor Conditions
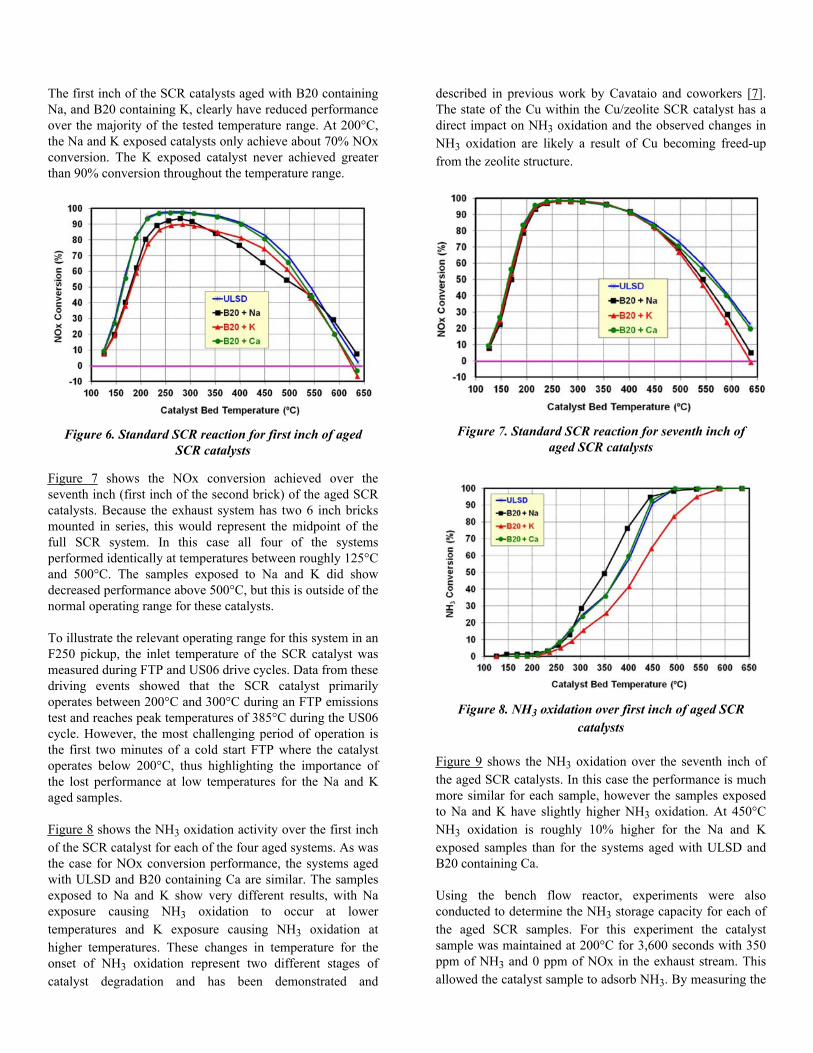
The first inch of the SCR catalysts aged with B20 containingNa, and B20 containing K, clearly have reduced performanceover the majority of the tested temperature range. At 200°C,the Na and K exposed catalysts only achieve about 70% NOxconversion. The K exposed catalyst never achieved greaterthan 90% conversion throughout the temperature range.
Figure 6. Standard SCR reaction for first inch of agedSCR catalysts
Figure 7 shows the NOx conversion achieved over theseventh inch (first inch of the second brick) of the aged SCRcatalysts. Because the exhaust system has two 6 inch bricksmounted in series, this would represent the midpoint of thefull SCR system. In this case all four of the systemsperformed identically at temperatures between roughly 125°Cand 500°C. The samples exposed to Na and K did showdecreased performance above 500°C, but this is outside of thenormal operating range for these catalysts.
To illustrate the relevant operating range for this system in anF250 pickup, the inlet temperature of the SCR catalyst wasmeasured during FTP and US06 drive cycles. Data from thesedriving events showed that the SCR catalyst primarilyoperates between 200°C and 300°C during an FTP emissionstest and reaches peak temperatures of 385°C during the US06cycle. However, the most challenging period of operation isthe first two minutes of a cold start FTP where the catalystoperates below 200°C, thus highlighting the importance ofthe lost performance at low temperatures for the Na and Kaged samples.
Figure 8 shows the NH3 oxidation activity over the first inchof the SCR catalyst for each of the four aged systems. As wasthe case for NOx conversion performance, the systems agedwith ULSD and B20 containing Ca are similar. The samplesexposed to Na and K show very different results, with Naexposure causing NH3 oxidation to occur at lowertemperatures and K exposure causing NH3 oxidation athigher temperatures. These changes in temperature for theonset of NH3 oxidation represent two different stages ofcatalyst degradation and has been demonstrated and
described in previous work by Cavataio and coworkers [7].The state of the Cu within the Cu/zeolite SCR catalyst has adirect impact on NH3 oxidation and the observed changes inNH3 oxidation are likely a result of Cu becoming freed-upfrom the zeolite structure.
Figure 7. Standard SCR reaction for seventh inch ofaged SCR catalysts
Figure 8. NH3 oxidation over first inch of aged SCRcatalysts
Figure 9 shows the NH3 oxidation over the seventh inch ofthe aged SCR catalysts. In this case the performance is muchmore similar for each sample, however the samples exposedto Na and K have slightly higher NH3 oxidation. At 450°CNH3 oxidation is roughly 10% higher for the Na and Kexposed samples than for the systems aged with ULSD andB20 containing Ca.
Using the bench flow reactor, experiments were alsoconducted to determine the NH3 storage capacity for each ofthe aged SCR samples. For this experiment the catalystsample was maintained at 200°C for 3,600 seconds with 350ppm of NH3 and 0 ppm of NOx in the exhaust stream. Thisallowed the catalyst sample to adsorb NH3. By measuring the

NH3 downstream of the SCR catalyst it is possible todetermine how much NH3 the catalyst is able to store. Thisexperiment is illustrated in Figure 10, which shows the NH3profiles measured both upstream and downstream of thecatalyst. The difference between the two profiles is used tocalculate the total NH3 storage capacity. This total storagecapacity is further divided into a strongly held portion and aweakly held portion. The strongly held portion representschemical adsorption of the NH3 to the acid sites within thezeolite, whereas the weakly held portion represents physicaladsorption or condensation of NH3. The differentiationbetween the two types of storage is marked by the onset ofNH3 breakthrough measured downstream of the catalyst.
Figure 9. NH3 oxidation over seventh inch of aged SCRcatalysts
Figure 10. Example of NH3 adsorption experiment
Figure 11 shows the strongly held NH3 as a percentage of thetotal adsorption capacity for the first inch of the aged SCRcatalysts. The adsorption experiment was run at threeseparate temperatures; 200°C, 250°C and 300°C. In all threecases, the samples exposed to K and Na clearly havediminished capacity for strongly held NH3 storage. Figure 12shows the strongly held NH3 as a percentage of total capacity
for the seventh inch of the aged SCR catalysts. In this case allof the systems exposed to fuel metals have slightly lowercapacity for strongly held NH3, however the impact is muchless than what is seen in the first inch.
Figure 11. NH3 storage in first inch of the aged SCRcatalysts
Figure 12. NH3 storage in seventh inch of the aged SCRcatalysts
Figures 13, 14, 15, 16 show EPMA micrographs for a quarterchannel cross section of each of the aged SCR catalysts. Theimages highlight relative concentrations and distributions ofCa, Na, K, and P in each of the samples. The color legend tothe right of each image represents the spectrum of relativeconcentration for the elements, with red being the highest anddark blue representing background levels. Phosphorus wasselected because it is a common additive in lubricating oils.As shown in Figure 3, these samples were taken from thefront SCR, approximately one inch into the brick. These crosssection images in Figures 13, 14, 15, 16 show the lower lefthand corner of a single channel of the flow through the SCRcatalyst, including both the washcoat and substrate. Thesubstrate is in the lower left corner of each of the four imagesand shows visible porosity. The washcoat fills the corner ofthe substrate channel with the surface exposed to the exhaustflow located in the upper right hand corner. The exhaust flowdirection is perpendicular to the plane of the image. Naturally

occurring cracks divide the washcoat into sections which wedesignate as “corner” and “side” for the purpose ofdiscussion. This is illustrated in Figure 13. In each of the fouraged samples there is a thin layer of P deposited directly ontop of the washcoat. In the case of the sample aged with Ca, athin, highly concentrated layer of Ca is deposited directly ontop of the washcoat as well. There is no evidence of either theP or Ca penetrating into the washcoat. In the case of the Naexposed sample, the EPMA image shows an elevated signalfor Na in the washcoat of the catalyst. A similar result is seenfor the K-exposed sample with a high concentration of K inthe washcoat. The alkali elements have diffused into theporous washcoat to the substrate surface rather than beingisolated to the washcoat external surface like the Ca and P.Also of note is that the side portion of the washcoat tends toshow higher concentrations for the Na and K than the cornerportions.
Figure 13. EPMA of first inch of ULSD aged SCR
Previous studies have employed similar acceleratedtechniques to probe the question of Na and K impact on SCRcatalysis [7]. In particular, Brookshear et al. [14] investigatedboth chemical characterization with EPMA and performanceimpact with the key differences being the use of an oldergeneration zeolite framework (Beta versus Chabazite) andexposure to much higher levels of Na (to mimic heavy dutyexposure of 435,000 miles). Similar results were observed inthe EPMA data, as Na was observed throughout the washcoatwith higher concentrations in the side position. Theperformance deactivation was more significant in thisinvestigation, but this is to be expected since the zeolite ismore susceptible to thermal aging and the total Na exposurewas nearly 3 times higher. The similarities in these findingssuggest that the impact of Na is similar across allcommercially relevant Cu-exchanged zeolite. Extrapolation
to Fe-zeolites cannot be made at this time. The proposedmechanism of substitution of the exchanged metal with Na orK is expected to still be relevant; however, the relativeexchange strength would need to be probed in a similarmanner as was done here.
Figure 14. EPMA of first inch of Ca aged SCR
Figure 15. EPMA of first inch of Na aged SCR
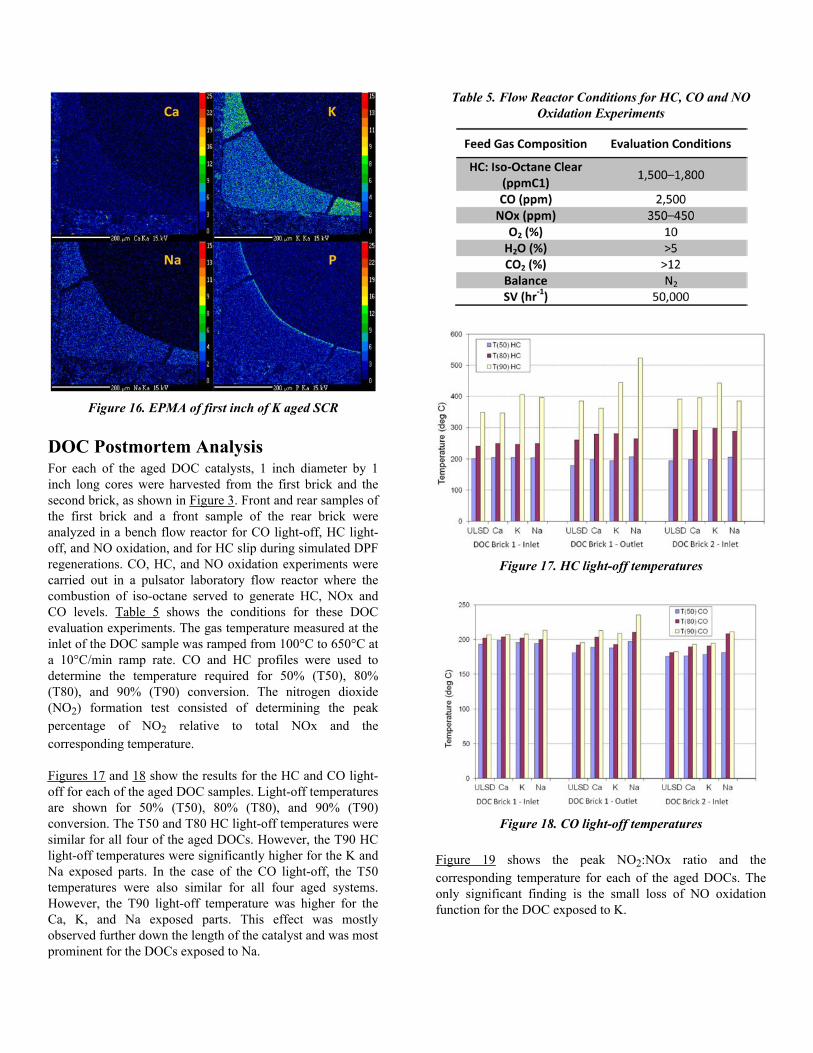
Figure 16. EPMA of first inch of K aged SCR
DOC Postmortem AnalysisFor each of the aged DOC catalysts, 1 inch diameter by 1inch long cores were harvested from the first brick and thesecond brick, as shown in Figure 3. Front and rear samples ofthe first brick and a front sample of the rear brick wereanalyzed in a bench flow reactor for CO light-off, HC light-off, and NO oxidation, and for HC slip during simulated DPFregenerations. CO, HC, and NO oxidation experiments werecarried out in a pulsator laboratory flow reactor where thecombustion of iso-octane served to generate HC, NOx andCO levels. Table 5 shows the conditions for these DOCevaluation experiments. The gas temperature measured at theinlet of the DOC sample was ramped from 100°C to 650°C ata 10°C/min ramp rate. CO and HC profiles were used todetermine the temperature required for 50% (T50), 80%(T80), and 90% (T90) conversion. The nitrogen dioxide(NO2) formation test consisted of determining the peakpercentage of NO2 relative to total NOx and thecorresponding temperature.
Figures 17 and 18 show the results for the HC and CO light-off for each of the aged DOC samples. Light-off temperaturesare shown for 50% (T50), 80% (T80), and 90% (T90)conversion. The T50 and T80 HC light-off temperatures weresimilar for all four of the aged DOCs. However, the T90 HClight-off temperatures were significantly higher for the K andNa exposed parts. In the case of the CO light-off, the T50temperatures were also similar for all four aged systems.However, the T90 light-off temperature was higher for theCa, K, and Na exposed parts. This effect was mostlyobserved further down the length of the catalyst and was mostprominent for the DOCs exposed to Na.
Table 5. Flow Reactor Conditions for HC, CO and NOOxidation Experiments
Figure 17. HC light-off temperatures
Figure 18. CO light-off temperatures
Figure 19 shows the peak NO2:NOx ratio and thecorresponding temperature for each of the aged DOCs. Theonly significant finding is the small loss of NO oxidationfunction for the DOC exposed to K.
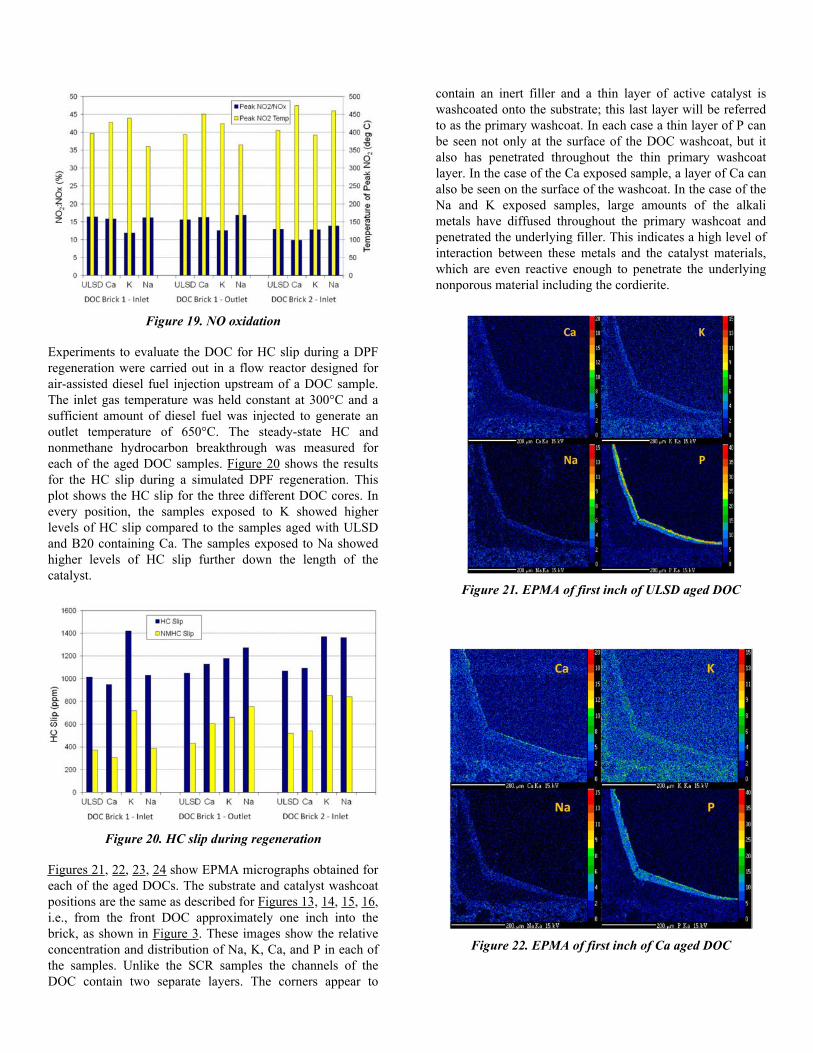
Figure 19. NO oxidation
Experiments to evaluate the DOC for HC slip during a DPFregeneration were carried out in a flow reactor designed forair-assisted diesel fuel injection upstream of a DOC sample.The inlet gas temperature was held constant at 300°C and asufficient amount of diesel fuel was injected to generate anoutlet temperature of 650°C. The steady-state HC andnonmethane hydrocarbon breakthrough was measured foreach of the aged DOC samples. Figure 20 shows the resultsfor the HC slip during a simulated DPF regeneration. Thisplot shows the HC slip for the three different DOC cores. Inevery position, the samples exposed to K showed higherlevels of HC slip compared to the samples aged with ULSDand B20 containing Ca. The samples exposed to Na showedhigher levels of HC slip further down the length of thecatalyst.
Figure 20. HC slip during regeneration
Figures 21, 22, 23, 24 show EPMA micrographs obtained foreach of the aged DOCs. The substrate and catalyst washcoatpositions are the same as described for Figures 13, 14, 15, 16,i.e., from the front DOC approximately one inch into thebrick, as shown in Figure 3. These images show the relativeconcentration and distribution of Na, K, Ca, and P in each ofthe samples. Unlike the SCR samples the channels of theDOC contain two separate layers. The corners appear to
contain an inert filler and a thin layer of active catalyst iswashcoated onto the substrate; this last layer will be referredto as the primary washcoat. In each case a thin layer of P canbe seen not only at the surface of the DOC washcoat, but italso has penetrated throughout the thin primary washcoatlayer. In the case of the Ca exposed sample, a layer of Ca canalso be seen on the surface of the washcoat. In the case of theNa and K exposed samples, large amounts of the alkalimetals have diffused throughout the primary washcoat andpenetrated the underlying filler. This indicates a high level ofinteraction between these metals and the catalyst materials,which are even reactive enough to penetrate the underlyingnonporous material including the cordierite.
Figure 21. EPMA of first inch of ULSD aged DOC
Figure 22. EPMA of first inch of Ca aged DOC

Figure 23. EPMA of first inch of Na aged DOC
Figure 24. EPMA of first inch of K aged DOC
DPF Postmortem AnalysisMeasurements of fracture strength, elastic modulus, andcoefficient of thermal expansion (CTE) were taken for eachof the four aged DPFs as well as a fresh DPF. A criticalparameter for estimating DPF durability is the thermal shockresistance (RS):
(1)
where K is the thermal conductivity, σf is the tensile fracturestrength, ν is the Poisson's ratio, α is the CTE, and E is theelastic modulus. It is desirable to maximize RS. Failure islikely to occur during regeneration when the thermal
gradients are largest, so any increase in the elastic modulusand CTE or decrease in the fracture strength and thermalconductivity will be detrimental to the DPF durability.
For measurement of material strength, approximately 70 tiles,each 30 × 30 mm square, were extracted down the length ofthe DPF. One-half of the tiles were taken from the radialcenter of the DPF while the other half were taken closer tothe radial edge. Each individual tile was subject to a ring-on-ring biaxial flexure test as described in Reference [15]. Thistest measured the force and displacement at failure fromwhich the elastic modulus and tensile fracture strength wereestimated. This was done by modeling the same loadingscenario and DPF strut structure using finite element analysisand then adjusting the elastic modulus in the model until itmatched the load and displacement measured at the point offracture after the subtraction of the compliance introduced bythe testing equipment. Once the elastic modulus wasdetermined, the fracture strength was calculated. Theestimated elastic modulus and tensile fracture strength isshown in Figure 25 alongside the average specimen thicknessfor both the center and edge locations. This data is shown foreach of the aged samples as well as for a fresh sample.
Both the elastic modulus and the fracture strength increasewith the ULSD, B20+K, and B20+Na samples, but theydecline slightly with the B20+Ca samples relative to the freshsample. However, the specimen thickness also follows thesame trend which resulted from difficulties in machining theSiC material. It cannot be ruled out that the different responsein mechanical properties was largely caused by the change inspecimen thickness and not from exposure as the thickerspecimens will have higher contact stresses causing either theloading rings to crush the specimen or the specimen to flattenthe rings thereby erroneously increasing the measured failureforce. Nevertheless, because the estimated elastic moduluscorrelates with fracture strength in Figure 25, and these twoproperties are, respectively, in the denominator andnumerator of Equation 1, the effect on the thermal shockresistance will be negligible. Moreover, resonant ultrasoundmeasurements were conducted on samples from all theconditions and locations in Figure 25 but on specimens withidentical dimensions and no statistically significant change inelastic modulus was observed, thereby suggesting that thechanges measured in Figure 25 are related to specimenthickness and not engine testing.
Measurement of the CTE was conducted using a dual-roddilatometer. The CTE specimens were 3 by 3 DPF channelssquare and one inch in length. A small spring load wasapplied along the axial direction of the specimen and theexpansion with temperature was measured. Figure 26 showsthe CTE for each of the aged samples as well as a fresh DPF.The CTE for all samples is approximately 4×10⁻⁶/°C at200°C and rises to approximately 5.5×10⁻⁶/°C at 800°C.There is no apparent difference in the CTE responses

between any of the aged parts and the fresh sample. Somesamples had broad peaks in the thermal expansion curveabove 800°C which may be due to phase transformations inthe ash that is present between the sample and the loadingrod.
Figure 25. The estimated tensile fracture strength,estimated elastic modulus and thickness of the DPF
samples
Figure 26. CTE versus temperature for the aged andfresh DPF samples
The aged and fresh samples were mounted in epoxy and themicrostructure was observed both optically and with ascanning electron microscope; no evidence of cracking orcorrosion was found. Energy-dispersive X-ray spectra werealso collected from the SiC in each condition and no evidenceof diffusion of metal species into the SiC structure or grainboundaries was detected. These observations coupled withthe thermo-mechanical measurements show that there was no
measureable degradation of the SiC DPF caused by exposureto the fuel metal impurities.
SUMMARY / CONCLUSIONSAn earlier study showed that alkali and alkaline earth metalscould have a significant impact on the catalytic activity of aDOC and the thermo-mechanical durability of a DPF in aheavy-duty application [12]. The purpose of the workpresented in this paper was to investigate the impact of thesemetal impurities in a light-duty application, with theadditional concern that the SCR catalyst is located in front ofthe DPF where it will see more thermal and metal exposure.
Bench flow reactor experiments conducted on samples takenfrom each of the aged SCR catalysts showed that partsexposed to Na and K had reduced catalytic activity. However,this reduced performance was only seen in the first inch ofthe catalyst and was no longer observed further down thelength of the catalyst. The cause of this deactivation is furtherexplained by EPMA analysis of the SCR, which show thatthe Na and K have migrated into the catalyst washcoat,whereas Ca and lube oil derived Phosphorous remain on thewashcoat surface. The overall magnitude of this SCRdeactivation seen in the first inch of the catalyst is put intoperspective by conducting FTP emissions tests of the fullaftertreatment system. Emissions tests with a Ford F250pickup showed that all of the systems continued to meet the0.2 g/mile NOx emission standard after the equivalent of150,000 miles of accelerated aging. Bench flow reactor andEPMA studies of the aged DOCs showed similar signs ofdeactivation for parts exposed to Na and K. However, thevehicle also continued to meet the HC emission standardswith each of the aged systems. The vehicle emission testingand postmortem results taken together indicate that the alkalimetals, Na, and K are volatile at temperatures typically seenin diesel exhaust, which allows them to migrate into thecatalyst washcoat leading to catalyst deactivation. However,after the simulated equivalent of 150,000 miles of exposure,there remains enough unaltered catalyst volume that impactson tailpipe vehicle emissions are not observed. In addition thethermo-mechanical properties of the aged SiC DPFs wereunchanged relative to each other and to a fresh DPF.
REFERENCES1. Graboski, M.S. and McCormick, R.L., “Combustion ofFat and Vegetable Oil Derived Fuels in Diesel Engines,”Progress in Energy and Combustion Science, 24 125-163,1998.2. Alleman, T.L., McCormick, R.L., “Results of the 2007B100 Quality Survey,” NREL/TP-540-42787, Golden, CO:National Renewable Energy Laboratory, March 2008.3. Alleman, T.L., Fouts, L., and Chupka, G.M., “QualityParameters and Chemical Analysis for Biodiesel Produced inthe United States in 2011,” Golden, CO: National RenewableEnergy Laboratory, in preparation.

4. Schwab, S., Bennett, J., Dell, S., Galante-Fox, J. et al.,“Internal Injector Deposits in High-Pressure Common RailDiesel Engines,” SAE Int. J. Fuels Lubr. 3(2):865-878, 2010,doi:10.4271/2010-01-2242.
5. Quigley, R., Barbour, R., Fahey, E., Arters, D.C., Wetzel,W., Ray, J., “A Study of the Internal Diesel Injector DepositPhenomenon,” Proceedings of Fuels: conventional and futureenergy for automobiles, 8th International Colloquium,Esslingen, 19-20 January 2011, www.lubrizol.com/9040Zer0/IDIDQuigleyTAEEsslingen.pdf
6. Dou, D. and Balland, J., “Impact of Alkali Metals on thePerformance and Mechanical Properties of NOx AdsorberCatalysts,” SAE Technical Paper 2002-01-0734, 2002, doi:10.4271/2002-01-0734.
7. Cavataio, G., Jen, H., Dobson, D., and Warner, J.,“Laboratory Study to Determine Impact of Na and KExposure on the Durability of DOC and SCR CatalystFormulations,” SAE Technical Paper 2009-01-2823, 2009,doi:10.4271/2009-01-2823.
8. Williams, A., McCormick, R., Hayes, R., Ireland, J. et al.,“Effect of Biodiesel Blends on Diesel Particulate FilterPerformance,” SAE Technical Paper 2006-01-3280, 2006,doi:10.4271/2006-01-3280.
9. Williams, A., Pedersen, D., Ireland, J., McCormick, R. etal., “Effect of Biodiesel Blends on Urea Selective CatalyticReduction Catalyst Performance with a Medium-DutyEngine,” SAE Technical Paper 2008-01-2484, 2008, doi:10.4271/2008-01-2484.
10. Tatur, M., Nanjundaswamy, H., Tomazic, D., Thornton,M. et al., “Biodiesel Effects on U.S. Light-Duty Tier 2Engine and Emission Control Systems - Part 2,” SAE Int. J.Fuels Lubr. 2(1):88-103, 2009, doi:10.4271/2009-01-0281.
11. Williams, A., Ratcliff, M., Pedersen, D., McCormick, R.et al., “Effect of Unburned Methyl Esters on the NOxConversion of Fe-Zeolite SCR Catalyst,” SAE Int. J. FuelsLubr. 2(2):273-282, 2010, doi:10.4271/2009-01-2777.
12. Williams, A., McCormick, R., Luecke, J., Brezny, R. etal., “Impact of Biodiesel Impurities on the Performance andDurability of DOC, DPF and SCR Technologies,” SAE Int. J.Fuels Lubr. 4(1):110-124, 2011, doi:10.4271/2011-01-1136.
13. Code of Federal Regulations: Protection of theEnvironment, Title 40 CFR Part 86, U.S. EnvironmentalProtection Agency, http://www.epa.gov/lawsregs/regulations/.
14. Brookshear D.W., Nguyen K., Toops T.J., Bunting B.G.,Rohr W.F., Howe J., “Investigation of the effects ofbiodiesel-based Na on emissions control components”,Catalysis Today 184 (2012) 205-218.].
15. Wereszczak, A., Fox, E., Lance, M., and Ferber, M.,“Failure Stress and Apparent Elastic Modulus of DieselParticulate Filter Ceramics,” SAE Int. J. Mater. Manf. 5(2):517-527, 2012, doi:10.4271/2012-01-1252.
CONTACT INFORMATIONAaron WilliamsNational Renewable Energy Lab15013 Denver West ParkwayGolden, CO 80401(303) [email protected]
ACKNOWLEDGMENTSSupport from the National Biodiesel Board, the UnitedSoybean Board, the U.S. Department of Energy, Office ofVehicle Technologies, Fuels Technologies Program andPropulsion Materials Programs is gratefully acknowledged.The authors would like to acknowledge the support of RogerGault of the Truck and Engine Manufacturers Associationand an industry technical steering committee comprised ofengine and emission control experts for their technical inputused in developing the accelerated durability test protocol.We would also like to acknowledge the contributions ofShirley Waters in the collection of the CTE data.
DEFINITIONS/ABBREVIATIONSB20 - 20 vol% biodiesel blended into petroleum dieselCa - CalciumCO - Carbon MonoxideCO2 - Carbon Dioxide
CPSI - Cells per Square InchCTE - Coefficient of Thermal ExpansionCu-Cha - Copper ChabaziteDOC - Diesel Oxidation CatalystDPF - Diesel Particulate FilterEPA - U.S. Environmental Protection AgencyEPMA - Electron Probe MicroanalysisFTP - Federal Test ProcedureHC - HydrocarbonsK - PotassiumMg - MagnesiumNa - SodiumNH3 - Ammonia
NO - Nitrous OxideNO2 - Nitrogen Dioxide
NOx - Oxides of NitrogenNREL - National Renewable Energy LaboratoryP - PhosphorousORNL - Oak Ridge National Laboratoryppm - Parts per Million

Rs - Thermal Shock Resistance ParameterSCR - Selective Catalytic Reduction CatalystSV - Space VelocityULSD - Ultra Low Sulfur Diesel (<15ppm Sulfur)
The Engineering Meetings Board has approved this paper for publication. It hassuccessfully completed SAE's peer review process under the supervision of the sessionorganizer. This process requires a minimum of three (3) reviews by industry experts.
ISSN 0148-7191
Positions and opinions advanced in this paper are those of the author(s) and notnecessarily those of SAE. The author is solely responsible for the content of the paper.
SAE Customer Service:Tel: 877-606-7323 (inside USA and Canada)Tel: 724-776-4970 (outside USA)Fax: 724-776-0790Email: [email protected] Web Address: http://www.sae.orgPrinted in USA