A-level BIOLOGY (7402/1) - pmt.physicsandmathstutor.com
25
SPECIMEN MATERIAL Specimen 2014 Session Time allowed: 2 hours Materials For this paper you must have: • a ruler with millimetre measurements • a calculator. Instructions • Use black ink or black ball-point pen. • Fill in the boxes at the bottom of this page. • Answer all questions. Information • The marks for questions are shown in brackets. • The maximum mark for this paper is 91. A-level BIOLOGY (7402/1) Paper 1 Please write clearly, in block capitals, to allow character computer recognition. Centre number Candidate number Surname Forename(s) Candidate signature PhysicsAndMathsTutor.com
Transcript of A-level BIOLOGY (7402/1) - pmt.physicsandmathstutor.com

SPECIMEN MATERIAL
Specimen 2014 Session Time allowed: 2 hours
Materials For this paper you must have: • a ruler with millimetre measurements• a calculator.
Instructions • Use black ink or black ball-point pen.• Fill in the boxes at the bottom of this page.• Answer all questions.
Information • The marks for questions are shown in brackets.• The maximum mark for this paper is 91.
A-levelBIOLOGY(7402/1)Paper 1
Please write clearly, in block capitals, to allow character computer recognition.
Centre number Candidate number
Surname
Forename(s)
Candidate signature
PhysicsAndMathsTutor.com

2
Answer all questions in the spaces provided.
A technician investigated the effect of temperature on the rate of an enzyme-controlled reaction. At each temperature, he started the reaction using the same concentration of substrate.
Figure 1 shows his results.
Give two other factors the technician would have controlled. [1 mark]
Draw a tangent on each curve to find the initial rates of reaction. Use these values to calculate the ratio of the initial rates of reaction at 60 °C : 37 °C. Show your working.
[2 marks]
0 1 . 2
0 1 . 1
1
2
Ratio = :1
1
"
-,
concentration of enzyme V01- Of substrate
PH
@37C @60L
In :% adf.az:45 4%75--514= 0875
5- 14
PhysicsAndMathsTutor.com

3
Turn over �
Explain the difference in the initial rate of reaction at 60 °C and 37 °C. [2 marks]
Explain the difference in the rates of reaction at 60 °C and 37 °C between 20 and 40 minutes.
[4 marks]
0 1 . 3
0 1 . 4
[Extra space]
1
At 60C there is more kinetic energy within the particlesand so there are more frequent collisions between
enagme and substrate and so more enzyme- substrate
complexes form .
At 60C,this high temperature has caused denaturation
of an enzymes✓ causing a permanent change to theactive site causing the reaction to stop . However
there is still substrate available when all the
enzymes have denatured out arent converted into
product to concentration remains constant
PhysicsAndMathsTutor.com

4
Describe how oxygen in the air reaches capillaries surrounding alveoli in the lungs. Details of breathing are not required.
[4 marks]
Forced expiratory volume (FEV) is the greatest volume of air a person can breathe out in 1 second.
Forced vital capacity (FVC) is the greatest volume of air a person can breathe out in a single breath.
Figure 2 shows results for the volume of air breathed out by three groups of people, A, B and C. Group A had healthy lungs. Groups B and C had different lung conditions that affect breathing.
0 2 . 1
[Extra space]
Air is taken in through the mouth and nose .Air moves
through the trachea and then the bronchi,and then the
bronchioles down the pressure gradient. Air then movesdown the diffusion gradient from an area of highconcentration to low concentration across the diffusion
gradient . Nir moves across the alveolar epitheliumvia diffusion as well as across the capillaryendotheliumand into the alveoli
.
7L I
4.2
H20.8
PhysicsAndMathsTutor.com

5
Turn over �
Calculate the percentage drop in FEV for group C compared with the healthy people.
[1 mark]
Asthma affects bronchioles and reduces flow of air in and out of the lungs. Fibrosis does not affect bronchioles; it reduces the volume of the lungs.
Which group, B or C, was the one containing people with fibrosis of their lungs? Use the information provided and evidence from Figure 2 to explain your answer.
[3 marks]
0 2 . 2
0 2 . 3
[Extra space]
Answer =
groupA
¥:asé÷÷2C,= 42
K2 = 0.8 0-8-4-2 :-O -809 ✗ 100
42 = - 80-952%= - O - 809
81%
Group are the ones containing people with fibrosisof their lungs as they have a similar FEV to grouptherefore the bronchioles aren't affected. However,
the total volume breathed out has been reduced,✓and so this provides evidence to suggest its
group B.
PhysicsAndMathsTutor.com

6
Species richness and an index of diversity can be used to measure biodiversity within a community.
What is the difference between these two measures of biodiversity? [1 mark]
Scientists investigated the biodiversity of butterflies in a rainforest. Their investigation lasted several months.
The scientists set one canopy trap and one understorey trap at five sites.
• The canopy traps were set among the leaves of the trees 16–27 m above groundlevel.
• The understorey traps were set under trees at 1.0–1.5 m above ground level.
The scientists recorded the number of each species of butterfly caught in the traps. Table 1 summarises their results.
Table 1
Species of butterfly Mean number of butterflies P value
In canopy In understorey
Prepona laertes 15 0 < 0.001
Archaeoprepona demophon
14 37 < 0.001
Zaretis itys 25 11 > 0.05
Memphis arachne 89 23 < 0.001
Memphis offa 21 3 < 0.001
Memphis xenocles 32 8 < 0.001
The traps in the canopy were set at 16–27 m above ground level. Suggest why there was such great variation in the height of the traps.
[1 mark]
0 3 . 1
0 3 . 2
3
species richness measures only the number of different speciesand does not measure the number of individuals .
N = 196 N = 82
The trees varied in height
PhysicsAndMathsTutor.com

7
Turn over �
By how many times is the species diversity in the canopy greater than in the understorey? Show your working.
Use the following formula to calculate species diversity.
𝑑 =𝑁(𝑁 − 1)∑𝑛 (𝑛 − 1)
where 𝑁 is the total number of organisms of all species and 𝑛 is the total number of organisms of each species.
[3 marks]
The scientists carried out a statistical test to see if the difference in the distribution of each species between the canopy and understorey was due to chance. The P values obtained are shown in Table 1.
Explain what the results of these statistical tests show. [3 marks]
0 3 . 3
0 3 . 4
Answer =
[Extra space]
canopy understoreyN = 196 N= 82 ?gt÷o1961196 - 1) 82182 - 1)
= 113 times10236 2010 bigger
= 3-73 = 3-30
I -13p
The zaretisitys difference in distribution is most
likely due to chancel as the probability is
greater than 5% .All other species have a very
unlikely chance of being distributed differentlydue to the very low P value that holds high
significance
ape
PhysicsAndMathsTutor.com

8
Starch and cellulose are two important plant polysaccharides.
Figure 3 shows part of a starch molecule and part of a cellulose molecule.
Explain the difference in the structure of the starch molecule and the cellulose molecule shown in Figure 3.
[2 marks]
Starch molecules and cellulose molecules have different functions in plant cells. Each molecule is adapted for its function.
Explain one way in which starch molecules are adapted for their function in plant cells. [2 marks]
0 4 . 1
0 4 . 2
4
•starch is formed from ✗-
glucose monomers, but cellulose is
formed from B-glucose monomers.• Each adjacent glucose molecule is inverted 180 due to a
change in the position of the hydrogen and hydroxyl groups.
Starch molecules are helical which enables compactness , in
order to save space .
insoluble - doesn't affect the water potential gradientlarge molecule - cannot leave the cell
PhysicsAndMathsTutor.com

9
Turn over �
Explain how cellulose molecules are adapted for their function in plant cells. [3 marks]
Turn over for the next question
0 4 . 3
[Extra space]
-
the adjacent inverted glucose monomers within the cellulose
molecule provide for long and straight chains to be produced .
The inversion of glucose molecules allow for hydrogen bondingto form being the hydroxyl groups of adjacent parallel chains .
This allows for fibrils to format that increases the structural
stability of the cellulose molecule, allowing it to be used
to strengthen the cell way in plant cells .
make
PhysicsAndMathsTutor.com

10
Contrast the processes of facilitated diffusion and active transport. [3 marks]
Students investigated the uptake of chloride ions in barley plants. They divided the plants into two groups and placed their roots in solutions containing radioactive chloride ions.
• Group A plants had a substance that inhibited respiration added to the solution.• Group B plants did not have the substance added to the solution.
The students calculated the total amount of chloride ions absorbed by the plants every 15 minutes. Their results are shown in Figure 4.
0 5 . 1
[Extra space]
\
Facilitated diffusion is a passive process and doesn't
involve the use of Atf, whereas active transport is an
active process and involves Atf Facilitated diffusion takes
place down a concentration gradient (high to loaf , whereasactive transport works against the concentration gradienthow to night. Facilitated diffusion involves both carrier and
channel proteins, but active transport onlyinvolves carrier proteins
470
360
PhysicsAndMathsTutor.com
11
Turn over �
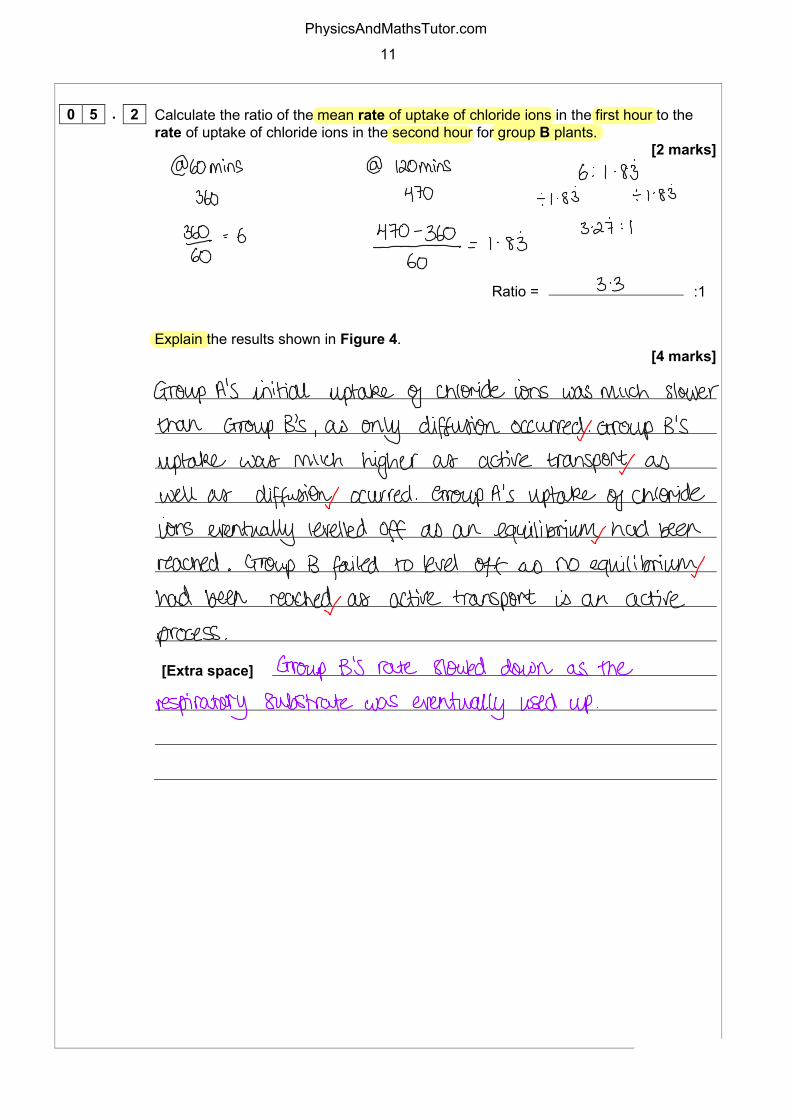
Calculate the ratio of the mean rate of uptake of chloride ions in the first hour to the rate of uptake of chloride ions in the second hour for group B plants.
[2 marks]
Explain the results shown in Figure 4.
[4 marks]
0 5 . 2
0 5 . 3
[Extra space]
Ratio = :1
@60mins @ 120mins 6 : I . 83360 470 ÷ 1.83 ÷ 183
327 : I
3¥ = 6 47%360-1.833.3
amGroup A's initial uptake of chloride ions was much slower
than Group B's ,as only diffusion occurred✓ Group B's
uptake was much higher as active transport as
well as diffusion occurred . Group A 's uptake of chloride
ions eventually levelled off as an equilibrium had beenreached
. Group B failed to level off as no equilibriumhad been reached✓ as active transport is an active
process .
Group B's rate slowed down as the
respiratory substrate was eventually used up .
b-
PhysicsAndMathsTutor.com

12
Table 2 shows how a bird called the bluethroat (Luscinia svecica) is classified by biologists.
Table 2
Taxon Name of taxon
Domain Eukaryota
Animalia
Chordata
Aves
Passeriformes
Muscicapidae
Genus
Species
Complete Table 2 by filling the seven blank spaces with the correct terms. [2 marks]
A group of scientists investigated genetic diversity in different species of bird. For each species, the scientists: • collected feathers from a large number of birds• extracted DNA from cells attached to each feather• analysed the samples of DNA to find genetic diversity.
Table 3 summarises their results.
Table 3
Species of bird Number of genes examined
Number of genes examined that showed
genetic diversity Willow flycatcher 708 197
House finch 269 80
Bluethroat 232 81
0 6 . 1
6
Dear
King Kingdom
Philip Phylum
came class
over order
From FamilyGermany huscinia
swimming svecica
bluetnroat willow flycatcher
2%2×100=3491 1%5×100=27.81
PhysicsAndMathsTutor.com

13
Turn over �
In this investigation, what is meant by genetic diversity? [1 mark]
The scientists concluded that the bluethroat showed greater genetic diversity than the willow flycatcher. Explain why they reached this conclusion. Use calculations to support your answer.
[2 marks]
Turn over for the next question
0 6 . 3
0 6 . 2
The number of different alleles of each gene .
number of different base sequences found in each gene
the bluethroat showed greater genetic diversity as the
percentage of genes showing diversity was much higher. In fact,the bluethroat had 34.9% genes of genetic diversity compared
to the willow flycatcher at 27.8% .
PhysicsAndMathsTutor.com

14
Figure 5 shows a test that has been developed to find out if a person has antibodies to the human immunodeficiency virus (HIV) antigen.
Figure 5
This test only detects the presence of HIV antibodies. Give two reasons why it cannot be used to find out if a person has AIDS.
[2 marks]
0 7 . 1
HIV antigens are attached to a test well in a dish.
A sample of blood plasma is added to the well.
If HIV antibodies are present, they bind to the HIV antigen.
The well is washed. A second antibody with an enzyme attached is then
added. This binds specifically to the
HIV antibody.
The well is washed again. A yellow solution is added,
which changes to blue if the enzyme is present. A blue
colour shows that the person has HIV antibodies.
Step 1
Step 2
Step 3
Step 4
7
1
2
To diagnose Aids , scientists need to check for Aids - related
symptomsTo diagnose Aids , scientists need to check the number ofhelper T - cells
PhysicsAndMathsTutor.com

15
Turn over �
The solution will remain yellow if a person is not infected with HIV. Explain why. [2 marks]
A mother who was infected with HIV gave birth to a baby. The baby tested positive using this test. This does not prove the baby is infected with HIV. Explain why.
[2 marks]
A control well is set up every time this test is used. This is treated in exactly the same way as the test wells, except that blood plasma is replaced by a salt solution.
Use information from Figure 5 to suggest two purposes of the control well. [2 marks]
0 7 . 2
0 7 . 3
0 7 . 4
1
2
The HIV antibody isn't present and so the second
antibody and it's attached enzyme wont be present, andso the person is not infected with HIV .
PhysicsAndMathsTutor.com

16
Figure 6 represents part of a DNA molecule.
Draw a box around a single nucleotide. [1 mark]
Table 4 shows the percentage of bases in each of the strands of a DNA molecule.
Table 4
DNA strand Percentage of each base
A C G T
Strand 1 16
Strand 2 21 34
Complete Table 4 by adding the missing values. [2 marks]
8
0 8 . 1
0 8 . 2
34 21 29
29 16
PhysicsAndMathsTutor.com

17
Turn over �
During replication, the two DNA strands separate and each acts as a template for the production of a new strand. As new DNA strands are produced, nucleotides can only be added in the 5’ to 3’ direction.
Use Figure 6 and your knowledge of enzyme action and DNA replication to explain why new nucleotides can only be added in a 5’ to 3’ direction.
[4 marks]
Turn over for the next question
0 8 . 3
[Extra space]
The enzyme used in DNA replication is DNA polymerases . The
enzyme active site is extremely specific in terms ofwhat it can bind to
.
In this case DNA polymerase is
complementaryto the 5' end of the DNA strand ,
and so
as a result, enzyme movement can only occur from
the 5'
to 3' direction
.As the shape of the 5
'
end
and the 3' end differ, the enzyme must move from
a 5'
to 3'
direction in order to remain complementaryto its substrate ie . the DNA strand .
PhysicsAndMathsTutor.com

18
Describe the mass flow hypothesis for the mechanism of translocation in plants. [4 marks]
Scientists measured translocation in the phloem of trees. They used carbon dioxide labelled with radioactive 14C.
They put a large, clear plastic bag over the leaves and branches of each tree and added 14CO2. The main trunk of the tree was not in the plastic bag.
At regular intervals after adding the 14CO2 to the bag, the scientists measured the amount of 14CO2 released from the top and bottom of the main trunk of the tree. On the surface of the trunk of these trees, there are pores for gas exchange.
Figure 7 shows the scientists’ results.
0 9 . 1
[Extra space]
At the source of the plant , photosynthesis is continuouslyoccurring ,
and glucose is produced . Glucose is converted into
sucrose and at a particular point , the companion cells✓
actively transport sugars and sucrose into the phloem/this in fact lowers the water potential inside the phloem 1
sieve cell , and causes water to move into the phloemfrom
the xylem by osmosis .This increases the hydrostatic pressure at
the top of the phloem and causes mass movement of substances to
the sink of the plant. At the sink of the plant , the
substances are used for respiration and storage .
"60hr 86hr
PhysicsAndMathsTutor.com

19
Turn over �
Name the process that produced the 14CO2 released from the trunk. [1 mark]
How long did it take the 14C label to get from the top of the trunk to the bottom of the trunk? Explain how you reached your answer.
[2 marks]
What other information is required in order to calculate the mean rate of movement of the 14C down the trunk?
[1 mark]
Turn over for the next question
0 9 . 2
0 9 . 3
0 9 . 4
respiration
26hours - we found the time between which the' "C label
moved from the peak at the top and bottom of the trunk .
we need to know the length of the trunk from both the
top and bottom .
smoke
PhysicsAndMathsTutor.com

20
E
Figure 8 shows some cells from an onion root tip at different stages of the cell cycle.
Figure 8
Place stages A to E in the correct order. Start with stage D.
[1 mark]
To obtain these images, the onion root tip was cut off, stained and put on a microscope slide. A cover slip was placed on top. The root tip was then firmly squashed and viewed under an optical microscope.
Complete Table 5 to give one reason why each of these steps was necessary. [2 marks]
Table 5
Step Reason
Taking cells from the root tip
Firmly squashing the root tip
1 0
1 0 . 2
1 0 . 1
A C
D
B
D
the1C ,
B,E
,A
obtain an area where
cell division is occurring .
to allow for light to penetratethrough
PhysicsAndMathsTutor.com

21
Turn over �
Figure 9 shows how the amount of DNA per cell changed during interphase and meiosis in an animal.
Explain how the behaviour of chromosomes causes these changes in the amount of DNA per cell between F and G.
[3 marks]
What would happen to the amount of DNA per cell at fertilisation of cell G? [1 mark]
1 0 . 3
1 0 . 4
[Extra space]
The DNA increased due to DNA and✓chromosome
replication . First decrease is due to the homologouschromosomes separating and forming a daughtercells .
The second decrease is due to thesister chromatids separating
the DNA would double and go to 2 arbitrary units
PhysicsAndMathsTutor.com

22
Messenger RNA (mRNA) is used during translation to form polypeptides. Describe how mRNA is produced in the nucleus of a cell.
[6 marks]
1 1 . 1
[Extra space]
Helicase enaymy breaks the hydrogen bandy betweenthe DNA strands . This unzips the DNA , exposing the
nitrogenous bases.One of the DNA strands acts as
a template strand , to which free RNA nucleotides
are attracted to the exposed biases . The free RNAnucleotides and exposed bases are attracted to eachother
by the complementary base pairing relief that Adenine -
thymine and cysteine - Guanine are attracted to each -
other. After the bases have aligned , RNA polymerase
joins RNA nucleotides together. Pre-mRNA is spliced toremove the introns
PhysicsAndMathsTutor.com

23
Turn over �
Describe the structure of proteins. [5 marks]
Question 11 continues on the next page
1 1 . 2
[Extra space]
The primary structure is an order of amino acids thathave undergone a condensation reaction to form apeptide honchoith an adjacent amino acid .
The
secondary structure is formed from the folding of the
polypeptide chain due to hydrogen bonding. The
secondary structure takes the form of either analpha helix or p - pleated sheet . The tertiary structureintroduces 30 - folding due to hydrogen bonding aswell as tonic and disulfide birds .
the quaternarystructure has 2 or more polypeptide chains that
are bonded together with a possibleintroduction oy a protnetic group i. e. iron .
•
polymer of amino acids
PhysicsAndMathsTutor.com
24
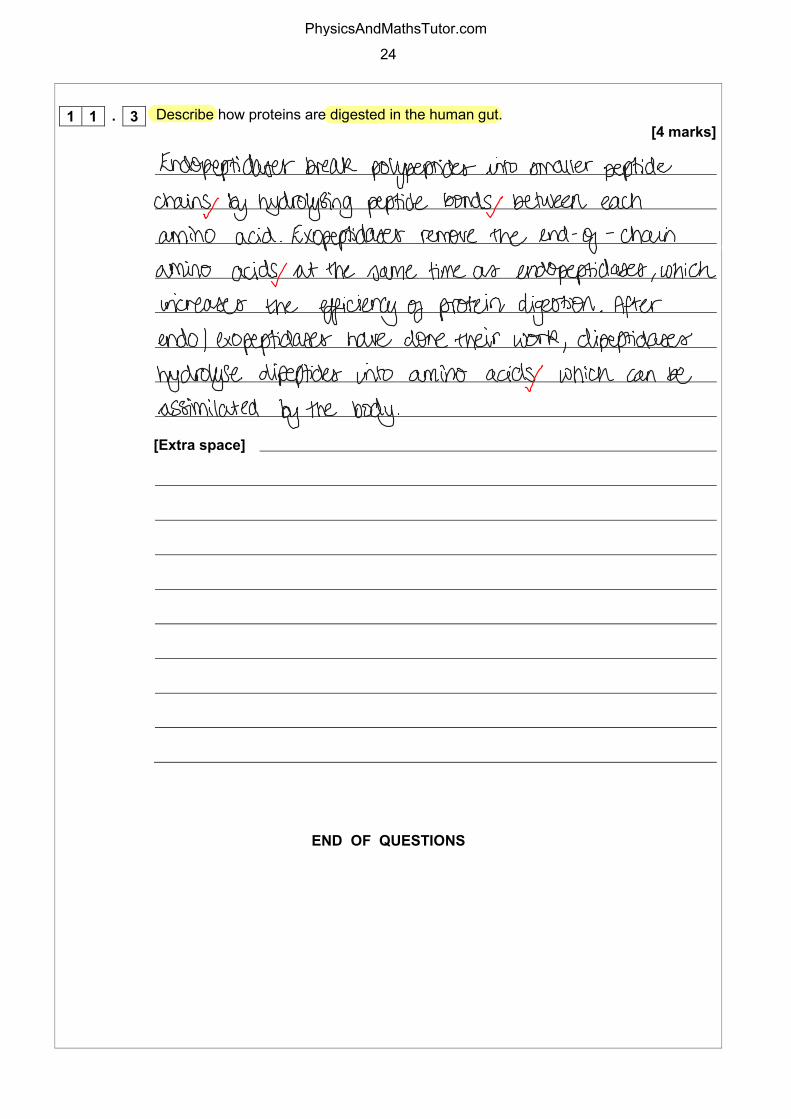
Describe how proteins are digested in the human gut. [4 marks]
END OF QUESTIONS
1 1 . 3
[Extra space]
Endopeptidase break polypeptides into smaller peptidechains by hydrolysing peptide bonds✓ between eachamino acid . Exopeptidase remove the end - og
- chaina
amino acids at the same time as endopeptidase ,whichincreases the efficiency of protein digestion . Afterend01 exopeptidase have done their work , dipeptidase
hydrolyse dipeptides into amino acids which can beassimilated by the body .
I
PhysicsAndMathsTutor.com
25
Turn over �
There are no questions printed on this page
DO NOT WRITE ON THIS PAGE ANSWER IN THE SPACES PROVIDED
Acknowledgement of copyright holders and publishers
Permission to reproduce all copyright material has been applied for. In some cases, efforts to contact copyright holders have been unsuccessful and AQA will be happy to rectify any omissions of acknowledgements in future papers if notified.
Figure 8: All images Ed Reschke/Oxford Scientific/Getty Images
Copyright © 2014 AQA and its licensors. All rights reserved.
PhysicsAndMathsTutor.com