A Laboratory Study on the Phase Transition for Polar Stratospheric ... · Transition for Polar...
60
NASA Contractor Report 198056 #' A Laboratory Study on the Phase Transition for Polar Stratospheric Cloud Particles Edward H. Teets, Jr. NASA Contract NAG-2572 March 1997 National Aeronautics and Space Administration https://ntrs.nasa.gov/search.jsp?R=19970014216 2018-07-30T06:43:39+00:00Z
Transcript of A Laboratory Study on the Phase Transition for Polar Stratospheric ... · Transition for Polar...
NASA Contractor Report 198056
#'
A Laboratory Study on the PhaseTransition for Polar StratosphericCloud Particles
Edward H. Teets, Jr.
NASA Contract NAG-2572March 1997
National Aeronautics and
Space Administration
https://ntrs.nasa.gov/search.jsp?R=19970014216 2018-07-30T06:43:39+00:00Z

NASA Contractor Report 198056
A Laboratory Study on the PhaseTransition for Polar StratosphericCloud Particles
Edward H. Teets, Jr.
University of RenoReno, Nevada
Prepared forNASA Dryden Flight Research CenterEdwards, CaliforniaUnder NASA Research GrantGrant NAG-2572
National Aeronautics and
Space Administration
Dryden Flight Research CenterEdwards, California 93523-0273


CONTENTS
ACKNOWLEDGMENTS .................................................................... vi
ABSTRACT .............................................................................. 1
NOMENCLATURE ........................................................................ 1
CHAPTER 1: INTRODUCTION .............................................................. 2
CHAPTER 2: THE ATMOSPHERE ........................................................... 3
Observation of Stratospheric Clouds ........................................................ 4
Aerosol Layer .......................................................................... 6
Polar Stratospheric Cloud Formation ........................................................ 7Particles in Solution .................................................................... 11
Deliquescence ..................................................................... 11Particle Growth: Influence of Solute .................................................... 11
Particle Growth: Influence of Curvature ................................................. 12
Gibbs Free Energy ..................................................................... 14
Effect of Relative Humidity .............................................................. 14
Growth Rate Factors .................................................................... 15
What the Experiment Will Show .......................................................... 16
CHAVI_R 3: EXPERIMENTAL PROCESS .................................................... 16
Characterizing the Solutions .............................................................. 18
Supercooling the Solution ................................................................ 18
Crystal Growth Rates ................................................................... 19Mixed Solutions ....................................................................... 20
Aircraft Soot Mixtures .................................................................. 20
CHAPTER 4: EXPERIMENTAL RESULTS .................................................... 20
Growth vs. Tube Diameter ............................................................... 20
Supercooling and Growth ................................................................ 28Salts ............................................................................. 28
Acids ............................................................................ 29
Growth Rate at High Concentration ..................................................... 31Mixtures of Acids ...................................................................... 33
Addition of Non-Soluble Material ......................................................... 36
CHAPTER 5: DISCUSSION OF RESULTS .................................................... 36
Diffusion Chamber ..................................................................... 41
Recommendations ...................................................................... 41
Conclusions ........................................................................... 41
Implications .......................................................................... 42
BIBLIOGRAPHY ......................................................................... 45
iii

APPENDIXA:CHEMICALREACTIONSWHICHPRODUCESULFURICACID .................... 48
APPENDIXB:PHOTOCHEMICALREACTIONSLEADINGTONITRICACIDFORMATION......... 49
APPENDIXC:THERMALPROPERTIESOFCOMMONSUBSTANCES........................... 50
TABLES
1. Propertiesof thepolarstratosphericparticles................................................ 8
2. Relativehumiditiesof phasetransition.(Twomey,1977)...................................... 12
A-1. Vaporpressures(mmHg)H2SO4andH20insolution.(GmitroandVermeulen,1964).............. 48
C-1. Thermalpropertiesof commonsubstances.(CarslawandJaeger,1959).......................... 50
FIGURES
1. Standard temperature profile. (U. S. Standard Atmosphere, 1976) ................................ 3
2. Schematic representation of solar occultation technique employed by the Nimbus 7SAM II instrument. (Hamill and McMaster, 1983) ............................................ 4
3. Nitric acid concentration as a function of altitude and latitude. (Cadle, et al., 1973) .................. 5
4. Mixing ratio profiles of large particles, r > 0.15 gm, 1972-73. (Hofmann, et al., 1975) ................ 7
5. Steps leading to formation of PSCs and those leading to the possible ozonedestruction. (Hamill and Toon, 1991) ....................................................... 8
6. Weight composition and maximum supercooling of sulfuric acid droplet as a function
of temperature. (Steele and Hamill, 1981; Hallett and Lewis, 1967) ............................... 9
7. Differences in growth of aqueous solution droplets of H2SO4. The dry size is indicatedon each curve. (Nair and Vohra, 1974) ..................................................... 13
8. Gibbs free energy plot showing the critical radius growth. (Twomey, 1977) ........................ 14
9. Equilibrium relative humidity (RH) line of a saturated solution against temperature--a
curve which also represents the transition line between the regions of solid and
solution. (Twomey, 1977) ............................................................... 15
10. Illustration of the experimentation setup ................................................... 17
11. Tubing diameter in supercooling for 1 m solution of ammonium sulfate at a temperatureof about -11 °C (7.3 K supercooled) ...................................................... 21
12. Growth rates as a function of tube diameter and temperature. Equilibrium ice-solution
temperature is shown at-4 °C ........................................................... 21
13. (a-c). Crystal growth of a 1 m solution of ammonium sulfate in a 4.0 mm diameter tube
at 4.0 K supercooled at 7, 11 and 16 sec .................................................... 22
13. (d-f). Crystal growth of a 1 m solution of ammonium sulfate in a 4.0 mm diameter tube
at 9.0 K supercooled at 2, 4 and 6 sec ...................................................... 23
13. (g-i). Crystal growth of a 1 m solution of ammonium sulfate in a 4.0 mm diameter tube
at 12.0 K supercooled at 1, 2 and 4 sec ..................................................... 25
iv

13. (j). Crystal shapes as a function of concentration and supercooling. (Wedum, 1979) ................. 26
14. Growth rate errors due to uncertainties in stop-watch timing at low supercooling ................... 27
15. Growth rate errors due to uncertainties in stop-watch timing at high supercooling ................... 27
16. Growth velocity as a function of molality and temperature for sodium chloride;
freezing point depression is 3.37 K per 1 m ................................................. 28
17. Growth velocity as a function of temperature and molality for ammonium sulfate; with growth
rate for pure water; equilibrium freezing point depression is 3.86 K at 1 m ........................ 29
18. Growth velocity as a function of temperature and molarity for ammonium bisulfate; freezing
point depression is 3.8 K at 1 m .......................................................... 30
19. Growth velocity as a function of temperature and molarity for nitric acid; freezing point30
depression is 3.6 K at 1 m ...............................................................
20. Growth velocity as a function of temperature and molarity for sulfuric acid; freezing point
depression is 3.8 K at 1 m ............................................................... 31
21. (a-b). Growth velocities for nitric acid and 3H20 hydrate crystals as a function of supercoolingand molarities. Equilibrium temperatures are -30 °C for 40%, -20 °C for 48%, -20 °C for 52%,
and -22 °C for 62% by weight. (Picketing, 1893) ............................................ 32
22. Equilibrium freezing temperatures and experimental data showing temperatures andmolarity where nucleation was initiated. (Picketing, 1893) ..................................... 33
23. Equilibrium freezing temperatures and experimental data showing temperatures and
molarity of nucleation. Triangles indicate points where nucleation was not initiated.
(Gable, et al., 1950) ................................................................... 34
24. Growth velocity curves for 80% and 95% HNO3 and 20% and 5% H2SO4 mixtures at 1 m ........... 35
25. Growth velocity curves for 80% and 95% HNO 3 and 20% and 5% H2SO 4 mixtures at 3 m.Curves also show the growth velocities for the same mixtures with a small amount ofsoot added ........................................................................... 35
26. Growth velocity as a function of supercooling for sodium chloride ............................... 37
27. Growth velocity as a function of supercooling for ammonium bisulfate ........................... 37
28. Growth velocity as a function of supercooling for ammonium sulfate ............................. 38
29. Growth velocity as a function of supercooling for nitric acid ................................... 38
30. Growth velocity as a function of supercooling for sulfuric acid .................................. 39
31. (a-c). Kohler curves for ammonium sulfate, nitric acid and sulfuric acid with molar andmolal concentrations indicated ........................................................... 42
B-1. Photochemical lifetime of HNO3 for winter, as calculated by Garcia-Soloman (1983) as afunction of altitude and latitude .......................................................... 49

ACKNOWLEDGMENTS
The research was supported by National Aeronautics and Space Administration (NASA) Research Grant
NAG-2572.
I would like to thank Dr. John Hallett for being a terrific advisor with the insight and knowledge to lead me
through the completion of this thesis. Also, I would like to thank Dr. Alan Gertler and Dr. John Frederick for their
willingness to serve on my committee and help me when I had questions.
I would also like to thank Bill McCain of PRC Inc. and L. J. Ehrenberger of NASA Dryden Flight Research
Center for giving me encouragement, and work experience while continuing my education.
To my parents, Edward and Lynn Teets, for their unconditional support and encouragement through my school
and life. Without these two great people this thesis would not be possible.
Last but not least, I would like to thank my wife Elisa Olson Teets for her patience and support during my
graduate study.
vi

ABSTRACT
The nucleation and growth of different phases of simulated polar stratospheric cloud (PSC) particles were
investigated in the laboratory. Solutions and mixtures of solutions at concentrations 1 to 5 m (molality) of
ammonium sulfate, ammonium bisulfate, sodium chloride, sulfuric acid, and nitric acid were supercooled to
prescribed temperatures below their equilibrium melting point. These solutions were contained in small diameter
glass tubing of volumes ranging from 2.6 to 0.04 ml. Samples were nucleated by insertion of an ice crystal, or in
some cases by a liquid nitrogen cooled wire. Crystallization velocities were determined by timing the crystal growth
front passages along the glass tubing. Solution mixtures containing aircraft exhaust (soot) were also examined.
Crystallization rates increased as AT2, where AT is the supercooling for weak solutions (2 m or less). The higher
concentrated solutions (>3 m) showed rates significantly less than AT2. This reduced rate suggested an onset of a
glass phase. Results were applied to the nucleation of highly concentrated solutions at various stages of polar
stratospheric cloud development within the polar stratosphere.
NOMENCLATURE
A
a
AAOE
ACS
b
CCN
CFC
D
DFRC
e
e'
es
hv
JPL
Kf
M
m
ms
n
NO
no
NAT
NMR
OCS
P
PSC
constant for a given substance
a function of the environment variable, 2_/PLRvT
Airborne Antarctic Ozone Experiment
American Chemical Society
variable, 3imv/ 4rcP Lm s
condensation cloud nuclei
chlorofluorocarbons
diameter
NASA Dryden Flight Research Center, Edwards, California
inverse of natural log, 2.71828
vapor pressure over the solution
vapor pressure of the pure solution
solar energy, nm
Jet Propulsion Laboratory
freezing point depression constant
mass
moles of solute per kilogram of solvent
mass of solute, K
moles of solute
number of effective solute molecules of mass
moles of solvent
nitric acid trihydrate
number mixing ratios
carbonyl sulfide
best fit slope of the growth velocity on a log-log plot
polar stratospheric cloud

?.
Rv
RH
SAM II
SAT
T
Vr
AG
AT
Arln
K
PL
"C
radius
universal gas constant
relative humidity
Stratospheric Aerosol Measurement II
sulfuric acid tetrahydrate
temperature
growth velocity, cm sec -1
Gibbs free energy
degree of supercooling for weak solutions
temperature freezing point depression
viscosity
thermal diffusivity of glass or liquid, cm 2 sec -1
density of the liquid
surface tension
thermal equilibrium
CHAPTER 1: INTRODUCTION
Nucleation and growth of polar stratospheric cloud (PSC) particles has become of great interest because of the
recent discovery of the PSC link to ozone destruction. PSCs form in the polar vortices, on H2SO4-nH20 nuclei
particles. This process occurs by the deliquescence of nitric acid (HNO3) and water (H20) onto these particles as
the temperatures in the stratosphere drop during the Arctic or Antarctic winters. A knowledge of the stratospheric
aerosol nucleation process and how these particles grow is an important aspect in understanding the formation of
these clouds. In general, the nucleation process is dominated by the presence of impurity nucleation, which prevents
the occurrence of substantial supercooling. However, on occasion nucleation can be initiated in the absence of
impurities by growth from large clusters of atoms and molecules. This is homogeneous nucleation of the substance
by itself, as opposed to heterogeneous nucleation by impurity.
In the laboratory experimental techniques for the study of nucleation processes follow the simple method of
taking smaller and smaller samples until the probability of having impurity-induced heterogeneous nucleation is
reduced to insignificant levels. Nature applies this technique very effectively in clouds in the atmosphere, which
contain liquid water or solution droplets less than about 10 gm in diameter. Studies have shown these droplets can
be supercooled to -40 °C. This is in contrast to that of freezing a bucket of water which normally occurs at less than
a few degrees of supercooling. Consideration must be given to the nucleation of concentrated sulfuric and nitric acid
mixtures in high level polar stratospheric clouds whose particles can remain liquid to temperatures far below -50 °C.
This study is concerned with understanding the phase change of solution droplets in high level clouds and their
subsequent crystal growth. The emphasis is concerned with specific metastability and phase changes, not only in
PSC but in all aerosols. In the lower atmosphere the aerosols consist of mixtures of ammonium sulfate, ammonium
bisulfate, sodium chloride and others. In the stratosphere, at PSC levels, aerosols are comprised mainly of sulfuric
and nitric acid from volcanic injection or from upward diffusion from the lower atmosphere. It is these aerosols that
are suspected of catalyzing ozone destruction reactions by adsorption on the surfaces of crystallized particles. For
high concentrations of acids, viscosity increases to give the droplet the appearance of a glass at sufficiently low
temperatures, limiting the internal diffusion of adsorbed trace components.

Majorquestionsariseconcerningtheextenttowhichsuchparticlessupercoolpriorto crystallization,thenatureof thecrystallizationprocessitselfin thesedroplets,andthenatureof subsequentgrowthfromvapordependingonenvironmentalconditions--temperatureandvaporpressure.Thephaseof theparticleis importantin determiningtheroletheseparticlesserveaseitheragrowthnucleusorasubstratefor adsorption/absorptionof tracechemicalspeciesandheterogeneouscatalysis.
Literaturepertinentto theformationof PSCsandthephysicalrelationshipsinfluencingnucleationandaerosolgrowthisreviewed.Experimentstoexhibittheinfluencesofcompositionandtemperatureonnucleationandcrystal
growth rates for solution of sulfuric acid (H2SO4), nitric acid, ammonium sulfate, ammonium bisulfate, and sodium
chloride are described, together with recommendations for future research.
CHAPTER 2: THE ATMOSPHERE
The vertical distribution of temperature for a "standard atmosphere" is shown in figure 1. This profile is
representative of typical conditions in the middle latitudes. As indicated in the figure, the vertical profile can be
divided into three distinct layers: troposphere, stratosphere, and mesosphere. The tops of these layers are called the
tropopause, and stratopause, respectively.
The troposphere (literally, the turning or changing sphere) accounts for more than 80% of the mass and virtually
all the water vapor, clouds, and precipitation in the earth's atmosphere. It is characterized by rather strong vertical
mixing; for example, in clear air it is not unusual for an air parcel to traverse the entire depth of the troposphere over
the course of a few days. The transition from the troposphere to the stratosphere is usually marked by an abrupt
change in the concentrations of some of the variable trace constituents; water vapor decreases sharply while ozone
concentration often increases by an order of magnitude within the first few kilometers above the troposphere. These
strong gradients just above the tropopause are a reflection of the fact that there is relatively little mixing between the
dry ozone-rich stratospheric and the relatively moist ozone-poor tropospheric air.
80
70 Me_60
E 50 S.tra.to.paus.e. _______________________,
40
20 ........................
Tro.p.o.p.lo
Troposphere
0 '" "' I'''' I''''1'' '" I''''1''''1'' '' I''''1''''1'' "' I''''
-90 -80 -70 -60 -50 -40 -30 -20 -10 0 10 20
Temperature (Celsius)
Figure 1. Standard temperature profile. (U. S. Standard Atmosphere, 1976)

Thestratosphere(literally,thelayersphere)ischaracterizedbyveryweakverticalmixing.Aerosols,in stratifiedlayers,areobservedto persistfor longperiodsof timewithina limitedaltituderange.It iswithinthestratospherewherethemuchpublicizedandveryimportantprotectiveozonelayerexists.Thisozonelayerabsorbsalargeamountof theharmfulultra-violetradiationandpreventsit fromreachingtheearth'ssurface.Consequently,absorptionoftheultra-violetradiationheatsthestratosphericair.Thisabsorptionis thereasonfor increasingtemperaturewithheight.Thetemperaturemaximumgenerallyexistsnear50km. In contrast,duringthepolarwintermonthsataltitudesof 10-15km,thelowerstratosphereprovidesthecoldesttemperatures,173K (-100°C).ThisstudywillcenterontheprocessesthatleadtoPSCformationin theseregions.
Observation of Stratospheric Clouds
Stratospheric clouds have been observed for over a hundred years over the poles during their respective
winter months. However, with the introduction of the satellite age and the launching of Stratospheric Aerosol
Measurement II (SAM II) on the Nimbus 7 spacecraft in 1978, the age of understanding stratospheric aerosol and
polar stratospheric clouds began. Detection of clouds was accomplished by the SAM II basic data product--an
extinction profile. New investigations have shown that cloud particles are a relatively common phenomena during
the Antarctic winters below 25 km, and have a highly negative correlation to temperatures T < 195 K (McCormick,
et al., 1982). In the past, these clouds were usually observed over land. However, for the first time, SAM II observed
clouds where no land existed and which could not be seen from the ground. Researchers were first confused by
observance of these clouds at these locations because this eliminated the possibility these clouds were nacreous or
mother-of-pearl by nature, which are a form of wave cloud that require mountains for the necessary lift. Also of
interest was the equal distribution of clouds throughout Antarctica, Greenland, Canada, and Scandinavia during the
polar winters (Steele, et al., 1983). Figure 2 shows a schematic representation of solar occultation, used in
determining the extinction as the Nimbus 7 spacecraft passed through sunrises and sunsets at a given altitude.
It was first thought that stratospheric clouds formed rapidly by deposition of water vapor onto sulfuric acid
aerosol surfaces when the temperature fell below the frost point of water, approximately -90 °C, as observed with
nacreous clouds (Steele, et al., 1983). Extensive work by Mastenbrook in 1968 determined the normal stratospheric
water vapor mixing ratio existed around 5 ppmv (3 x 10⁻⁶ mixing ratio), or about 1% relative humidity plus an
error of measurement. Simple atmospheric models by Hamill, Turco, and Toon (1988) suggest that clouds formed
by a 5 ppmv mixing ratio would have an extinction of 0.2 km -1 by the time the temperature dropped to 184 K,
SUN.-..P,-
Figure 2. Schematic representation of solar occultation technique employed by the Nimbus 7 SAM II instrument.
(Hamill and McMaster, 1983)
4

assumingall aerosolswereconvertedto ice.If only0.1%of theaerosolsgrowlarge,theextinctionwouldrangefrom10-2to 10-3km-1.Observationsof thesecloudsin thestratospherebySAMII begantoraisemanyquestionson thewatervaporcontentof thestratospheresincedatapreviouslyobtainedby SAM II indicatedextinctionsbetween10-2and10-3km-1,andonly10%beingabove10-2km-1.However,satelliterecordsfortheseextinctionsonlyobservedtemperaturesbetween190and200K,whichis toowarmto sustainwatericeformation.As aresultof thesatellitedata,theseclouds,nowconsideredTypeI PSCs,wereof considerableinterestuntil it wassuggestedbyCrutzenandArnold(1986)andToon,etal.(1986)thatthesecloudsmightconsistofcondensednitricacidin theformofcrystallinenitricacidtrihydrate(HNO3"3H20),astableformatthesetemperatures.
Aspartof ongoingstudiesintothegrowthandformationprocessesofPSCs,it isnowbelievedthatthisprocessconsistsofmanystages.Theformationandmultistagegrowthideaincludes;(1)theprecursorstageof supercooledliquidH2SO4-H20aerosol(Steele,etal.,1983);(2)anintermediatestageinwhichHNO3andH20 vaporsareco-depositedontofrozenaerosolnucleiasnitricacidtrihydrate(HNO3"3H20)(Toon,etal.,1986);and(3)afinalstageof coupleddepositionof HNO3"3H20andpurewaterice.Eachstageof particlegrowthis directlyrelatedtotemperature.To complicatematters,thereis evidencethatsulfuricacidparticlesmaynot freezeat temperaturesabove195K. At thesetemperaturestheparticleswouldbehighlysupercooledandit is reasonableto assumetheformationof adropletwouldbecomprisedof H2SO4-HNO3-H20.However,extrapolatedvaluesof vaporpressureindicatethat very little nitric acid could be incorporatedinto suchparticles(Hamill and Toon, 1991).
In 1987,NASAaircraftflew throughstratosphericcloudsduringtheAirborneAntarcticOzoneExperiment(AAOE)tocollectcloudparticlesonimpactorsandfilters.Pueschel,etal. (1992)ofNASAAmesResearchCenter,analyzedfilterscoatedwithnitron,aprecipitatingagentfornitrates.Thereactionobservedwithcloudparticlesandnitronleadto thegrowthofnitronnitrate,thusconfirmingthepresenceofnitricacidin thestratosphere.Thisstudyhowever,wasunableto determinewhetherthepolarstratosphericcloudparticleswerefrozenor liquid. It wasdeterminedthatwithin thepolarstratospherethereexistsabout10timesmorenitricacidthansulfuricacid.Cadle,etal. (1973)studiedtheamountof nitricacidpresentwithinthestratosphereasafunctionof latitudeandaltitude,asfigure3illustrates.
3O
E
2O
10
0
31.2 deg
64 deg
m g m m
2 4 6 8 10
HNO3 ppbm
Figure 3. Nitric acid concentration as a function of altitude and latitude. (Cadle, et al., 1973)

Aerosol Layer
The existence of particles in the stratosphere has been inferred for many years from atmospheric optical effects
such as unusual sunsets, mother-of-pearl and noctilucent clouds. The persistence of these optical effects lasting years
is explained by a significant amount of particles remaining above the tropopause where downward mixing,
turbulence, and washout are nearly non-existent after a major volcanic eruption, such as Mt. Pinatubo in 1991. What
has been known is that stratospheric aerosol particles can produce spectacular optical displays such as brilliant
sunsets and unusual ring coloration of the sun and moon (Hamill, et al., 1977).
In the late fifties, Junge, et al. (1961) flew a balloon-borne condensation nucleus counter through the 15-20 km
levels and discovered that the stratospheric aerosol layer, or Junge layer, was consistent in its behavior and existed
world-wide. Since that time, with the aid of improving techniques and better measurement platforms, this discovery
was confirmed, although the behavior and consistency, size and concentration, have been proven more variable than
was first thought.
The most predominant constituent of stratospheric aerosols, identified by Junge, et al. (1961), is sulfur
containing compounds. Particles collected by Junge, et al. (1961) were subjected to fluorescence analysis and found
to produce x-ray spectra showing a strong peak at the sulfur K c_ line, a strong, fairly unambiguous indication of
sulfur. Following the 1963 eruption of Mt. Agung, it was discovered that most of the stratospheric particles collected
during research were liquid (Rosen, 1964). The most probable liquid at the very low stratospheric humidity was
obviously sulfuric acid.
Friend, et al. (1973) suggest the oxidation of sulfur dioxide (SO2) to sulfur trioxide (SO3) with water vapor is
the primary formation mechanism of stratospheric particles, H2SO4. The main source of sulfur dioxide in the
stratosphere is from injection of violent volcanic eruptions (Hamill and Toon, 1991) which subsequently became
oxidized to SO 3. However, with the emergence of the industrial age many anthropogenic pollutants, such as
hydrogen sulfide (H2S) and sulfur trioxide (SO3), were released into the atmosphere, providing additional sulfur
compounds which eventually were transported into the lower stratosphere. More recently, exhausts of rockets and
aircraft have also contributed a variety of gases and aerosols into the stratosphere. Sulfur laden compounds are
converted to sulfuric acid (H2SO4) through photochemical reactions. Appendix A illustrates the photochemical steps
in the production and destruction of sulfuric acid as well as thermodynamic and other important properties. When
in the presence of enough water vapor and significantly cold temperatures, these vapors will eventually condense,
forming small sulfuric acid solution droplets.
Stratospheric aerosol particles are usually found in highly stratified layers beginning near the top of the
tropopause and extending up to 30 km or more. The height and thickness of the aerosol layers are quite variable,
exhibiting temporal and latitudinal trends, as well as an apparent correlation with tropopause height (Rosen,
et al., 1975). The particles are typically 0.1 to 0.3 gm in diameter and are present at number mixing ratios (NMR,
number per milligram of air) of -60 per milligram (Junge, et al., 1961). In addition, this layer has a marked large
particle, >0.3 gm diameter, and mixing ratio with a maximum located 6-11 km above the tropopause. Figure 4
shows two typical large particle mixing ratio profiles measured at mid-latitudes during 1972-73, showing clearly a
maximum in the large particle region. The maximum particle concentration lies in the range of 4-12 per milligram
(about 0.4-1.2 particles cm -3 at 20 km), falling off to 1.0 per milligram at higher and lower altitudes. This large
particle mixing ratio is observed to increase considerably after a volcanic eruption that has plumes penetrating into
the stratosphere. However, within 6 months these NMR levels decrease to prevolcanic levels. As observed above,
there are significantly more smaller particles than larger particles; however, the larger particles are of more interest
since their cross section is responsible for light scattering, and the larger particles act as cloud condensation nuclei.

30
25
A
E
• 20"0,,==<.,
,b.,
15
100 5 10 15
Mixing ratio, number/mg
Figure 4. Mixing ratio profiles of large particles, r > 0.15 [tm, 1972-73. (Hofmann, et al., 1975)
Hamill, et al. (1982) have implied from their research that there must be other sources of particles outside of the
stratosphere when volcanic activity is small, providing the nuclei to maintain the Junge layer. Such possible sources
are condensed meteoritic vapor and particles transported from the troposphere (Hunten, et al., 1980). Measurements
of particles provide evidence against meteoritic vapor below 25 km (Hamill, et al., 1982). Although Hamill,
et al. (1982) and others have suggested that the troposphere could provide a source of nuclei for stratospheric
aerosols, there is only limited observational evidence for tropospheric particles entering the lower stratosphere
(Goodman, et al., 1989). Evidence shows that only H2SO 4 would be produced, and only at the high tropical
tropopause where temperatures often reach -80 °C. It is conceivable, however, at these conditions, tropospheric
aerosols such as sodium chloride, ammonium sulfate, and ammonium bisulfate may be transported into the
stratosphere by the deep convective system within the tropics. At those temperatures these particles may act as
condensation nuclei for sulfuric acid vapor. Sodium chloride, ammonium sulfate, and ammonium bisulfate in the
troposphere act as cloud condensation nuclei for cirrus and contrails.
Polar Stratospheric Cloud Formation
Although much is yet to be understood, many new studies are slowly revealing the nature of the formation
mechanisms of stratospheric aerosols, nitric acid clouds, and water-ice polar stratospheric clouds. Cloud physicists
do, however, consider the important microphysical processes to be nucleation, condensation and evaporation,
coagulation and sedimentation. Figure 5 shows steps leading to the formation of the PSC particles. Our interest in
these clouds resides mainly in their formation and growth processes and as catalysts for chemical reactions leading
to a reduction in the ozone concentrations in the stratosphere (Cadle, et al., 1973).
In the PSC formation process two fundamental questions come to mind. First, how do the background sulfate
aerosols serve as condensation nuclei for water and nitric acid vapor (Toon, et al., 1989)? It is presently unclear as to
when in the sequence of events the sulfate aerosols become active, providing a nuclei for HNO3 and water droplets.
Second, once these droplets form, do they freeze forming nitric acid trihydrate (NAT) particles (Type I PSC) or

.oc ssE
°O
0 Hz00 H
Type- II cloud SedimentationHzSO4 aerosol nucleation andgrowth Type-I cloud formation formation and
deni tri fi cati on
b _/jCH 4 hvCHEI'4CAL PR;vCESSES
clo.o
ClzO 2NO z JCIONOz
Form ati on of Incorporati on of HCI and HNO_ Reparti oni ng of Catalyti c cycle ofPhotod ss oci ati on reservoir s peci es into type- I parti cl es res ervoi r species ozone depl eti on
Figure 5. Steps leading to formation of PSCs and those leading to the possible ozone destruction. (Hamill and
Toon, 1991)
remain supercooled as nitric acid droplets? Type I PSCs are considered by many scientists to be the most important
phase in PSC development. It is during this phase of growth that the particles are subjected to additional
microphysical processes transforming these clouds into nitrogen sinks, required for ozone destruction. In addition,
as temperatures fall below Type I PSCs, deliquescence temperature deposition of water vapor dominates the PSC
growth, producing a particle consisting predominantly of water ice (Type II PSC). During this phase, the particles
produced can grow large enough to settle out of the lower stratosphere, dehumidifying and denitrifying the
stratosphere. Table 1 lists the properties of the stratospheric particles during each phase.
Table 1. Properties of the polar stratospheric particles.
Size
Composition Form (gm) Temp (K) Location Source/Area
60-80% H2SO4 liquid 0.01-1.0 195-240 global OCS* (1 gm2/cm 3)
(could be as low as (perhaps Volcanoes (100 gm2/cm 3)
40 wt% H2SO 4) solid also) Aircraft (sulfur in fuels)
HNO3/H20 solid 0.3-3.0 <195 OCS (1 gm2/cm 3)
(approx 50/50 wt%) N20 aircraft (NOx)
(Type I PSC)
H20/ice solid <187
(Type II PSC)
1-100
(up to 1000for wave clouds)
polar winter
polar winter OCS (10 gm2/cm 3)
H20, CH4
*Carbonyl Sulfide (OCS) was coined by Crutzen in 1976, referring to a water-insoluble and chemically inert
compound.

Althoughthestratosphereismuchcleanerthanthetroposphere,it containsasignificantamountof suspendedparticulatematter,namelytheaerosollayercontainingsulfuricaciddroplets.Undernormalstratosphericconditions(20km altitudeand220 K temperature)thesulfateaerosolhasanaveragediameterof about0.15_tmandacompositionof 75%H2SO4and25%H20.At thesetemperatures,theseparticlesaremostlikely tobesupercooledliquiddrops.Sincetherelativehumidityin thestratosphereisabout1%,it iseasytoshowthattheenvironmentmustbecooledto about188K beforewatervaporwill condenseformingicecrystals.
Theequilibriumcompositionof a droplet of sulfuric acid depends on concentration and temperature• The
particles in the stratosphere are constantly being bombarded by vapor of sulfuric acid and water molecules, some of
which get absorbed• At the same time, both sulfuric acid and water molecules are evaporating from the droplet. As
long as both processes are occurring, the droplet remains in equilibrium. In the stratosphere there are 108 times more
water vapor than sulfuric acid vapor, therefore the particle will reach equilibrium with water much more quickly thanwith sulfuric acid. It is much easier for the droplet to be in equilibrium with water because every time a molecule is
absorbed one molecule evaporates. However, when a sulfuric acid molecule is absorbed, the composition changes
slightly and the molecule must absorb a water molecule to remain in equilibrium• This leads to a very slow growth
by condensation. As the environment turns colder, the droplet becomes more dilute as it absorbs water and grows
larger. As the temperature falls during the polar night, reaching <195 K, the droplets swell to nearly twice their
original size, and change in concentration from 75% to less than 50% by weight• Figure 6 illustrates the dilution
curve of a sulfuric acid droplet with decreasing temperature for a fixed 5 ppmv water vapor mixing ratio (Steele and
Hamill, 1981).
Since the droplet is supercooled throughout this entire process, we must consider the possibility that the droplet
will freeze before it becomes too dilute• Pruppacher and Neiburger (1963) showed that a solute will enhance the
24O
Z20
LIJ
I--< 210rr"Lid
n
tLl1---
zoo
190
160
| I i
\
-- \
"\\
\\
I I I i ; i
\%
\\\\
_I H20
/ (5 ppmv)
/I I
_-Maximum Supercooling
I I } I I I ! I I
20 40 60
WEIGHTPERCENTAGEHzSO4
t
0 ioo
Figure 6. Weight composition and maximum supercooling of sulfuric acid droplet as a function of temperature.
(Steele and Hamill, 1981; Hallett and Lewis, 1967)

supercoolingof purewaterandtheresultantsupercoolingwill bethesumof themaximumsupercoolingandtheequilibriumfreezing-pointdepressionduetothesolute.HallettandLewis(1967)assumedthesupercoolingofdilutesulfuricaciddropletsin thestratospherecouldbeverylarge.In figure6,thedashedlineshowstheHallettandLewiscurveforsupercooledsulfuricacid.BasedontheworksofHallettandLewis(1967),andthechangeinconcentrationbySteeleandHamill(1981),homogeneousfreezingofsulfuricacidcanbeexpectedwherethetwolinescross,about189K.Freezingofthedropletcouldoccuratwarmertemperaturesbyheterogeneousnucleation,i.e.,nucleationonaforeignbodysuchasanicecrystal.CrutzenandArnold(1986)suggestthatasthetemperaturefallsbelow191K,theH2SO4/arI20 solution droplets will most likely be frozen, forming sulfuric acid tetrahydrate (SAT), based onobservation which shows cirrus-like particles near 191 K. Due to their small sizes, there is no direct method to
determine if they are in a solid phase. There is an indirect piece of evidence for solid phase; Lidar observations show
large polarization values representative of nonspherical particles. This evidence only proves that solid particles are
present and fails to prove that liquid particles do not exist.
Shortly after the discovery of the ozone hole in Antarctica in 1985 by Farman, et al., and cloud extinctioncoefficient observations from SAM II, it was postulated by Toon, et al. (1986), and Crutzen and Arnold (1986), that
the PSC cloud observed might be composed of condensed nitric acid trihydrate (NAT) or Type I PSC. Hanson and
Mauersberger (1988) in a series of laboratory studies, provided in detail the composition and vapor pressure of the
trihydrate and monohydrate at conditions observed in the stratosphere. These studies have led them to the conclusion
that the nitric acid trihydrate hydrate is the most stable at stratospheric conditions. Calculations by Toon, et al. (1986)
also suggest that the nitric acid monohydrate may be neglected since the ambient HNO3 vapor pressures are much
too low for the monohydrate formation at typical stratospheric temperatures. Nitric acid is formed by photochemical
reaction of reactive NOx compounds (NO, NO2, and N205) and water vapor. These compounds are produced by
natural and man-made processes. Appendix B illustrates the photochemical equations involved in the production and
destruction of nitric acid, along with other important properties of nitric acid.
The growth for Type I PSCs is considered the same as for the sulfate aerosols. That is, they are most likely in
equilibrium with water vapor and grow only when nitric acid molecules impinge on the droplet. The formation of
nitric acid PSCs in the stratosphere probably does not consist of the freezing of pre-existing supercooled nitric acid
droplets. It seems more likely that the PSC evolves from condensation of HNO3 and H2 O vapor onto existing frozen
or supercooled particles, most likely of sulfate aerosols. According to Hanson and Mauersberger (1988), the
saturation of HNO3 with respect to NAT is expected at temperatures around 195-196 K for normal stratospheric
concentrations at 50 mb.
In addition to the nitric acid trihydrate cloud, another type of cloud can form. This type occurs when the
Antarctic winter temperatures fall below 190 K. As the air cools, water vapor condenses on some of the suspended
particles, forming water-ice clouds (Type II PSC). The seed particles for these clouds are the nitric acid particles,
which have themselves grown on sulfuric acid particles. These clouds, although rare, must be given some
consideration since it is these cloud particles that grow quite large (10-100 _tm). However, they are few in number.
In the stratosphere, prior to PSC formation, the amount of nitric acid in the vapor phase is about 5 ppbv, or 5 times
greater than the gas-phase concentration of sulfuric acid (Hamill and Toon, 1991). It is therefore considered that the
growth rate and particle sizes of Type I PSC are considerably larger than that of sulfuric acid particle growth. With the
observed water vapor concentration of between 2 and 5 ppmv, an even faster growth of Type II clouds exist. In fact,
the growth rates for Type I and II ice clouds are so short (hours or less) that their sizes are controlled mainly by the
rate of temperature change.
The polar stratospheric clouds are critical to the formation of the Antarctic ozone hole for the following reasons.
First, they act to remove nitrogen compounds from the stratosphere by sedimentation, important for the existence of
high levels of reactive chlorine species that destroy ozone (Salawitch, et al., 1989). With the particles growing large,
10

asTypeII PSC,moreandmorenitricacidandwateris removedby selectivenucleation,wherebyonly a smallnumberof largeparticlesareproduced.It iscurrentlybelievedthatthesefewlargeparticlesslowlysedimentoutofthestratosphere,removingbothwaterandnitricacid(Salawitch,etal.,1989),takingperhapsafewweeksto occur.Secondly,unreactiveformsofchlorine,suchasC1ONO2,areconvertedintoreactiveformsofchlorineonthesurfaceof theseclouds(Turco,et al., 1989).Reactionsof importanceareN205andC1NO2withwaterandC1N205andCINO2withHC1onthesurfacesof thePSCproducingreactivechlorineandnitricacid.Theremovalofnitricacid,aC1neutralizer,bydepositionandconversionallowsthefreeC1atomsunrestrictedaccessto ozone.However,whenthesunreturnsandthePSCevaporate,nitricacidis returnedto agaseousstatethatslowlyphotolyzesintoNO2,reducingtheavailabilityof reactiveC1.
It followsthatformationof the number of nitric acid particles cannot exceed the number of sulfate particles, but
could be much less dependent on a number of factors. For example, if the temperature decreases slowly, the first
nitric acid particle to form could absorb a significant amount of the excess nitric acid retarding nucleation of other
particles. Models by Poole and McCormick (1988) suggest that with high cooling rates, 5 K/day, the rate at which
HNO3 condenses is small compared to the rate of increase of available HNO3 vapor (i.e., difference between the
saturated vapor pressure at the surface and the ambient partial pressure), and thus large supersaturation is created,
allowing the activation of most frozen sulfuric acid aerosols. This rate of cooling suggests that tens of minutes are
required for PSC to form. For cooling rates less than 1 K/day, HNO3 condensation is balanced for all particles
producing fewer nucleated NAT particles. This results in large particles. Hofmann (1990) believed the particles
observed in Antarctica are the result of growth in which slow cooling rates were observed.
Particles in Solution
Deliquescence
In the next sections, important concepts will be presented to better explain PSC development. It should be noted
that not all material will absorb water at the same rate. There is a common relationship between vapor pressure of
the solution and the concentration of the solute dissolved in the solution. This relationship is known as Roault's law:
e' no
es(_ ) n o + n
where e' is the vapor pressure over the solution containing n moles of solute, and no moles of solvent; and es is the
vapor pressure of the pure solution with no solute dissolved within. The law says that vapor pressure of a solution
varies inversely with concentration. With the number of components and phases of this system in thermodynamic
equilibrium, there can only be one degree of freedom. Therefore, a solution drop at a particular temperature will be
in equilibrium at only one concentration, and one relative humidity (RH). RH is the ratio of vapor pressure over the
solution droplet containing the solute to the vapor pressure of the droplet containing no solute. If the relative
humidity of the environment were to rise, equilibrium would be shifted and the particle would grow. If the relative
humidity were to drop below the equilibrium point, the resultant change would cause the particle to evaporate. This
equilibrium point is called the deliquescence point. Not all solutes have the same deliquescence point; some of the
relevant ones are summarized in table 2.
Particle Growth: Influence of Solute
When mixing water vapor and a solute together a variety of things happen, such as the lowering of the vapor
pressure and freezing point. However, in discussing such effects we need to first identify the solution products for
11

Table 2. Relative humidities of phase transition. (Twomey, 1977)
Particle composition Observed RH
Sodium Chloride (NaC1)
Ammonium Sulfate (NH4)2SO 4
Ammonium Bisulfate (NH4HSO4)
Nitric Acid (HNO3)
Sulfuric Acid (H2SO4)
= 76%
= 80%
= 40%
= 70%
=1%
which nucleation will take place and to determine the degree of dissociation or association. This is determined by
the number of ions which are freed by dissociation or combined in association. For a given solute, the value i, the
Van't Hoff factor, is given to describe the number of ions each solute will provide to solution. The size of the ions
and the solvent both determine the Van't Hoff value; for instance, ammonium sulfate (NH4)2SO4 produces 3 ions,
but only 2.3 ions are added to pure water (Low, 1969). A dissolved solute tends to lower the equilibrium vapor
pressure of a liquid. Briefly, when a solute is added to a liquid, some of the liquid molecules that were on the surface
layer are replaced by solute molecules. In addition, these solute molecules have an attraction force on one another
that restricts the movement of the liquid molecules. For this reason the vapor pressure of the liquid is lowered.
For N0, the number of effective solute molecules of mass, M, in lowering the vapor pressure may be given by
iNoM/m s, where ms is the molecular weight of the solute. The number of water molecules in mass, m, may
likewise be expressed by Nom/m v . The mass of water, m, may be written 4/3xPL r3. When these values are
combined and rearranged, the ratio then becomes
e' 3imvM-1
es(°°) 4rcPLms r3
or
e' - 1 - b/r 3es(_)
where b = 3im v /4_PLm s.
Upon inspection of this equation it is obvious that the saturation vapor pressure is decreased proportionally to
the number of ions freed in solution, and negatively inversely proportional to the cube of the radius.
Particle Growth: Influence of Curvature
In a growing droplet, the equilibrium vapor pressure over a droplet surface also depends upon its curvature and
is given by (Kelvin term)
es(r ) = es(_ ) exp (2cy/rRvPL T)
Here, es(r) is the vapor pressure over a surface of radius, r; o is the surface tension between the liquid and the
vapor; R v is the universal gas constant; PL is the density of the liquid, and T is the temperature. This means that adroplet of radius r will be in equilibrium in a vapor environment where fiat surfaces of a solution are supersaturated.
This equilibrium is a metastable one with respect to growth of a droplet because it takes work to grow an embryo to
12

sizer, but if an embryo gets larger than r, the energy of the system is reduced. This is important because the
mechanism for formation of crystals in the atmosphere requires the growth of a drop to a size where nucleation can
take place.
Combining the two previous terms produces the Kohler curve, an equation which relates the saturation ratio as
a function of particle curvature and the contribution of solute in solution (which by the equation lowers the saturation
ratio) as given by
es'r' ]ea'rwhere a = 2_/PLRvT; and for r not too small, a good approximation is
es'(r)
es(_)- l+a/r-b/r 3
Figure 7 shows these Kohler curves for sulfuric acid over a range of initial sizes observed in the atmosphere. These
curves represent a range from 10-16 to 10-14 grams for each solute, and a fixed Van't Hoff coefficient. These curves,
which are not the same for all materials, are used to illustrate the sizes of a particular particle at the equilibrium vapor
pressure, or relative humidity that exists for a given mass particle. In addition, the curves aid in determining the
nucleation point of a droplet at a given molality, an important tool in understanding the nucleation processes that
contribute to the formation of PSCs.
100
90
o 8O
7O
6O
50 I i I
1.0 1.1 1.2
/ j.-J
I/
1.3 1.4 1.5 .I.6
I I I I I
1.7 1.8 1.9 2.0 _.!
RELATIVE SIZE- r /ro
Figure 7. Differences in growth of aqueous solution droplets of H2SO 4. The dry size is indicated on each curve. (Nair
and Vohra, 1974)
13

Gibbs Free Energy
In order for a particle embryo to form and grow an energy barrier Gibbs Free Energy must first be overcome.
The reason the equilibrium is metastable rather than unstable is that the energy barrier must be minimized for this
process to occur. During the process of nuclei growth the energy is reduced under experimental conditions. Themechanism of nuclei growth can be analyzed by considering the embryo as a tiny sphere. The sphere will have both
volume and surface energies expressed by E = ar 3 + br 2. This relationship is shown in figure 8. The first term is the
energy needed to create a volume, neglecting surface energy, multiplied by (4/3)rc for a sphere. The second term isthe surface area term, where b is multiplied by 47t for surface energy. Without going into great detail on the values
of these terms, we can show the importance of the terms as a function of changing radius. The equation has a
minimum for r = 0 and r = -b/a, and a maximum at r = 0 and r = -2b/3a. The value for b will always be positive
due to the energy needed to form a surface. The "a" term, however, is not as simple. For example, the energy required
for a molecule to leave the surface of a sphere would increase the energy of the sphere because the volume would
decrease, thus increasing the surface tension to hold the sphere in its shape. Conversely, the energy of a sphere would
be reduced when vapor condenses onto a sphere, increasing its volume.
In summary, the value of a is a function of the environment. Where a is positive, work is required to grow the
embryo. If the term were negative, as for a supersaturated solution, the embryo would grow rapidly, but only if the
critical size were met (r = -2b/3a). For a > 0, no growth is observed; for a = 0, growth is possible; and for a < 0,
growth is certain.
Effects of Relative Humidity
In the atmosphere a wide range of relative humidities can be encountered, from 1% in the stratosphere, to
saturation, and on rare occasion supersaturation. The non-soluble particles are silica, dust, oils and a variety of other
AG
f
//
/
a :_o "t',//
//
//
//
a
r---_
Figure 8. Gibbs free energy plot showing the critical radius growth. (Twomey, 1977).
14

material.Thesolubleparticlesareammoniumsulfateandsodiumchloride,existingin sizerangesof >0.1and> 1.0_tm.Thephysicsof theseparticlesareespeciallyimportantto cloudandfog formationfor visibilityandcorrosion.
Thephaseruleof physicalchemistrystatesthattheequilibriumof a systemof C componentsandP phasespossessesC - P+ 2degreesof freedom.Forasystemof asolublesaltandwatervapor,threephasesexist;asolid,anaqueoussolution,andwatervaporwithtwocomponents(waterandsalt).Thedegreeof freedomis one,whichmeansthatwespecifyonethermodynamicvariable,temperature;theothervariablefactorsaresetandnotfreetovary.In otherwordsatagiventemperature,watervapor,solution,andsolidcanexistatonlyonevaporpressureorrelativehumidity.Therefore,thisrelativehumidityrepresentsaphasetransitionpointor aphasetransitionlineonthetemperature-humiditydiagram.Figure9 showstheequilibriumrelativehumidityline of a saturatedsolutionagainsttemperature.
Growth Rate Factors
Studies have shown crystal growth should occur at the rate of diffusion; however, the rate has been shown to be
slower (Humphreys-Owen, 1949). In fact, growth rates were observed to change discontinuously. In crystal growth
theory there appears to be three main factors to influence growth rates: diffusion, release of latent heat, and viscosity.
While the driving force of crystal growth is diffusion, latent heat and viscosity work against the process, providing
a balance of forces and equilibrium.
The principal assumption in growth models is that it happens very fast. The limitation in the rate of
crystallization is the transfer of solute from solution to the crystal. This transfer process ordinarily involves an eddy
of molecular diffusion. This rate, considerably slower than for pure solvent, is believed to be caused by the hindering
of the molecules as they traverse the medium toward the crystal (O'Hare and Reed, 1973).
RH
Solution + Water Vapour
J
Solid + Water Vapor
Temperature
Figure 9. Equilibrium relative humidity (RH) line of a saturated solution against temperature--a curve which also
represents the transition line between the regions of solid and solution. (Twomey, 1977)
15

Lindenmeyer,et al. (1957)showedicecrystalgrowthinpurewaterwaslimitedbytheamountof latentheatreleased,demonstratingthetransportmechanismmostresponsiblefor theremovalof thethermallyenhancedreactionproducts.Hallett(1964)showedthaticecrystalgrowthin supercooledwatergrewatarateapproximatelyequaltothesquareof thesupercooling.
Anotherlimiting factorin the growthrateof crystalsis viscosity.Viscosityis relatedto the solute,itscharacteristics,andtheenvironment.Ingeneral,mostsolutionsbecomeviscouswhenthetemperatureisreduced.Itisveryclear that if a solution is a highly viscous solute, molecules may not be able to diffuse to the growing crystal
quickly enough and the growth will be very slow. For a viscous solution, the growth rate of a crystal can be
described by
V = 1AT nrl
where rl is the viscosity, ATis the degree of supercooling, and n is the power having a value of 1 or 2 (O'Hare and
Reed, 1973). For example, if one lets honey sit for a few months, crystal growth can be observed. If the solution
concentration increases the viscosity enough, it is conceivable, in theory, that growth rate would not increase and
may actually slow down, and effectively cease.
What the Experiment Will Show
Through the years in which the polar stratospheric particles have been studied, there still remains confusion
whether the PSC exists as highly supercooled liquid droplets, frozen sulfate particles, or particles in a highly viscous
glass transition. The interest of these experiments is to better understand the phase transition of the particles as they
move from stratospheric aerosol to Type I and then to Type II PSC. The transition phase of these particles may be
the key in determining the rates at which 03 is being destroyed.
The experiments were conducted to provide detailed data concerning the composition, phase, and formation
processes of PSCs. To understand the possible phase behavior, sulfuric and nitric acid, ammonium sulfate,ammonium bisulfate, and sodium chloride solutions were supercooled and nucleated to observe solution growth
rates at stratospheric temperatures. These growth rates were explored over a wide range of temperature and solution
concentrations. In addition, military aircraft exhaust (soot), provided by NASA Dryden Flight Research Center
(DFRC), Edwards, California, was added to these solutions, re-supercooled and nucleated to investigate any
changes in growth rates due to the addition of the soot. In the stratosphere, mixing of this soot may be neglected due
to the stability and the lack of turbulence; it is therefore possible that these particles may require a very long time
before eventually falling out. For example, a 1 gm particle, large for a stratospheric aerosol, has the fall speed of
about 0.13 cm sec -1 , requiring a matter of weeks for fallout. Some consideration should be given to this theory if the
PSCs are observed more frequently in the future due to the ever increasing amount of exhaust being transported into
the stratosphere, or directly injected there.
A significant portion of the experimental work consisted of attempts, to simulate a glass phase of H2SO4-H20
and HNO3-3H20 solutions by supercooling small volumes, 0.04 ml, of solution. This glass phase assumes, at
extreme supercooling, the volume is transformed into a highly viscous liquid or glass without crystal growth. These
experiments were conducted in a controlled environment to measure the crystallization rate.
CHAPTER 3: EXPERIMENTAL PROCESS
The experimental setup was designed to measure the crystal growth velocities of solutions at different
concentrations and degrees of supercooling. In order to investigate these properties, an experimental setup similar
16

tothatofYangandGood(1966)andotherswasused.Thisconsistsofa"1 r' shapedclearglasstubingof differentborediameters,havingidenticaltestobservationsectionsandoverallcolumnlengths.Eachpieceof tubingisapproximately30cm,havingasampleintervalof 15cm,andatestintervalof 7 cmin length.Thisis illustratedinfigure10.Theseexperimentsuse6 differentboreholediameters(0.5,1.0,2.0,4.0, andoccasionally5.0 and6.0mm).Thetubingsizechoicesweredeterminedsothatthedimensionsof theglasstubeopeningwerelargeenoughto alloweitheranicecrystalora liquidnitrogencooledwiretobeeasilyinserted.Secondly,minimizationof thevolumeof liquidwasdesiredinorderto achievemaximumsupercooling.Thissetupwaschosenbecauseitwasasimplesetupwithfewmovingpartsandallowedagoodviewof thegrowingcrystals.
A Neslabmodel220Dcoolingbathwithadjustabletemperaturecontrol,to -90 °C,wasselected.Thesystemprovidesanenclosedcoolantcontainmentbasinin whichtheglasstubingsetupwith solutionsamplecouldbeimmersed.Cyrocool®fromSavantInc.,(aclearsiliconebasedheattransferliquid)waschosenbecauseof thelowtemperaturesrequired,-55 °C.Thisparticularliquidremainedlessviscousthananyotherheattransferliquidsreviewed,andat-90 °C,Cyrocoolremainedlessviscousthanwaterat-90 °C.Whenchoosingaheattransferliquid,it wasimportantto considertheviscositytrendsasafunctionof temperature.Cyrocoolmettheserequirements.
Nucleating Crystal or Liquid Nitrogen cooled wire
/
Thermocouple Glass Thermometc
Tubing
Figure 10. Illustration of the experimentation setup.
®Cyrocool, a registered trademark of Savant Inc., Midland, Michigan.
17

Foraccuracyandrepeatabilitythetemperaturesweremonitoredbyacalibratedthermocouple,to+0.05 K, and
an accurate mercury thermometer, to +0.1 K. The thermocouple and thermometer were connected to the apparatus
at opposite ends as illustrated in figure 10, five centimeters below the surface. This arrangement was used so that the
liquid could be monitored for the possible formation of thermal gradients, which could lead to erroneous results.
Characterizing the Solutions
Solutions of different concentrations, ranging between 1 and 5 m (molality, m = moles of solute per kilogram of
solvent), were prepared using standard techniques for each of the 3 salts (<5 m) and the 2 acids at dilute
concentrations (<3.5 M, molarity, M = moles of solute per liter of solution). For acid concentrations greater than 1 m,
the concentrations are referred to in molarity, instead of molality. The solutions were prepared to +0.05 m using
certified American Chemical Society (ACS) grade sodium chloride (NaC1), ammonium sulfate (NH4)2SO4,
ammonium bisulfate (NH4)HSO4, and reagent grade ACS sulfuric acid 98.8% (H2SO 4) and nitric acid 70% (HNO3).
The salts were poured into a beaker filled with warm distilled water, and stirred by a Gyratherm magnetic stirrer for
about 1 hour. The acids did not need to be stirred by the magnet, but were shaken periodically to ensure complete
mixing. At the higher concentration for nitric and sulfuric acids, the freezing point depression, ATf= Kfm (Glasstone
and Lewis, 1960) where Kfis the freezing point depression constant, was not very meaningful. This will be shown
later by the equilibrium curves for sulfuric acid by Gable, et al. (1950), and for nitric acid by Picketing (1893). The
solutions were prepared with distilled water and placed into containers that had been thoroughly cleaned with strong
detergent, rinsed with distilled water, and placed on a clean shelf to dry.
Supercooling the Solution
This particular cooling device had a built-in mechanical circulating system which constantly mixed the fluid at
the desired temperature, usually between -3 ° and -55 °C, keeping any temperature gradients to a minimum. During
this phase of the experiment the maximum supercooling for each solution at each concentration was determined by
slowly cooling the sample until only self nucleation occurred with the solution almost in equilibrium. Thermal
equilibrium for the setup was established according to the time constant equation given by Carslaw and Jaeger (1959):
2r
K
where
and
r = radius of the tubing, cm
= thermal diffusivity of glass or liquid, cm 2 sec -2
Appendix C shows the thermal conductivity, density, specific heat, and diffusivity of a number of substances. The
time constant value needed for equilibrium to be established, "c, is equal to 1 /e or 63.2% of desired temperature
value. Thermal equilibrium is established at 5 times "c,which is within 1% of the actual temperature. An estimate of
the time required for equilibrium, assuming r = 3.0 mm and K = 5.8E-03 for glass, the equation shows that "cequals
about 2 to 10 sec, and some 5 times longer for water, depending on the wall thickness. For these studies 3.5 minutes
was considered the time to reach thermal equilibrium. Upon reaching thermal equilibrium, and in the absence of
premature nucleation, the temperature was decreased by additional 1 or 2 degree increments and allowed to reach
equilibrium again. This was continued only until self-nucleation was observed, indicating the last temperature with
no nucleation as the temperature limit for supercooling.
18
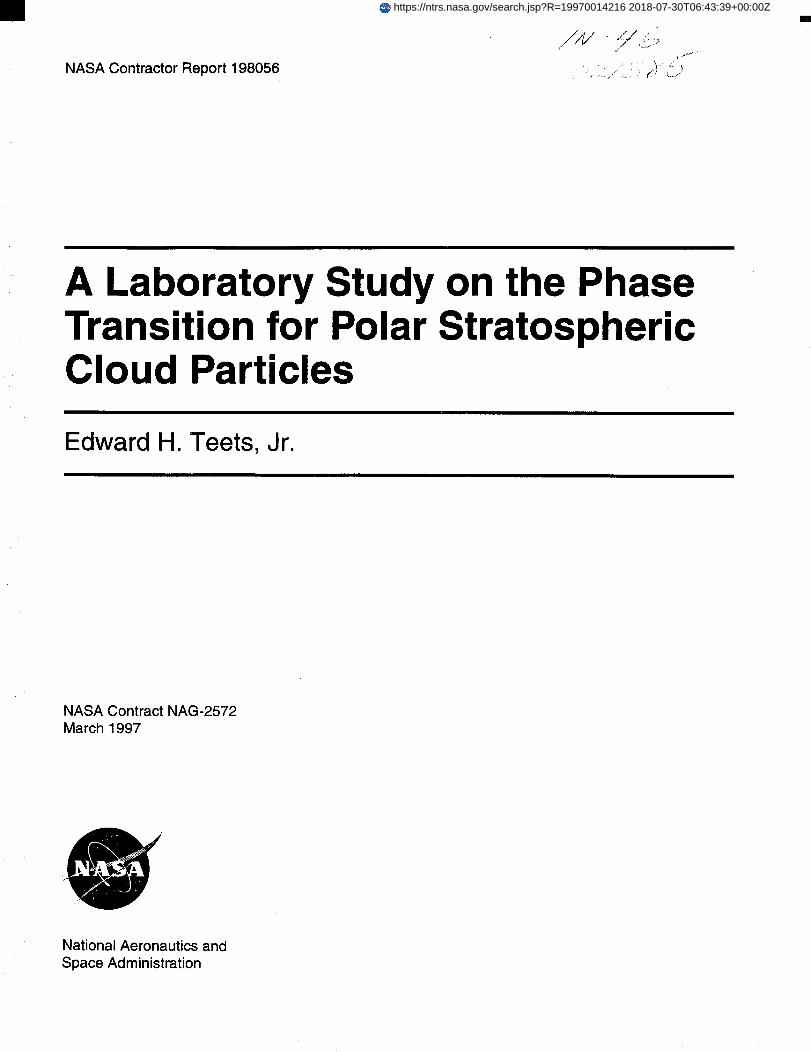
Asacomparison,severaltubingsizes(0.5,1.0,and4.0mmdiameter)werepreparedwith identicalsolutionstoidentifytheeffectsoftubesizeonsupercooling.It isbelievedthatthesizeof thesamplevolume,thetypeof solution,andthematerialof thetubingis importantindetermininghowmuchsupercoolingcanbepossible.Thisstudywasconductedusingonlya1m solution of ammonium sulfate.
Experimental care was used to minimize potential problems. For example, during these experiments several
problems involving the glass tubing were observed. Namely, the glass had flaws that induced premature nucleation.
In addition, if the tubing was not properly cleaned after a test run, residual material may have been left to nucleate
the next runs early in the supercooling process. Also the solution, although carefully prepared, may have had some
impurities that affected both the supercooling and growth rates.
Crystal Growth Rates
This setup was ideal for establishing the growth rate characteristics of the solutions to identify and observe the
following properties: crystal growth velocity and crystal shape as a function of supercooling, temperature, and
concentration. The growth velocity Vr (cm/sec), is defined as the velocity of the moving solid-liquid interface in a
supercooled or supersaturated solution. First, the growth rate for a 1 m ammonium sulfate solution was conducted
using the 0.5, 2.0 and, 4.0 mm diameter tubing for temperatures ranging from -4 °C to self-nucleation. This
procedure was conducted several times, and the rates averaged to eliminate inconsistencies in timing the growth front
passages due to either errors in the timing procedure or errors due to unseen gradients. The timing of these growth
fronts was accomplished with the use of an ordinary stop-watch. The starts and stops were determined by visual
inspection and still photographs. Photographs were taken to show the crystal shapes at low and high supercooling.
The timing started as the growth front passed one of two wire markers on each tube and stopped when the front
passed the second wire. During this portion of the experiment it was important to have accurate knowledge of the
temperature of the coolant immediately surrounding the tubing setup. This was necessary in order to minimize
temperature gradients within the solution prior to nucleation. For this reason the temperature was consistently
monitored at both ends of the apparatus.
Secondly, the crystal growth rate experiments for each solution at the desired concentrations were conducted in
the 0.5 mm diameter tubing. The 0.5 mm bore hole tube was selected since larger supercoolings were observed
during the supercooling phase. A volume of 0.04 ml supercools more than a 2 ml volume in accord with the following
idea: for given volume there exist a finite number of nuclei that will initiate nucleation. If the volume is halved, the
number of nuclei is halved. In theory, if the halving process continues, at some point the volume left will be
completely free of any nuclei which could initiate crystal growth. The nucleation of these solutions was initiated one
of two ways after reaching equilibrium. First, an ice crystal suspended on the end of a 0.5 mm copper wire was
submerged into the supercooled solution just below the surface. Second, if the ice crystal failed to nucleate the
solution, the wire was cooled by liquid nitrogen and again submerged just below the solution surface. In most cases
this worked successfully. Since the temperature of maximum supercooling was known, the tubing setup, with
solution, was submerged in the coolant at a predetermined temperature and allowed to reach equilibrium before
nucleation was initiated. Timing of the growth fronts were again conducted the same as before.
Once completed with the initial test runs for solutions <5 m, inspection of the crystal growth pattern for higher
concentrations of nitric and sulfuric acid occurred. Sulfuric acid and nitric acid each have a series of hydrates which
can form depending on the temperature and concentration. For example, at 10% by weight H2SO 4 there exists, if
nucleated, solid ice plus liquid H2SO4. On the other hand, if 100% by weight H2SO 4 were to nucleate, there would
exist solid H2SO 4. Within the 10-100% range, there exists many combinations or hydrates of H2SO4"nH20. These
hydrates have a point on a curve where the liquids and solids have the same composition and are in equilibrium with
each other. This point, is the congruent melting point of the compound, and allows the solid and liquid with the same
composition to coexist.
19

Mixed Solutions
Additional experiments were performed to determine the affects on the supercooling and growth rates from
mixing identical concentrations of sulfuric and nitric acid. As shown earlier, the particles observed as PSC contain
both sulfuric and nitric acid in different proportions. These experiments investigate the affects, if any, due to the
mixing of these two acids. Since the phase of the Type I PSC was known to contain significantly more nitric acidthan sulfuric acid, ratios of 80% and 95% by volume of nitric acid were mixed with 20% and 5% by volume of
sulfuric acid. The solution mixtures were prepared using a 1 and 3 M concentration of each solution. The procedures
by which the maximum supercooling and growth rates were conducted were identical to the previous experiments.
Aircraft Soot Mixtures
A follow-on experiment examined a small amount, 0.6 grams per 15 ml solution, of engine exhaust (soot) addedto the 3 M concentrations of nitric and sulfuric acid, 95/5 and 80/20 respectively. This experiment simulated the
possible interaction between stratospheric aerosols, cloud particles, and insoluble aircraft exhaust. This soot was
exhaust buildup of JP-4 fuel from an engine of a F-104 Starfighter, an aircraft capable of flying to 70,000 ft. The
soot for these runs was obtained by scraping residue from the rear of the exhaust nozzles of the aircraft. This
particular aircraft had not been used for at least 6 months and it was unclear as to the exact composition and what
additional materials (such as sand, metal, smoke, etc.) that may have been contained in the residue. This aircraft,
considered one of the dirtiest burning engines, puts many grams of soot aerosols per pound of fuel into the
atmosphere. The interest of soot may be important due to the increase of the nucleation rate of aerosols leading to
the production of aircraft contrails and early nucleation of stratospheric aerosols, a precursor to the PSCs. The
procedures were identical to those used to determine the growth rate of acid concentrations with no soot.
CHAPTER 4: EXPERIMENTAL RESULTS
Supercooling is the reduction of temperature of any liquid below the melting point of that liquid's solid phase--
that is, cooling beyond its nominal freezing point. Results from the various experiments are displayed in this section.
Data plots are presented showing the effects of tube diameter on growth rate and degree of supercooling. Crystal
growth rates are plotted as a function of supercooling and temperature for the selected acid and salt solutions. These
plots all show good experimental data. Also, three series of photographs showing the growth fronts and crystal
shapes at intervals during the course of the experiments under specific conditions are presented.
Growth vs. Tube Diameter
The use of different size glass tubes or capillaries provided the intended data array. Growth rates as a function
of supercooling and tube diameter differed with the larger diameter (4.0 mm) tubing, which has an environment more
conducive to higher crystal growth rates. That is, the diameter of the tubing was large enough to allow the crystals
to grow in a semi-free environment, free of container walls. On the other hand, the smaller diameter tubing (0.5 mm)
restricts the growth rate, which appears to be strongly influenced by tube diameter. Figure 11 shows the effects of
tube diameter on growth velocity for a supercooled 1 m solution of ammonium sulfate at a temperature of -11 °C
(7.3 K supercooled). This trend shows a direct relationship between tube diameter and growth rate. Similarly,
figure 12 shows the growth rates and degree of supercooling as a function of temperature and tube diameter. While
the 4.0 mm tubing does support a faster growth rate, the 0.5 mm tubing provides for an additional 5 degrees of
supercooling, due to a small volume. This was a compromise that will be discussed later. Since this study is mainly
interested in simulating the high degree of supercooling experienced in the real atmosphere, the 0.5 mm tubing, with
its small volume, was used to provide these conditions. Upon further inspection of figure 11, it appears at some point
above 4.0 mm that free growth rate may approach a constant.
2O

O
EO
oDOO
.C
oO
1.0
0.g'
0.e,
0.7.
0.6.
|0.5 I ' I " I I ' I ' I
0 1 2 3 4 5 6 7
Diameter, mm
Figure 11. Tubing diameter in supercooling for 1 m solution of ammonium sulfate at a temperature of about -11 °C
(7.3 K supercooled).
O
t/l
EO
p{.9
2.0
1,5-
1.0-
0.5-
Ammonium Sulfate @ lm
D = 2.0 mm _ ,," ,/'
¢mm
o I°
0.0 ! • _ i I ' I i I ' I _ ! ' I ' I '
0 --9. --4 --6 --8 --]0 --1:2 --14 --16 --18 --20
Temperature, Deg C
Figure 12. Growth rates as a function of tube diameter and temperature. Equilibrium ice-solution temperature is
shown at -4 °C.
21

Data from the larger tube provided important information not obtainable from the smaller tubing--a good view
of the growing crystal shapes. Figures 13(a through i) show the growth front within the 4.0 mm tubing containingammonium sulfate at low, medium, and large supercooling. The crystals observed growing in a small supercooling,
< 5 K, resembled long thin hollow columns. Crystals that grow in a small supercooling often grow at angles up to 90 °from the tube axis and are often difficult to observe. The medium supercooling, 9 K, had crystals that grew along
the sides slightly faster than through the middle, showing a more organized structure of growing plates, similar to
feathers; this was observed in figures 13(b and c). The larger supercooling, >12 K, had a growth front with crystals
growing from the middle shaped like small plate crystals. Figure 13(j) show the shapes of the crystals for dilutesolutions experienced over a range of supercoolings (Wedum, 1979). These crystals represented growth in weak
sodium sulfate solutions.
Figure 13(a). Crystal growth of a 1 m solution of ammonium sulfate in a 4.0 mm diameter tube at 4.0 K supercooledat 7 sec.
Figure 13(b). Crystal growth of a 1 m solution of ammonium sulfate in a 4.0 mm diameter tube at 4.0 K supercooledat 11 sec.
22

Figure13(c).Crystalgrowthof a1m solution of ammonium sulfate in a 4.0 mm diameter tube at 4.0 K supercooled
at 16 sec.
Figure 13(d). Crystal growth of a 1 m solution of ammonium sulfate in a 4.0 mm diameter tube at 9.0 K supercooledat 2 sec.
23

Figure13(e).Crystalgrowthofa 1m solution of ammonium sulfate in a 4.0 mm diameter tube at 9.0 K supercooledat 4 sec.
Figure 13(f). Crystal growth of a 1 m solution of ammonium sulfate in a 4.0 mm diameter tube at 9.0 K supercooledat 6 sec.
24

Figure13(g).Crystalgrowthof a1m solution of ammonium sulfate in a 4.0 mm diameter tube at 12.0 K supercooledat 1 sec.
Figure 13(h). Crystal growth of a 1 m solution of ammonium sulfate in a 4.0 mm diameter tube at 12.0 K supercooledat 2 sec.
25

Figure 13(i). Crystal growth of a 1 m solution of ammonium sulfate in a 4.0 mm diameter tube at 12.0 K supercooled
at 4 sec.
A
_JO
ZO
n.*I--ZL_
Z0C.)
3
2
I _
SOLID
COLUMNS
(NEEDLES)
i i L , II 2 5 4
(TH_ SPHERULITES_LARGE, THIN
PLATES
SINGLE L.
PL(_S
I i[ v i I _t5 6 7 8 9 I0
I I I I III 12 13 14 15
SUPERCOOLING (C*)
Figure 13(j). Crystal shapes as a function of concentration and supercooling. (Wedum, 1979)
26

During the stage of determination of the growth rates for weak solutions, interest was expressed in observing
how the growth rates varied with each run. These runs were conducted 10 times. Data for each run was plotted
(figs. 14 and 15) as a function of total time for a low (5 K) and high (10 K) supercooling using the 0.5 mm tubing.
These plots show good agreement between each run to 4.0% for the higher supercooling and approximately 5.0%
for lower supercooling. The variability was not significant because human error in timing the growth fronts may
provide the largest part of this variability.
25.0
24.5
24.0
23.5
23.0
22.5
22.0
21.5 -
21.0 -
20.5 -
20.0 ....
0
• 6q-
--- • •
T= -10 C, lm Ammonium Sulfate
supercooled 6.1 K
I I I I I I I I I I I
1 2 3 4 5 6 7 8 9 10 11 12
Number of Test
Figure 14. Growth rate errors due to uncertainties in stop-watch timing at low supercooling.
10.0
O
O
9.5 4
9.0--
8.5--
8.0
T• T
T T T .LT • .L .L T .L• J. T
• T •.L. T ..L • .L
• .L..L
T= -15 C, lm Ammonium Sulfatesupercooled 11.1K
i I I I I I I I I I I
0 1 2 3 4 5 6 7 s 9 10 11
Number of Test
12
Figure 15. Growth rate errors due to uncertainties in stop-watch timing at high supercooling.
27

Supercooling and Growth
Salts
The sodium chloride and ammonium sulfate experiments were successful and predictable, particularly due to
the ease and stability of these substances in solution. It should be noted that sodium chloride and ammonium sulfate
are solubility-limited at extremely cold temperatures and have a finite solubility at any temperature (International
Critical Tables, 1922). Figures 16 and 17 show the growth rates of each salt against temperature for each
concentration with equilibrium points (zero supercooling) from International Critical Tables, 1922. Also displayed
are curve fit lines for each concentration. It should be noted that all the plots have the first few curve fit data points
eliminated from the figures, the reason being that the growth rates for the first few degrees of supercooling showed
a large degree of variability from one run to another, which require greater study. It is clear that at small
supercoolings and molality, the crystallization velocity increases with supercooling. This is consistent with earlier
results, as is the decrease with molality for a given supercooling (O'Hare and Reed, 1973).
As a solid, ammonium bisulfate is very hygroscopic (taking up water vapor) when left in the open for any period
of time. Ammonium bisulfate in solution also takes up water vapor from the atmosphere, and therefore care must be
taken when handling and storing. Similar problems exist for sulfuric acid solutions. Not much data could be found
for ammonium bisulfate with the exception that it nearly completely dissociates when put into solution, becoming
4.0
3.0
"7O_D
Eo 2.0.
O
_o>¢.-
_ 3.0.
0.00
Sodium Chloride
I
I
I
f
Q #/
l! ¢ ,#.
o/ o °/ ,, . -°/ / / .-/ / 3m " ,- ,"
o j
a o 4_ ,/
o N
o x 5m ,,.. _ --
¢ -'_ "- i J"' " -lo -15 -=b -2'5 -a'o -as
Temperature C
Figure 16. Growth velocity as a function of molality and temperature for sodium chloride; freezing point depression
is 3.37 K per 1 m.
28

3.0'
2.0'
Eo
+
1.0.
0.00
Ammonium i-- Hallett
Sulfate ! Pure Water
i/
i /ii l °' Jo -lm "
i °/ ,"
/ o/ ./,"/ //" ",2m /" .,
] ," _oo .. I
, • _ _ . +--..-J'*"*_" 5m
01 I @ I " I - i i I I I
-5 -10 -15 - 20 -25 - 30 -35 - 40
Temperature C
Figure 17. Growth velocity as a function of temperature and molality for ammonium sulfate; with growth rate for
pure water; equilibrium freezing point depression is 3.86 K at 1 m.
dilute sulfuric acid. Figure 18 illustrates the growth curves for each concentration. These curves are similar to the
sodium chloride and ammonium sulfate for weaker concentrations, but at higher concentrations a larger
supercooling can be achieved with a much colder self nucleation temperature. Also the growth rate curves begin to
show signs of a constant growth rate with decreasing temperature. Since ammonium bisulfate produces a weak
sulfuric acid solution, this means that when the solute comes out of solution there is no longer any simple way of
determining which crystal is growing, or if the crystal is of purely one substance (either ice or sulfuric acid hydrate).
Acids
Unlike the salts, the acids are a little trickier to work with, but are infinitely soluble within the temperature ranges
of these experiments, -4 ° to -54 °C. Figures 19 and 20 provide the growth rates for nitric and sulfuric acid. Also
illustrated are the curve fits of the data. These data show that the growth rates for the weakest solutions are nearly
the same as for the salts. However, for the higher concentrations (2 m and greater) the growth rates are reduced
significantly. On these figures, the point farthest to the fight for each curve represents the maximum supercooling
that could be achieved.
At the higher concentrations and increased supercooling it is clear that as the growth rate slows it approaches a
maximum. This is indicative of the increased solution viscosity. The key to this study is the growth rates at the high
29

3
Ammonium Bisulfate ; =
2.5- lmg
2 jt
fl / i#/
;o // ,,"
1/ " ........0.5
#s
p SU o
s j
0 .,-_,m-=.O ! - i _ _I I | I I
0 -5 -10 -15 -20 -25 -30 -35 - 40 - 45 -50Temperature C
Figure 18. Growth velocity as a function of temperature and molaxity for ammonium bisulfate; freezing point
depression is 3.8 K at 1 m.
Nitric Acid
2.5-
2-"7
O(I)
Eo.1.5
_9.o
¢-
•_ 1
0.5-
0 -5
2M / 12°/.
/
/
-1'o -l's
s
sJ
•.-" 3M / 17.2%
2'o ' ' ' b- -25 -30 -35 -4 -45
Temperature C
Figure 19. Growth velocity as a function of temperature and molarity for nitric acid; freezing point depression is
3.6 K at 1 m.
3O

2.5
Sulfuric Acid
2-
'7
_ 1.5-E0
0
>e-
oI
0.5 pt
#
0 I I I u
0 -5 -10
-- Curve fit to dataI
m
1M / 9.5%
l S
s
2M/17.5°_
// fs jf
3.5M/31%
. 3M/26% _____ _
! '1' ! I-- i I i !!
-15 -20 -25 -30 -35 -40 -45 -50 -55 -60
Temperature C
Figure 20. Growth velocity as a function of temperature and molarity for sulfuric acid; freezing point depression is
3.8 K at ! m.
end of supercooling with increased concentration. The curve fit data trends show that if the temperatures could be
reduced further providing a higher supercooling, a reduction in growth rate should take place. Extrapolating the
growth rate for the acids by 20 K supercooling illustrates nearly a 20-fold decrease in growth rate with a small
increase in concentration, from 1.0 to 3.0 M.
Growth Rate at High Concentration
The growth rates observed for higher concentrations are similar to those at lower concentrations, except that the
velocities are more influenced by temperature and concentration (i.e., viscosity). Figure 21 (a) shows the growth rates
for the higher concentrations of nitric acid. These curves show a trend that is generally unclear; for example, the
weakest concentration has the coldest equilibrium temperature and the second slowest growth rate. It should be
remembered that for the higher acid concentrations the use of molarity (M) instead of molality (m) was used. As the
concentration increases, the equilibrium temperature increases, as does the growth rates. Figure 21(b) shows the
growth rate for hydrate crystals as a function of molarity for supercoolings of 10, 20, and 30 K. This can be seen on
figure 22 where the two concentrations, 9.9 M and 10.9 M, have the same equilibrium temperature. While both have
nearly the same equilibrium temperature, the growth rate for the higher concentration is slightly slower, as was
expected since more solute is present. The growth rate at the warmest temperature and weakest concentration, 48%
by weight (M = 9.9), is found to actually have the fastest growth rate. Conversely, the slowest growth rate has the
highest concentration and the coldest temperature, 62% by weight (M = 13.5). Figure 22 illustrates the equilibrium
freezing points for nitric acid from Picketing (1893) and all freezing points for specific concentrations measured
during this study. This figure graphically illustrates the location of the temperatures from data in figures 19 and 21.
Sulfuric acid in our study, unlike nitric acid, becomes very difficult to nucleate when concentration rises above
3.5 M. In this study 3.5 M was the last concentration to be nucleated, partly because no growth was observed at the
31

O°B"
Nitric Acid
i
E0
0.6,
0.4"
0.2
%
/11/ ,_ 10.9M / 52°/= "
• s/
13.5M / 62.7*/.
: ; 1'o ,; 2'o 2'5 3; 3'_
\
\
"_ 4'0 450
Supercooling, K
(a) Nitric acid.
0.7
0.6 - t:,,_,
0.5- ",,'/"_" "";"_k/
/ .." \
////." Z_T=30_ 0.4- ',
_T=2o/..." '_
"_ /..' //_ "-,:-.-,._."__ 0.3- ://" "'"
/ /" ...._..:,,,,t...- • ,7 "°'_%.
_ o2- o ::..._
0.1 - "'_1_
07 810 9_0 ld.o 1f.o _.o 1_.o 1,.o
Molarily, M
(b) 3H20 hydrate crystals.
Figure 21. Growth velocities for nitric acid and 3H20 hydrate crystals as a function of supercooling and molarities.
Equilibrium temperatures are -30 °C for 40%, -20 °C for 48%, -20 °C or 52%, and -22 °C for 62% by weight.
(Pickering, 1893)
32

113
_S
Q.
E
0
-5
-10-
-15-
-20 -
-25-
-30 -
-35-
-40 -
-45-
-50-
-55-
-60
0
0
i0
R80
\\
\
0
\O 0
0 \/
0 _:
0 0
22 4.5 6.8 9.0 11.2 13.5 15.7 M
I I I I I I I10 20 30 40 50 60 70 80
Percentby wt,%
Figure 22. Equilibrium freezing temperatures and experimental data showing temperatures and molarity where
nucleation was initiated. (Picketing, 1893)
next higher concentration, and because our equipment could not obtain sufficiently cold temperatures. At these
temperatures, sulfuric acid became highly viscous. This is shown in appendix A where sulfuric acid became very
viscous with a slight decrease in temperature, which will be discussed later. Figure 23 illustrates the equilibrium
freezing curve of sulfuric acid solution by Gable, et al. (1950) with freezing and measurement points from the survey.
This figure also presents data showing we were unable to nucleate concentrations above 35% by weight at
temperatures the equipment could attain.
Mixtures of Acids
Much is generally known about sulfuric and nitric acid independently but information on the behavior of their
mixtures is needed to understand PSC formation processes. Studies show that they behave very differently in the
presence of a cold environment. The supercooling procedure remained identical to that used for the unmixed
solutions. Sulfuric and nitric acids were mixed, making two concentrations and each concentration having two
different mixtures: 5% H2SO4 to 95% HNO3 and 20% H2SO 4 to 80% HNO 3 at 1.0 M and 3.0 M. The growth rates
observed were quite uniform, and as expected, the growth rates increased with supercooling. This was observed for
both the 1.0 M and 3.0 M concentrations. A surprise was that the growth rates for the mixtures were higher than for
the 1.0 M and 3.0 M solutions of sulfuric and nitric acid independently; figures 24 and 25 show these results. Each
growth rate test was conducted several times and the results averaged. Again, the curve fit line intentionally deleted
the first few less precise data points. These growth rate curves provided show what appears to be a dependence on
the concentration of sulfuric acid. For example, the growth rate for the 3.0 M 95-5% nitric is generally higher than
for 80-20% nitric at the low supercooling, and at the larger supercooling the growth rate is significantly higher. The
same description can be made for the 1 m concentration growth rates.
33

0I..-
| | | I I I i I
0 0 0 0 O 0 0 O
i ! i
00ap 'aJn_,eJaduJa£
0
0
0
C)
O J3
i iC)
C)
o _
_ m
o _o _°,.._O
,._ ,...._.._
d __.__N

5.0
"7
E¢3
(.)O
>p.
2
4.0.
3.0-
2,0 °
1.0"
0.0 01D =0 -5 -25
A //
I i///
95% Nitric //,"
5% Sulfuric --//
//6/,o,,,o...80* Nitric .__.._._,_ /0 ,/
-1'o -i; -2bTemperature, C
Figure 24. Growth velocity curves for 80% and 95% HNO 3 and 20% and 5% H2SO 4 mixtures at 1 m.
0.5
i
¢/)
E¢3
_z3Oo
>¢-
2C9
0.4-
0°3 °
0.2
0.1
0-15
95% Nitric5% Sulfuric
++
4-+
+-t-3M Nitric
p I
s /# // /
/80% Nitric20% Sulfuric
+80% Nitric20% Sulfuricw/Soot
95%Nitric
5% Sulfuric o
-20 -25 - 30 -35 -40 -45
Temperature, C
Figure 25. Growth velocity curves for 80% and 95% HNO 3 and 20% and 5% H2SO 4 mixtures at 3 m. Curves also
show the growth velocities for the same mixtures with a small amount of soot added.
35

Addition of Non-Soluble Material
Soot is generally a non-soluble material and does not dissolve within a solution of sulfuric and nitric acid, but
may affect the crystallization characteristics of the solution by acting as an impurity. As an impurity the soot should
act to decrease the degree of supercooling and act to nucleate the solution earlier. Figure 24 shows the resulting
curves for the addition of a small amount of soot into the 3.0 M mixtures. Indications by these growth curves seem
to show a decrease in the growth rate for both mixtures. Also the data reveals that the addition of the soot has
produced a few additional degrees of supercooling. If the soot were truly an active nucleating impurity, the
nucleation point would actually be wanner. Hence the data from this experiment are suspect. As mentioned earlier,
the exact age and composition of the soot is highly questionable. However, if the data are in fact valid, there must
be some part of the soot particle that becomes part of the solution. The likelihood of aging processes or contaminants
acquired postflight by the soot must be considered.
CHAPTER 5: DISCUSSION OF RESULTS
Growth rates of solution are generally described by the equation V = A(AT) P where P is the best fit slope of
the growth velocity on a log-log plot (figures 26 through 30). These plots show the slope for ammonium sulfate,ammonium bisulfate, sodium chloride, nitric acid, and sulfuric acid for each molality and molarity. The P values for
each are listed below:
Ammonium Sulfate
P = 1.7 _+0.2 (1 m)
P = 1.5 _+0.2 (2 m)
P = 1.3 _+0.2 (3 m)
P = 0.99 _+0.1 (4 m)
P = 0.71 _+0.1 (5 m)
A = 0.015
Ammonium Bisulfate
P = 1.88 _+0.2 (1 m)
P = 1.7 _+0.1 (2 m)
P = 1.3 _+0.1 (3 m)
P = 1.3 _+0.1 (4 m)
P = 1.1 _+0.2 (5 m)
A = 0.02
Sodium Chloride
P = 2.0 _+0.2 (1 m)
P = 2.0 _+0.2 (2 m)
P = 1.9 _+0.2 (3 m)
P = 1.7 _+0.2 (4 m)
P = 1.3 _+0.2 (5 m)
A = 0.022
Nitric Acid
P = 1.9 _+0.2 (2 M)
P = 0.55 _+0.1 (2 M)
P = 0.44 _+0.1 (3 M)
A = 0.011
Sulfuric Acid
P = 1.0 _+0.1 (1 M)
P = 0.64 _+0.1 (2 M)
P = 0.30 _+0.1 (3 M)
P = 0.50 _+0.2 (3.5 M)
A = 0.007
The values for A, are constant for a given substance; V is in cm sec -1 .
These experimental results illustrate the point that ammonium sulfate, ammonium bisulfate, sodium chloride,
and sulfuric and nitric acid, have complicated dependences of growth rate as compared to concentration. On these
log-log plots it can be easily shown the approximate supercooling in which the viscosity effects begin to dominate.
This is shown by the bending over of the curves to a slower growth rate. The experimental setup worked well over
the course of this study, and has been shown to be very effective in obtaining growth velocities and supercooling
data over the entire range of temperatures and concentrations.
36

10
EU
"Go
e-
5-
0.5
0.1
OO
T "t°
± /
1 m0
O
o 2m0
0 •
0 o • •
3m
0
° ° • u• 4m• 4•0
O
o •a• nA
" a 5m
&
!1'0 50Supercooling, K
Figure 26. Growth velocity as a function of supercooling for sodium chloride.
100
10
5-
1i
E 0.5o
..g
>
o
0.05
0.01
off
o _
lm
o 0 oo
o 2m
Ot •o o
_•• 3111
©o n n• _ 4m
o O
O
o • &6 _
5m
i I
5 10 50
Supercooling, K
Figure 27. Growth velocity as a function of supercooling for ammonium bisulfate.
lOO
37

10
5*
T-
o 0.5¢n
Eo
e-
o
o 0.1.
0,05-
0.01
O
,w =a£
• 6
&A
o@
0
o
0tl
OdI'O
A &6
]m
2m
3m
5m
!5 ,bSupercooling, K
Figure 28. Growth velocity as a function of supercooling for ammonium sulfate.
100
I0
"7
EfJ
(Jo
>
t-
o
(5
0.5.
0.I
o
o
0
o
0
oo
1M
2M
3M.w-,.k
;=,± ," #'_T m.,,AD
.L ,
5 10 50
Supercooling, K
Figure 29. Growth velocity as a function of supercooling for nitric acid.
100
38

"7
Eq
,q
e-
o
(.q
10
5-
1
0.5
0.1°
0.05
0.01
0
o
0_r -h
i±
D
of@0
o 0 o
IM
2M
3Mo
3.5M
I5 ,b ;oSupercooling,K
Figure30.Growth velocityasafunctionof supercoolingforsulfuricacid.
I00
The growth rates as a function of tube diameter show a strong dependence on tube diameter. The data show
crystal growth rates within a glass tube are significantly reduced with decreasing diameter; conversely, the crystal
growth rate increases with larger diameters. However, the data also show a limit in the crystallization rate with
increasing diameter. In comparison, stratospheric cloud particles exist in relatively small volumes, on the order of
about 4.0 I.tm3, compared to the smallest volume used in this study of about 0.0412 cm 3 (22/7 × (0.025) 2 × 21 cm),
or about 10 million times smaller. These results were similar to those found by Yang and Good (1966), who found
that the size of the tubing directly affected the growth rate. The growth rates depend on the tube diameter, degree of
supercooling, and the thermal conductivity of the tubing material. However, it is not clear which parameter controls
the growth rates, and at what temperature the influence of these parameters change. A challenge exists to develop a
system that will support the large supercooling of the smaller diameter tubing while allowing the growth rate of the
larger diameters.
The growth rates for ammonium sulfate, ammonium bisulfate, and sodium chloride show that for a given
concentration the growth rate increases with increasing supercooling, and at a given supercooling the growth rate
decreases with increasing concentration. These results are consistent with those of O'Hare and Reed (1973).
Indications from solubility tables (International Critical Tables, 1922) suggest that these materials may not
contribute to the existence of the PSCs at normal stratospheric conditions, 1% relative humidity at 200 K. As
illustrated by Twomey (1977), the phase transition of a particle from a solid to liquid will not occur until a sufficient
relative humidity exists, shown in table 2. These conditions, in general, never exist. However, these materials are the
natural material by which tropospheric processes such as fog and haze occur, with relative humidity significantly
greater than the stratosphere.
The growth rate data suggest, as the concentrations increase, a tendency for the growth curves to reach a
maximum followed by leveling off with supercooling. Consider the possibility that once this maximum rate is
reached, and provided additional supercooling can be obtained, a decrease in growth rate can be observed, as
39

suggestedbythealternatecurve.If thisactuallyoccurs,andthevolumeisreducedsufficiently,it maybepossibletoachieveapointwherenogrowthoccurs,leavingthedropletinaso-called"glasstransition"Thisglasstransitionhasbeencharacterizedbyasolutionbecomingsoviscousduetotheextremesupercooling,thedropletactuallytakeson glass-likecharacteristics.Thisglass,however,still a liquid,exhibitsa high viscositywherethe diffusionpropertiesarereducedtothoseof asolid.Inaddition,thereductionof thesepropertiesmaycausetheheterogeneousreactionswhichoncetookplaceinternally,to nowoccuronlyonthesurface.However,becauseourtestusesasamplevolumemanymagnitudeslargerthanactualdropletsit isdifficultto determinewhetheraglasstransitionoccurswiththevolumesin thisstudy.AppendicesA andB showadditionaldatadescribingtheaffectsof temperatureandviscosityonsulfuricandnitricacidrespectively.
Sulfuricacidis veryhygroscopic;it maynot freezeat 100%byweight,andmayneverfreezeasanaerosoldueto viscosityeffects.Figure23showstheassumedsulfuricacidequilibriumfreezingtemperaturewith respectto concentration,whereat 38%by weight(7.5M), a temperature of nearly -80 °C is required before nucleation
can occur. This study was only able to nucleate sulfuric acid up to 3.5 M (31% by weight). Ohtake's (1993) work
illustrates similar problems. In his work he tried to nucleate sulfuric acid at all concentrations; however, atconcentrations between 37.5% and 65% he was able to nucleate sulfuric acid at temperatures near -65 °C, but
was not successful in attempts to nucleate sulfuric acid above concentrations of 65% by weight at temperatures of
-104 °C. Ohtake discovered that the phase diagrams (represented in fig. 24) used from Gable, et al. (1950) were
actually the melting points of sulfuric acid and its hydrates, instead of nucleation temperatures. Figure 6 shows
how sulfuric acid deliquesces as a function of temperature in cases of a fixed mixing ratio.
For nitric acid the lowest equilibrium temperature was -40 °C, whereas sulfuric was -80 °C. Another
characteristic that separated the two acids was viscosity as a function of concentration. At 100% by weight, sulfuric
acid has a viscosity of 25.2 cP (Centipoise) at 20 °C, where nitric acid at 100% by weight has a viscosity less than
water at 0.88 cP. For the higher concentrations, the nucleation temperatures were warmer, and nitric acid permitted
nucleation. This became important when temperatures fell below 195 K. Figure 21(a) shows a change of growth
rate because of temperature and viscosity changes. Significant growth rates are observed for equilibrium curves at
temperatures between -10 to -25 °C. These curves show an increase in growth rate due to temperature. Also, when
temperatures are below -25 °C the growth rates decrease due to viscosity effects. These conditions showed a
growth rate increase of a factor of three, with a 2.0 M increase in concentration and 10 °C warming. At the same
temperature and a concentration increase of 1.0 M, for example, the viscosity increased and the growth rate
decreased by one-third.
A phenomena was observed for nitric acid which demonstrates the presence of a hydrate. This consisted of a
secondary crystallization. Initial crystal growth occurred in the normal observed way for 7.6 M nitric acid at a
temperature near -50 °C, 20 K supercooled at 0.2 cm sec -1. The secondary growth occurred several minutes after
the completion of the first, at a growth rate of about 0.01 cm sec -1. This data was not illustrated on the figure
presented. The second front had a whiter appearance, suggesting very fine crystals. This secondary front generally
occurred at the higher concentrations, and could not be reliably repeated.
A significant increase in the growth rate is observed in a mixture of nitric and sulfuric acid for both the 1.0 M
and 3.0 M concentrations. In addition, the data suggest that an increase in the equilibrium temperature freezing point
may occur. Several runs were conducted showing good repeatability in the data. Molina, et al. (1993) have also
shown that the growth rates will greatly increase with the addition of nitric acid into bulk sulfuric acid.
A limited number of runs were carried out in this study, with aircraft soot being added to the acid mixtures. The
most important feature is the decrease of the nucleation temperature, which lowers the contribution from the mixture
to nearly its original values. It is possible that in the atmosphere, the ternary H2SO4/H20/HNO3 exists and soot
40

mixeswith aparticle.If so,theaerosolmaycontaina smallportionof unburnedfuel thatmaycontributeto anincreasedviscosityandconcentration,thusreducingthecrystalgrowthrate.
Diffusion Chamber
Another method in analyzing the processes in PSC formation will involve the use of a thermal diffusion chamber.
This study will combine processes to show the stages of PSC growth from aerosol activation to NAT crystal growth.
This technique will be used to study the shape of the growing crystal under the influence of temperature, saturation
ratio and supersaturation. This diffusion chamber will provide the controlled conditions necessary to aid in the
simulated growth of the PSC, particularly the formation of the NAT particles. As a result of the experience with the
present thermal diffusion chamber, recommendations for future test apparatus are described below. This
recommended system will contain sulfate aerosols, water, and nitric acid vapor within two parallel plates separated
by 3 cm. These two plates will each be temperature controlled by the use of thermoelectrics, and cooled by an
external circulation bath system to withdraw heat produced by these thermoelectrics. Each plate will have a specified
temperature with the top plate being warmer to provide the source of vapor, made of an acid resistant stainless steel,
while the bottom plate will be colder to produce the supersaturation. The chamber walls will be made of acid
resistant plastic. Temperature range will be from -90 ° C on the lower plate to -60 °C on the upper plate. A linear
temperature gradient will establish a saturation vapor pressure curve (according to the Clausius-Clapeyron equation,
as a function of temperature) between the lower and upper plates. This chamber can be adjusted to the desired
temperature providing many degrees of supersaturations. However, since the nitric acid and water vapor each will
have their own independent saturation profiles, there will exist two independent points of supersaturations between
the plates. This point of maximum supersaturation will be the location where the crystals grow.
Recommendations
In the future, improved testing techniques and equipment for temperatures to -100 °C should be considered a
necessity in order to obtain the high degree of supercooling needed to validate the theory which describes the growth
rate with decreasing temperatures. To complete the analysis of the supercooling effects, a design like the diffusion
chamber would be useful to obtain the crystallization properties of the sulfuric-nitric acid mixtures, and to examine
the true effects of supercooling and viscosity in a free environment on extremely small aerosol particles.
Conclusions
Results from the present experiments indicate and support a theory that sulfuric acid aerosols may not be frozen
at the temperatures where nitric acid uptake begins. This conclusion is obtained by the fact that HNO3 uptakes onto
aerosols at temperatures near 195 K. At that temperature, assuming normal stratospheric conditions, the droplet is
about 50% H2SO 4 by weight, and only 10 K supercooled. As shown in this study, sulfuric acid is not nucleated
above 31% by weight (3.5 M). In addition, at temperatures below -50 °C, the viscosity effect is such that the
probability of nucleation taking place becomes very low. However, this study has shown that if nitric acid can be
added into the solution droplet, nucleation may be possible at higher temperatures.
The acid mixture data show a growth rate dependence on the H2SO4-HNO3 mixture fraction and temperature.
This implies that the probability of nucleation for a sulfuric acid particle increases with the presence of nitric acid.
The adding of a non-reactive soot to a solution decreases the growth rate. Applying the volume theory, the droplet
could become a glass at lower temperatures. To a small degree, the addition of soot to a solution tends to show a
reduction in growth rate and supercooling. Whether this is considered important remains to be seen, but at a first
glance may suggest some important factors regarding the formation of contrails, which are always observed with
passing aircraft in cold atmospheric conditions.
41

In a realisticenvironment,sodiumchloride,_mmoniumsulfateand ammoniumbisulfatewouldnot beconsideredasignificantcontributiontostratosphericaerosol.Sincethesesaltswouldonlybefoundasasolidaerosol,andtheirdeliquescencepointis toohigh,>70%RH,theycouldbeneglectedasaparticipantin PSCformation.However,theseaerosolscanbetransportedintotheuppertroposphereandlowerstratospherebydeepconvection,anddependingupontherelativehumidityreachingthedeliquescencepoint,theseparticlesmayactivateandbecomeahighaltitudehazeorcirruscloud.Figures29through31illustratethechangeinequilibriumsizewithincreasinghumidityforammoniumsulfate,nitricacid,andsulfuricacidinKohlercurves.TheseKohlercurvesalsoindicatethechangein molalityandmolarityofeachof theparticlesranginginmassfrom10-17to 10-14grams.Aerosolsmayalsocontributetotheproductionof visiblecontrailsathighhumidities.Coldtemperatures,<-60 °C,duringlatefallandearlyspring,combinedwiththemoistureadvectedbystormsystems,mayoftenprovidetheseconditions.
Implications
Increasing viscosity of high concentration solutions with decreasing temperature indicates a lowering of thediffusion coefficient. The diffusion coefficient for water is about 10-4; glass approaches 10-12 cm 2 sec -1,
comparable with a solid. The rate of diffusion of any size droplet is described by r2/D. For a droplet of 1 Ixm, thismeans it takes 10-4 sec for water and 104 sec for a glass. With lifetimes of some clouds being 103 s, for PSC and
cirrus, surface absorption reactions become important for ice and deeply supercooled stratospheric cloud particles;
for liquid water droplets, the diffusion process occurs readily. It is not readily understood which process is the most
important to each type of cloud.
.2m .Im(.2M) (,IM)
: 120m
: / (IOM)l
: /
: I
" i
: /: iI
; g: i
0.05 0.1
Ammonium Sulfate
I
10-17 ilO-le
0.0 0150.01
Radius, Microns
(a) Ammonium sulfate.
Figure 31. Kohler curves for ammonium sulfate, nitric acid, sulfuric acid with molar and molal concentrationsindicated.
42

L,O
e-c-
Saturation Ralio
E: 0 I i I I
_'t -
-_ i i i i
o I ....................i......... ! i
o_.
_ ....... _...... I \¢D "- "i =
: "-kI : I'o
o "'• ...... i
oq
o
w.-o
¢....1
:::t.¢3
i.-.°
,..%":::r'
0v...-.
_-t
o1....,
o
.,.-.
""4..
_t
g _._-;_ i
_c__ c
o
0
0
0
o
0
o
_Z
o
Saturation Ratio
-I= c_
_° ............
_'"-°...qp.°_.
o .,-oo
\
4_
"°°'o
I=..o tl,
..,
I

The addition of aircraft exhaust soot has been shown to hinder the growth and nucleation process of solutions.
Why and how these effects occur need to be studied further and exhaust from a variety of aircraft must be used. It
appears that depending on temperature and stratospheric water content, stratospheric cloud particles are able to exist
in metastable compounds; however, these situations are extremely difficult to predict and should be viewed as the
next research challenge.
The abundance of lower atmosphere aerosols may be useful as condensation cloud nuclei (CCN) for contrails.
In addition to the natural aerosols present, the current aircraft fleet deposits a significant amount of particulate
matter which produce contrails on a regular basis. There is some evidence, as observed by studying the sky
sometime after a contrail has been produced, that on occasion the contrails will eventually form a cirrus cloud.
However, because such material exists in the upper troposphere and lower stratosphere this matter should be
considered by future investigations.
The overall implication is that particles at cirrus and PSC levels are capable of existing in a metastable condition.
These particles may provide significant effects on chemical reaction rates through internal mixing, leading to ozone
destruction; however, for highly viscous liquids only surface reactions occur.
44

BIBLIOGRAPHY
Cadle, R. D., Grahek, F. E., Gandrud, B. W., and Lazrus, A. L., 1973: "Relative Efficiencies of Filters and Impactors
for Collecting Stratospheric Particulate Matter," J. Atmos. Sci., vol. 30, pp. 745-747.
Carslaw, H. S. and Jaeger, J. C., 1959: Conduction of Heat in Solids, 2nd ed., Clarendon Press.
Crutzen, Paul J. and Arnold, Frank, 1986: "Nitric Acid Cloud Formation in the Cold Arctic Stratosphere - A Major
Cause for the Springtime 'Ozone Hole'" Nature, vol. 324, pp. 651-655.
Farman, J. C., Gardiner, B. G., and Shanklin, J. D., 1985: "Large Losses of Total Ozone in Antarctica Reveal
Seasonal C10(x)/NO(x) Interaction," Nature, vol. 315, pp. 207-210.
Friend, James P., Leifer, Robert, and Trichon, Morris, 1973: "On the Formation of Stratospheric Aerosols," J. Atmos.
Sci., vol. 30, pp. 465-479.
Gable, C. M., Batz, H. E, and Maron, S. H., 1950: "Phase Equilibria of the System Sulfur Trioxide-Water," J. Amer.
Chem. Soc., vol. 72, pp. 1445-1448.
Garcia, R. R. and Soloman, S., 1983: "A Numerical Model of the Zonally Averaged Dynamic and Chemical
Structure of the Middle Atmosphere," J. Geophys. Res., vol. 88, pp. 1379-1400.
Glasstone, Samuel and Lewis, David, 1960: Elements of Physical Chemistry, 2nd ed., Van Neustrian Co., Princeton,
New Jersey.
Gmitro, John Irving and Vermeulen, Theodore, 1964: "Vapor-Liquid Equilibria for Aqueous Sulfuric Acid" Amer.
Inst. of Chem. Eng. J., vol. 10, no. 5, pp. 740-746.
Goodman, J., Toon, O. B., Pueschel, R. E, Snetsinger, K. G., and Verma, S., 1989: "Antarctic Stratospheric Ice
Crystals," J. Geophys. Res., vol. 94, pp. 16449-16457.
Hallett, J., 1964: "Experimental Studies of the Crystallization of Supercooled Water," J. Atmos. Sci., vol. 21,
pp. 671-682.
Hallett, J. and Lewis, R. E. J., 1967: "Mother-of-Pearl Clouds," Weather, vol. 22, no.2, pp. 56-65.
Hamill, P., Toon, O. B., and Kiang, C. S., 1977: "Microphysical Process Affecting Stratospheric Aerosol Particles,"
J. Atmos. Sci., vol. 34, pp. 1104-1119.
Hamill, P., Turco, R. P., Kiang, C. S., Toon, O. B., and Whitten, R. C., 1982: "An Analysis of Various Nucleation
Mechanism for Sulfate Particles in the Stratosphere," J. Aerosol Sci., vol. 13, no. 6, pp. 561-585.
Hamill, P., McMaster, L. R., 1983: "Proceeding of a Workshop on Polar Stratospheric Clouds: Their Role in
Atmospheric Processes," NASA-CP-2318.
Hamill, Patrick, Turco, R. P., and Toon, O. B., 1988: "On the Growth of Nitric and Sulfuric Acid Aerosol Particles
Under Stratospheric Conditions" J. Atmos. Chem, vol. 7, pp. 287-315.
Hamill, Patrick and Toon, Owen B., 1991: "Polar Stratospheric Clouds and the Ozone Hole," Physics Today, vol. 44,
pp. 34-42.
Hanson, David and Mauersberger, Konrad, 1988: "Laboratory Studies of the Nitric Acid Trihydrate - Implications
for the South Polar Stratosphere," Geophys. Res. Lett., vol. 15, pp. 855-858.
Hofmann, D. J., Rosen, J. M., Pepin, T. J., and Pinnick, R. G., 1975: "Stratospheric Aerosol Measurements. I - Time
Variation at Northern Midlatitudes," J. Atmos. Sci., vol. 32, pp. 1446-1456.
Hofmann, D. J., 1990: "Increase in the Stratospheric Background Sulfuric Acid Aerosol Mass in the Past 10 Years,"
Science, vol. 248, pp. 996-1000.
45

Humphreys-Owen,S.E F.,1949:"CrystalGrowthfromSolution,"Proceedings of the Royal Society of London,
series A, vol. 197, no. A 1048, pp. 218-237.
Hunten, D. M., Turco, R. E, and Toon, O. B., 1980: "Smoke and Dust Particles of Meteoric Origin in the Mesosphere
and Stratosphere," J. Atmos. Sci., vol. 37, pp. 1342-1357.
International Critical Tables of Numerical Data, Physics, Chemistry and Technology, 1st ed., (1922), vol. 3,
McGraw-Hill, New York.
Jet Propulsion Lab., Chemical Kinetics and Photochemical Data for use in Stratospheric Modeling, NASA-
CR-176198, 1985. (Also published as JPL-PUB-85-37.)
Junge, Christian E, Chagnon, Charles W., and Manson, James E., 1961: "Stratospheric Aerosols," J. Meteor., vol. 18,
pp. 81-108.
Lindenmeyer, C. S, Orrok, G. T., Jackson, K. A., and Chalmers, B., 1957: "Rate of Growth of Ice Crystals in
Supercooled Water," J. Chem. Phys., vol. 27, no. 6, p. 822.
Low, Richard D. H., 1969: "A General Equation for the Solution Effect in Droplet Growth" J. Atmos. Sci., vol. 26,
pp. 608-611.
Mastenbrook, H. J., 1968: "Water Vapor Distribution in the Stratosphere and High Troposphere," J. Atmos. Sci.,
vol. 25, pp. 299-311.
McCormick, M. E, Chu, W. E, Steele, H. M., Hamill, E, and Swissler, T. J., 1982: "Polar Stratospheric Cloud
Sightings by SAM II--Stratospheric Aerosol Measurement Onboard Nimbus 7," J. Atmos. Sci., vol. 39,
pp. 1388-1397.
Molina, M. J., Zhang, R., Wooldridge, E J., McMahon, J. R., Kim, J. E., Chang, H. Y., and Beyer, K. D., 1993:
"Physical Chemistry of the H2SO4/HNO3/H20 System: Implications for Polar Stratospheric Clouds," Science,
vol. 261, pp. 1418-1423.
Nair, E V. N. and Vohra, K. G., 1974: "Growth of Aqueous Sulfuric Acid Droplets as a Function of Relative
Humidity," J. Aerosol Sci., vol. 6, pp. 265-271.
Ohtake, Takeshi, 1993: "Freezing Points of H2SO4 Aqueous Solutions and Formation of Stratospheric Ice Clouds"
Tellus, Series B - Chemical and Physical Meteorology, vol. 45B, no. 2, pp. 138-144.
O'Hare, M. and Reed, C. R., 1973: Modeling Crystal Growth Rates From Solution, Prentice-Hall, Inc., Englewood
Cliffs, New Jersey, (out of print).
Picketing, S. U., 1893: "Isolation of Two Predicted Hydrates of Nitric acid," J. Chem. Soc., vol. 63, pp. 436-443.
Poole, Lamont R. and McCormick, M. Patrick, 1988: "Polar Stratospheric Clouds and the Antarctic Ozone Hole,"
J. Geophys. Res., vol. 93, pp. 8423-8430.
Pruppacher, H. R. and Neiburger, M., 1963: "The Effects of Water Soluble Substances on the Supercooling of Water
Droplets" J. Atmos. Sci., vol. 20, pp. 376-385.
Pueschel, R. E, Ferry, G. V., Snetsinger, K. G., Goodman, J., Dye, J. E., Baumgardner, D., and Gandrud, B. W., 1992:
"A Case of Type I Polar Stratospheric Cloud Formation by Heterogeneous Nucleation," J. Geophys. Res., vol. 97,
no.D8, pp. 8105-8114.
Rosen, James M, 1964: "The Vertical Distribution of Dust to 30 Kilometers," J. Geophys. Res., vol. 69, no. 21,
pp. 4673-4676.
Rosen, J. M., Hofmann, D. J., and Laby, J., 1975: "Stratospheric Aerosol Measurements. II - The Worldwide
Distribution," J. Atmos. Sci., vol. 32, pp. 1457-1462.
46

Salawitch,R. J., Gobbi,G. E, Wofsy,S. C., andMcElroy,M. B., 1989:"Denitroficationin the AntarcticStratosphere"Nature, vol. 339, pp. 525-527.
Steele, Helen M., and HamiU, Patrick, 1981: "Effects of Temperature and Humidity on the Growth and Optical
Properties of Sulfuric Acid-Water Droplets in the Stratosphere," J. Aerosol. Sci., vol. 12, no. 6, pp. 517-528.
Steele, H. M., Hamill, P., Swissler, T. J., and McCormick, M. P., 1983: "The Formation of Polar Stratospheric
Clouds," J. Atmos. Sci., vol. 40, pp. 2055-2067.
Toon, Owen B., Pinto, Joseph, Hamill, Patrick, and Turco, Richard P., 1986: "Condensation of HNO 3 and HC1 in the
Winter Polar Stratospheres," Geophys. Res. Lett., vol. 13, pp. 1284-1287.
Toon, Owen B., Ferry, G., Turco, R. P., Jordan, J., and Goodman, J., 1989: "Physical Processes in Polar Stratospheric
Ice Clouds" J. Geophys. Res., vol. 94, pp. 11359-11380.
Turco, Richard P., Toon, Owen B., and Hamill, Patrick, 1989: "Heterogeneous Physicochemistry of the Polar Ozone
Hole" J. Geophys. Res., vol. 94, pp. 16493-16510.
Twomey, S., 1977: Atmospheric Aerosols, Series 7, Elsevier Scientific Publishing Co., New York.
U. S. Standard Atmosphere. 1976, U. S. Government Printing Office, Washington, D.C.
Yang, L. C. and Good, W. B., 1966: "Crystallization Rate of Supercooled Water in Cylindrical Tubes," J. Geophys.
Res., vol. 71, no.10, pp. 2465-2469.
Wedum, Ellen Elisabeth, 1979: "Schlieren Studies of Crystallization in Supercooled Sodium Sulfate Solution,"
M. S. Thesis, University of Nevada, Reno.
47

APPENDIX A: CHEMICAL REACTIONS WHICH PRODUCE SULFURIC ACID
According to laboratory experiments conducted by Friend, et al. (1973), the proposed stratospheric chemical
reactions that lead to stratospheric sulfate aerosols are:
0 3 + hv(_, = 200 - 300 nm) --->0 2 + O
SO2(g ) + O + M --->SO 3 + M
SO 3 + H20(1) --->H2SO4(1 )
H2SO 4 + H20 --4 H2SO 4 • H20
Table A-1. Vapor pressures (mm Hg) H2SO4 and H20 in solution. (Gmitro and Vermeulen, 1964).
Temperature, Weight percent H2SO4
(K) 70 72 74 76 78 80
H2SO 4 1.3 xE-14 3.58 ×E-14 1.0 xE-13 2.86 xE-13 8.25 xE-13 2.52 ×E-12218.16
H20 4.17 × E-4 2.68 x E-3 1.6 x E-3 8.97 × E-5 4.97 x E-5 2.18 x E-5
H2SO4 5.02×E-14 1.35×E-13 3.7×E-13 1.03xE-12 2.93xE-12 8.69xE-12223.16
H20 8.16 x E-4 5.23 x E--4 3.17 x E--4 1.8 x E--4 9.46 x E-5 4.49 × E-5
H2SO 4 1.81xE-13 4.7xE-13 1.29xE-12 3.51×E-12 9.78xE-12 2.82×E-11228.16
H20 1.54 × E-3 9.93 x E-4 6.08 × E-4 3.5 × E-4 1.86 x E-4 8.99 x E-5
H2SO 4 6.17×E-13 1.51xE-12 4.23xE-12 1.13×E-11 3.08×E-11 8.67×E-11233.16
H20 2.82 x E-3 1.83 x E-3 1.13 × E-3 6.58 × E-4 3.55 x E-4 1.75 x E-4
H2SO4 1.99xE-12 5.12xE-12 1.32xE-11 3.47xE-11 9.24xE-11 2.43×E-10238.16
H20 5.03 x E-3 3.23 × E-3 2.06 x E-3 1.21 × E-3 6.6 x E-4 3.3 x E-4
48

APPENDIX B: PHOTOCHEMICAL REACTIONS
LEADING TO NITRIC ACID FORMATION
Jet Propulsion Laboratory (1985) suggests that nitric acid is produced by the following reactions
OH + NO 2 + M --_ HNO 3 + M
and destroyed by photolysis
and reactions with OH
HNO 3 + hv(_ = 320 nm) --_ OH + NO 2
OH + HNO 3 -_ H20 + NO 3
There are, in addition to these, many more reactions that lead to the formation and subsequent buildup of HNO3;
NO + 03 --_ NO 2 + 02
NO 2 + 03 --_ NO 3 + 02
NO 2 + NO 3 + M --4 N205 + M
N205 + H20 _ 2HNO 3
Another possible formation reaction of HNO3 in the absence of N205 is
NO + O _ NO 2
4NO 2 + 2H20 + 02 --_ 4HNO 3
Since the duration of sunlight during the winter months is a function of latitude, the lifetimes of HNO3 can vary
throughout the stratosphere and can be shown to be dependent on latitude. After nitric acid has formed it can then
aid in growth of PSCs under particular stratospheric conditions by condensation onto frozen sulfate aerosols or other
existing aerosols when temperatures fall below 200 K.
AE
4)
E
oD.a.<
7O
60-
50-
40
3O
2O
10
J/l////11
O. 1 days ////[
////
10.0 days / 30 days
15 25 3_ 4_ s_ 6_ 70
Latitude (deg)
Figure B-1. Photochemical lifetime of HNO 3 for winter, as calculated by Garcia-Soloman (1983) as a function ofaltitude and latitude.
49

APPENDIX C
Table C-1. Thermal properties of common substances. (Carslaw and Jaeger, 1959)
Density, Specific heat, Conductivity, Diffusivity,Substance g cm -3 cal g-1 K-1 cal crn -1 sec -1 K -1 cm 2 sec -1
Copper 10.49 0.0556 1.00 1.14
Silver 9.94 0.93 0.93 1.71
Brass 8.5 0.09 0.25 0.33
Steel 7.85 0.118 0.11 0.12
Air 0.00129 0.24 0.000058 0.187
Ice 0.92 0.502 0.0053 0.0115
Glass 2.4 0.20 0.0028 0.0058
Snow 0.1 0.5 0.00025 0.005
Water 1.0 1.0 0.00144 0.00144
5O


REPORT DOCUMENTATION PAGE FormApprovedOMB No. 0704-0188
Publicreportingburdenforthiscollectionof informationis estimatedto average 1 hourperresponse,includingthe time for reviewinginstructions,searchingexistingdata sources,gatheringandmaintainingthe data needed, and completingand reviewingthe collectionof information.Send commentsregardingthis burdenestimateor any other aspect ofthis collectionof information,includingsuggestionsfor reducingthisburden,toWashingtonHeadquartersServices.DirectorateforInformationOperationsand Reports,1215 JeffersonDavisHighway,Suite 1204, Arlington,VA 22202-4302, and tothe Office of Managementand Budget,PaperworkReductionProject(0704-0188), Washington,DC 20503.
1. AGENCY USE ONLY (Leave blank) 2. REPORT DATE 3. REPORTTYPE AND DATES COVERED
March 1997 Contractor Report
4.TITLE AND SUBTITLE 5. FUNDING NUMBERS
A Laboratory Study on the Phase Transition for Polar Stratospheric CloudParticles
6. AUTHOR(S)
Edward H. Teets, Jr.
7.PERFORMINGORGANIZATIONNAME(S)ANDADDRESS(ES)
NASA Dryden Flight Research CenterP.O. Box 273
Edwards, California 93523-0273
9.SPONSORING/MONITORINGAGENCYNAME(S)ANDADDRESS(ES)
National Aeronautics and Space Administration
Washington, DC 20546-0001
WU 529-10-04
8. PERFORMING ORGANIZATION
REPORT NUMBER
H-2147
10. SPONSORING/MONITORING
AGENCY REPORT NUMBER
NASA CR-198056
NASA Contract NAG-2572
11.SUPPLEMENTARY NOTES
12a. DISTRIBUTION/AVAILABILITY STATEMENT
Unclassified--Unlimited
Subject Category 46
12b. DISTRIBUTION CODE
13. ABSTRACT (Maximum 200 words)
The nucleation and growth of different phases of simulated polar stratospheric cloud (PSC) particles were
investigated in the laboratory. Solutions and mixtures of solutions at concentrations 1 to 5 m (molality) of
ammonium sulfate, ammonium bisulfate, sodium chloride, sulfuric acid, and nitric acid were supercooled to
prescribed temperatures below their equilibrium melting point. These solutions were contained in small
diameter glass tubing of volumes ranging from 2.6 to 0.04 ml. Samples were nucleated by insertion of an ice
crystal, or in some cases by a liquid nitrogen cooled wire. Crystallization velocities were determined by timing
the crystal growth front passages along the glass tubing. Solution mixtures containing aircraft exhaust (soot)
were also examined. Crystallization rates increased as AT2, where AT is the supercooling for weak solutions
(2 m or less). The higher concentrated solutions (>3 m) showed rates significantly less than AT2. This reduced
rate suggested an onset of a glass phase. Results were applied to the nucleation of highly concentrated solutions
at various stages of polar stratospheric cloud development within the polar stratosphere.
14. SUBJECTTERMS
Cloud research, Crystals, Stratospheric circulation, Temperature effects,
Thermodynamic properties of liquids
17. SECURITY CLASSIFICATION 18. SECURITY CLASSIFICATION 19. SECURITY CLASSIFICATION
OF REPORT OFTHIS PAGE OF ABSTRACT
Unclassified Unclassified Unclassified
NSN 7540-01-280-5500 Available from the NASA Centerfor AeroSpace Information, 800 Elkridge Landing Road,Linthicum Heights, MD 21090; (301)621-0390
15. NUMBER OF PAGES
58
16. PRICE CODE
A04
20. LIMITATION OF ABSTRACT
Unlimited
Standard Form 298 (Rev. 2-89)Prescribed by ANSI Std. Z39-18298-102
National Aeronautics and
Space AdministrationCode JTT
Washington, D.C. 20546-0001USA
Official Business
Penalty for Private Use, $300
SPECIAL FOURTH-CLASS RATEPOSTAGE AND FEES PAID
NASAPERMIT No G27
POSTMASTER: If Undeliverable (Section 158
Postal manual) Do Not Return