A ide to T˜˚˛˝˙˚ˆˇ˘ D˛ ˘ˇ ˛˘ - TCH...
92
A Guide to Therapeutic Drug Monitoring from Texas Children’s Hospital Department of Pharmacy & Clinical Chemistry Service, Department of Pathology Editors Sridevi Devaraj, Ph.D., DABCC, FACB Director of Clinical Chemistry and Point of Care Testing Texas Children’s Hospital Brady S. Moffett, PharmD, MPH Clinical Pharmacy Specialist Texas Children’s Hospital Contributors Andrea Barton, PharmD Amanda Berger, PharmD M. Brooke Bernhardt, PharmD, MS, BCOP Sridevi Devaraj, PhD, DABCC, FACB Kimberly Dinh, PharmD, BCPS Timothy Humlicek, PharmD, BCPS Shelly Kim, PharmD Erin McDade, PharmD, BCPS Mindl M. Messinger, PharmD Brady S. Moffett, PharmD, MPH Ngoc-Yen Nguyen, PharmD Jennifer Placencia, PharmD Ruston Taylor, PharmD, BCPS, BCNSP Reviewers Eileen Brewer, MD Spencer Greene, MD Aamir Jeewa, MD Jeffrey J Kim, MD Robert Krance, MD George Mallory, MD Debra Palazzi, MD Karen Rabin, MD Danielle Rios, MD Eric Schafer, MD Angus Wilfong, MD Shweta Agarwal, MD ©2015 Texas Children’s Hospital
Transcript of A ide to T˜˚˛˝˙˚ˆˇ˘ D˛ ˘ˇ ˛˘ - TCH...

A Guide to
TherapeuticDrug Monitoring
fromTexas Children’s HospitalDepartment of Pharmacy &Clinical Chemistry Service, Department of Pathology
EditorsSridevi Devaraj, Ph.D., DABCC, FACBDirector of Clinical Chemistry and Point of Care TestingTexas Children’s Hospital
Brady S. Moffett, PharmD, MPHClinical Pharmacy SpecialistTexas Children’s Hospital
ContributorsAndrea Barton, PharmDAmanda Berger, PharmDM. Brooke Bernhardt, PharmD, MS, BCOPSridevi Devaraj, PhD, DABCC, FACBKimberly Dinh, PharmD, BCPSTimothy Humlicek, PharmD, BCPSShelly Kim, PharmDErin McDade, PharmD, BCPSMindl M. Messinger, PharmDBrady S. Moffett, PharmD, MPHNgoc-Yen Nguyen, PharmDJennifer Placencia, PharmDRuston Taylor, PharmD, BCPS, BCNSP
ReviewersEileen Brewer, MDSpencer Greene, MDAamir Jeewa, MDJeffrey J Kim, MDRobert Krance, MDGeorge Mallory, MDDebra Palazzi, MDKaren Rabin, MDDanielle Rios, MDEric Schafer, MDAngus Wilfong, MDShweta Agarwal, MD
©2015 Texas Children’s Hospital
A Guide toTherapeutic Drug MonitoringPreface
We are proud to introduce the Texas Children’s Hospital Guide to Therapeutic Drug Monitoring. To our knowledge, this is the first publication of its type developed specifical-ly for pediatric patients.
The manual was developed with the following goals in mind:1. To improve therapeutic drug level monitoring (TDM)
in pediatric patients and subsequent medication dos-ing based on therapeutic drug monitoring.
2. To act as a ‘safety net’ and tool for communication to improve TDM and medication dosing.
3. To act as a resource and educational document for phar-macists, nurses, students, trainees and medical staff.
To address these goals, the handbook has taken the fol-lowing basic format, answering three basic questions often encountered in TDM:
1. In whom should ‘drug levels’ be drawn?2. What action should be taken on patient drug levels
that have already been drawn?3. What factors influence or affect patient drug levels?
It is our hope that this manual achieves each of these goals and that patient care is improved by our efforts.
We thank all of the contributors from the clinical phar-macy specialist group, Pathology and the physicians who both donated their time and expertise to make this man-ual a reality. We also acknowledge the ongoing support of the Director of Pharmacy, Jeff Wagner, PharmD, MPH and Senior Vice President Tabatha Rice.
If there are any criticisms, comments, or suggestions that could improve the manual, please do not hesitate to contact us.
Brady S Moffett, PharmD, MPHSridevi Devaraj, PhD, DABCC, FACB
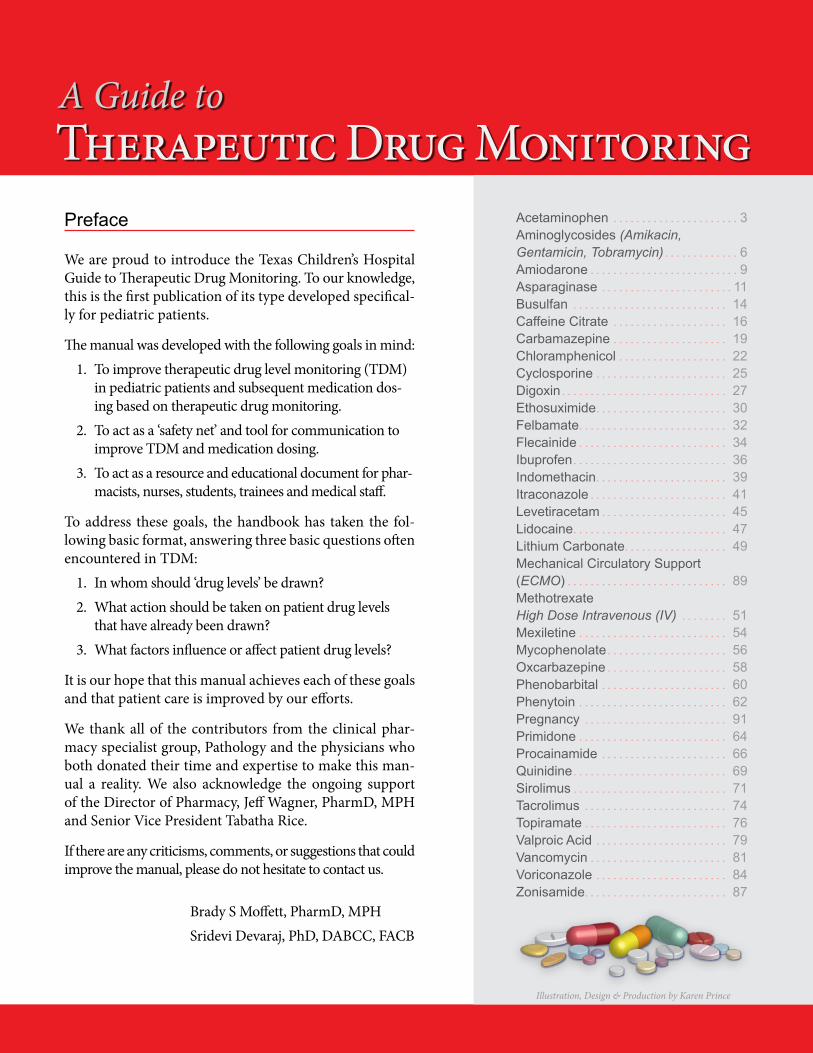
Acetaminophen . . . . . . . . . . . . . . . . . . . . . . 3Aminoglycosides (Amikacin, Gentamicin, Tobramycin) . . . . . . . . . . . . . 6Amiodarone . . . . . . . . . . . . . . . . . . . . . . . . . . 9Asparaginase . . . . . . . . . . . . . . . . . . . . . . . 11Busulfan . . . . . . . . . . . . . . . . . . . . . . . . . . . 14Caffeine Citrate . . . . . . . . . . . . . . . . . . . . 16Carbamazepine . . . . . . . . . . . . . . . . . . . . 19Chloramphenicol . . . . . . . . . . . . . . . . . . . 22Cyclosporine . . . . . . . . . . . . . . . . . . . . . . . 25Digoxin . . . . . . . . . . . . . . . . . . . . . . . . . . . . . 27Ethosuximide . . . . . . . . . . . . . . . . . . . . . . . 30Felbamate . . . . . . . . . . . . . . . . . . . . . . . . . . 32Flecainide . . . . . . . . . . . . . . . . . . . . . . . . . . 34Ibuprofen . . . . . . . . . . . . . . . . . . . . . . . . . . . 36Indomethacin . . . . . . . . . . . . . . . . . . . . . . . 39Itraconazole . . . . . . . . . . . . . . . . . . . . . . . . 41Levetiracetam . . . . . . . . . . . . . . . . . . . . . . 45Lidocaine . . . . . . . . . . . . . . . . . . . . . . . . . . . 47Lithium Carbonate. . . . . . . . . . . . . . . . . . 49Mechanical Circulatory Support (ECMO) . . . . . . . . . . . . . . . . . . . . . . . . . . . . 89MethotrexateHigh Dose Intravenous (IV) . . . . . . . . 51Mexiletine . . . . . . . . . . . . . . . . . . . . . . . . . . 54Mycophenolate . . . . . . . . . . . . . . . . . . . . . 56Oxcarbazepine . . . . . . . . . . . . . . . . . . . . . 58Phenobarbital . . . . . . . . . . . . . . . . . . . . . . 60Phenytoin . . . . . . . . . . . . . . . . . . . . . . . . . . 62Pregnancy . . . . . . . . . . . . . . . . . . . . . . . . . 91Primidone . . . . . . . . . . . . . . . . . . . . . . . . . . 64Procainamide . . . . . . . . . . . . . . . . . . . . . . 66Quinidine . . . . . . . . . . . . . . . . . . . . . . . . . . . 69Sirolimus . . . . . . . . . . . . . . . . . . . . . . . . . . . 71Tacrolimus . . . . . . . . . . . . . . . . . . . . . . . . . 74Topiramate . . . . . . . . . . . . . . . . . . . . . . . . . 76Valproic Acid . . . . . . . . . . . . . . . . . . . . . . . 79Vancomycin . . . . . . . . . . . . . . . . . . . . . . . . 81Voriconazole . . . . . . . . . . . . . . . . . . . . . . . 84Zonisamide. . . . . . . . . . . . . . . . . . . . . . . . . 87
Illustration, Design & Production by Karen Prince
— 3 —
A Guide to Therapeutic Drug Monitoring
Acetaminophen
IntroductionAcetaminophen is a commonly used and effective anal-gesic when administered in therapeutic dosages. When acetaminophen concentrations are high, secondary cyto-chrome P450 pathways are utilized resulting in the cre-ation of the reactive metabolite N-acetyl-p-benzoquinone
imine. Toxic doses of acetaminophen result in depletion of glutathione which then leads to covalent binding of the radical metabolite to protein. Covalent binding of radical metabolites leads to inhibition of the functionality of crit-ical proteins.1
Monitoring Indications and Strategies
Route of Administration Patient Population Monitoring SchemeOral• Immediate Release• (Chewable)• Immediate release (ODT)• Suspension• Extended release• Combination opioid productsIVRectal
• Suspected dose-related drug toxicity• Acute overdose• Chronic abuse• Suspected patient non-compliance• Screening for acetaminophen as a co-ingestant
(advised in all patients with intentional drug overdose)
See Namogram for toxicity
Drug Concentrations
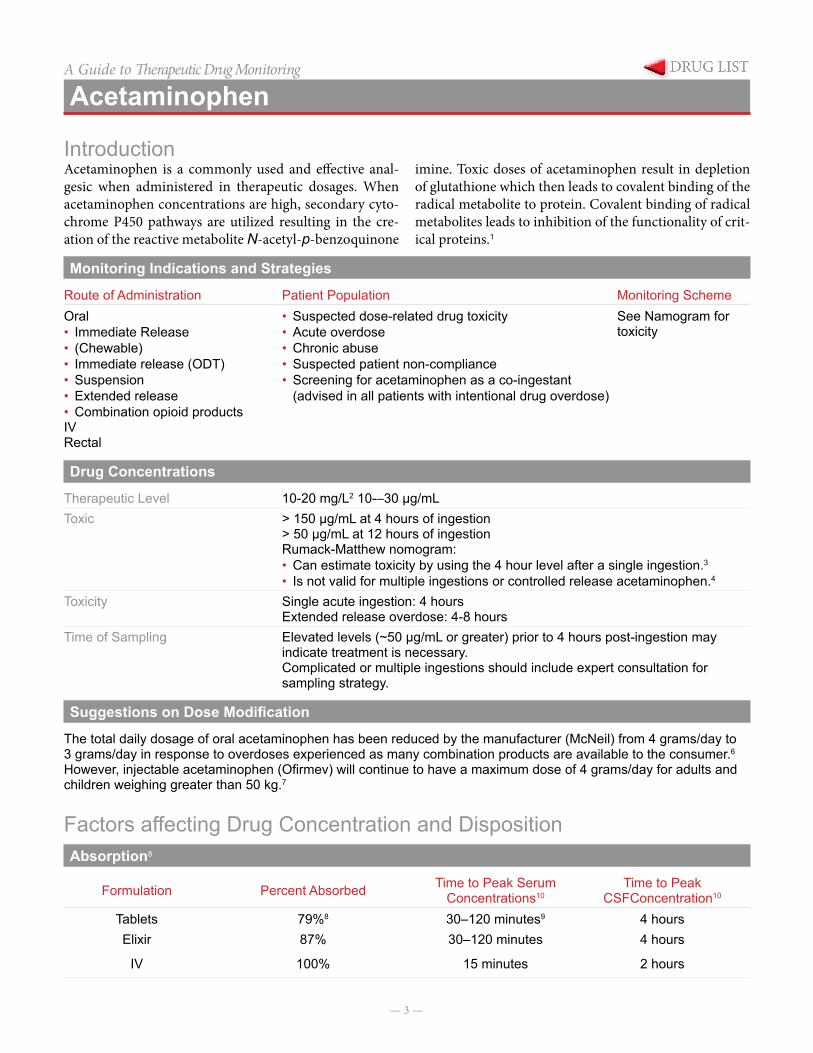
Therapeutic Level 10-20 mg/L2 10-–30 µg/mLToxic > 150 µg/mL at 4 hours of ingestion
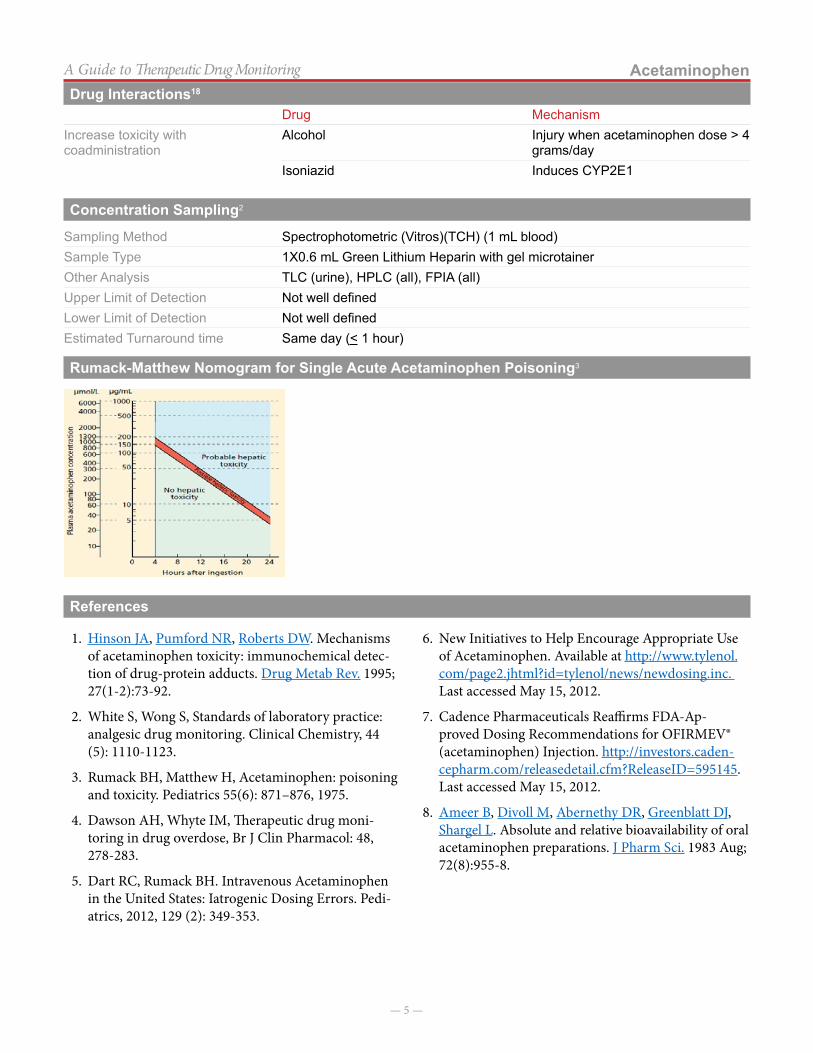
> 50 µg/mL at 12 hours of ingestionRumack-Matthew nomogram:• Can estimate toxicity by using the 4 hour level after a single ingestion.3
• Is not valid for multiple ingestions or controlled release acetaminophen.4
Toxicity Single acute ingestion: 4 hoursExtended release overdose: 4-8 hours
Time of Sampling Elevated levels (~50 µg/mL or greater) prior to 4 hours post-ingestion may indicate treatment is necessary.Complicated or multiple ingestions should include expert consultation for sampling strategy.
Suggestions on Dose Modification
The total daily dosage of oral acetaminophen has been reduced by the manufacturer (McNeil) from 4 grams/day to 3 grams/day in response to overdoses experienced as many combination products are available to the consumer.6
However, injectable acetaminophen (Ofirmev) will continue to have a maximum dose of 4 grams/day for adults and children weighing greater than 50 kg.7
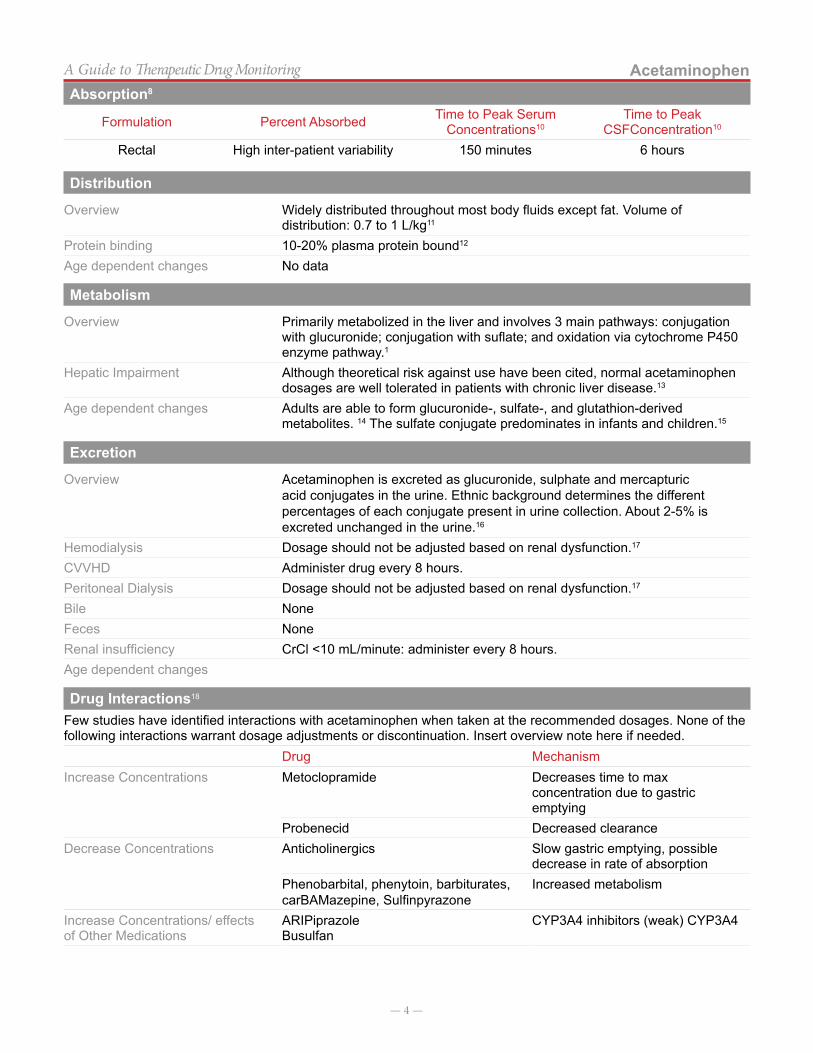
Factors affecting Drug Concentration and DispositionAbsorption8
Formulation Percent Absorbed Time to Peak Serum Concentrations10
Time to Peak CSFConcentration10
Tablets 79%8 30–120 minutes9 4 hoursElixir 87% 30–120 minutes 4 hours
IV 100% 15 minutes 2 hours
— 4 —
AcetaminophenA Guide to Therapeutic Drug Monitoring
Formulation Percent Absorbed Time to Peak Serum Concentrations10
Time to Peak CSFConcentration10
Rectal High inter-patient variability 150 minutes 6 hours
Distribution
Overview Widely distributed throughout most body fluids except fat. Volume of distribution: 0.7 to 1 L/kg11
Protein binding 10-20% plasma protein bound12
Age dependent changes No data
Metabolism
Overview Primarily metabolized in the liver and involves 3 main pathways: conjugation with glucuronide; conjugation with suflate; and oxidation via cytochrome P450 enzyme pathway.1
Hepatic Impairment Although theoretical risk against use have been cited, normal acetaminophen dosages are well tolerated in patients with chronic liver disease.13
Age dependent changes Adults are able to form glucuronide-, sulfate-, and glutathion-derived metabolites. 14 The sulfate conjugate predominates in infants and children.15
Excretion
Overview Acetaminophen is excreted as glucuronide, sulphate and mercapturic acid conjugates in the urine. Ethnic background determines the different percentages of each conjugate present in urine collection. About 2-5% is excreted unchanged in the urine.16
Hemodialysis Dosage should not be adjusted based on renal dysfunction.17
CVVHD Administer drug every 8 hours.Peritoneal Dialysis Dosage should not be adjusted based on renal dysfunction.17
Bile NoneFeces NoneRenal insufficiency CrCl <10 mL/minute: administer every 8 hours.Age dependent changes
Drug Interactions18
Few studies have identified interactions with acetaminophen when taken at the recommended dosages. None of the following interactions warrant dosage adjustments or discontinuation. Insert overview note here if needed.
Drug MechanismIncrease Concentrations Metoclopramide Decreases time to max
concentration due to gastric emptying
Probenecid Decreased clearanceDecrease Concentrations Anticholinergics Slow gastric emptying, possible
decrease in rate of absorptionPhenobarbital, phenytoin, barbiturates, carBAMazepine, Sulfinpyrazone
Increased metabolism
Increase Concentrations/ effects of Other Medications
ARIPiprazoleBusulfan
CYP3A4 inhibitors (weak) CYP3A4
Absorption8
— 5 —
AcetaminophenA Guide to Therapeutic Drug Monitoring
Drug MechanismIncrease toxicity with coadministration
Alcohol Injury when acetaminophen dose > 4 grams/day
Isoniazid Induces CYP2E1
Concentration Sampling2
Sampling Method Spectrophotometric (Vitros)(TCH) (1 mL blood)Sample Type 1X0.6 mL Green Lithium Heparin with gel microtainerOther Analysis TLC (urine), HPLC (all), FPIA (all)Upper Limit of Detection Not well definedLower Limit of Detection Not well definedEstimated Turnaround time Same day (< 1 hour)
Rumack-Matthew Nomogram for Single Acute Acetaminophen Poisoning3
References
1. Hinson JA, Pumford NR, Roberts DW. Mechanisms of acetaminophen toxicity: immunochemical detec-tion of drug-protein adducts. Drug Metab Rev. 1995; 27(1-2):73-92.
2. White S, Wong S, Standards of laboratory practice: analgesic drug monitoring. Clinical Chemistry, 44 (5): 1110-1123.
3. Rumack BH, Matthew H, Acetaminophen: poisoning and toxicity. Pediatrics 55(6): 871–876, 1975.
4. Dawson AH, Whyte IM, Therapeutic drug moni-toring in drug overdose, Br J Clin Pharmacol: 48, 278-283.
5. Dart RC, Rumack BH. Intravenous Acetaminophen in the United States: Iatrogenic Dosing Errors. Pedi-atrics, 2012, 129 (2): 349-353.
6. New Initiatives to Help Encourage Appropriate Use of Acetaminophen. Available at http://www.tylenol.com/page2.jhtml?id=tylenol/news/newdosing.inc. Last accessed May 15, 2012.
7. Cadence Pharmaceuticals Reaffirms FDA-Ap-proved Dosing Recommendations for OFIRMEV® (acetaminophen) Injection. http://investors.caden-cepharm.com/releasedetail.cfm?ReleaseID=595145. Last accessed May 15, 2012.
8. Ameer B, Divoll M, Abernethy DR, Greenblatt DJ, Shargel L. Absolute and relative bioavailability of oral acetaminophen preparations. J Pharm Sci. 1983 Aug; 72(8):955-8.
Drug Interactions18
— 6 —
A Guide to Therapeutic Drug Monitoring
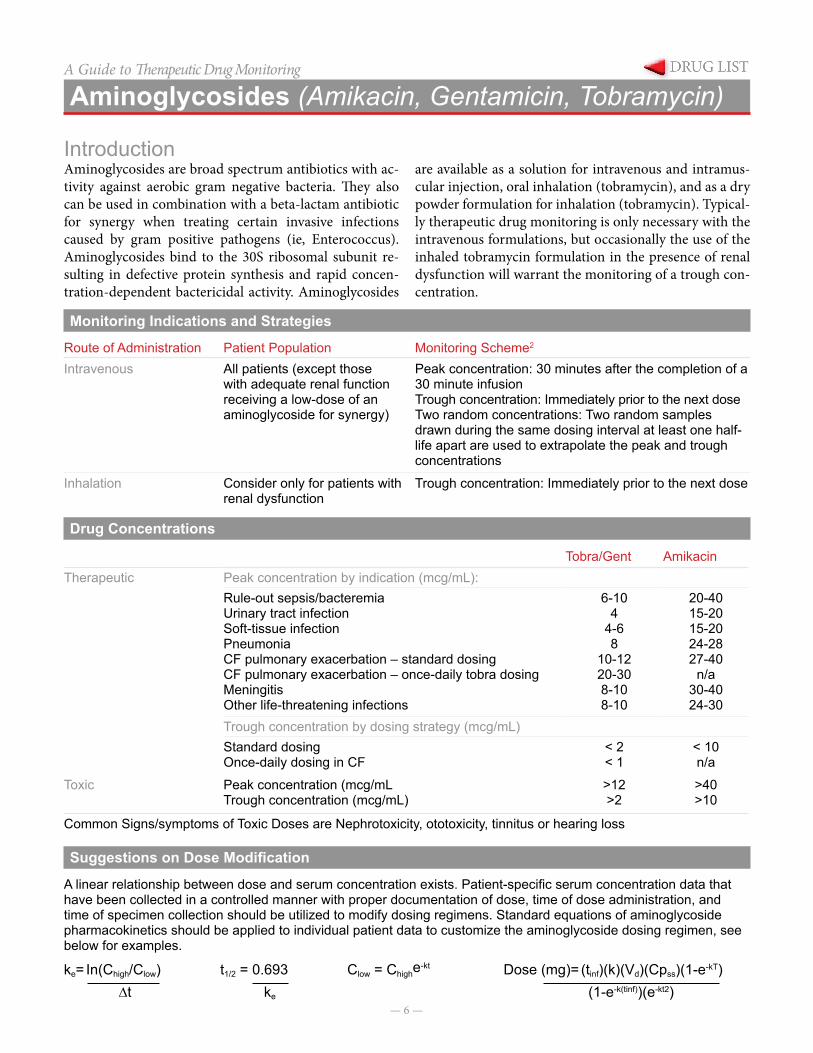
Aminoglycosides (Amikacin, Gentamicin, Tobramycin)
IntroductionAminoglycosides are broad spectrum antibiotics with ac-tivity against aerobic gram negative bacteria. They also can be used in combination with a beta-lactam antibiotic for synergy when treating certain invasive infections caused by gram positive pathogens (ie, Enterococcus). Aminoglycosides bind to the 30S ribosomal subunit re-sulting in defective protein synthesis and rapid concen-tration-dependent bactericidal activity. Aminoglycosides
are available as a solution for intravenous and intramus-cular injection, oral inhalation (tobramycin), and as a dry powder formulation for inhalation (tobramycin). Typical-ly therapeutic drug monitoring is only necessary with the intravenous formulations, but occasionally the use of the inhaled tobramycin formulation in the presence of renal dysfunction will warrant the monitoring of a trough con-centration.
Monitoring Indications and Strategies
Route of Administration Patient Population Monitoring Scheme2
Intravenous All patients (except those with adequate renal function receiving a low-dose of an aminoglycoside for synergy)
Peak concentration: 30 minutes after the completion of a 30 minute infusionTrough concentration: Immediately prior to the next doseTwo random concentrations: Two random samples drawn during the same dosing interval at least one half-life apart are used to extrapolate the peak and trough concentrations
Inhalation Consider only for patients with renal dysfunction
Trough concentration: Immediately prior to the next dose
Drug Concentrations
Tobra/Gent AmikacinTherapeutic Peak concentration by indication (mcg/mL):
Rule-out sepsis/bacteremiaUrinary tract infectionSoft-tissue infectionPneumoniaCF pulmonary exacerbation – standard dosingCF pulmonary exacerbation – once-daily tobra dosingMeningitisOther life-threatening infections
6-104
4-68
10-1220-308-108-10
20-4015-2015-2024-2827-40
n/a30-4024-30
Trough concentration by dosing strategy (mcg/mL)Standard dosingOnce-daily dosing in CF
< 2< 1
< 10n/a
Toxic Peak concentration (mcg/mLTrough concentration (mcg/mL)
>12>2
>40>10
Common Signs/symptoms of Toxic Doses are Nephrotoxicity, ototoxicity, tinnitus or hearing loss
Suggestions on Dose Modification
A linear relationship between dose and serum concentration exists. Patient-specific serum concentration data that have been collected in a controlled manner with proper documentation of dose, time of dose administration, and time of specimen collection should be utilized to modify dosing regimens. Standard equations of aminoglycoside pharmacokinetics should be applied to individual patient data to customize the aminoglycoside dosing regimen, see below for examples.
Clow = Chighe-ktke= In(Chigh/Clow)∆t
Dose (mg)= (tinf)(k)(Vd)(Cpss)(1-e-kT)(1-e-k(tinf))(e-kt2)
t1/2 = 0.693ke
— 7 —
Aminoglycosides (Amikacin, Gentamicin, Tobramycin)A Guide to Therapeutic Drug Monitoring
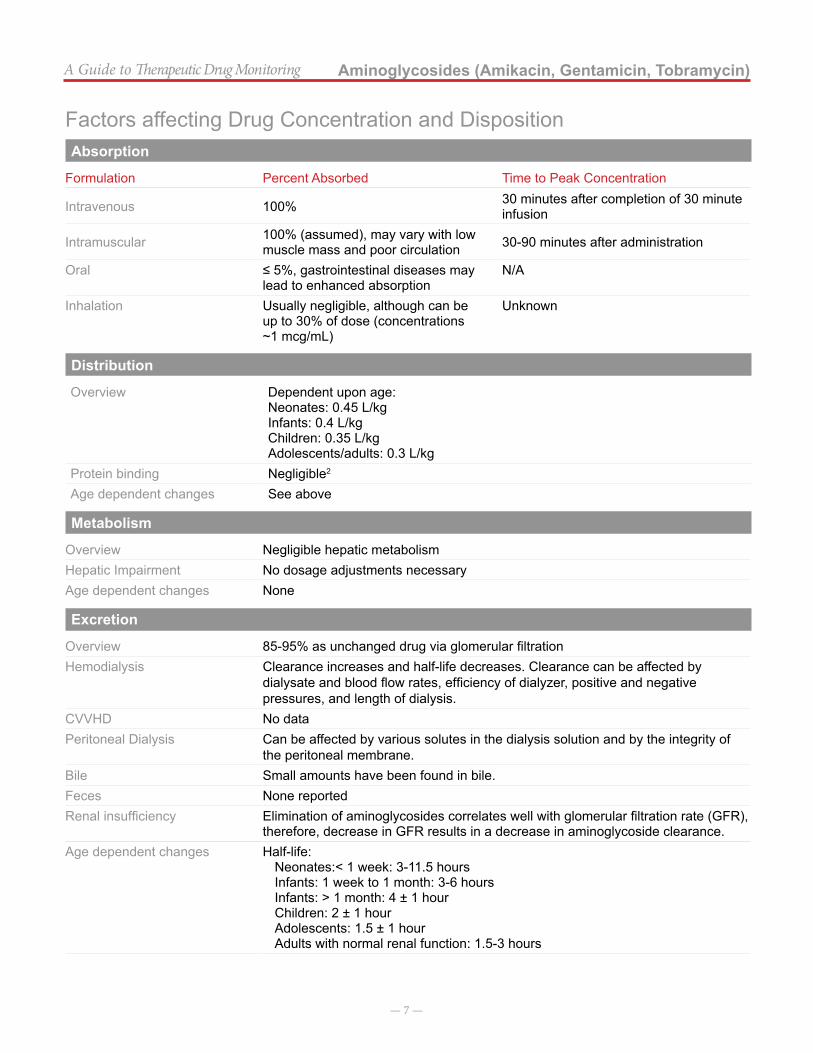
Factors affecting Drug Concentration and DispositionAbsorption
Formulation Percent Absorbed Time to Peak Concentration
Intravenous 100% 30 minutes after completion of 30 minute infusion
Intramuscular 100% (assumed), may vary with low muscle mass and poor circulation 30-90 minutes after administration
Oral ≤ 5%, gastrointestinal diseases may lead to enhanced absorption
N/A
Inhalation Usually negligible, although can be up to 30% of dose (concentrations ~1 mcg/mL)
Unknown
Distribution
Overview Dependent upon age:Neonates: 0.45 L/kgInfants: 0.4 L/kgChildren: 0.35 L/kgAdolescents/adults: 0.3 L/kg
Protein binding Negligible2
Age dependent changes See above
Metabolism
Overview Negligible hepatic metabolismHepatic Impairment No dosage adjustments necessaryAge dependent changes None
Excretion
Overview 85-95% as unchanged drug via glomerular filtrationHemodialysis Clearance increases and half-life decreases. Clearance can be affected by
dialysate and blood flow rates, efficiency of dialyzer, positive and negative pressures, and length of dialysis.
CVVHD No dataPeritoneal Dialysis Can be affected by various solutes in the dialysis solution and by the integrity of
the peritoneal membrane.Bile Small amounts have been found in bile.Feces None reportedRenal insufficiency Elimination of aminoglycosides correlates well with glomerular filtration rate (GFR),
therefore, decrease in GFR results in a decrease in aminoglycoside clearance.Age dependent changes Half-life:
Neonates:< 1 week: 3-11.5 hoursInfants: 1 week to 1 month: 3-6 hoursInfants: > 1 month: 4 ± 1 hourChildren: 2 ± 1 hourAdolescents: 1.5 ± 1 hourAdults with normal renal function: 1.5-3 hours
— 8 —
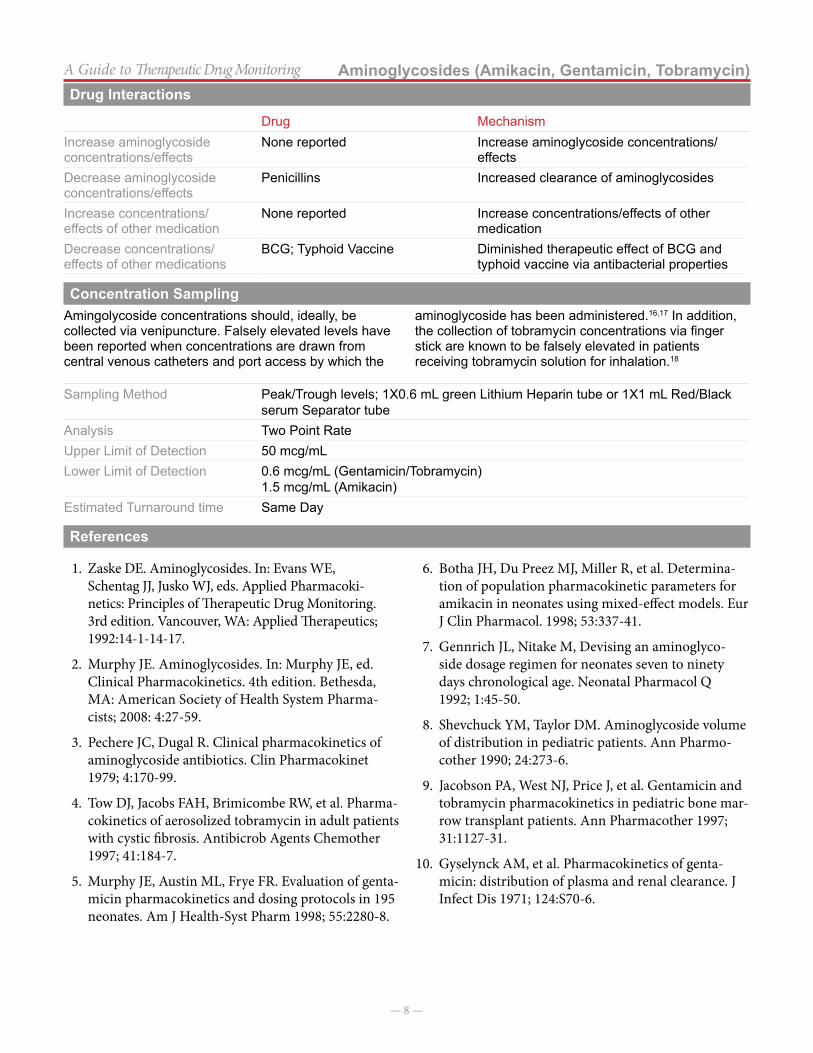
Aminoglycosides (Amikacin, Gentamicin, Tobramycin)A Guide to Therapeutic Drug MonitoringDrug Interactions
Drug MechanismIncrease aminoglycoside concentrations/effects
None reported Increase aminoglycoside concentrations/effects
Decrease aminoglycoside concentrations/effects
Penicillins Increased clearance of aminoglycosides
Increase concentrations/ effects of other medication
None reported Increase concentrations/effects of other medication
Decrease concentrations/ effects of other medications
BCG; Typhoid Vaccine Diminished therapeutic effect of BCG and typhoid vaccine via antibacterial properties
Concentration SamplingAmingolycoside concentrations should, ideally, be collected via venipuncture. Falsely elevated levels have been reported when concentrations are drawn from central venous catheters and port access by which the
aminoglycoside has been administered.16,17 In addition, the collection of tobramycin concentrations via finger stick are known to be falsely elevated in patients receiving tobramycin solution for inhalation.18
Sampling Method Peak/Trough levels; 1X0.6 mL green Lithium Heparin tube or 1X1 mL Red/Black serum Separator tube
Analysis Two Point RateUpper Limit of Detection 50 mcg/mLLower Limit of Detection 0.6 mcg/mL (Gentamicin/Tobramycin)
1.5 mcg/mL (Amikacin)Estimated Turnaround time Same Day
References
1. Zaske DE. Aminoglycosides. In: Evans WE, Schentag JJ, Jusko WJ, eds. Applied Pharmacoki-netics: Principles of Therapeutic Drug Monitoring. 3rd edition. Vancouver, WA: Applied Therapeutics; 1992:14-1-14-17.
2. Murphy JE. Aminoglycosides. In: Murphy JE, ed. Clinical Pharmacokinetics. 4th edition. Bethesda, MA: American Society of Health System Pharma-cists; 2008: 4:27-59.
3. Pechere JC, Dugal R. Clinical pharmacokinetics of aminoglycoside antibiotics. Clin Pharmacokinet 1979; 4:170-99.
4. Tow DJ, Jacobs FAH, Brimicombe RW, et al. Pharma-cokinetics of aerosolized tobramycin in adult patients with cystic fibrosis. Antibicrob Agents Chemother 1997; 41:184-7.
5. Murphy JE, Austin ML, Frye FR. Evaluation of genta-micin pharmacokinetics and dosing protocols in 195 neonates. Am J Health-Syst Pharm 1998; 55:2280-8.
6. Botha JH, Du Preez MJ, Miller R, et al. Determina-tion of population pharmacokinetic parameters for amikacin in neonates using mixed-effect models. Eur J Clin Pharmacol. 1998; 53:337-41.
7. Gennrich JL, Nitake M, Devising an aminoglyco-side dosage regimen for neonates seven to ninety days chronological age. Neonatal Pharmacol Q 1992; 1:45-50.
8. Shevchuck YM, Taylor DM. Aminoglycoside volume of distribution in pediatric patients. Ann Pharmo-cother 1990; 24:273-6.
9. Jacobson PA, West NJ, Price J, et al. Gentamicin and tobramycin pharmacokinetics in pediatric bone mar-row transplant patients. Ann Pharmacother 1997; 31:1127-31.
10. Gyselynck AM, et al. Pharmacokinetics of genta-micin: distribution of plasma and renal clearance. J Infect Dis 1971; 124:S70-6.
— 9 —
A Guide to Therapeutic Drug Monitoring
Amiodarone
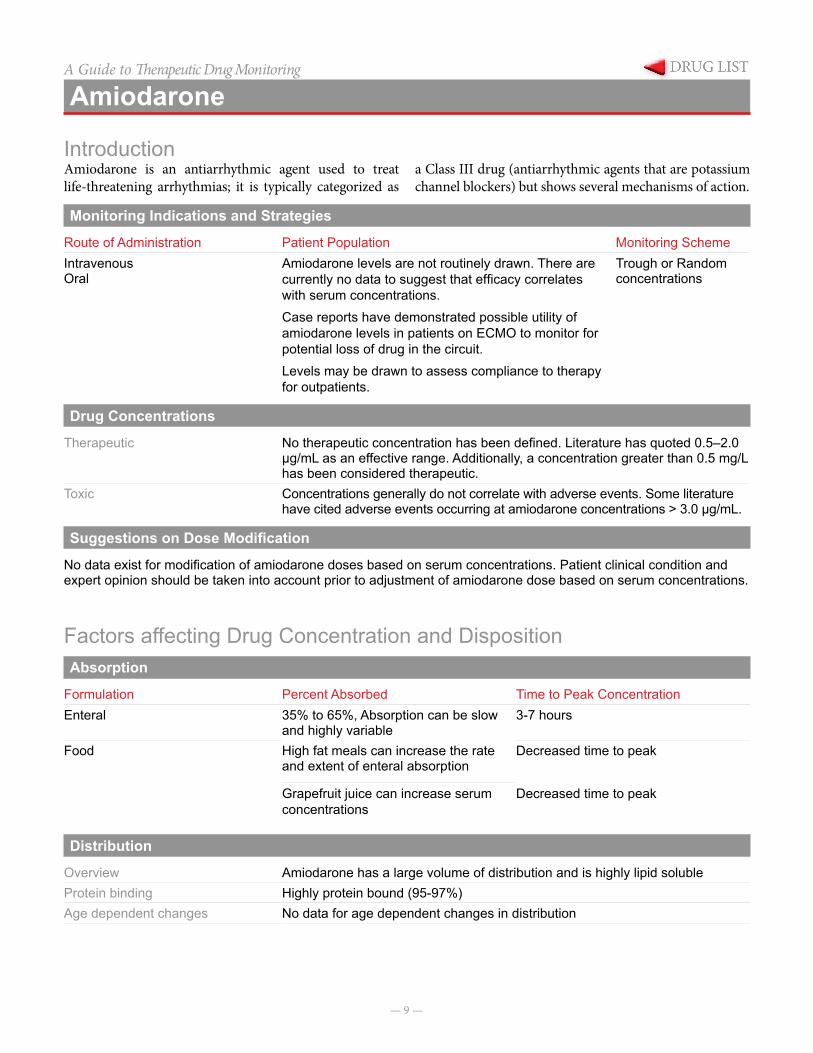
IntroductionAmiodarone is an antiarrhythmic agent used to treat life-threatening arrhythmias; it is typically categorized as
a Class III drug (antiarrhythmic agents that are potassium channel blockers) but shows several mechanisms of action.
Monitoring Indications and Strategies
Route of Administration Patient Population Monitoring SchemeIntravenousOral
Amiodarone levels are not routinely drawn. There are currently no data to suggest that efficacy correlates with serum concentrations.Case reports have demonstrated possible utility of amiodarone levels in patients on ECMO to monitor for potential loss of drug in the circuit.Levels may be drawn to assess compliance to therapy for outpatients.
Trough or Random concentrations
Drug Concentrations
Therapeutic No therapeutic concentration has been defined. Literature has quoted 0.5–2.0 µg/mL as an effective range. Additionally, a concentration greater than 0.5 mg/L has been considered therapeutic.
Toxic Concentrations generally do not correlate with adverse events. Some literature have cited adverse events occurring at amiodarone concentrations > 3.0 µg/mL.
Suggestions on Dose Modification
No data exist for modification of amiodarone doses based on serum concentrations. Patient clinical condition and expert opinion should be taken into account prior to adjustment of amiodarone dose based on serum concentrations.
Factors affecting Drug Concentration and DispositionAbsorption
Formulation Percent Absorbed Time to Peak ConcentrationEnteral 35% to 65%, Absorption can be slow
and highly variable3-7 hours
Food High fat meals can increase the rate and extent of enteral absorption
Decreased time to peak
Grapefruit juice can increase serum concentrations
Decreased time to peak
Distribution
Overview Amiodarone has a large volume of distribution and is highly lipid solubleProtein binding Highly protein bound (95-97%)Age dependent changes No data for age dependent changes in distribution
— 10 —
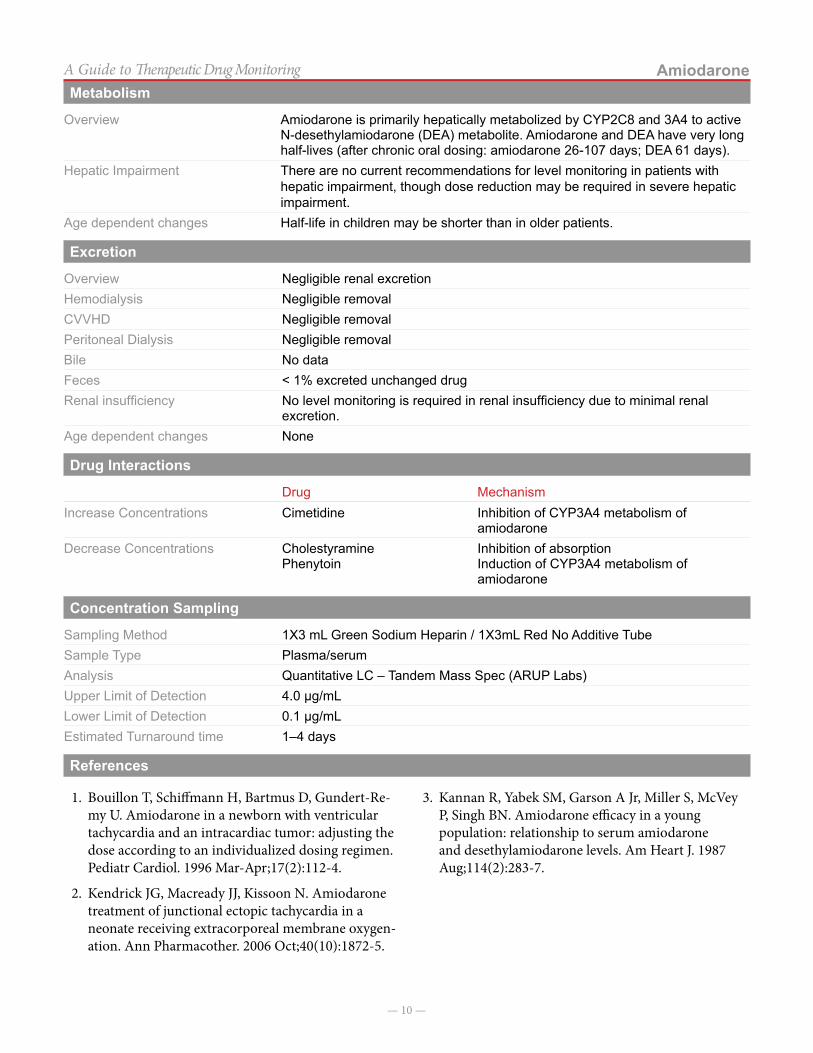
AmiodaroneA Guide to Therapeutic Drug MonitoringMetabolism
Overview Amiodarone is primarily hepatically metabolized by CYP2C8 and 3A4 to active N-desethylamiodarone (DEA) metabolite. Amiodarone and DEA have very long half-lives (after chronic oral dosing: amiodarone 26-107 days; DEA 61 days).
Hepatic Impairment There are no current recommendations for level monitoring in patients with hepatic impairment, though dose reduction may be required in severe hepatic impairment.
Age dependent changes Half-life in children may be shorter than in older patients.
Excretion
Overview Negligible renal excretionHemodialysis Negligible removalCVVHD Negligible removalPeritoneal Dialysis Negligible removalBile No dataFeces < 1% excreted unchanged drug Renal insufficiency No level monitoring is required in renal insufficiency due to minimal renal
excretion.Age dependent changes None
Drug Interactions
Drug MechanismIncrease Concentrations Cimetidine Inhibition of CYP3A4 metabolism of
amiodaroneDecrease Concentrations Cholestyramine
PhenytoinInhibition of absorptionInduction of CYP3A4 metabolism of amiodarone
Concentration Sampling
Sampling Method 1X3 mL Green Sodium Heparin / 1X3mL Red No Additive TubeSample Type Plasma/serumAnalysis Quantitative LC – Tandem Mass Spec (ARUP Labs)Upper Limit of Detection 4.0 µg/mLLower Limit of Detection 0.1 µg/mLEstimated Turnaround time 1–4 days
References
1. Bouillon T, Schiffmann H, Bartmus D, Gundert-Re-my U. Amiodarone in a newborn with ventricular tachycardia and an intracardiac tumor: adjusting the dose according to an individualized dosing regimen. Pediatr Cardiol. 1996 Mar-Apr;17(2):112-4.
2. Kendrick JG, Macready JJ, Kissoon N. Amiodarone treatment of junctional ectopic tachycardia in a neonate receiving extracorporeal membrane oxygen-ation. Ann Pharmacother. 2006 Oct;40(10):1872-5.
3. Kannan R, Yabek SM, Garson A Jr, Miller S, McVey P, Singh BN. Amiodarone efficacy in a young population: relationship to serum amiodarone and desethylamiodarone levels. Am Heart J. 1987 Aug;114(2):283-7.
— 11 —
A Guide to Therapeutic Drug Monitoring
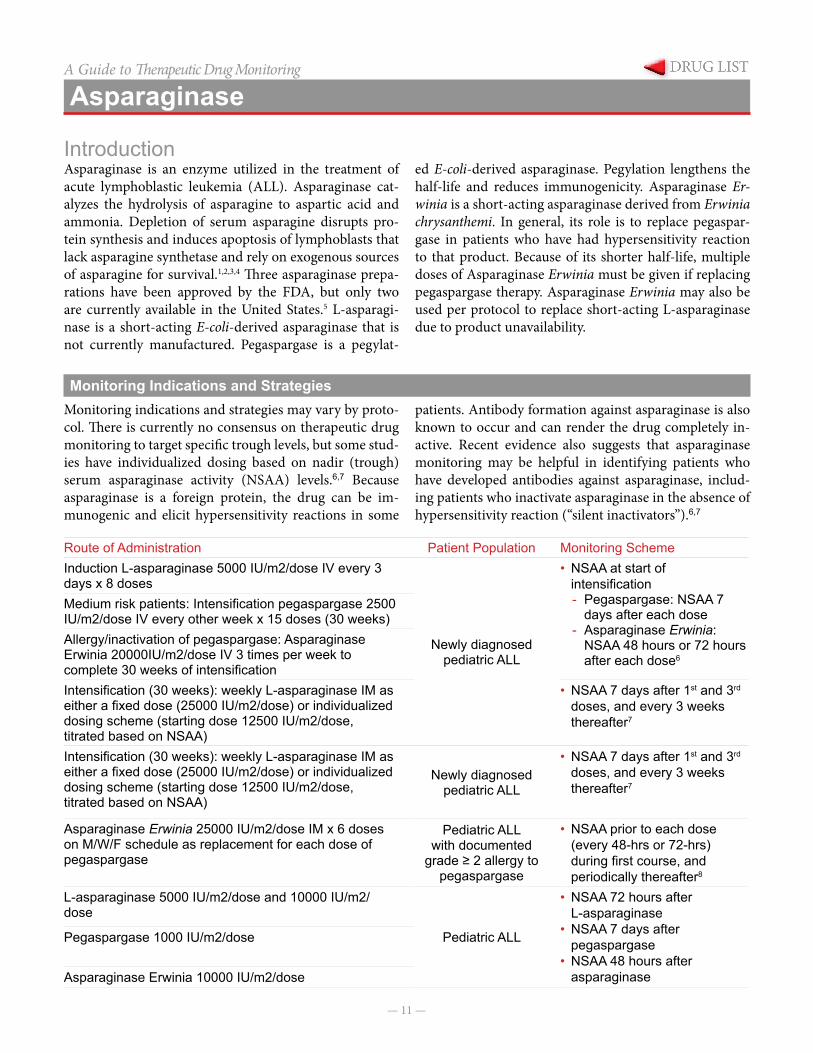
Asparaginase
IntroductionAsparaginase is an enzyme utilized in the treatment of acute lymphoblastic leukemia (ALL). Asparaginase cat-alyzes the hydrolysis of asparagine to aspartic acid and ammonia. Depletion of serum asparagine disrupts pro-tein synthesis and induces apoptosis of lymphoblasts that lack asparagine synthetase and rely on exogenous sources of asparagine for survival.1,2,3,4 Three asparaginase prepa-rations have been approved by the FDA, but only two are currently available in the United States.5 L-asparagi-nase is a short-acting E-coli-derived asparaginase that is not currently manufactured. Pegaspargase is a pegylat-
ed E-coli-derived asparaginase. Pegylation lengthens the half-life and reduces immunogenicity. Asparaginase Er-winia is a short-acting asparaginase derived from Erwinia chrysanthemi. In general, its role is to replace pegaspar-gase in patients who have had hypersensitivity reaction to that product. Because of its shorter half-life, multiple doses of Asparaginase Erwinia must be given if replacing pegaspargase therapy. Asparaginase Erwinia may also be used per protocol to replace short-acting L-asparaginase due to product unavailability.
Monitoring Indications and StrategiesMonitoring indications and strategies may vary by proto-col. There is currently no consensus on therapeutic drug monitoring to target specific trough levels, but some stud-ies have individualized dosing based on nadir (trough) serum asparaginase activity (NSAA) levels.6,7 Because asparaginase is a foreign protein, the drug can be im-munogenic and elicit hypersensitivity reactions in some
patients. Antibody formation against asparaginase is also known to occur and can render the drug completely in-active. Recent evidence also suggests that asparaginase monitoring may be helpful in identifying patients who have developed antibodies against asparaginase, includ-ing patients who inactivate asparaginase in the absence of hypersensitivity reaction (“silent inactivators”).6,7
Route of Administration Patient Population Monitoring SchemeInduction L-asparaginase 5000 IU/m2/dose IV every 3 days x 8 doses
Newly diagnosed pediatric ALL
• NSAA at start of intensification - Pegaspargase: NSAA 7
days after each dose - Asparaginase Erwinia:
NSAA 48 hours or 72 hours after each dose6
Medium risk patients: Intensification pegaspargase 2500 IU/m2/dose IV every other week x 15 doses (30 weeks)Allergy/inactivation of pegaspargase: Asparaginase Erwinia 20000IU/m2/dose IV 3 times per week to complete 30 weeks of intensificationIntensification (30 weeks): weekly L-asparaginase IM as either a fixed dose (25000 IU/m2/dose) or individualized dosing scheme (starting dose 12500 IU/m2/dose, titrated based on NSAA)
• NSAA 7 days after 1st and 3rd doses, and every 3 weeks thereafter7
Intensification (30 weeks): weekly L-asparaginase IM as either a fixed dose (25000 IU/m2/dose) or individualized dosing scheme (starting dose 12500 IU/m2/dose, titrated based on NSAA)
Newly diagnosed pediatric ALL
• NSAA 7 days after 1st and 3rd doses, and every 3 weeks thereafter7
Asparaginase Erwinia 25000 IU/m2/dose IM x 6 doses on M/W/F schedule as replacement for each dose of pegaspargase
Pediatric ALL with documented
grade ≥ 2 allergy to pegaspargase
• NSAA prior to each dose (every 48-hrs or 72-hrs) during first course, and periodically thereafter8
L-asparaginase 5000 IU/m2/dose and 10000 IU/m2/dose
Pediatric ALL
• NSAA 72 hours after L-asparaginase
• NSAA 7 days after pegaspargase
• NSAA 48 hours after asparaginase
Pegaspargase 1000 IU/m2/dose
Asparaginase Erwinia 10000 IU/m2/dose
— 12 —
AsparaginaseA Guide to Therapeutic Drug MonitoringDrug Concentrations
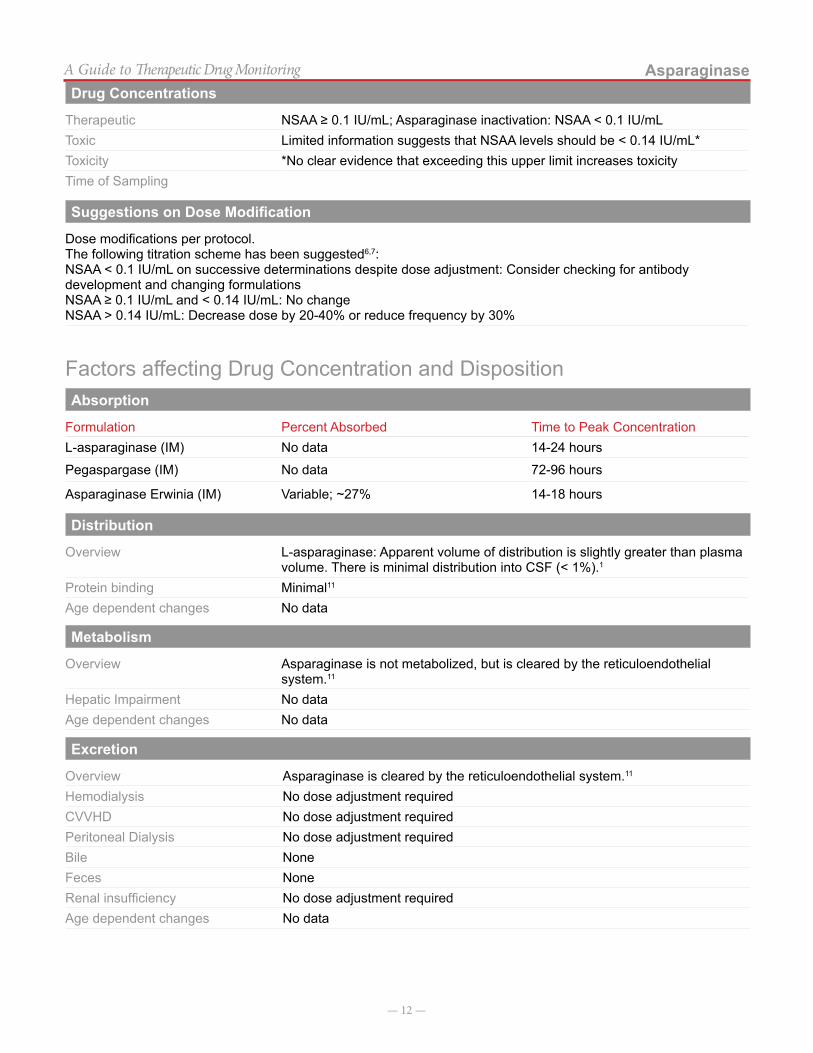
Therapeutic NSAA ≥ 0.1 IU/mL; Asparaginase inactivation: NSAA < 0.1 IU/mLToxic Limited information suggests that NSAA levels should be < 0.14 IU/mL*Toxicity *No clear evidence that exceeding this upper limit increases toxicityTime of Sampling
Suggestions on Dose Modification
Dose modifications per protocol.The following titration scheme has been suggested6,7:NSAA < 0.1 IU/mL on successive determinations despite dose adjustment: Consider checking for antibody development and changing formulationsNSAA ≥ 0.1 IU/mL and < 0.14 IU/mL: No changeNSAA > 0.14 IU/mL: Decrease dose by 20-40% or reduce frequency by 30%
Factors affecting Drug Concentration and DispositionAbsorption
Formulation Percent Absorbed Time to Peak ConcentrationL-asparaginase (IM) No data 14-24 hours
Pegaspargase (IM) No data 72-96 hours
Asparaginase Erwinia (IM) Variable; ~27% 14-18 hours
Distribution
Overview L-asparaginase: Apparent volume of distribution is slightly greater than plasma volume. There is minimal distribution into CSF (< 1%).1
Protein binding Minimal11
Age dependent changes No data
Metabolism
Overview Asparaginase is not metabolized, but is cleared by the reticuloendothelial system.11
Hepatic Impairment No dataAge dependent changes No data
Excretion
Overview Asparaginase is cleared by the reticuloendothelial system.11
Hemodialysis No dose adjustment requiredCVVHD No dose adjustment required Peritoneal Dialysis No dose adjustment required Bile NoneFeces NoneRenal insufficiency No dose adjustment requiredAge dependent changes No data
— 13 —
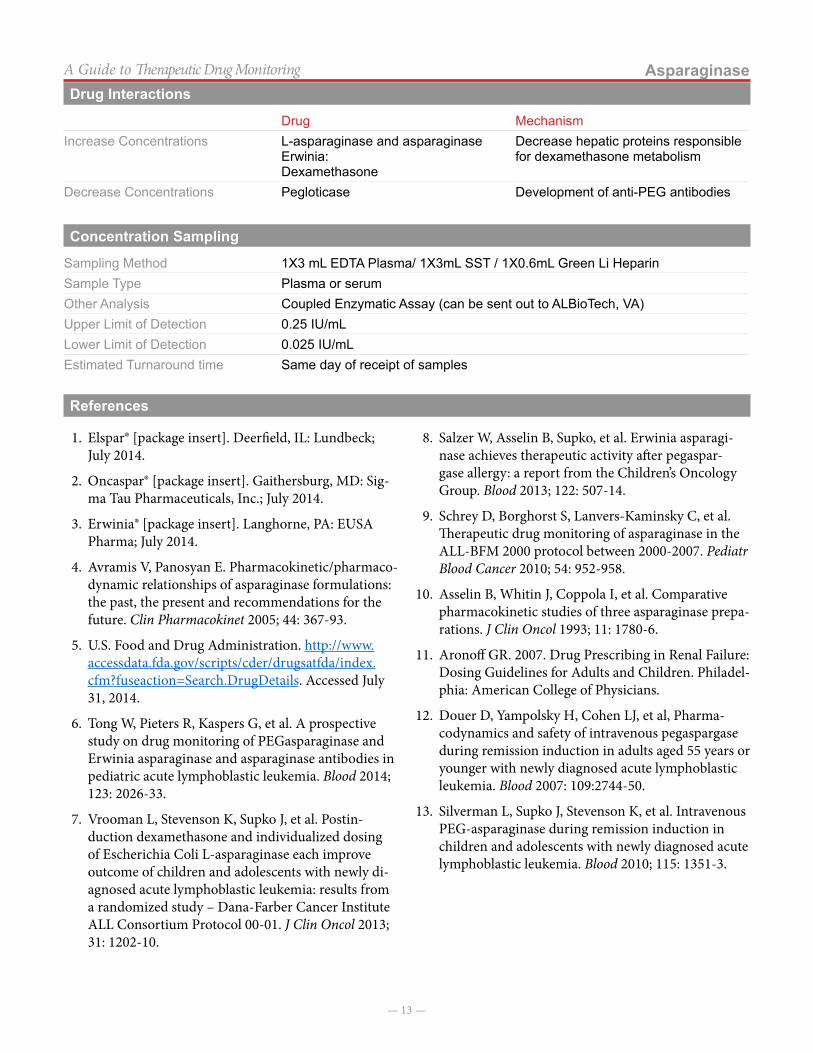
AsparaginaseA Guide to Therapeutic Drug MonitoringDrug Interactions
Drug MechanismIncrease Concentrations L-asparaginase and asparaginase
Erwinia:Dexamethasone
Decrease hepatic proteins responsible for dexamethasone metabolism
Decrease Concentrations Pegloticase Development of anti-PEG antibodies
Concentration Sampling
Sampling Method 1X3 mL EDTA Plasma/ 1X3mL SST / 1X0.6mL Green Li HeparinSample Type Plasma or serumOther Analysis Coupled Enzymatic Assay (can be sent out to ALBioTech, VA)Upper Limit of Detection 0.25 IU/mLLower Limit of Detection 0.025 IU/mLEstimated Turnaround time Same day of receipt of samples
References
1. Elspar® [package insert]. Deerfield, IL: Lundbeck; July 2014.
2. Oncaspar® [package insert]. Gaithersburg, MD: Sig-ma Tau Pharmaceuticals, Inc.; July 2014.
3. Erwinia® [package insert]. Langhorne, PA: EUSA Pharma; July 2014.
4. Avramis V, Panosyan E. Pharmacokinetic/pharmaco-dynamic relationships of asparaginase formulations: the past, the present and recommendations for the future. Clin Pharmacokinet 2005; 44: 367-93.
5. U.S. Food and Drug Administration. http://www.accessdata.fda.gov/scripts/cder/drugsatfda/index.cfm?fuseaction=Search.DrugDetails. Accessed July 31, 2014.
6. Tong W, Pieters R, Kaspers G, et al. A prospective study on drug monitoring of PEGasparaginase and Erwinia asparaginase and asparaginase antibodies in pediatric acute lymphoblastic leukemia. Blood 2014; 123: 2026-33.
7. Vrooman L, Stevenson K, Supko J, et al. Postin-duction dexamethasone and individualized dosing of Escherichia Coli L-asparaginase each improve outcome of children and adolescents with newly di-agnosed acute lymphoblastic leukemia: results from a randomized study – Dana-Farber Cancer Institute ALL Consortium Protocol 00-01. J Clin Oncol 2013; 31: 1202-10.
8. Salzer W, Asselin B, Supko, et al. Erwinia asparagi-nase achieves therapeutic activity after pegaspar-gase allergy: a report from the Children’s Oncology Group. Blood 2013; 122: 507-14.
9. Schrey D, Borghorst S, Lanvers-Kaminsky C, et al. Therapeutic drug monitoring of asparaginase in the ALL-BFM 2000 protocol between 2000-2007. Pediatr Blood Cancer 2010; 54: 952-958.
10. Asselin B, Whitin J, Coppola I, et al. Comparative pharmacokinetic studies of three asparaginase prepa-rations. J Clin Oncol 1993; 11: 1780-6.
11. Aronoff GR. 2007. Drug Prescribing in Renal Failure: Dosing Guidelines for Adults and Children. Philadel-phia: American College of Physicians.
12. Douer D, Yampolsky H, Cohen LJ, et al, Pharma-codynamics and safety of intravenous pegaspargase during remission induction in adults aged 55 years or younger with newly diagnosed acute lymphoblastic leukemia. Blood 2007: 109:2744-50.
13. Silverman L, Supko J, Stevenson K, et al. Intravenous PEG-asparaginase during remission induction in children and adolescents with newly diagnosed acute lymphoblastic leukemia. Blood 2010; 115: 1351-3.
— 14 —
A Guide to Therapeutic Drug Monitoring
Busulfan
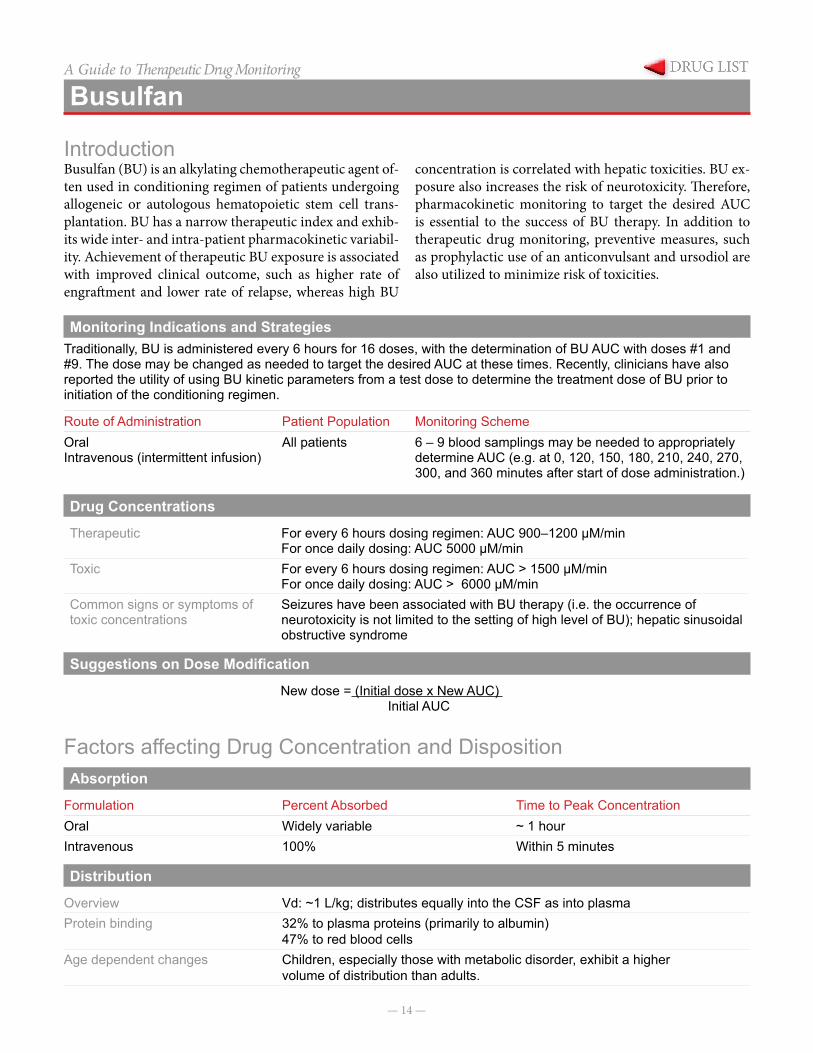
IntroductionBusulfan (BU) is an alkylating chemotherapeutic agent of-ten used in conditioning regimen of patients undergoing allogeneic or autologous hematopoietic stem cell trans-plantation. BU has a narrow therapeutic index and exhib-its wide inter- and intra-patient pharmacokinetic variabil-ity. Achievement of therapeutic BU exposure is associated with improved clinical outcome, such as higher rate of engraftment and lower rate of relapse, whereas high BU
concentration is correlated with hepatic toxicities. BU ex-posure also increases the risk of neurotoxicity. Therefore, pharmacokinetic monitoring to target the desired AUC is essential to the success of BU therapy. In addition to therapeutic drug monitoring, preventive measures, such as prophylactic use of an anticonvulsant and ursodiol are also utilized to minimize risk of toxicities.
Monitoring Indications and StrategiesTraditionally, BU is administered every 6 hours for 16 doses, with the determination of BU AUC with doses #1 and #9. The dose may be changed as needed to target the desired AUC at these times. Recently, clinicians have also reported the utility of using BU kinetic parameters from a test dose to determine the treatment dose of BU prior to initiation of the conditioning regimen.
Route of Administration Patient Population Monitoring SchemeOralIntravenous (intermittent infusion)
All patients 6 – 9 blood samplings may be needed to appropriately determine AUC (e.g. at 0, 120, 150, 180, 210, 240, 270, 300, and 360 minutes after start of dose administration.)
Drug Concentrations
Therapeutic For every 6 hours dosing regimen: AUC 900–1200 μM/minFor once daily dosing: AUC 5000 μM/min
Toxic For every 6 hours dosing regimen: AUC > 1500 μM/minFor once daily dosing: AUC > 6000 μM/min
Common signs or symptoms of toxic concentrations
Seizures have been associated with BU therapy (i.e. the occurrence of neurotoxicity is not limited to the setting of high level of BU); hepatic sinusoidal obstructive syndrome
Suggestions on Dose Modification
New dose = (Initial dose x New AUC) Initial AUC
Factors affecting Drug Concentration and DispositionAbsorption
Formulation Percent Absorbed Time to Peak ConcentrationOral Widely variable ~ 1 hourIntravenous 100% Within 5 minutes
Distribution
Overview Vd: ~1 L/kg; distributes equally into the CSF as into plasmaProtein binding 32% to plasma proteins (primarily to albumin)
47% to red blood cellsAge dependent changes Children, especially those with metabolic disorder, exhibit a higher
volume of distribution than adults.

— 15 —
BusulfanA Guide to Therapeutic Drug MonitoringMetabolism
Overview Busulfan is a substrate of CYP3A4. It is extensively metabolized in the liver by glutathione conjugation followed by oxidation.
Hepatic Impairment Has not been studiedAge dependent changes Young children have higher clearance when compared to adults and
older children.
Excretion
Overview 25 to 60% of busulfan is excreted in the urine predominantly as metabolites; 2% are eliminated unchanged.
Hemodialysis No dataCVVHD No dataPeritoneal Dialysis No dataBile No dataFeces NegligibleRenal insufficiency Elimination appears to be independent of renal function.Age dependent changes Children have faster clearance than adults.
Drug Interactions
Drug MechanismIncrease Concentrations Acetaminophen Decrease glutathione levels which may
decrease busulfan metabolismCYP3A4 inhibitors (e.g. metronidazole, itraconazole, )
Decrease hepatic metabolism
Decrease Concentrations CYP3A4 inducers(e.g.Fosphenytoin/phenytoin)
Induction of glutathione-S-transferase
Concentration Sampling
Sampling Method Obtain one blood sample prior to initiation of dose infusion, then at 120, 150, 180, 210, 240, 270, 300, and 360 minutes after start of infusion.
Sample Type 1X3 mL Green Sodium HeparinAnalysis HPLCUpper Limit of Detection 40 µmol/LLower Limit of Detection 0 µmol/LEstimated Turnaround time Same day
References
1. Andersson BS, Kashyap A, Gain V, et al. Conditioning therapy with intravenous busulfan and cyclophosphamide for hematologic malignancies prior to allogeneic stem cell transplantation: a phase II study. Biol Blood Marrow Transplant 2002; 8: 145–154.
2. Booth B, Rahman A, Dagher R, et al. Population pharmacokinet-ic-based dosing of intravenous busulfan in pediatric patients.J Clin Pharmacology 2007; 47: 101-111.
3. Growchow LB, Krivit W, Whitley CB, Blazer BR. Busulfan disposi-tion in children. Blood 1990; 75: 1723 – 1727.
4. Hassan M, Oberg G, Beckassay AN et al. Pharmacokinetics of high dose busulphan in relation and age and chronopharmacology.Cancer Chemother Pharmacol 1991; 28: 130–134.
5. Kangarloo SB, Naveed F, Ng E, et al. Development and validation of a test dose strategy for once-daily IV busulfan: Importance of fixed infusion rate dosing. Biol Blood Marrow Transplant 2012; 18: 295–301.
6. Schechter T, Finkelstein Y, Doyle J, et al. Pharmacokinetic dis-position and clinical outcomes in infants and children receiving intravenous busulfan for allogeneic hematopoetic stem cell trans-plantation.Biol Blood Marrow Transplant 2007; 13: 307–314.
7. Tse WT, Duerst R, Schneiderman J, et al. Age-dependent phar-macokinetic profile of single daily dose IV busulfan in children undergoing reduce-intensity conditioning stem cell transplant.Bone Marrow Transplant 2009; 44: 145–156.
— 16 —
A Guide to Therapeutic Drug Monitoring
Caffeine Citrate
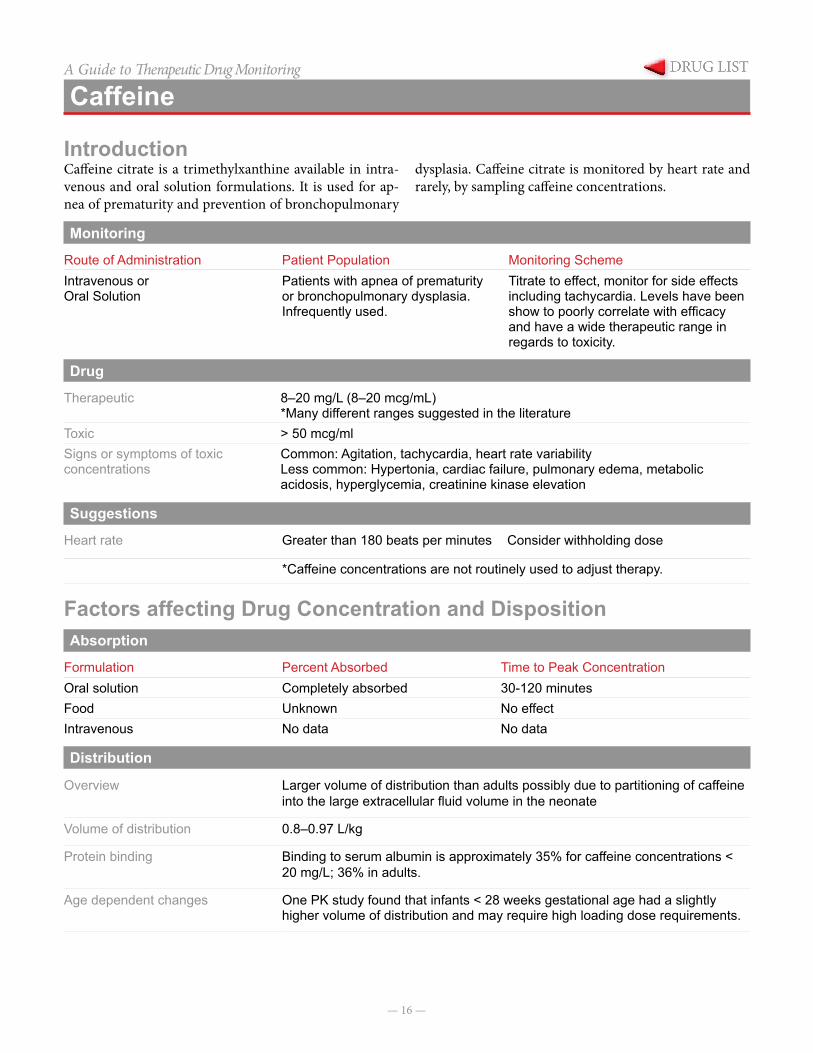
IntroductionCaffeine citrate is a trimethylxanthine available in intra-venous and oral solution formulations. It is used for ap-nea of prematurity and prevention of bronchopulmonary
dysplasia. Caffeine citrate is monitored by heart rate and rarely, by sampling caffeine concentrations.
Monitoring Indications and Strategies
Route of Administration Patient Population Monitoring SchemeIntravenous orOral Solution
Patients with apnea of prematurity or bronchopulmonary dysplasia. Infrequently used.
Titrate to effect, monitor for side effects including tachycardia. Levels have been show to poorly correlate with efficacy and have a wide therapeutic range in regards to toxicity.
Drug Concentrations
Therapeutic 8–20 mg/L (8–20 mcg/mL)*Many different ranges suggested in the literature
Toxic > 50 mcg/ml Signs or symptoms of toxic concentrations
Common: Agitation, tachycardia, heart rate variabilityLess common: Hypertonia, cardiac failure, pulmonary edema, metabolic acidosis, hyperglycemia, creatinine kinase elevation
Suggestions on Dose Modification
Heart rate Greater than 180 beats per minutes Consider withholding dose
*Caffeine concentrations are not routinely used to adjust therapy.
Factors affecting Drug Concentration and DispositionAbsorption
Formulation Percent Absorbed Time to Peak ConcentrationOral solution Completely absorbed 30-120 minutesFood Unknown No effectIntravenous No data No data
Distribution
Overview Larger volume of distribution than adults possibly due to partitioning of caffeine into the large extracellular fluid volume in the neonate
Volume of distribution 0.8–0.97 L/kg
Protein binding Binding to serum albumin is approximately 35% for caffeine concentrations < 20 mg/L; 36% in adults.
Age dependent changes One PK study found that infants < 28 weeks gestational age had a slightly higher volume of distribution and may require high loading dose requirements.
— 17 —
Caffeine CitrateA Guide to Therapeutic Drug MonitoringMetabolism
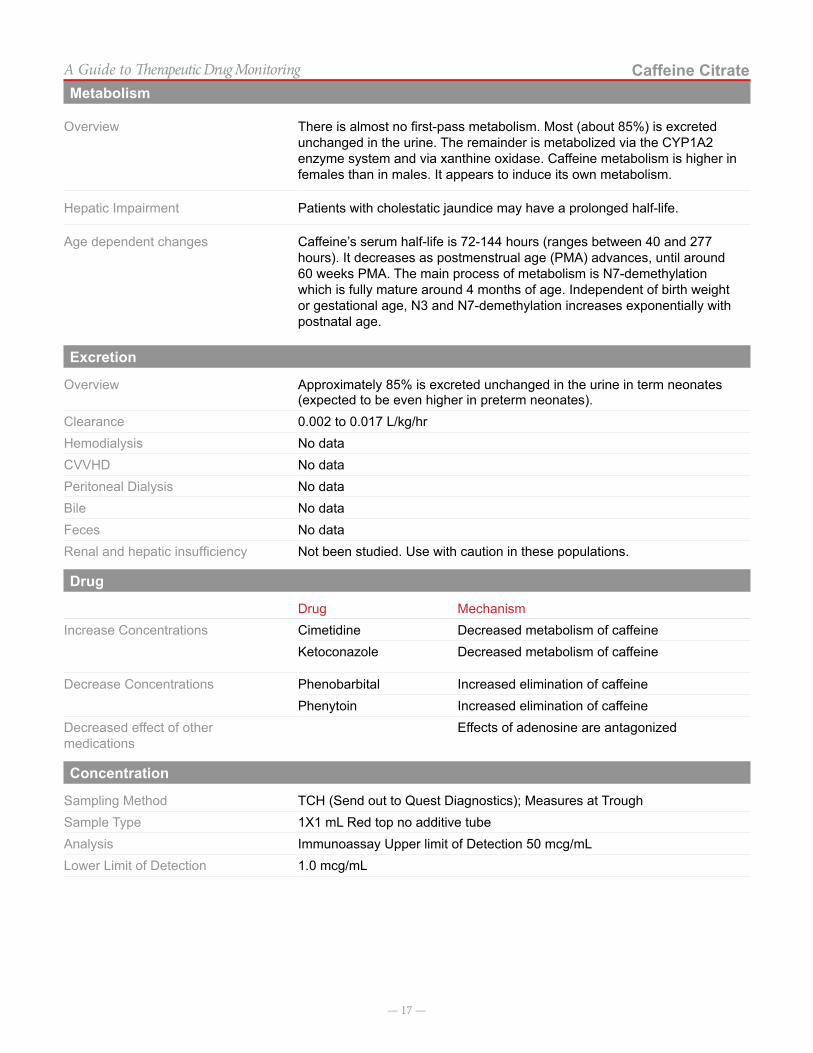
Overview There is almost no first-pass metabolism. Most (about 85%) is excreted unchanged in the urine. The remainder is metabolized via the CYP1A2 enzyme system and via xanthine oxidase. Caffeine metabolism is higher in females than in males. It appears to induce its own metabolism.
Hepatic Impairment Patients with cholestatic jaundice may have a prolonged half-life.
Age dependent changes Caffeine’s serum half-life is 72-144 hours (ranges between 40 and 277 hours). It decreases as postmenstrual age (PMA) advances, until around 60 weeks PMA. The main process of metabolism is N7-demethylation which is fully mature around 4 months of age. Independent of birth weight or gestational age, N3 and N7-demethylation increases exponentially with postnatal age.
Excretion
Overview Approximately 85% is excreted unchanged in the urine in term neonates (expected to be even higher in preterm neonates).
Clearance 0.002 to 0.017 L/kg/hrHemodialysis No dataCVVHD No dataPeritoneal Dialysis No dataBile No dataFeces No dataRenal and hepatic insufficiency Not been studied. Use with caution in these populations.
Drug Interactions
Drug MechanismIncrease Concentrations Cimetidine Decreased metabolism of caffeine
Ketoconazole Decreased metabolism of caffeine
Decrease Concentrations Phenobarbital Increased elimination of caffeinePhenytoin Increased elimination of caffeine
Decreased effect of other medications
Effects of adenosine are antagonized
Concentration Sampling
Sampling Method TCH (Send out to Quest Diagnostics); Measures at TroughSample Type 1X1 mL Red top no additive tubeAnalysis Immunoassay Upper limit of Detection 50 mcg/mLLower Limit of Detection 1.0 mcg/mL
— 18 —
Caffeine CitrateA Guide to Therapeutic Drug MonitoringReferences
1. Lee TC, Charles B, Steer P, Flenady V, Shearman A. Population pharmacokinetics of intravenous caffeine in neonates with apnea of prematurity. Clin Pharma-col Ther.1997; 61(6):628-40.
2. Charles BG, Townsend SR, Steer PA, Flenady VJ, Gray PH, Shearman A. Caffeine citrate treatment for extremely premature infants with apnea: popula-tion pharmacokinetics, absolute bioavailability, and implications for therapeutic drug monitoring. Ther Drug Monit. 2008; 30(6):709-16.
3. Pesce AJ, Rashkin M, Kotagal U. Standards of labora-tory practice: theophylline and caffeine monitoring. National Academy of Clinical Biochemistry. Clin Chem. 1998; 44(5):1124-8.
4. Natarajan G, Lulic-Botica M, Aranda JV. Clinical Pharmacology of Caffeine in the Newborn. NeoRev-iews. 2007; 8(5):c214-c220.
5. Anderson BJ, Gunn TR, Holford NHG, et al. Caf-feine overdose in a premature infant: Clinical course and pharmacokinetics. Anesth Intensive Care 1999; 27:307-311.
6. Falcao AC, Fernandez de Gatta MM, Delgado Irib-arnegaray MF, et al. Population pharmacokinetics of caffeine in premature neonates. Eur J Clin Pharmacol 1997; 52:211-217.
7. Product Information, Bedford Laboratories, 2008.
— 19 —
A Guide to Therapeutic Drug Monitoring
Carbamazepine
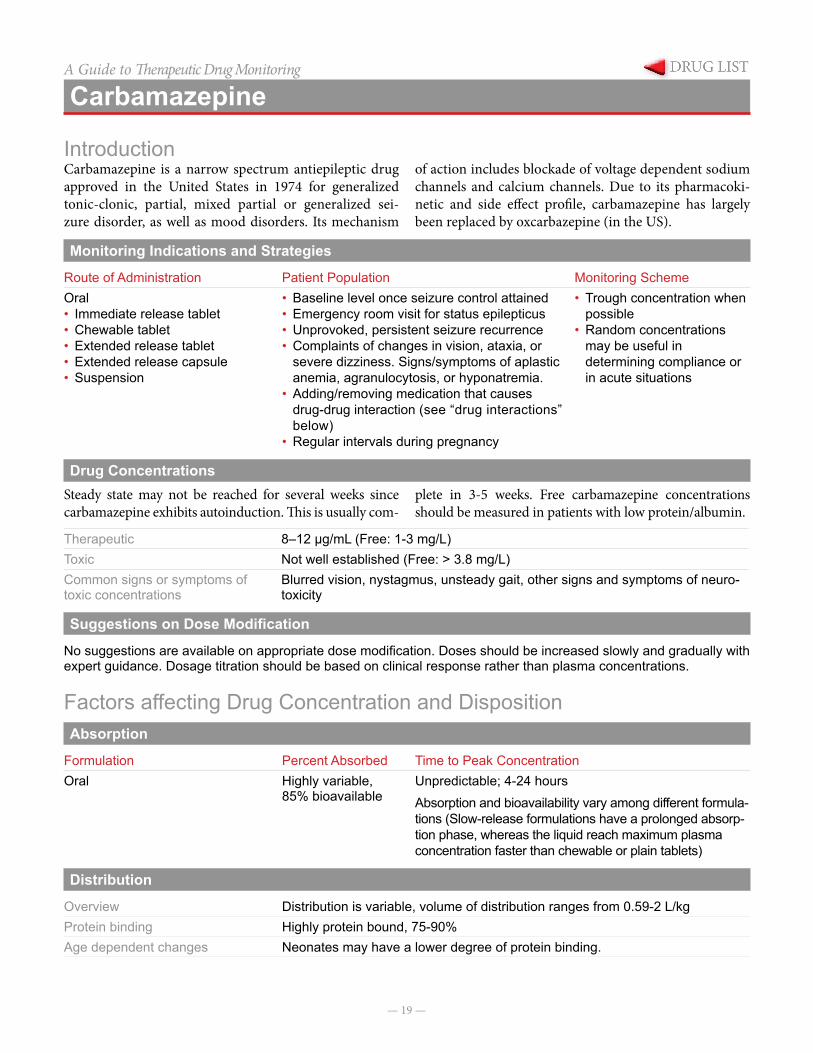
IntroductionCarbamazepine is a narrow spectrum antiepileptic drug approved in the United States in 1974 for generalized tonic-clonic, partial, mixed partial or generalized sei-zure disorder, as well as mood disorders. Its mechanism
of action includes blockade of voltage dependent sodium channels and calcium channels. Due to its pharmacoki-netic and side effect profile, carbamazepine has largely been replaced by oxcarbazepine (in the US).
Monitoring Indications and Strategies
Route of Administration Patient Population Monitoring SchemeOral• Immediate release tablet• Chewable tablet• Extended release tablet• Extended release capsule• Suspension
• Baseline level once seizure control attained• Emergency room visit for status epilepticus• Unprovoked, persistent seizure recurrence• Complaints of changes in vision, ataxia, or
severe dizziness. Signs/symptoms of aplastic anemia, agranulocytosis, or hyponatremia.
• Adding/removing medication that causes drug-drug interaction (see “drug interactions” below)
• Regular intervals during pregnancy
• Trough concentration when possible
• Random concentrations may be useful in determining compliance or in acute situations
Drug ConcentrationsSteady state may not be reached for several weeks since carbamazepine exhibits autoinduction. This is usually com-
plete in 3-5 weeks. Free carbamazepine concentrations should be measured in patients with low protein/albumin.
Therapeutic 8–12 µg/mL (Free: 1-3 mg/L)Toxic Not well established (Free: > 3.8 mg/L)Common signs or symptoms of toxic concentrations
Blurred vision, nystagmus, unsteady gait, other signs and symptoms of neuro-toxicity
Suggestions on Dose Modification
No suggestions are available on appropriate dose modification. Doses should be increased slowly and gradually with expert guidance. Dosage titration should be based on clinical response rather than plasma concentrations.
Factors affecting Drug Concentration and DispositionAbsorption
Formulation Percent Absorbed Time to Peak ConcentrationOral Highly variable,
85% bioavailableUnpredictable; 4-24 hoursAbsorption and bioavailability vary among different formula-tions (Slow-release formulations have a prolonged absorp-tion phase, whereas the liquid reach maximum plasma concentration faster than chewable or plain tablets)
Distribution
Overview Distribution is variable, volume of distribution ranges from 0.59-2 L/kgProtein binding Highly protein bound, 75-90%Age dependent changes Neonates may have a lower degree of protein binding.
— 20 —
CarbamazepineA Guide to Therapeutic Drug MonitoringMetabolism
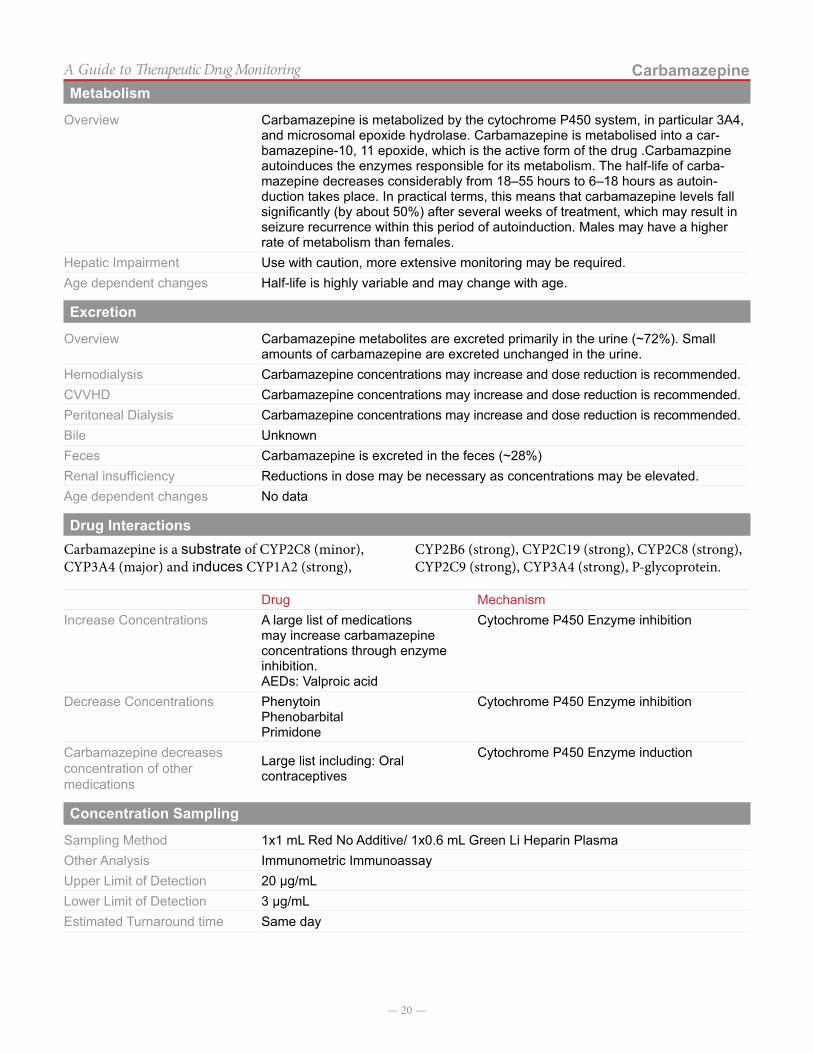
Overview Carbamazepine is metabolized by the cytochrome P450 system, in particular 3A4, and microsomal epoxide hydrolase. Carbamazepine is metabolised into a car-bamazepine-10, 11 epoxide, which is the active form of the drug .Carbamazpine autoinduces the enzymes responsible for its metabolism. The half-life of carba-mazepine decreases considerably from 18–55 hours to 6–18 hours as autoin-duction takes place. In practical terms, this means that carbamazepine levels fall significantly (by about 50%) after several weeks of treatment, which may result in seizure recurrence within this period of autoinduction. Males may have a higher rate of metabolism than females.
Hepatic Impairment Use with caution, more extensive monitoring may be required.Age dependent changes Half-life is highly variable and may change with age.
Excretion
Overview Carbamazepine metabolites are excreted primarily in the urine (~72%). Small amounts of carbamazepine are excreted unchanged in the urine.
Hemodialysis Carbamazepine concentrations may increase and dose reduction is recommended.CVVHD Carbamazepine concentrations may increase and dose reduction is recommended.Peritoneal Dialysis Carbamazepine concentrations may increase and dose reduction is recommended.Bile UnknownFeces Carbamazepine is excreted in the feces (~28%)Renal insufficiency Reductions in dose may be necessary as concentrations may be elevated.Age dependent changes No data
Drug InteractionsCarbamazepine is a substrate of CYP2C8 (minor), CYP3A4 (major) and induces CYP1A2 (strong),
CYP2B6 (strong), CYP2C19 (strong), CYP2C8 (strong), CYP2C9 (strong), CYP3A4 (strong), P-glycoprotein.
Drug MechanismIncrease Concentrations A large list of medications
may increase carbamazepine concentrations through enzyme inhibition.AEDs: Valproic acid
Cytochrome P450 Enzyme inhibition
Decrease Concentrations PhenytoinPhenobarbitalPrimidone
Cytochrome P450 Enzyme inhibition
Carbamazepine decreases concentration of other medications
Large list including: Oral contraceptives
Cytochrome P450 Enzyme induction
Concentration Sampling
Sampling Method 1x1 mL Red No Additive/ 1x0.6 mL Green Li Heparin PlasmaOther Analysis Immunometric ImmunoassayUpper Limit of Detection 20 µg/mLLower Limit of Detection 3 µg/mLEstimated Turnaround time Same day

— 21 —
CarbamazepineA Guide to Therapeutic Drug MonitoringNotes on Concentrations
Co-medication with lamotrigine may cause neurotoxic symptoms of headache, nausea, diplopia and ataxia, prob-ably as the result of a pharmacodynamic interaction and
not by increasing carbamazepine epoxide (as originally suggested).
References
1. Panayiotopoulos CP. The Epilepsies: Seizures, Syndromes and Management. Oxfordshire (UK): Bladon Medical Publishing; 2005. Chapter 14, Pharmacopoeia of Prophylactic Antiepileptic Drugs. Available from: http://www.ncbi.nlm.nih.gov/books/NBK2597/.
2. Winkler SR, Luer MS. Antiepileptic drug review: Part 1. Surg Neurol 1998; 49:449-52.
3. Arroyo S, Sander JWAS. Carbamazapinein compara-tive trials: Pharmacokinetic characteristics too often forgotten.
— 22 —
A Guide to Therapeutic Drug Monitoring
Chloramphenicol
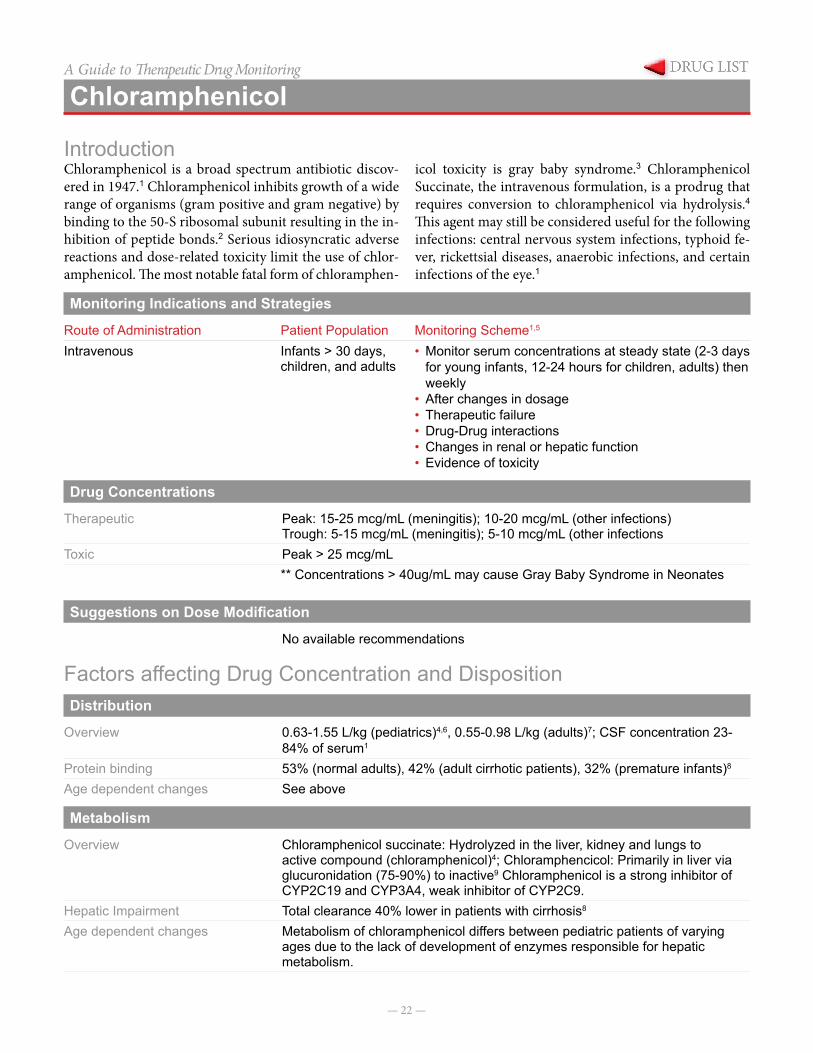
IntroductionChloramphenicol is a broad spectrum antibiotic discov-ered in 1947.1 Chloramphenicol inhibits growth of a wide range of organisms (gram positive and gram negative) by binding to the 50-S ribosomal subunit resulting in the in-hibition of peptide bonds.2 Serious idiosyncratic adverse reactions and dose-related toxicity limit the use of chlor-amphenicol. The most notable fatal form of chloramphen-
icol toxicity is gray baby syndrome.3 Chloramphenicol Succinate, the intravenous formulation, is a prodrug that requires conversion to chloramphenicol via hydrolysis.4
This agent may still be considered useful for the following infections: central nervous system infections, typhoid fe-ver, rickettsial diseases, anaerobic infections, and certain infections of the eye.1
Monitoring Indications and Strategies
Route of Administration Patient Population Monitoring Scheme1,5
Intravenous Infants > 30 days, children, and adults
• Monitor serum concentrations at steady state (2-3 days for young infants, 12-24 hours for children, adults) then weekly
• After changes in dosage• Therapeutic failure• Drug-Drug interactions• Changes in renal or hepatic function• Evidence of toxicity
Drug Concentrations
Therapeutic Peak: 15-25 mcg/mL (meningitis); 10-20 mcg/mL (other infections)Trough: 5-15 mcg/mL (meningitis); 5-10 mcg/mL (other infections
Toxic Peak > 25 mcg/mL** Concentrations > 40ug/mL may cause Gray Baby Syndrome in Neonates
Suggestions on Dose Modification
No available recommendations
Factors affecting Drug Concentration and DispositionDistribution
Overview 0.63-1.55 L/kg (pediatrics)4,6, 0.55-0.98 L/kg (adults)7; CSF concentration 23-84% of serum1
Protein binding 53% (normal adults), 42% (adult cirrhotic patients), 32% (premature infants)8
Age dependent changes See above
Metabolism
Overview Chloramphenicol succinate: Hydrolyzed in the liver, kidney and lungs to active compound (chloramphenicol)4; Chloramphencicol: Primarily in liver via glucuronidation (75-90%) to inactive9 Chloramphenicol is a strong inhibitor of CYP2C19 and CYP3A4, weak inhibitor of CYP2C9.
Hepatic Impairment Total clearance 40% lower in patients with cirrhosis8
Age dependent changes Metabolism of chloramphenicol differs between pediatric patients of varying ages due to the lack of development of enzymes responsible for hepatic metabolism.

— 23 —
ChloramphenicolA Guide to Therapeutic Drug MonitoringExcretion
Overview 30% of chloramphenicol succinate is excreted as unchanged drug in children and adults.4 Neonates may have decreased excretion of chloramphenicol succinate.10 5-29% excreted as active drug (chloramphenicol).4
Hemodialysis Serum levels are not affected by hemodialysis5
CVVHD No dataPeritoneal Dialysis Serum levels are not affected by peritoneal dialysis5
Bile 3% excretion in the bile11
Feces noneRenal insufficiency Renal excretion of chloramphenicol succinate decreases with renal dysfunction
or underdeveloped renal function. This can be clinically significant as it increases the amount of chloramphenicol succinate available for hydrolysis to the active drug (chloramphenicol).1
Age dependent changes Mean renal clearance is 7%, 29%, and 61% in newborn infants, full-term infants greater than 60 days, and children, respectively.4
Drug Interactions
Drug MechanismIncrease chloramphenicol concentrations
None known
Decrease chloramphenicol concentrations12
PhenobarbitalPhenytoinRifampin
Induction of glucuronyl transferase activity
Increase concentrations of other medications3
TolbutamideChlorpropamidePhenytoinWarfarin
Decreased metabolism of other medication
Decrease concentrations of other medications
BCGClopidogrel Cyanocobalamin PrasugrelSodium PicosulfateTicagrelorTyphoid Vaccine
Increased metabolism of the other medication.
Concentration Sampling
Sampling Method Peak Draw;1X2 mL RedNo Additive Tube / 1X2 mL Purple EDTA
Analysis High Performance Liquid Chromatography (HPLC)Upper Limit of Detection 60 µg/mLLower Limit of Detection 2.5 µg/mLEstimated Turnaround time 1-5 Days
Notes on ConcentrationsChloramphenicol concentrations are a send-out laboratory test (ARUP Labs) from Texas Children’s Hospital.
— 24 —
ChloramphenicolA Guide to Therapeutic Drug MonitoringReferences
1. Nahata MC. Chloramphenicol. In: Evans WE, Schentag JJ, Jusko WJ, eds. Applied Pharmacoki-netics: Principles of Therapeutic Drug Monitoring. 3rd edition. Vancouver, WA: Applied Therapeutics; 1992:16-1-16-24.
2. Pongs O., et al. Identification of chlorampheni-col-binding protein in Escherichia coli ribosomes by affinity labeling. Proc natl Acad Sci USA. 1973; 70:2220-2233.
3. Lietman PS. Chloramphenicol and the neonate-1979 view. Clin Pharmacol. 1979; 6:151-62.
4. Nahata MC, Powell DA. Bioavailability and clearance of chloramphenicol after intravenous chlorampheni-col succinate. Clin Pharmacol Ther. 1981; 30:368-72.
5. Balbi HJ. Chloramphenicol: A review. Pediatrics in Review 2004; 25; 284.
6. Sack CM, et al. Chloramphenicol succinate kinetics in infants and young children. Pediatr Pharmacol. 1982; 2:93.
7. Slaughter RL, et al. Chloramphenicol succinate kinet-ics in criticially ill patients. Clin Pharmocol Ther. 1980; 28:69-77.
8. Koup JR, et al. Chloramphenicol pharmacokinetics in hospitalized patients. Antimicrob Agents Chemo-ther. 1979; 15:651-57.
9. Young WS, Lietman PS. Chloramphenicol glucuronyl transferase: assay, ontogeny, and inducibility. J Phar-macol Exp Ther. 1978; 204:203-11.
10. Nahata MC, Powell DA. Comparative bioavailabil-ity and pharmacokinetics of chloramphenicol after intravenous chloramphenicol succinate in premature infants and older patients. Dev Pharmacol Ther.1983; 6:23-32.
11. Glazko AJ et al. Observations on the metabolic dis-position of chloramphenicol in the rat. J Pharmacol Exp Ther.1952; 104:452.
12. Powell DA, et al. Interactions among chloramphen-icol, phenytoin, and Phenobarbital in pediatric patients. J Pediatr 1981; 98:1001-3.
13. Christensen KK, Skousted L.Inhibition of drug me-tabolism by chloramphenicol. Lancet 1979;2:1397-1399.
— 25 —
A Guide to Therapeutic Drug Monitoring
Cyclosporine
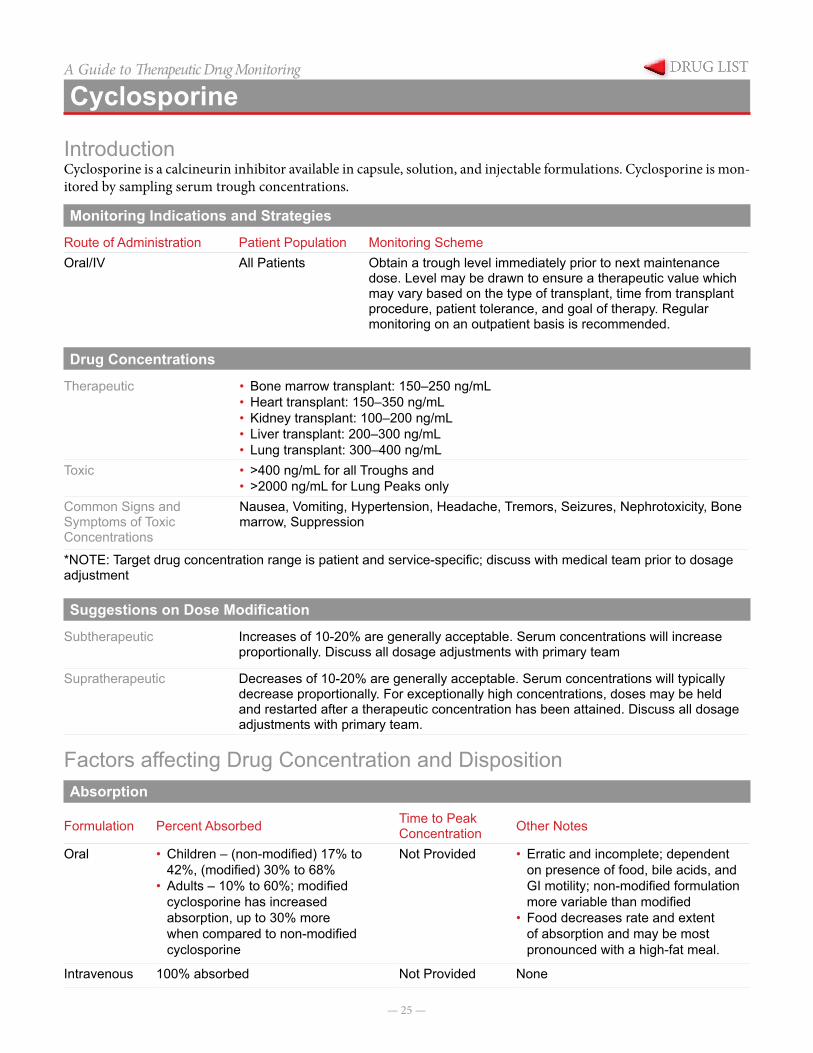
IntroductionCyclosporine is a calcineurin inhibitor available in capsule, solution, and injectable formulations. Cyclosporine is mon-itored by sampling serum trough concentrations.
Monitoring Indications and Strategies
Route of Administration Patient Population Monitoring SchemeOral/IV All Patients Obtain a trough level immediately prior to next maintenance
dose. Level may be drawn to ensure a therapeutic value which may vary based on the type of transplant, time from transplant procedure, patient tolerance, and goal of therapy. Regular monitoring on an outpatient basis is recommended.
Drug Concentrations
Therapeutic • Bone marrow transplant: 150–250 ng/mL• Heart transplant: 150–350 ng/mL• Kidney transplant: 100–200 ng/mL• Liver transplant: 200–300 ng/mL• Lung transplant: 300–400 ng/mL
Toxic • >400 ng/mL for all Troughs and• >2000 ng/mL for Lung Peaks only
Common Signs and Symptoms of Toxic Concentrations
Nausea, Vomiting, Hypertension, Headache, Tremors, Seizures, Nephrotoxicity, Bone marrow, Suppression
*NOTE: Target drug concentration range is patient and service-specific; discuss with medical team prior to dosage adjustment
Suggestions on Dose Modification
Subtherapeutic Increases of 10-20% are generally acceptable. Serum concentrations will increase proportionally. Discuss all dosage adjustments with primary team
Supratherapeutic Decreases of 10-20% are generally acceptable. Serum concentrations will typically decrease proportionally. For exceptionally high concentrations, doses may be held and restarted after a therapeutic concentration has been attained. Discuss all dosage adjustments with primary team.
Factors affecting Drug Concentration and DispositionAbsorption
Formulation Percent Absorbed Time to Peak Concentration Other Notes
Oral • Children – (non-modified) 17% to 42%, (modified) 30% to 68%
• Adults – 10% to 60%; modified cyclosporine has increased absorption, up to 30% more when compared to non-modified cyclosporine
Not Provided • Erratic and incomplete; dependent on presence of food, bile acids, and GI motility; non-modified formulation more variable than modified
• Food decreases rate and extent of absorption and may be most pronounced with a high-fat meal.
Intravenous 100% absorbed Not Provided None
— 26 —
CyclosporineA Guide to Therapeutic Drug MonitoringDistribution
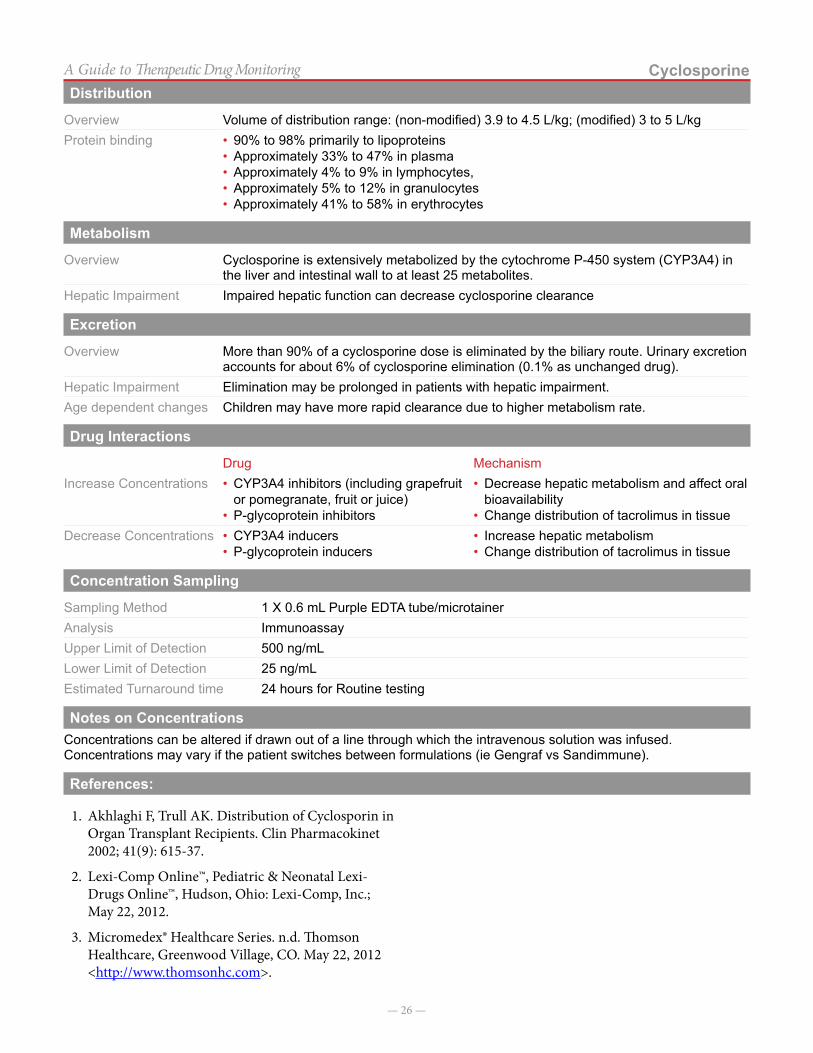
Overview Volume of distribution range: (non-modified) 3.9 to 4.5 L/kg; (modified) 3 to 5 L/kgProtein binding • 90% to 98% primarily to lipoproteins
• Approximately 33% to 47% in plasma• Approximately 4% to 9% in lymphocytes,• Approximately 5% to 12% in granulocytes• Approximately 41% to 58% in erythrocytes
Metabolism
Overview Cyclosporine is extensively metabolized by the cytochrome P-450 system (CYP3A4) in the liver and intestinal wall to at least 25 metabolites.
Hepatic Impairment Impaired hepatic function can decrease cyclosporine clearance
Excretion
Overview More than 90% of a cyclosporine dose is eliminated by the biliary route. Urinary excretion accounts for about 6% of cyclosporine elimination (0.1% as unchanged drug).
Hepatic Impairment Elimination may be prolonged in patients with hepatic impairment.Age dependent changes Children may have more rapid clearance due to higher metabolism rate.
Drug Interactions
Drug MechanismIncrease Concentrations • CYP3A4 inhibitors (including grapefruit
or pomegranate, fruit or juice)• P-glycoprotein inhibitors
• Decrease hepatic metabolism and affect oral bioavailability
• Change distribution of tacrolimus in tissueDecrease Concentrations • CYP3A4 inducers
• P-glycoprotein inducers• Increase hepatic metabolism• Change distribution of tacrolimus in tissue
Concentration Sampling
Sampling Method 1 X 0.6 mL Purple EDTA tube/microtainerAnalysis ImmunoassayUpper Limit of Detection 500 ng/mLLower Limit of Detection 25 ng/mLEstimated Turnaround time 24 hours for Routine testing
Notes on ConcentrationsConcentrations can be altered if drawn out of a line through which the intravenous solution was infused. Concentrations may vary if the patient switches between formulations (ie Gengraf vs Sandimmune).
References:
1. Akhlaghi F, Trull AK. Distribution of Cyclosporin in Organ Transplant Recipients. Clin Pharmacokinet 2002; 41(9): 615-37.
2. Lexi-Comp Online™, Pediatric & Neonatal Lexi-Drugs Online™, Hudson, Ohio: Lexi-Comp, Inc.; May 22, 2012.
3. Micromedex® Healthcare Series. n.d. Thomson Healthcare, Greenwood Village, CO. May 22, 2012 <http://www.thomsonhc.com>.

— 27 —
A Guide to Therapeutic Drug Monitoring
Digoxin
IntroductionCompounds in the digitalis family of glycosides consist of a steroid nucleus, a lactone ring, and a sugar. Digoxin
is widely prescribed for the treatment of congestive heart failure and various disturbances of cardiac rhythm.
Monitoring Indications and Strategies
Route of Administration Patient Population Monitoring SchemeOral Digoxin concentrations should be rarely mon-
itored in pediatric patients. There are no data correlating efficacy of therapy in pediatric patients with heart failure or arrhythmias with digoxin serum concentrations.Rule out toxicity in symptomatic patients; Rule out non-compliance or decreased absorption of enteral formulationLevels should not be monitored after adminis-tration of digoxin Immune Fab due to artificial-ly elevated concentrations.
Pediatric patients (receiving digoxin twice daily) trough concentration at steady state.Adolescent and adult patient (receiving digoxin once daily) a level 6-12 hours after a dose at steady state.
Drug Concentrations
Therapeutic 0.8-2 ng/mLToxic 2 ng/mLCommon signs or symptoms of toxic concentrations
Arrhythmias, bradycardia, heart block, nausea/vomiting, anorexia, visual disturbances (i.e. yellow-green halos)
Suggestions on Dose Modification
Doses should not be adjusted to obtain therapeutic serum concentrations, as there have not been data correlating efficacy with concentrations in pediatric patients.
Adjustment or discontinuation of therapy should occur if toxic signs/symptoms are present.
> 2 mg/mL or signs or symptoms of toxicity Hold dose and/or decrease dose by 50%
*Patient clinical condition, goals of therapy, and practitioner experience should dictate adjustment of dose in response to serum concentrations.
Factors affecting Drug Concentration and DispositionAbsorption
Formulation Percent Absorbed Time to Peak ConcentrationCapsulesElixirTablets
90-100%70-85%60-80%
0.5-2 hours
Food No change Increased
Intravenous 100% 5-60 minutes
Intramuscular Incomplete and Erratic 2-6 hours
— 28 —
DigoxinA Guide to Therapeutic Drug MonitoringDistribution
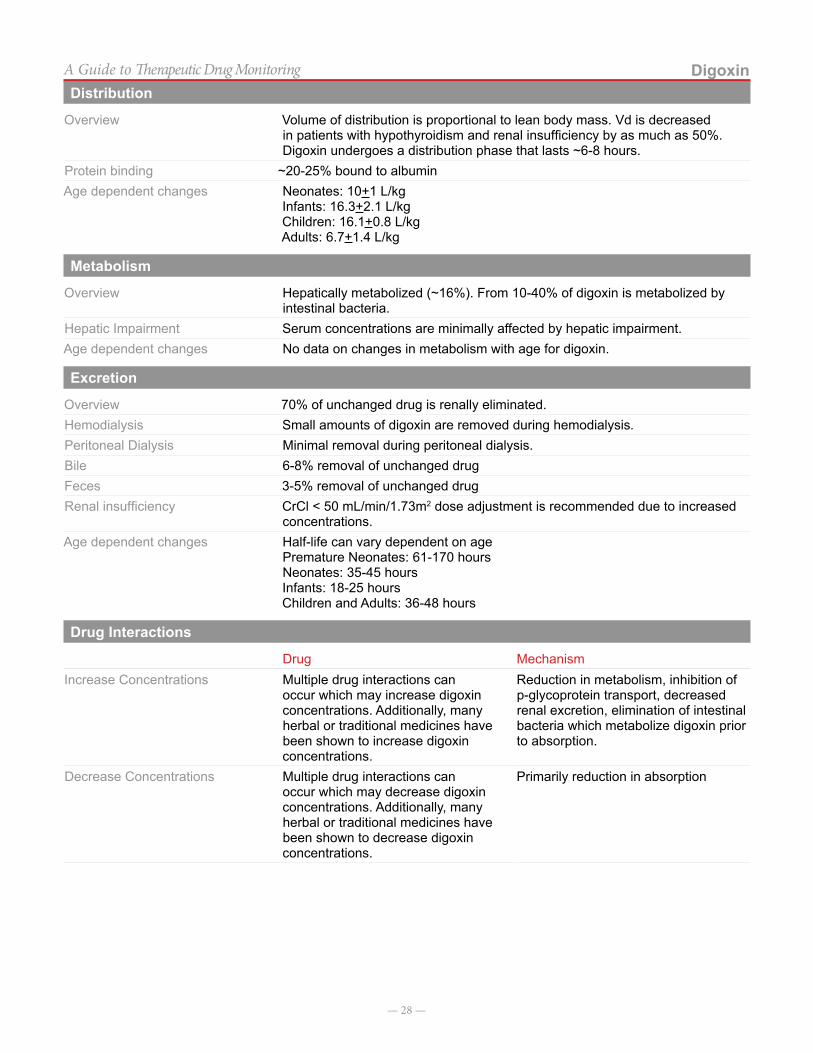
Overview Volume of distribution is proportional to lean body mass. Vd is decreased in patients with hypothyroidism and renal insufficiency by as much as 50%. Digoxin undergoes a distribution phase that lasts ~6-8 hours.
Protein binding ~20-25% bound to albuminAge dependent changes Neonates: 10+1 L/kg
Infants: 16.3+2.1 L/kgChildren: 16.1+0.8 L/kgAdults: 6.7+1.4 L/kg
Metabolism
Overview Hepatically metabolized (~16%). From 10-40% of digoxin is metabolized by intestinal bacteria.
Hepatic Impairment Serum concentrations are minimally affected by hepatic impairment.Age dependent changes No data on changes in metabolism with age for digoxin.
Excretion
Overview 70% of unchanged drug is renally eliminated.Hemodialysis Small amounts of digoxin are removed during hemodialysis.Peritoneal Dialysis Minimal removal during peritoneal dialysis.Bile 6-8% removal of unchanged drugFeces 3-5% removal of unchanged drugRenal insufficiency CrCl < 50 mL/min/1.73m2 dose adjustment is recommended due to increased
concentrations.Age dependent changes Half-life can vary dependent on age
Premature Neonates: 61-170 hoursNeonates: 35-45 hoursInfants: 18-25 hoursChildren and Adults: 36-48 hours
Drug Interactions
Drug MechanismIncrease Concentrations Multiple drug interactions can
occur which may increase digoxin concentrations. Additionally, many herbal or traditional medicines have been shown to increase digoxin concentrations.
Reduction in metabolism, inhibition of p-glycoprotein transport, decreased renal excretion, elimination of intestinal bacteria which metabolize digoxin prior to absorption.
Decrease Concentrations Multiple drug interactions can occur which may decrease digoxin concentrations. Additionally, many herbal or traditional medicines have been shown to decrease digoxin concentrations.
Primarily reduction in absorption
— 29 —
DigoxinA Guide to Therapeutic Drug MonitoringConcentration Sampling
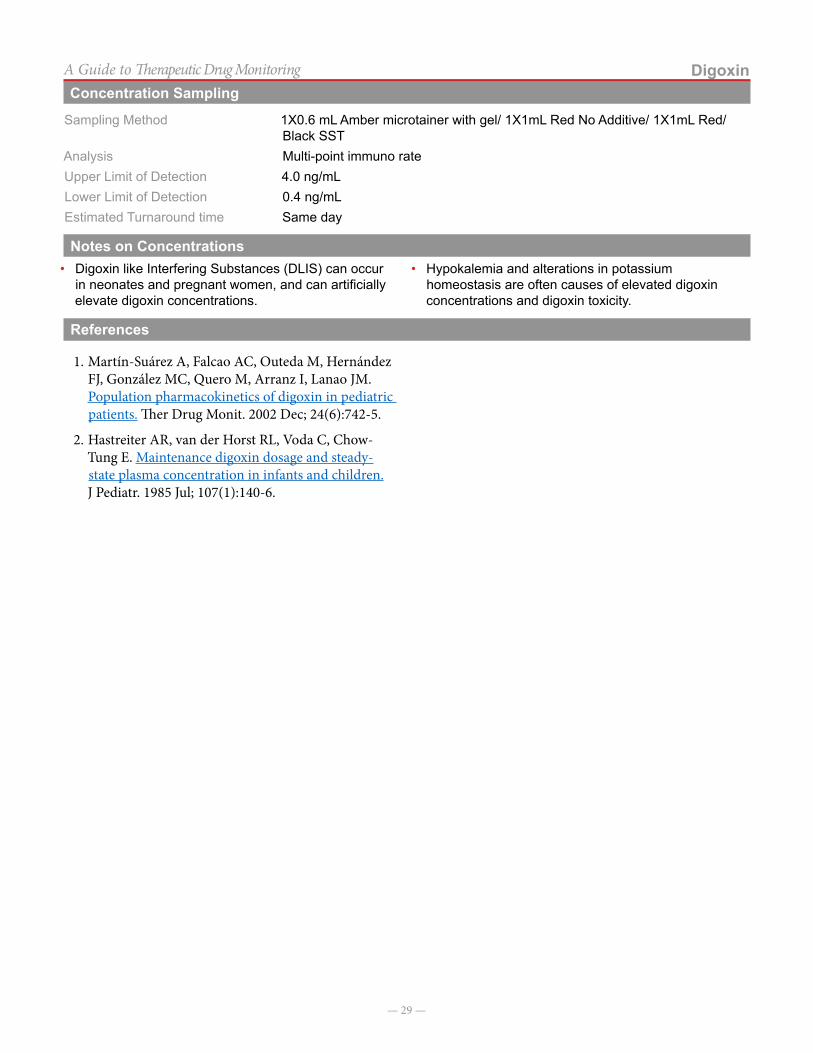
Sampling Method 1X0.6 mL Amber microtainer with gel/ 1X1mL Red No Additive/ 1X1mL Red/Black SST
Analysis Multi-point immuno rateUpper Limit of Detection 4.0 ng/mLLower Limit of Detection 0.4 ng/mLEstimated Turnaround time Same day
Notes on Concentrations• Digoxin like Interfering Substances (DLIS) can occur
in neonates and pregnant women, and can artificially elevate digoxin concentrations.
• Hypokalemia and alterations in potassium homeostasis are often causes of elevated digoxin concentrations and digoxin toxicity.
References
1. Martín-Suárez A, Falcao AC, Outeda M, Hernández FJ, González MC, Quero M, Arranz I, Lanao JM. Population pharmacokinetics of digoxin in pediatric patients. Ther Drug Monit. 2002 Dec; 24(6):742-5.
2. Hastreiter AR, van der Horst RL, Voda C, Chow-Tung E. Maintenance digoxin dosage and steady-state plasma concentration in infants and children. J Pediatr. 1985 Jul; 107(1):140-6.

— 30 —
A Guide to Therapeutic Drug Monitoring
Ethosuximide
IntroductionEthosuximide is an antiepileptic used to treat petit mal and absence seizures. It increases seizure threshold and suppresses the paroxysmal spike-and-wave pattern in
absence seizures. Ethosuximide is considered a drug of choice in treatment of absence seizures.
Monitoring Indications and Strategies
Route of Administration Patient Population Monitoring SchemeOral• Capsule• Tablet
• Baseline level once seizure control attained• Emergency room visit for status epilepticus• Unprovoked, persistent seizure recurrence• Complaints of severe dizziness, drowsiness, anorexia• Adding/removing medication that causes drug-drug
interaction (see “drug interactions” below)• Regular intervals during pregnancy
• Trough concentration when possible
• Random concentrations may be useful in determining compliance or in acute situations
Drug ConcentrationsEthosuximide concentrations do not have a strong association with therapeutic efficacy.
Therapeutic 40-100 mcg/mLToxic > 150 mcg/mL Common signs or symptoms of toxic concentrations
(acute) Respiratory depression, ataxia, stupor, nausea and vomiting and hypotension, other signs and symptoms of neurotoxicity. (chronic) skin rash, confusion, proteinuria, hepatic dysfunction, and hematuria
Suggestions on Dose Modification
No suggestions are available on appropriate dose modification. Ethosuximide demonstrates non-linear pharmacokinetics. Doses should be increased slowly and gradually with expert guidance.
Factors affecting Drug Concentration and DispositionAbsorption
Formulation Percent Absorbed Time to Peak Concentration
Oral Well absorbed ~100%, food has little effect on absorption. 2-4 hours
Distribution
Overview Adults: Volume of distribution: 0.62-0.72 L/kg Protein binding < 10%Age dependent changes No data
Metabolism
Overview Ethosuximide is 80% metabolized in the liver to 3 inactive metabolites. Ethosuximide is a substrate for the cytochrome P450 3A4 enzyme (major) and P450 2E1 (minor).
Hepatic Impairment No recommendations for adjustment of doses in liver dysfunction, use with cautionAge dependent changes No data
— 31 —
EthosuximideA Guide to Therapeutic Drug MonitoringExcretion
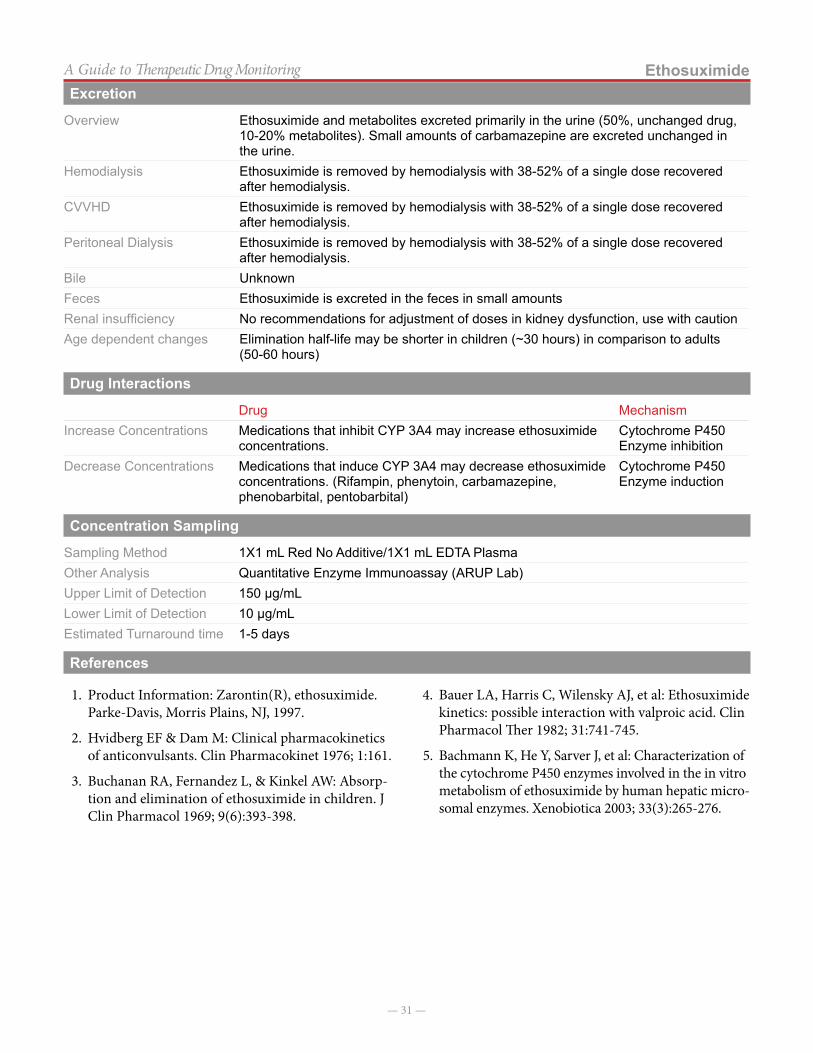
Overview Ethosuximide and metabolites excreted primarily in the urine (50%, unchanged drug, 10-20% metabolites). Small amounts of carbamazepine are excreted unchanged in the urine.
Hemodialysis Ethosuximide is removed by hemodialysis with 38-52% of a single dose recovered after hemodialysis.
CVVHD Ethosuximide is removed by hemodialysis with 38-52% of a single dose recovered after hemodialysis.
Peritoneal Dialysis Ethosuximide is removed by hemodialysis with 38-52% of a single dose recovered after hemodialysis.
Bile UnknownFeces Ethosuximide is excreted in the feces in small amounts Renal insufficiency No recommendations for adjustment of doses in kidney dysfunction, use with cautionAge dependent changes Elimination half-life may be shorter in children (~30 hours) in comparison to adults
(50-60 hours)
Drug Interactions
Drug MechanismIncrease Concentrations Medications that inhibit CYP 3A4 may increase ethosuximide
concentrations.Cytochrome P450 Enzyme inhibition
Decrease Concentrations Medications that induce CYP 3A4 may decrease ethosuximide concentrations. (Rifampin, phenytoin, carbamazepine, phenobarbital, pentobarbital)
Cytochrome P450 Enzyme induction
Concentration Sampling
Sampling Method 1X1 mL Red No Additive/1X1 mL EDTA PlasmaOther Analysis Quantitative Enzyme Immunoassay (ARUP Lab)Upper Limit of Detection 150 µg/mLLower Limit of Detection 10 µg/mLEstimated Turnaround time 1-5 days
References
1. Product Information: Zarontin(R), ethosuximide. Parke-Davis, Morris Plains, NJ, 1997.
2. Hvidberg EF & Dam M: Clinical pharmacokinetics of anticonvulsants. Clin Pharmacokinet 1976; 1:161.
3. Buchanan RA, Fernandez L, & Kinkel AW: Absorp-tion and elimination of ethosuximide in children. J Clin Pharmacol 1969; 9(6):393-398.
4. Bauer LA, Harris C, Wilensky AJ, et al: Ethosuximide kinetics: possible interaction with valproic acid. Clin Pharmacol Ther 1982; 31:741-745.
5. Bachmann K, He Y, Sarver J, et al: Characterization of the cytochrome P450 enzymes involved in the in vitro metabolism of ethosuximide by human hepatic micro-somal enzymes. Xenobiotica 2003; 33(3):265-276.
— 32 —
A Guide to Therapeutic Drug Monitoring
Felbamate
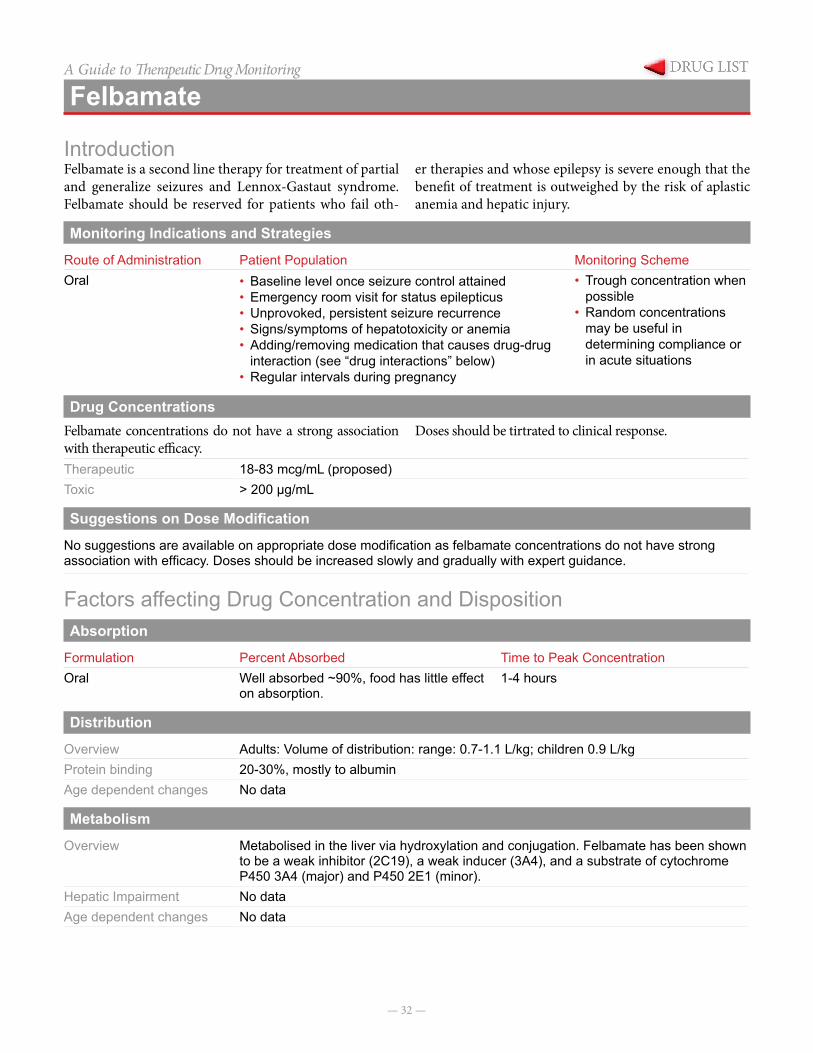
IntroductionFelbamate is a second line therapy for treatment of partial and generalize seizures and Lennox-Gastaut syndrome. Felbamate should be reserved for patients who fail oth-
er therapies and whose epilepsy is severe enough that the benefit of treatment is outweighed by the risk of aplastic anemia and hepatic injury.
Monitoring Indications and Strategies
Route of Administration Patient Population Monitoring SchemeOral • Baseline level once seizure control attained
• Emergency room visit for status epilepticus• Unprovoked, persistent seizure recurrence• Signs/symptoms of hepatotoxicity or anemia• Adding/removing medication that causes drug-drug
interaction (see “drug interactions” below)• Regular intervals during pregnancy
• Trough concentration when possible
• Random concentrations may be useful in determining compliance or in acute situations
Drug ConcentrationsFelbamate concentrations do not have a strong association with therapeutic efficacy.
Doses should be tirtrated to clinical response.
Therapeutic 18-83 mcg/mL (proposed)Toxic > 200 µg/mL
Suggestions on Dose Modification
No suggestions are available on appropriate dose modification as felbamate concentrations do not have strong association with efficacy. Doses should be increased slowly and gradually with expert guidance.
Factors affecting Drug Concentration and DispositionAbsorption
Formulation Percent Absorbed Time to Peak ConcentrationOral Well absorbed ~90%, food has little effect
on absorption.1-4 hours
Distribution
Overview Adults: Volume of distribution: range: 0.7-1.1 L/kg; children 0.9 L/kgProtein binding 20-30%, mostly to albuminAge dependent changes No data
Metabolism
Overview Metabolised in the liver via hydroxylation and conjugation. Felbamate has been shown to be a weak inhibitor (2C19), a weak inducer (3A4), and a substrate of cytochrome P450 3A4 (major) and P450 2E1 (minor).
Hepatic Impairment No dataAge dependent changes No data

— 33 —
FelbamateA Guide to Therapeutic Drug MonitoringExcretion
Overview Felbamate and metabolites are eliminated in the urine as unchanged drug (40-50%) and inactive metabolites (50%). Half-life in children is ~16 hours, in comparison to adults (20-30 hours).
Hemodialysis No data, but felbamate may be cleared by dialysis due to the renal clearance of felbamate and metabolites.
CVVHD No data, but felbamate may be cleared by dialysis due to the renal clearance of felbamate and metabolites.
Peritoneal Dialysis No data, but felbamate may be cleared by dialysis due to the renal clearance of felbamate and metabolites.
Bile No data Feces Not eliminated in the fecesRenal insufficiency Clearance is decreased in patients with kidney dysfunction. Caution should be
exercised when using felbamate in patients with low creatinine clearance.Age dependent changes Clearance is increased in children in comparison to adults.
Drug Interactions
Drug MechanismIncrease Concentrations Medications that inhibit CYP
3A4 may increase felbamate concentrations.
Cytochrome P450 Enzyme inhibition
Decrease Concentrations Medications that induce CYP 3A4 may decrease felbamate concentrations. (Rifampin, phenytoin, carbamazepine, phenobarbital, pentobarbital)
Cytochrome P450 Enzyme induction
Concentration Sampling
Sampling Method 1X1 mL Red No Additive/ 1X1 mL EDTA plasma /Green SodiumSample Type Heparin plasmaOther Analysis HPLC (ARUP Labs)Upper Limit of Detection 400 µg/mLLower Limit of Detection 5 µg/mLEstimated Turnaround time 1–4 days
References
1. Product Information: Felbatol(R), felbamate. Wallace Laboratories, Cranbury, NJ, 2002.
2. Leppik IE, Dreifuss FE, Pledger GW, et al: Felbamate for partial seizures: results of a controlled clinical trial. Neurology 1991; 41:1785-1789.
3. Kelley MT, Walson PD, Cox S, et al: Population phar-macokinetics of felbamate in children. Therap Drug Monit 1997; 19:29-36.
— 34 —
A Guide to Therapeutic Drug Monitoring
Flecainide
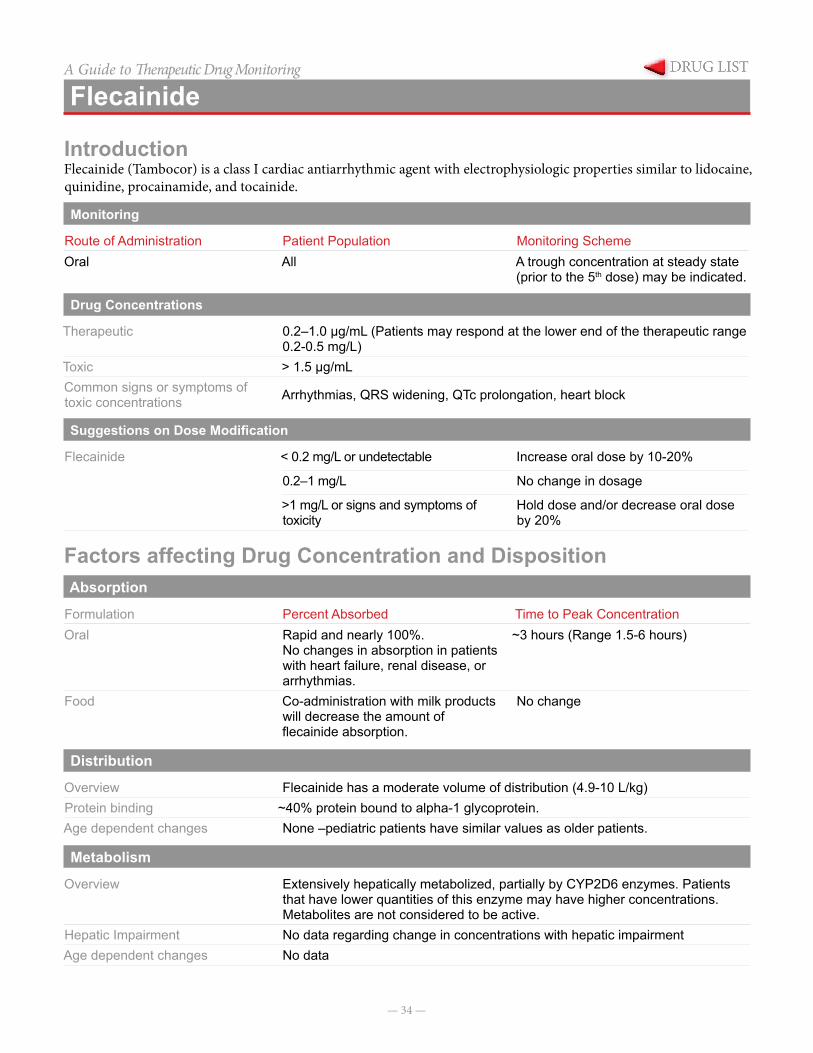
IntroductionFlecainide (Tambocor) is a class I cardiac antiarrhythmic agent with electrophysiologic properties similar to lidocaine, quinidine, procainamide, and tocainide.
Monitoring Indications and Strategies
Route of Administration Patient Population Monitoring SchemeOral All A trough concentration at steady state
(prior to the 5th dose) may be indicated.
Drug Concentrations
Therapeutic 0.2–1.0 µg/mL (Patients may respond at the lower end of the therapeutic range 0.2-0.5 mg/L)
Toxic > 1.5 µg/mL Common signs or symptoms of toxic concentrations Arrhythmias, QRS widening, QTc prolongation, heart block
Suggestions on Dose Modification
Flecainide < 0.2 mg/L or undetectable Increase oral dose by 10-20%
0.2–1 mg/L No change in dosage
>1 mg/L or signs and symptoms of toxicity
Hold dose and/or decrease oral dose by 20%
Factors affecting Drug Concentration and DispositionAbsorption
Formulation Percent Absorbed Time to Peak ConcentrationOral Rapid and nearly 100%.
No changes in absorption in patients with heart failure, renal disease, or arrhythmias.
~3 hours (Range 1.5-6 hours)
Food Co-administration with milk products will decrease the amount of flecainide absorption.
No change
Distribution
Overview Flecainide has a moderate volume of distribution (4.9-10 L/kg)Protein binding ~40% protein bound to alpha-1 glycoprotein.Age dependent changes None –pediatric patients have similar values as older patients.
Metabolism
Overview Extensively hepatically metabolized, partially by CYP2D6 enzymes. Patients that have lower quantities of this enzyme may have higher concentrations. Metabolites are not considered to be active.
Hepatic Impairment No data regarding change in concentrations with hepatic impairmentAge dependent changes No data
— 35 —
FlecainideA Guide to Therapeutic Drug MonitoringExcretion
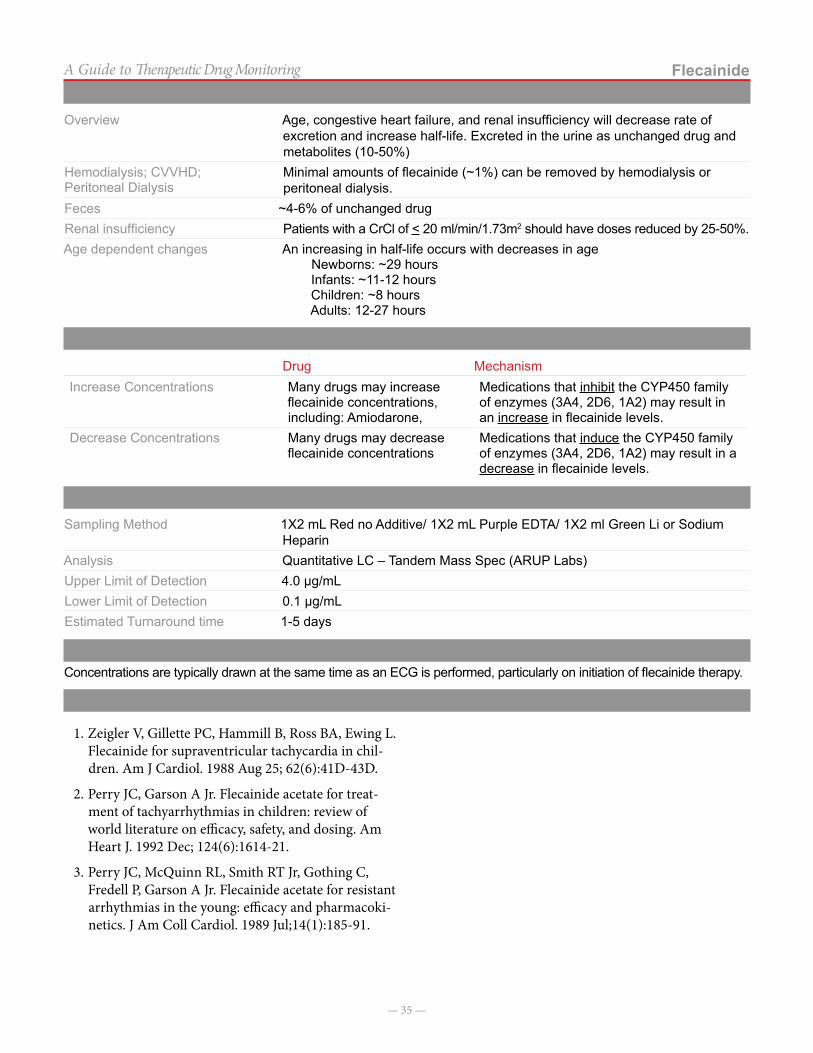
Overview Age, congestive heart failure, and renal insufficiency will decrease rate of excretion and increase half-life. Excreted in the urine as unchanged drug and metabolites (10-50%)
Hemodialysis; CVVHD; Peritoneal Dialysis
Minimal amounts of flecainide (~1%) can be removed by hemodialysis or peritoneal dialysis.
Feces ~4-6% of unchanged drugRenal insufficiency Patients with a CrCl of < 20 ml/min/1.73m2 should have doses reduced by 25-50%.Age dependent changes An increasing in half-life occurs with decreases in age
Newborns: ~29 hoursInfants: ~11-12 hoursChildren: ~8 hoursAdults: 12-27 hours
Drug Interactions
Drug MechanismIncrease Concentrations Many drugs may increase
flecainide concentrations, including: Amiodarone,
Medications that inhibit the CYP450 family of enzymes (3A4, 2D6, 1A2) may result in an increase in flecainide levels.
Decrease Concentrations Many drugs may decrease flecainide concentrations
Medications that induce the CYP450 family of enzymes (3A4, 2D6, 1A2) may result in a decrease in flecainide levels.
Concentration Sampling
Sampling Method 1X2 mL Red no Additive/ 1X2 mL Purple EDTA/ 1X2 ml Green Li or Sodium Heparin
Analysis Quantitative LC – Tandem Mass Spec (ARUP Labs)Upper Limit of Detection 4.0 µg/mLLower Limit of Detection 0.1 µg/mLEstimated Turnaround time 1-5 days
Notes on ConcentrationsConcentrations are typically drawn at the same time as an ECG is performed, particularly on initiation of flecainide therapy.
References
1. Zeigler V, Gillette PC, Hammill B, Ross BA, Ewing L. Flecainide for supraventricular tachycardia in chil-dren. Am J Cardiol. 1988 Aug 25; 62(6):41D-43D.
2. Perry JC, Garson A Jr. Flecainide acetate for treat-ment of tachyarrhythmias in children: review of world literature on efficacy, safety, and dosing. Am Heart J. 1992 Dec; 124(6):1614-21.
3. Perry JC, McQuinn RL, Smith RT Jr, Gothing C, Fredell P, Garson A Jr. Flecainide acetate for resistant arrhythmias in the young: efficacy and pharmacoki-netics. J Am Coll Cardiol. 1989 Jul;14(1):185-91.
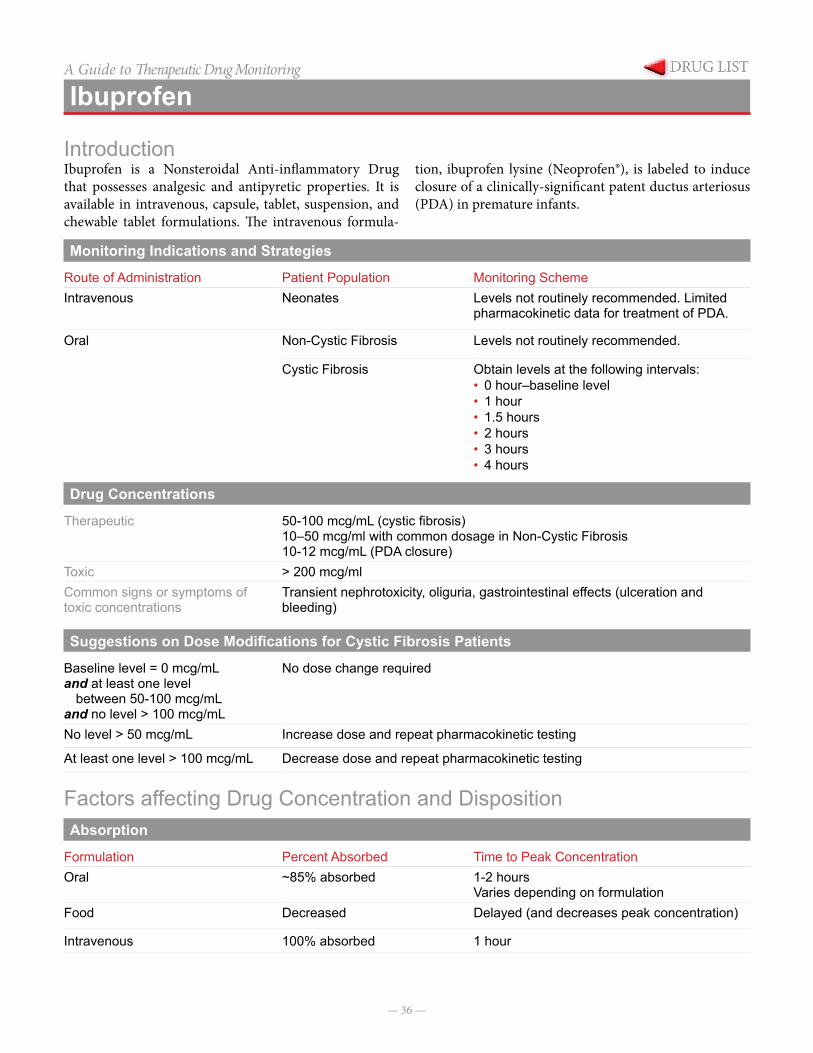
— 36 —
A Guide to Therapeutic Drug Monitoring
Ibuprofen
IntroductionIbuprofen is a Nonsteroidal Anti-inflammatory Drug that possesses analgesic and antipyretic properties. It is available in intravenous, capsule, tablet, suspension, and chewable tablet formulations. The intravenous formula-
tion, ibuprofen lysine (Neoprofen®), is labeled to induce closure of a clinically-significant patent ductus arteriosus (PDA) in premature infants.
Monitoring Indications and Strategies
Route of Administration Patient Population Monitoring SchemeIntravenous Neonates Levels not routinely recommended. Limited
pharmacokinetic data for treatment of PDA.
Oral Non-Cystic Fibrosis Levels not routinely recommended.
Cystic Fibrosis Obtain levels at the following intervals:• 0 hour–baseline level• 1 hour• 1.5 hours• 2 hours• 3 hours• 4 hours
Drug Concentrations
Therapeutic 50-100 mcg/mL (cystic fibrosis)10–50 mcg/ml with common dosage in Non-Cystic Fibrosis10-12 mcg/mL (PDA closure)
Toxic > 200 mcg/mlCommon signs or symptoms of toxic concentrations
Transient nephrotoxicity, oliguria, gastrointestinal effects (ulceration and bleeding)
Suggestions on Dose Modifications for Cystic Fibrosis Patients
Baseline level = 0 mcg/mLand at least one level
between 50-100 mcg/mLand no level > 100 mcg/mL
No dose change required
No level > 50 mcg/mL Increase dose and repeat pharmacokinetic testing
At least one level > 100 mcg/mL Decrease dose and repeat pharmacokinetic testing
Factors affecting Drug Concentration and DispositionAbsorption
Formulation Percent Absorbed Time to Peak ConcentrationOral ~85% absorbed 1-2 hours
Varies depending on formulationFood Decreased Delayed (and decreases peak concentration)
Intravenous 100% absorbed 1 hour
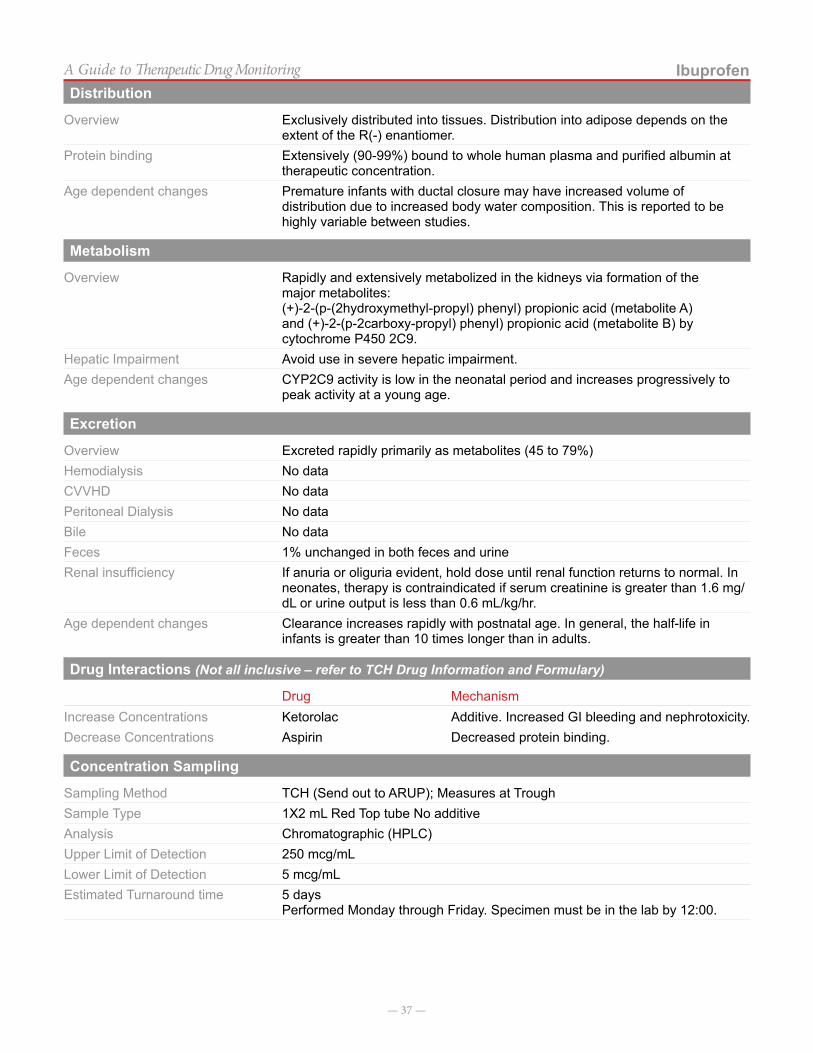
— 37 —
IbuprofenA Guide to Therapeutic Drug MonitoringDistribution
Overview Exclusively distributed into tissues. Distribution into adipose depends on the extent of the R(-) enantiomer.
Protein binding Extensively (90-99%) bound to whole human plasma and purified albumin at therapeutic concentration.
Age dependent changes Premature infants with ductal closure may have increased volume of distribution due to increased body water composition. This is reported to be highly variable between studies.
Metabolism
Overview Rapidly and extensively metabolized in the kidneys via formation of the major metabolites:(+)-2-(p-(2hydroxymethyl-propyl) phenyl) propionic acid (metabolite A) and (+)-2-(p-2carboxy-propyl) phenyl) propionic acid (metabolite B) by cytochrome P450 2C9.
Hepatic Impairment Avoid use in severe hepatic impairment.Age dependent changes CYP2C9 activity is low in the neonatal period and increases progressively to
peak activity at a young age.
Excretion
Overview Excreted rapidly primarily as metabolites (45 to 79%)Hemodialysis No dataCVVHD No dataPeritoneal Dialysis No dataBile No dataFeces 1% unchanged in both feces and urineRenal insufficiency If anuria or oliguria evident, hold dose until renal function returns to normal. In
neonates, therapy is contraindicated if serum creatinine is greater than 1.6 mg/dL or urine output is less than 0.6 mL/kg/hr.
Age dependent changes Clearance increases rapidly with postnatal age. In general, the half-life in infants is greater than 10 times longer than in adults.
Drug Interactions (Not all inclusive – refer to TCH Drug Information and Formulary)
Drug MechanismIncrease Concentrations Ketorolac Additive. Increased GI bleeding and nephrotoxicity.Decrease Concentrations Aspirin Decreased protein binding.
Concentration Sampling
Sampling Method TCH (Send out to ARUP); Measures at TroughSample Type 1X2 mL Red Top tube No additiveAnalysis Chromatographic (HPLC)Upper Limit of Detection 250 mcg/mLLower Limit of Detection 5 mcg/mLEstimated Turnaround time 5 days
Performed Monday through Friday. Specimen must be in the lab by 12:00.
— 38 —
IbuprofenA Guide to Therapeutic Drug MonitoringNotes on Concentrations
Cystic fibrosis patients being treated with high-dose ibuprofen therapy must have individual pharmacokinetic testing done prior to initiating therapy and re-checked in the following circumstances:1) at least every 3 years, 2) with weight changes >25%, 3) change in medication formulation (e.g. tablets vs. suspension) or 4) significant change in renal or hepatic function.
References
1. Davies NM. Clinical pharmacokinetics of ibuprofen. Clin Pharmacokinet.1998: 34(2):101-154.
2. Van Overmeire B, Touw D, Schepens PJ, Kearns GL, Van den anker JN. Ibuprofen pharmacokinetics in preterm infants with patent ductus arteriosus. Clin Pharmacol Ther. 2001; 70(4):336-43.
3. Han EE, Beringer PM, Louie SG, Gill MA, Shapiro Berttrand J. Clin Pharmacokinet. 2004; 43(3):145-156.
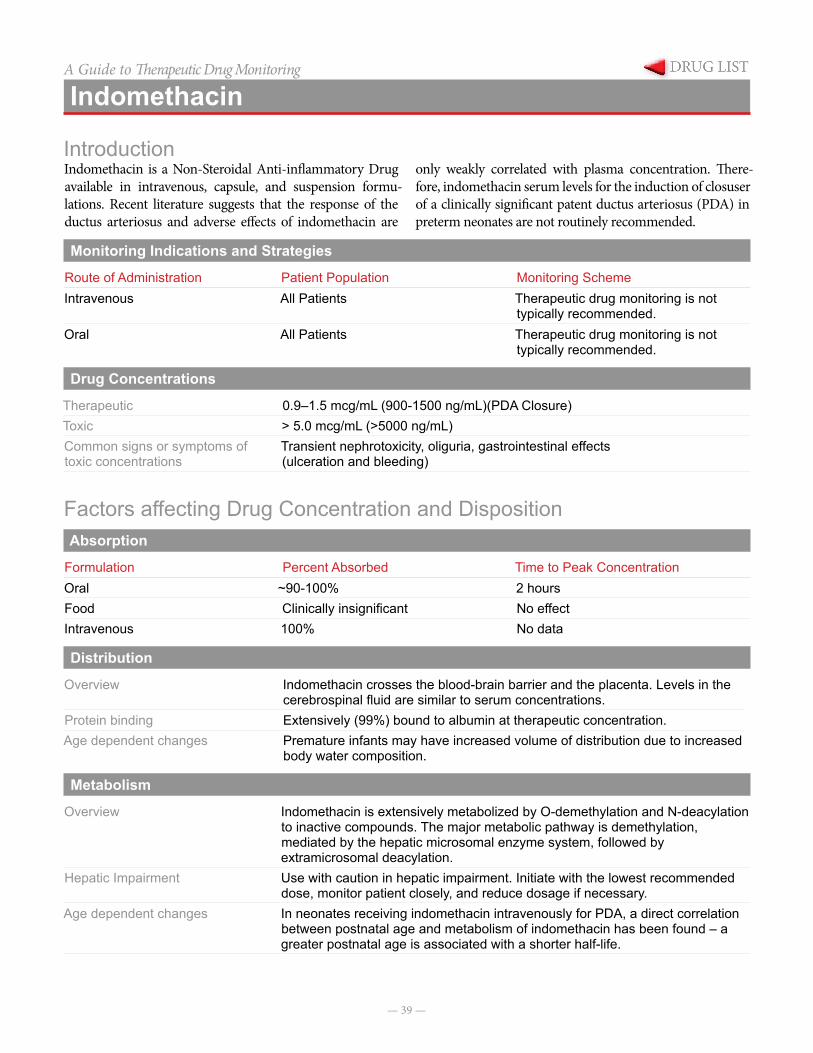
— 39 —
A Guide to Therapeutic Drug Monitoring
Indomethacin
IntroductionIndomethacin is a Non-Steroidal Anti-inflammatory Drug available in intravenous, capsule, and suspension formu-lations. Recent literature suggests that the response of the ductus arteriosus and adverse effects of indomethacin are
only weakly correlated with plasma concentration. There-fore, indomethacin serum levels for the induction of closuser of a clinically significant patent ductus arteriosus (PDA) in preterm neonates are not routinely recommended.
Monitoring Indications and Strategies
Route of Administration Patient Population Monitoring SchemeIntravenous All Patients Therapeutic drug monitoring is not
typically recommended.Oral All Patients Therapeutic drug monitoring is not
typically recommended.
Drug Concentrations
Therapeutic 0.9–1.5 mcg/mL (900-1500 ng/mL)(PDA Closure)Toxic > 5.0 mcg/mL (>5000 ng/mL)Common signs or symptoms of toxic concentrations
Transient nephrotoxicity, oliguria, gastrointestinal effects (ulceration and bleeding)
Factors affecting Drug Concentration and DispositionAbsorption
Formulation Percent Absorbed Time to Peak ConcentrationOral ~90-100% 2 hoursFood Clinically insignificant No effectIntravenous 100% No data
Distribution
Overview Indomethacin crosses the blood-brain barrier and the placenta. Levels in the cerebrospinal fluid are similar to serum concentrations.
Protein binding Extensively (99%) bound to albumin at therapeutic concentration.Age dependent changes Premature infants may have increased volume of distribution due to increased
body water composition.
Metabolism
Overview Indomethacin is extensively metabolized by O-demethylation and N-deacylation to inactive compounds. The major metabolic pathway is demethylation, mediated by the hepatic microsomal enzyme system, followed by extramicrosomal deacylation.
Hepatic Impairment Use with caution in hepatic impairment. Initiate with the lowest recommended dose, monitor patient closely, and reduce dosage if necessary.
Age dependent changes In neonates receiving indomethacin intravenously for PDA, a direct correlation between postnatal age and metabolism of indomethacin has been found – a greater postnatal age is associated with a shorter half-life.
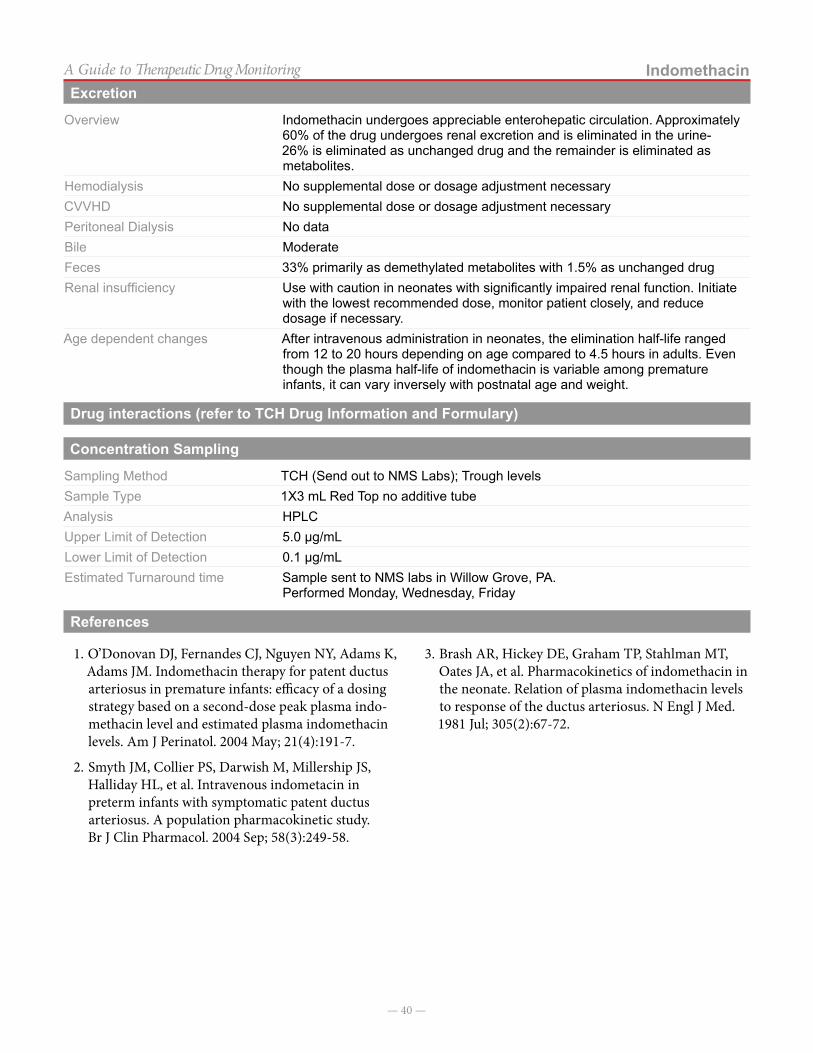
— 40 —
IndomethacinA Guide to Therapeutic Drug MonitoringExcretion
Overview Indomethacin undergoes appreciable enterohepatic circulation. Approximately 60% of the drug undergoes renal excretion and is eliminated in the urine- 26% is eliminated as unchanged drug and the remainder is eliminated as metabolites.
Hemodialysis No supplemental dose or dosage adjustment necessaryCVVHD No supplemental dose or dosage adjustment necessaryPeritoneal Dialysis No dataBile ModerateFeces 33% primarily as demethylated metabolites with 1.5% as unchanged drugRenal insufficiency Use with caution in neonates with significantly impaired renal function. Initiate
with the lowest recommended dose, monitor patient closely, and reduce dosage if necessary.
Age dependent changes After intravenous administration in neonates, the elimination half-life ranged from 12 to 20 hours depending on age compared to 4.5 hours in adults. Even though the plasma half-life of indomethacin is variable among premature infants, it can vary inversely with postnatal age and weight.
Drug interactions (refer to TCH Drug Information and Formulary)
Concentration Sampling
Sampling Method TCH (Send out to NMS Labs); Trough levelsSample Type 1X3 mL Red Top no additive tubeAnalysis HPLCUpper Limit of Detection 5.0 µg/mLLower Limit of Detection 0.1 µg/mLEstimated Turnaround time Sample sent to NMS labs in Willow Grove, PA.
Performed Monday, Wednesday, Friday
References
1. O’Donovan DJ, Fernandes CJ, Nguyen NY, Adams K, Adams JM. Indomethacin therapy for patent ductus arteriosus in premature infants: efficacy of a dosing strategy based on a second-dose peak plasma indo-methacin level and estimated plasma indomethacin levels. Am J Perinatol. 2004 May; 21(4):191-7.
2. Smyth JM, Collier PS, Darwish M, Millership JS, Halliday HL, et al. Intravenous indometacin in preterm infants with symptomatic patent ductus arteriosus. A population pharmacokinetic study. Br J Clin Pharmacol. 2004 Sep; 58(3):249-58.
3. Brash AR, Hickey DE, Graham TP, Stahlman MT, Oates JA, et al. Pharmacokinetics of indomethacin in the neonate. Relation of plasma indomethacin levels to response of the ductus arteriosus. N Engl J Med. 1981 Jul; 305(2):67-72.
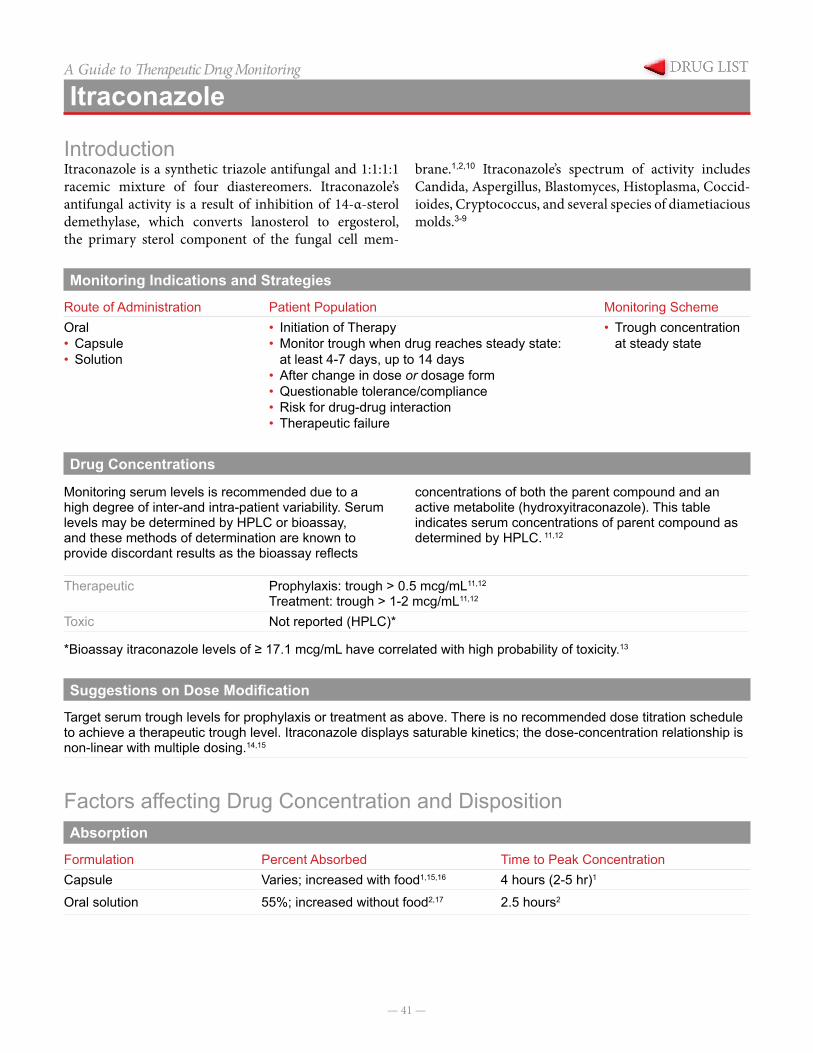
— 41 —
A Guide to Therapeutic Drug Monitoring
Itraconazole
IntroductionItraconazole is a synthetic triazole antifungal and 1:1:1:1 racemic mixture of four diastereomers. Itraconazole’s antifungal activity is a result of inhibition of 14-α-sterol demethylase, which converts lanosterol to ergosterol, the primary sterol component of the fungal cell mem-
brane.1,2,10 Itraconazole’s spectrum of activity includes Candida, Aspergillus, Blastomyces, Histoplasma, Coccid-ioides, Cryptococcus, and several species of diametiacious molds.3-9
Monitoring Indications and Strategies
Route of Administration Patient Population Monitoring SchemeOral• Capsule• Solution
• Initiation of Therapy• Monitor trough when drug reaches steady state:
at least 4-7 days, up to 14 days• After change in dose or dosage form• Questionable tolerance/compliance• Risk for drug-drug interaction• Therapeutic failure
• Trough concentration at steady state
Drug Concentrations
Monitoring serum levels is recommended due to a high degree of inter-and intra-patient variability. Serum levels may be determined by HPLC or bioassay, and these methods of determination are known to provide discordant results as the bioassay reflects
concentrations of both the parent compound and an active metabolite (hydroxyitraconazole). This table indicates serum concentrations of parent compound as determined by HPLC. 11,12
Therapeutic Prophylaxis: trough > 0.5 mcg/mL11,12
Treatment: trough > 1-2 mcg/mL11,12 Toxic Not reported (HPLC)*
*Bioassay itraconazole levels of ≥ 17.1 mcg/mL have correlated with high probability of toxicity.13
Suggestions on Dose Modification
Target serum trough levels for prophylaxis or treatment as above. There is no recommended dose titration schedule to achieve a therapeutic trough level. Itraconazole displays saturable kinetics; the dose-concentration relationship is non-linear with multiple dosing.14,15
Factors affecting Drug Concentration and DispositionAbsorption
Formulation Percent Absorbed Time to Peak ConcentrationCapsule Varies; increased with food1,15,16 4 hours (2-5 hr)1
Oral solution 55%; increased without food2,17 2.5 hours2
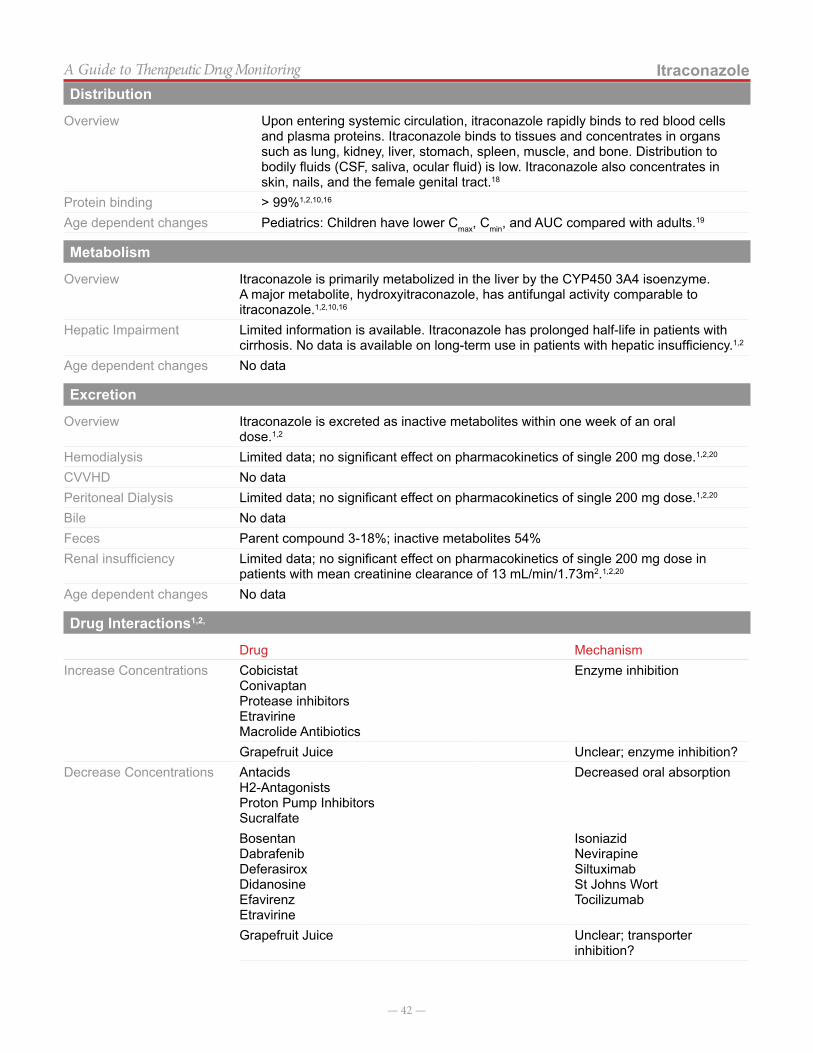
— 42 —
ItraconazoleA Guide to Therapeutic Drug MonitoringDistribution
Overview Upon entering systemic circulation, itraconazole rapidly binds to red blood cells and plasma proteins. Itraconazole binds to tissues and concentrates in organs such as lung, kidney, liver, stomach, spleen, muscle, and bone. Distribution to bodily fluids (CSF, saliva, ocular fluid) is low. Itraconazole also concentrates in skin, nails, and the female genital tract.18
Protein binding > 99%1,2,10,16
Age dependent changes Pediatrics: Children have lower Cmax, Cmin, and AUC compared with adults.19
Metabolism
Overview Itraconazole is primarily metabolized in the liver by the CYP450 3A4 isoenzyme. A major metabolite, hydroxyitraconazole, has antifungal activity comparable to itraconazole.1,2,10,16
Hepatic Impairment Limited information is available. Itraconazole has prolonged half-life in patients with cirrhosis. No data is available on long-term use in patients with hepatic insufficiency.1,2
Age dependent changes No data
Excretion
Overview Itraconazole is excreted as inactive metabolites within one week of an oral dose.1,2
Hemodialysis Limited data; no significant effect on pharmacokinetics of single 200 mg dose.1,2,20
CVVHD No dataPeritoneal Dialysis Limited data; no significant effect on pharmacokinetics of single 200 mg dose.1,2,20
Bile No data Feces Parent compound 3-18%; inactive metabolites 54%Renal insufficiency Limited data; no significant effect on pharmacokinetics of single 200 mg dose in
patients with mean creatinine clearance of 13 mL/min/1.73m2.1,2,20
Age dependent changes No data
Drug Interactions1,2,
Drug MechanismIncrease Concentrations Cobicistat
ConivaptanProtease inhibitorsEtravirineMacrolide Antibiotics
Enzyme inhibition
Grapefruit Juice Unclear; enzyme inhibition?Decrease Concentrations Antacids
H2-AntagonistsProton Pump InhibitorsSucralfate
Decreased oral absorption
BosentanDabrafenibDeferasiroxDidanosineEfavirenzEtravirine
IsoniazidNevirapineSiltuximabSt Johns WortTocilizumab
Grapefruit Juice Unclear; transporter inhibition?
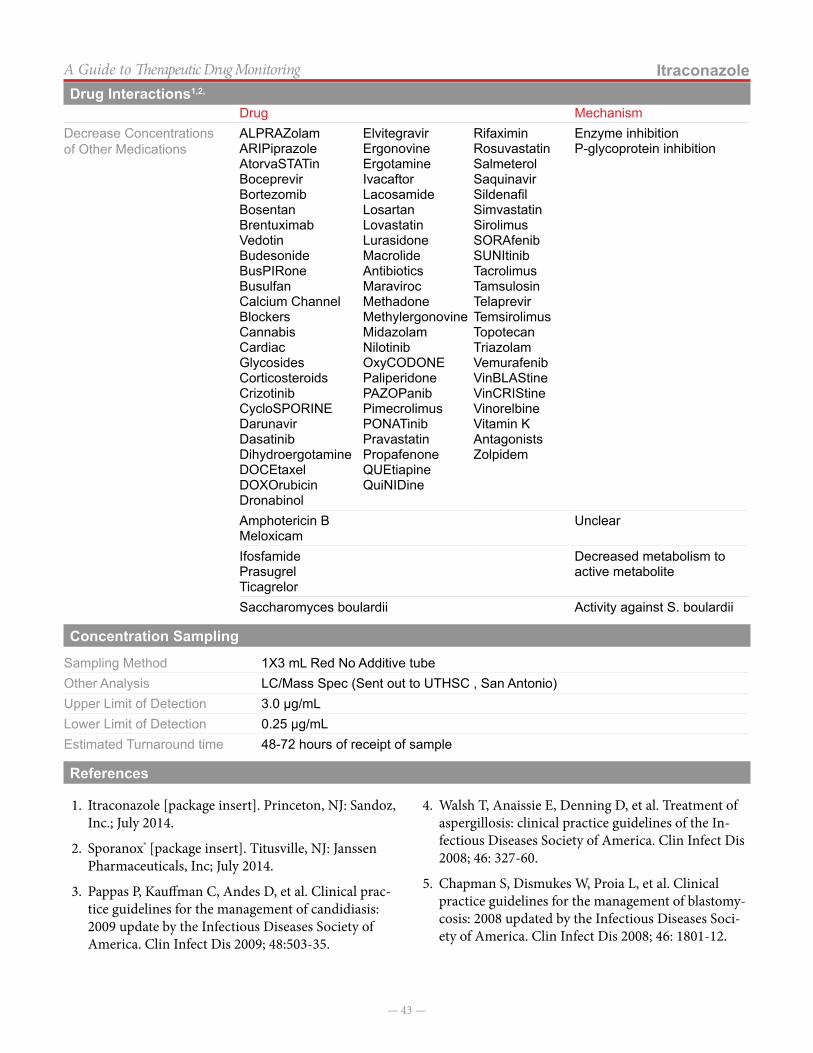
— 43 —
ItraconazoleA Guide to Therapeutic Drug Monitoring
Drug MechanismDecrease Concentrations of Other Medications
ALPRAZolamARIPiprazoleAtorvaSTATinBoceprevirBortezomibBosentanBrentuximabVedotinBudesonideBusPIRoneBusulfanCalcium Channel BlockersCannabisCardiacGlycosidesCorticosteroidsCrizotinibCycloSPORINEDarunavirDasatinibDihydroergotamineDOCEtaxelDOXOrubicinDronabinol
ElvitegravirErgonovineErgotamineIvacaftorLacosamideLosartanLovastatinLurasidoneMacrolide AntibioticsMaravirocMethadoneMethylergonovineMidazolamNilotinibOxyCODONEPaliperidonePAZOPanibPimecrolimusPONATinibPravastatinPropafenoneQUEtiapineQuiNIDine
RifaximinRosuvastatinSalmeterolSaquinavirSildenafilSimvastatinSirolimusSORAfenibSUNItinibTacrolimusTamsulosinTelaprevirTemsirolimusTopotecanTriazolamVemurafenibVinBLAStineVinCRIStineVinorelbineVitamin K AntagonistsZolpidem
Enzyme inhibitionP-glycoprotein inhibition
Amphotericin BMeloxicam
Unclear
IfosfamidePrasugrelTicagrelor
Decreased metabolism to active metabolite
Saccharomyces boulardii Activity against S. boulardii
Concentration Sampling
Sampling Method 1X3 mL Red No Additive tubeOther Analysis LC/Mass Spec (Sent out to UTHSC , San Antonio)Upper Limit of Detection 3.0 µg/mLLower Limit of Detection 0.25 µg/mLEstimated Turnaround time 48-72 hours of receipt of sample
References
1. Itraconazole [package insert]. Princeton, NJ: Sandoz, Inc.; July 2014.
2. Sporanox® [package insert]. Titusville, NJ: Janssen Pharmaceuticals, Inc; July 2014.
3. Pappas P, Kauffman C, Andes D, et al. Clinical prac-tice guidelines for the management of candidiasis: 2009 update by the Infectious Diseases Society of America. Clin Infect Dis 2009; 48:503-35.
4. Walsh T, Anaissie E, Denning D, et al. Treatment of aspergillosis: clinical practice guidelines of the In-fectious Diseases Society of America. Clin Infect Dis 2008; 46: 327-60.
5. Chapman S, Dismukes W, Proia L, et al. Clinical practice guidelines for the management of blastomy-cosis: 2008 updated by the Infectious Diseases Soci-ety of America. Clin Infect Dis 2008; 46: 1801-12.
Drug Interactions1,2,
— 44 —
ItraconazoleA Guide to Therapeutic Drug Monitoring
6. Wheat L, Freifeld A, Kleiman M, et al. Clinical practice guidelines for the management of patients with histoplasmosis: 2007 update by the Infectious Diseases Society of America. Clin Infect Dis 2007; 45: 807-25.
7. Galgiani J, Ampel N, Blair J, et al. Coccidioidomycosis. Clin Infect Dis 2005; 41: 1217-23.
8. Perfect J, Dismukes W, Dromer F, et al. Clinical prac-tice guidelines for the management of cryptococcal disease: 2010 update by the Infectious Diseases Soci-ety of America. Clin Infect Dis 2010; 50: 291-322.
9. Brandt M, Warnock D. Epidemiology, clinical mani-festations, and therapy of infections caused by dema-tiaceous fungi. J Chemother 2003; 15 Suppl 2: 36-47.
10. Prentice A, Glasmacher A. Making sense of itracon-azole pharmacokinetics. J Antimicrob Chemo 2005; 56 Suppl S1: i17-22.
11. Andes D, Pascual A, Marchetti O. Antifungal ther-apeutic drug monitoring: Established and emerging indications. Antimicrob Agents Chemother 2009; 53: 24-34.
12. Glasmacher A, Molitor E, Mezger J, et al. Antifungal prophylaxis with itraconazole in neutropenic pa-tients: pharmacological, microbiological, and clinical aspects. Mycoses 1996; 39: 249-58.
13. Lestner J, Roberts S, Moore C, et al. Toxicodynamics of itraconazole: implications for therapeutic drug monitoring. Clin Infect Dis 2009; 49: 928-30.
14. Van Peer A, Woestenborgs R, Heykants J, et al. The effects of food and dose on the oral systemic avail-ability of itraconazole in healthy subjects. Eur J Clin Pharmacol 1989; 36: 423-6.
15. Barone J, Koh J, Bierman R, et al. Food interaction and steady-state pharmacokinetics of itraconazole capsules in healthy male volunteers. Antimicrob Agents Chemother 1993; 37: 778-84.
16. Stockmann C, Constance J, Roberts J, et al. Pharma-cokinetics and pharmacodynamics of antifungals in children and their clinical implications. Clin Phar-macokinet 2014; 53: 429-54.
17. Barone J, Moskovitchj B, Guarneri J, et al. En-hanced bioavailability of itraconazole in hydroxy-propyl-β-cyclodextrin solution versus capsules in healthy volunteers. Antimicrob Agents Chemother 1998; 42: 1862-5.
18. Willems L, van der Geest R, de Beule K. Itraconazole oral solution and intravenous formulations: a review of pharmacokinetics and pharmacodynamics. J Clin Pharm Ther 2001; 26: 159-69.
19. De Repentigny L, Ratelle J, Leclerc J, et al. Repeat-ed-dose pharmacokinetics of an oral solution of itraconazole in infants and children. Antimicrob Agents Chemother 1998; 42: 404-8.
20. Boelaert J, Schurgers M, Matthys E, et al. Itracon-azole pharmacokinetics in patients with renal dysfunction. Antimicrob Agents Chemother 1988; 32:1595-7.
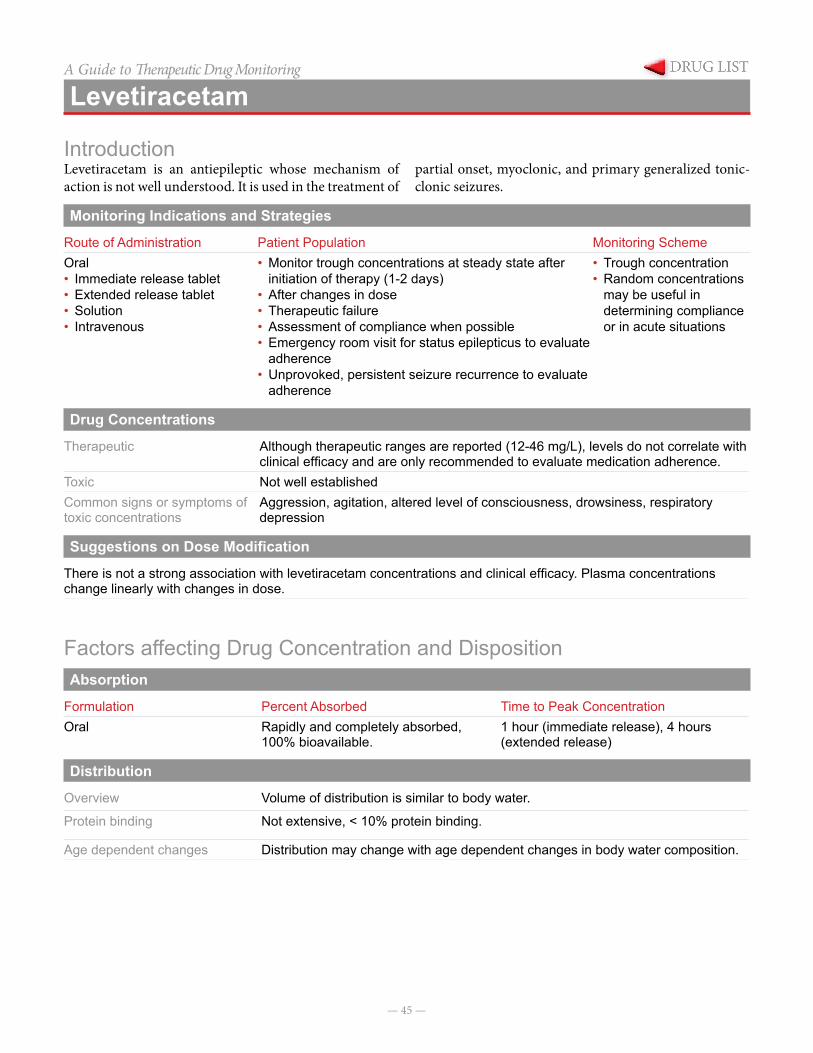
— 45 —
A Guide to Therapeutic Drug Monitoring
Levetiracetam
IntroductionLevetiracetam is an antiepileptic whose mechanism of action is not well understood. It is used in the treatment of
partial onset, myoclonic, and primary generalized tonic-clonic seizures.
Monitoring Indications and Strategies
Route of Administration Patient Population Monitoring SchemeOral• Immediate release tablet• Extended release tablet• Solution• Intravenous
• Monitor trough concentrations at steady state after initiation of therapy (1-2 days)
• After changes in dose• Therapeutic failure• Assessment of compliance when possible• Emergency room visit for status epilepticus to evaluate
adherence• Unprovoked, persistent seizure recurrence to evaluate
adherence
• Trough concentration• Random concentrations
may be useful in determining compliance or in acute situations
Drug Concentrations
Therapeutic Although therapeutic ranges are reported (12-46 mg/L), levels do not correlate with clinical efficacy and are only recommended to evaluate medication adherence.
Toxic Not well establishedCommon signs or symptoms of toxic concentrations
Aggression, agitation, altered level of consciousness, drowsiness, respiratory depression
Suggestions on Dose Modification
There is not a strong association with levetiracetam concentrations and clinical efficacy. Plasma concentrations change linearly with changes in dose.
Factors affecting Drug Concentration and DispositionAbsorption
Formulation Percent Absorbed Time to Peak ConcentrationOral Rapidly and completely absorbed,
100% bioavailable.1 hour (immediate release), 4 hours (extended release)
Distribution
Overview Volume of distribution is similar to body water.
Protein binding Not extensive, < 10% protein binding.
Age dependent changes Distribution may change with age dependent changes in body water composition.
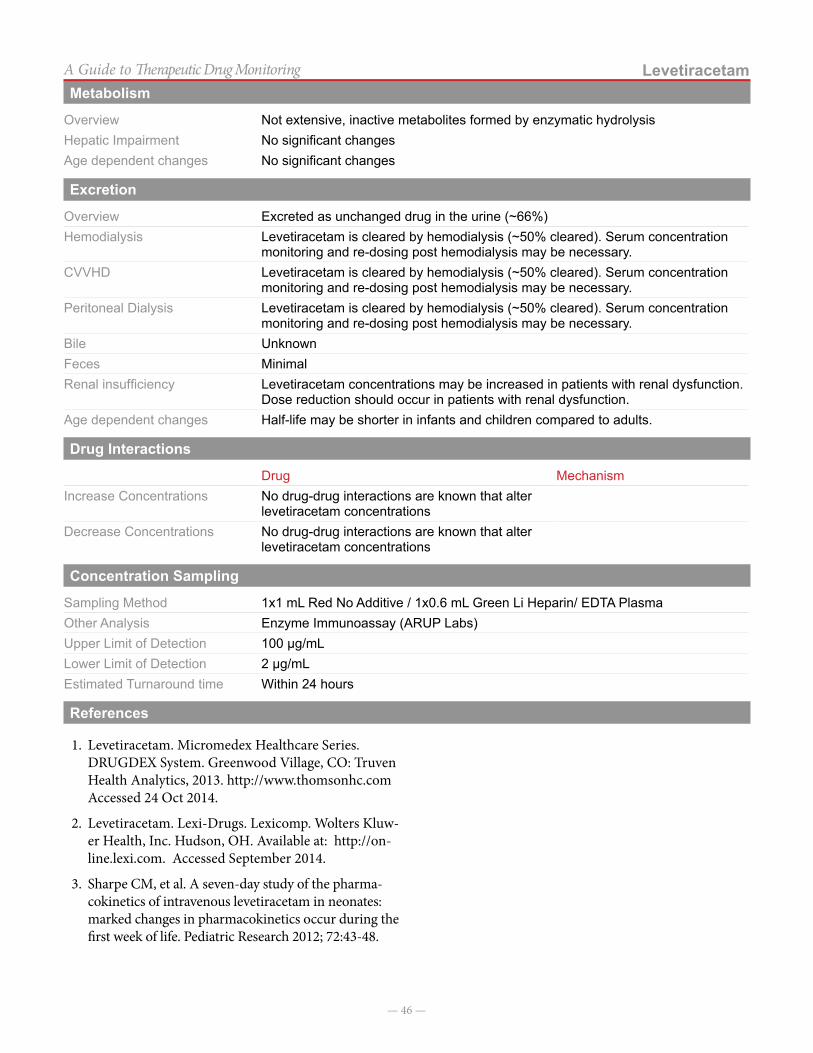
— 46 —
LevetiracetamA Guide to Therapeutic Drug MonitoringMetabolism
Overview Not extensive, inactive metabolites formed by enzymatic hydrolysisHepatic Impairment No significant changesAge dependent changes No significant changes
Excretion
Overview Excreted as unchanged drug in the urine (~66%)Hemodialysis Levetiracetam is cleared by hemodialysis (~50% cleared). Serum concentration
monitoring and re-dosing post hemodialysis may be necessary. CVVHD Levetiracetam is cleared by hemodialysis (~50% cleared). Serum concentration
monitoring and re-dosing post hemodialysis may be necessary. Peritoneal Dialysis Levetiracetam is cleared by hemodialysis (~50% cleared). Serum concentration
monitoring and re-dosing post hemodialysis may be necessary. Bile UnknownFeces Minimal Renal insufficiency Levetiracetam concentrations may be increased in patients with renal dysfunction.
Dose reduction should occur in patients with renal dysfunction. Age dependent changes Half-life may be shorter in infants and children compared to adults.
Drug Interactions
Drug MechanismIncrease Concentrations No drug-drug interactions are known that alter
levetiracetam concentrationsDecrease Concentrations No drug-drug interactions are known that alter
levetiracetam concentrations
Concentration Sampling
Sampling Method 1x1 mL Red No Additive / 1x0.6 mL Green Li Heparin/ EDTA PlasmaOther Analysis Enzyme Immunoassay (ARUP Labs)Upper Limit of Detection 100 µg/mLLower Limit of Detection 2 µg/mLEstimated Turnaround time Within 24 hours
References
1. Levetiracetam. Micromedex Healthcare Series. DRUGDEX System. Greenwood Village, CO: Truven Health Analytics, 2013. http://www.thomsonhc.com Accessed 24 Oct 2014.
2. Levetiracetam. Lexi-Drugs. Lexicomp. Wolters Kluw-er Health, Inc. Hudson, OH. Available at: http://on-line.lexi.com. Accessed September 2014.
3. Sharpe CM, et al. A seven-day study of the pharma-cokinetics of intravenous levetiracetam in neonates: marked changes in pharmacokinetics occur during the first week of life. Pediatric Research 2012; 72:43-48.

— 47 —
A Guide to Therapeutic Drug Monitoring
Lidocaine
IntroductionLidocaine is commonly used as a local anesthetic, but is also effective at controlling ventricular arrhythmia and ventric-ular fibrillation in children and adults.
Monitoring Indications and Strategies
Route of Administration Patient Population Monitoring SchemeIntravenous (Continuous Infusion)
All patients receiving continuous infusion lidocaine
Concentration drawn every 12 hours until stable, then every 24 hours
Drug Concentrations
Therapeutic 1.5-5 µg/mLToxic Not Established Common signs or symptoms of toxic concentrations
Arrhythmias, bradycardia, dizziness, vomiting, numbness
Suggestions on Dose Modification
Lidocaine < 1.5 mg/L or undetectable Increase intravenous infusion dose by 10-20%
1.5–5 mg/L No change in dosage
> 6 mg/L Hold dose and/or decrease dose by 10-20%
*Patient clinical condition, goals of therapy, and practitioner experience should dictate adjustment of dose in response to serum concentrations.
Factors affecting Drug Concentration and DispositionAbsorption
Formulation Percent Absorbed Time to Peak ConcentrationIntravenous 100% Onset in 45-90 seconds
Distribution
Overview Volume of distribution is variable. Vd is decreased in patients with heart failure or hepatic disease.
Protein binding ~60-80% protein bound to alpha-1 acid glycoproteinAge dependent changes No age dependent changes in volume of distribution have been noted.
Metabolism
Overview Extensively metabolized in the liver to a few inactive metabolites. Cigarette smoking can induce enzyme metabolism of mexiletine.
Hepatic Impairment Concentrations may be elevated and half-life increased in patients with severe hepatic impairment.
Age dependent changes No age dependent changes in metabolism have been noted.
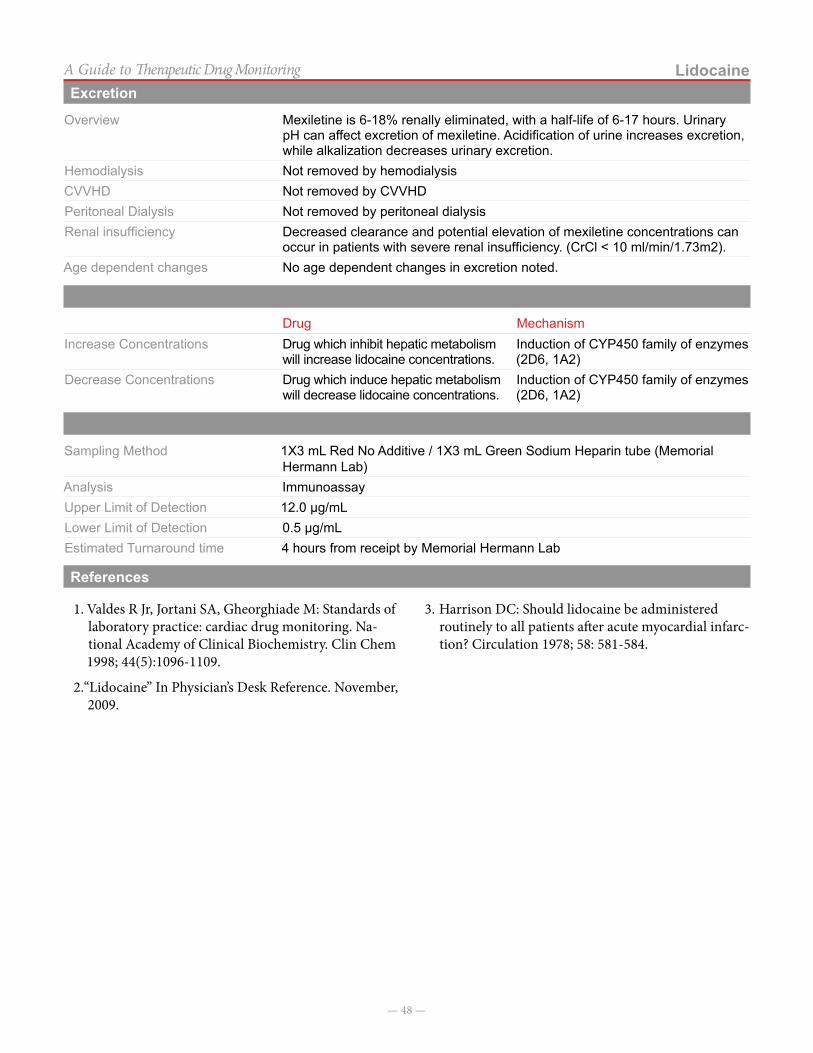
— 48 —
LidocaineA Guide to Therapeutic Drug MonitoringExcretion
Overview Mexiletine is 6-18% renally eliminated, with a half-life of 6-17 hours. Urinary pH can affect excretion of mexiletine. Acidification of urine increases excretion, while alkalization decreases urinary excretion.
Hemodialysis Not removed by hemodialysisCVVHD Not removed by CVVHDPeritoneal Dialysis Not removed by peritoneal dialysisRenal insufficiency Decreased clearance and potential elevation of mexiletine concentrations can
occur in patients with severe renal insufficiency. (CrCl < 10 ml/min/1.73m2).Age dependent changes No age dependent changes in excretion noted.
Drug Interactions
Drug MechanismIncrease Concentrations Drug which inhibit hepatic metabolism
will increase lidocaine concentrations.Induction of CYP450 family of enzymes (2D6, 1A2)
Decrease Concentrations Drug which induce hepatic metabolism will decrease lidocaine concentrations.
Induction of CYP450 family of enzymes (2D6, 1A2)
Concentration Sampling
Sampling Method 1X3 mL Red No Additive / 1X3 mL Green Sodium Heparin tube (Memorial Hermann Lab)
Analysis ImmunoassayUpper Limit of Detection 12.0 µg/mLLower Limit of Detection 0.5 µg/mLEstimated Turnaround time 4 hours from receipt by Memorial Hermann Lab
References
1. Valdes R Jr, Jortani SA, Gheorghiade M: Standards of laboratory practice: cardiac drug monitoring. Na-tional Academy of Clinical Biochemistry. Clin Chem 1998; 44(5):1096-1109.
2. “Lidocaine” In Physician’s Desk Reference. November, 2009.
3. Harrison DC: Should lidocaine be administered routinely to all patients after acute myocardial infarc-tion? Circulation 1978; 58: 581-584.
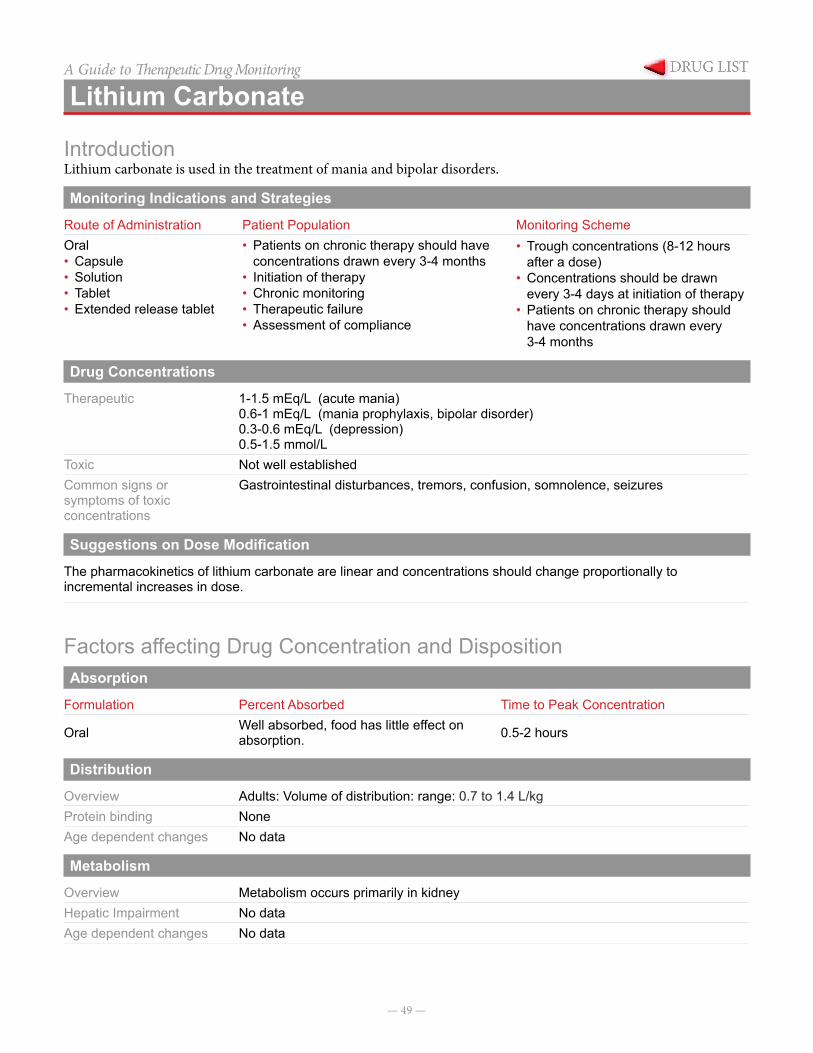
— 49 —
A Guide to Therapeutic Drug Monitoring
Lithium Carbonate
IntroductionLithium carbonate is used in the treatment of mania and bipolar disorders.
Monitoring Indications and Strategies
Route of Administration Patient Population Monitoring SchemeOral• Capsule• Solution• Tablet• Extended release tablet
• Patients on chronic therapy should have concentrations drawn every 3-4 months
• Initiation of therapy • Chronic monitoring• Therapeutic failure• Assessment of compliance
• Trough concentrations (8-12 hours after a dose)
• Concentrations should be drawn every 3-4 days at initiation of therapy
• Patients on chronic therapy should have concentrations drawn every 3-4 months
Drug Concentrations
Therapeutic 1-1.5 mEq/L (acute mania)0.6-1 mEq/L (mania prophylaxis, bipolar disorder)0.3-0.6 mEq/L (depression)0.5-1.5 mmol/L
Toxic Not well established Common signs or symptoms of toxic concentrations
Gastrointestinal disturbances, tremors, confusion, somnolence, seizures
Suggestions on Dose Modification
The pharmacokinetics of lithium carbonate are linear and concentrations should change proportionally to incremental increases in dose.
Factors affecting Drug Concentration and DispositionAbsorption
Formulation Percent Absorbed Time to Peak Concentration
Oral Well absorbed, food has little effect on absorption. 0.5-2 hours
Distribution
Overview Adults: Volume of distribution: range: 0.7 to 1.4 L/kgProtein binding NoneAge dependent changes No data
Metabolism
Overview Metabolism occurs primarily in kidneyHepatic Impairment No dataAge dependent changes No data
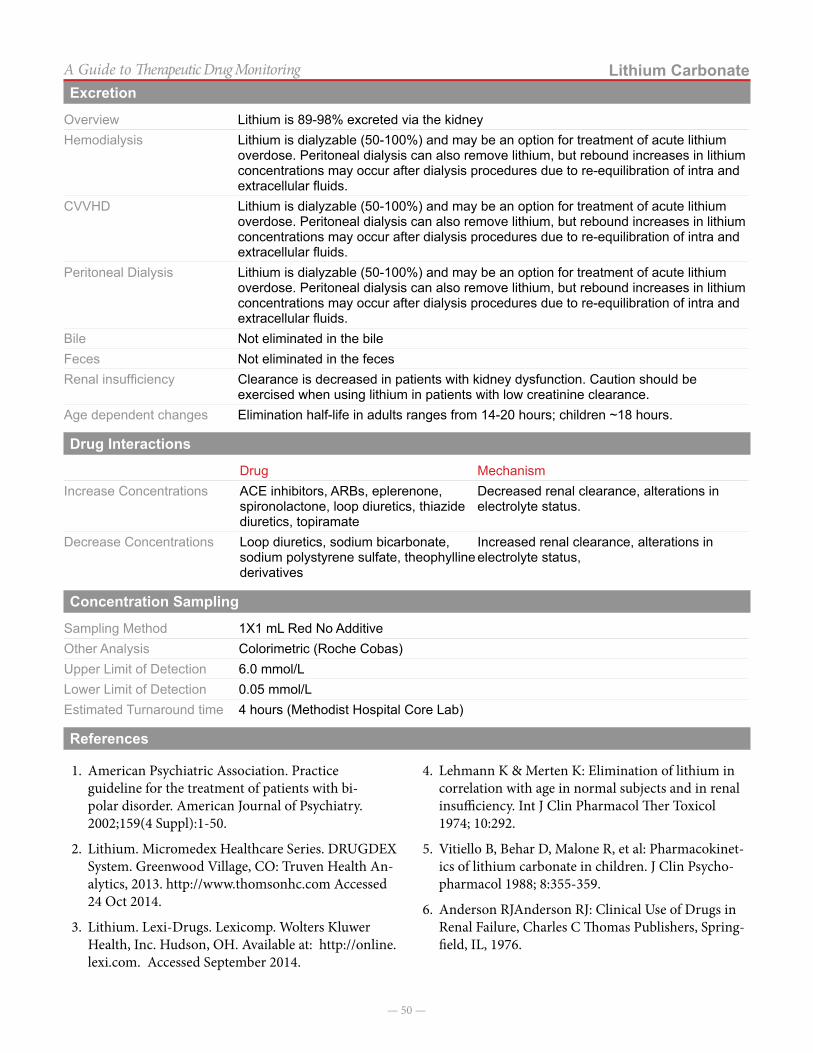
— 50 —
Lithium CarbonateA Guide to Therapeutic Drug MonitoringExcretion
Overview Lithium is 89-98% excreted via the kidneyHemodialysis Lithium is dialyzable (50-100%) and may be an option for treatment of acute lithium
overdose. Peritoneal dialysis can also remove lithium, but rebound increases in lithium concentrations may occur after dialysis procedures due to re-equilibration of intra and extracellular fluids.
CVVHD Lithium is dialyzable (50-100%) and may be an option for treatment of acute lithium overdose. Peritoneal dialysis can also remove lithium, but rebound increases in lithium concentrations may occur after dialysis procedures due to re-equilibration of intra and extracellular fluids.
Peritoneal Dialysis Lithium is dialyzable (50-100%) and may be an option for treatment of acute lithium overdose. Peritoneal dialysis can also remove lithium, but rebound increases in lithium concentrations may occur after dialysis procedures due to re-equilibration of intra and extracellular fluids.
Bile Not eliminated in the bileFeces Not eliminated in the fecesRenal insufficiency Clearance is decreased in patients with kidney dysfunction. Caution should be
exercised when using lithium in patients with low creatinine clearance.Age dependent changes Elimination half-life in adults ranges from 14-20 hours; children ~18 hours.
Drug Interactions
Drug MechanismIncrease Concentrations ACE inhibitors, ARBs, eplerenone,
spironolactone, loop diuretics, thiazide diuretics, topiramate
Decreased renal clearance, alterations in electrolyte status.
Decrease Concentrations Loop diuretics, sodium bicarbonate, sodium polystyrene sulfate, theophylline derivatives
Increased renal clearance, alterations in electrolyte status,
Concentration Sampling
Sampling Method 1X1 mL Red No AdditiveOther Analysis Colorimetric (Roche Cobas)Upper Limit of Detection 6.0 mmol/LLower Limit of Detection 0.05 mmol/LEstimated Turnaround time 4 hours (Methodist Hospital Core Lab)
References
1. American Psychiatric Association. Practice guideline for the treatment of patients with bi-polar disorder. American Journal of Psychiatry. 2002;159(4 Suppl):1-50.
2. Lithium. Micromedex Healthcare Series. DRUGDEX System. Greenwood Village, CO: Truven Health An-alytics, 2013. http://www.thomsonhc.com Accessed 24 Oct 2014.
3. Lithium. Lexi-Drugs. Lexicomp. Wolters Kluwer Health, Inc. Hudson, OH. Available at: http://online.lexi.com. Accessed September 2014.
4. Lehmann K & Merten K: Elimination of lithium in correlation with age in normal subjects and in renal insufficiency. Int J Clin Pharmacol Ther Toxicol 1974; 10:292.
5. Vitiello B, Behar D, Malone R, et al: Pharmacokinet-ics of lithium carbonate in children. J Clin Psycho-pharmacol 1988; 8:355-359.
6. Anderson RJAnderson RJ: Clinical Use of Drugs in Renal Failure, Charles C Thomas Publishers, Spring-field, IL, 1976.
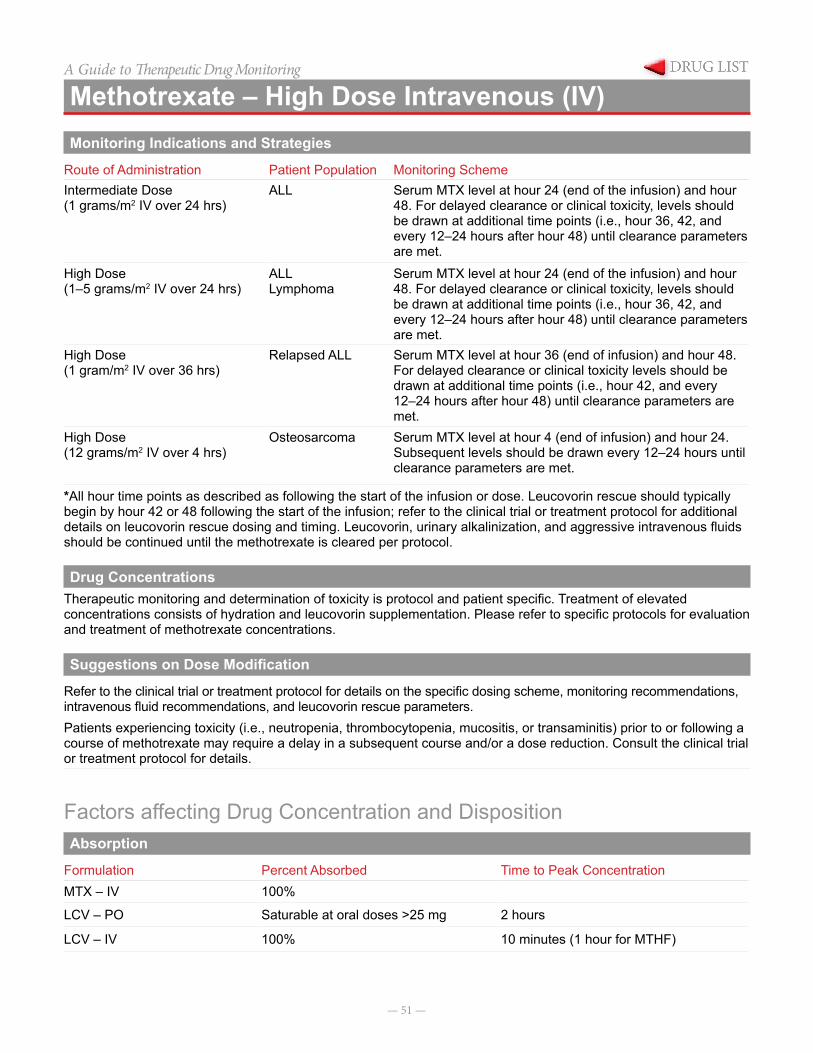
— 51 —
A Guide to Therapeutic Drug Monitoring
Methotrexate – High Dose Intravenous (IV)Monitoring Indications and Strategies
Route of Administration Patient Population Monitoring SchemeIntermediate Dose(1 grams/m2 IV over 24 hrs)
ALL Serum MTX level at hour 24 (end of the infusion) and hour 48. For delayed clearance or clinical toxicity, levels should be drawn at additional time points (i.e., hour 36, 42, and every 12–24 hours after hour 48) until clearance parameters are met.
High Dose(1–5 grams/m2 IV over 24 hrs)
ALLLymphoma
Serum MTX level at hour 24 (end of the infusion) and hour 48. For delayed clearance or clinical toxicity, levels should be drawn at additional time points (i.e., hour 36, 42, and every 12–24 hours after hour 48) until clearance parameters are met.
High Dose(1 gram/m2 IV over 36 hrs)
Relapsed ALL Serum MTX level at hour 36 (end of infusion) and hour 48. For delayed clearance or clinical toxicity levels should be drawn at additional time points (i.e., hour 42, and every 12–24 hours after hour 48) until clearance parameters are met.
High Dose(12 grams/m2 IV over 4 hrs)
Osteosarcoma Serum MTX level at hour 4 (end of infusion) and hour 24. Subsequent levels should be drawn every 12–24 hours until clearance parameters are met.
*All hour time points as described as following the start of the infusion or dose. Leucovorin rescue should typically begin by hour 42 or 48 following the start of the infusion; refer to the clinical trial or treatment protocol for additional details on leucovorin rescue dosing and timing. Leucovorin, urinary alkalinization, and aggressive intravenous fluids should be continued until the methotrexate is cleared per protocol.
Drug ConcentrationsTherapeutic monitoring and determination of toxicity is protocol and patient specific. Treatment of elevated concentrations consists of hydration and leucovorin supplementation. Please refer to specific protocols for evaluation and treatment of methotrexate concentrations.
Suggestions on Dose Modification
Refer to the clinical trial or treatment protocol for details on the specific dosing scheme, monitoring recommendations, intravenous fluid recommendations, and leucovorin rescue parameters.Patients experiencing toxicity (i.e., neutropenia, thrombocytopenia, mucositis, or transaminitis) prior to or following a course of methotrexate may require a delay in a subsequent course and/or a dose reduction. Consult the clinical trial or treatment protocol for details.
Factors affecting Drug Concentration and DispositionAbsorption
Formulation Percent Absorbed Time to Peak ConcentrationMTX – IV 100%
LCV – PO Saturable at oral doses >25 mg 2 hours
LCV – IV 100% 10 minutes (1 hour for MTHF)
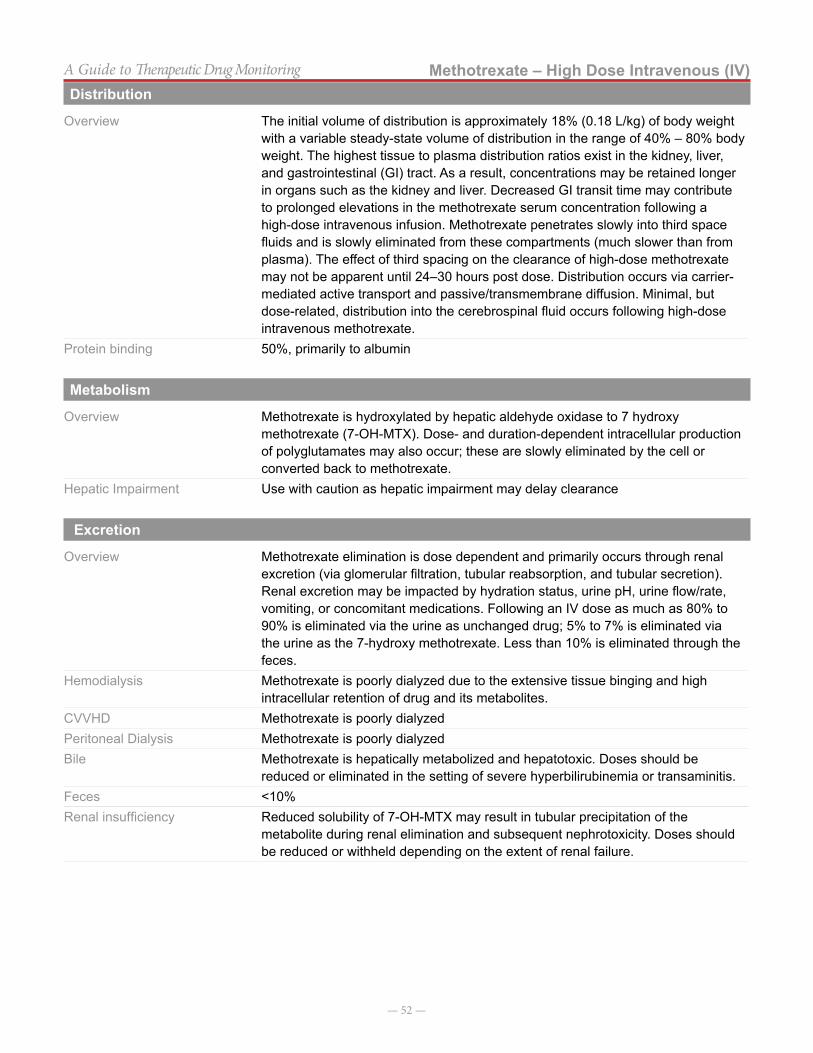
— 52 —
Methotrexate – High Dose Intravenous (IV)A Guide to Therapeutic Drug MonitoringDistribution
Overview The initial volume of distribution is approximately 18% (0.18 L/kg) of body weight with a variable steady-state volume of distribution in the range of 40% – 80% body weight. The highest tissue to plasma distribution ratios exist in the kidney, liver, and gastrointestinal (GI) tract. As a result, concentrations may be retained longer in organs such as the kidney and liver. Decreased GI transit time may contribute to prolonged elevations in the methotrexate serum concentration following a high-dose intravenous infusion. Methotrexate penetrates slowly into third space fluids and is slowly eliminated from these compartments (much slower than from plasma). The effect of third spacing on the clearance of high-dose methotrexate may not be apparent until 24–30 hours post dose. Distribution occurs via carrier-mediated active transport and passive/transmembrane diffusion. Minimal, but dose-related, distribution into the cerebrospinal fluid occurs following high-dose intravenous methotrexate.
Protein binding 50%, primarily to albumin
Metabolism
Overview Methotrexate is hydroxylated by hepatic aldehyde oxidase to 7 hydroxy methotrexate (7-OH-MTX). Dose- and duration-dependent intracellular production of polyglutamates may also occur; these are slowly eliminated by the cell or converted back to methotrexate.
Hepatic Impairment Use with caution as hepatic impairment may delay clearance
Excretion
Overview Methotrexate elimination is dose dependent and primarily occurs through renal excretion (via glomerular filtration, tubular reabsorption, and tubular secretion). Renal excretion may be impacted by hydration status, urine pH, urine flow/rate, vomiting, or concomitant medications. Following an IV dose as much as 80% to 90% is eliminated via the urine as unchanged drug; 5% to 7% is eliminated via the urine as the 7-hydroxy methotrexate. Less than 10% is eliminated through the feces.
Hemodialysis Methotrexate is poorly dialyzed due to the extensive tissue binging and high intracellular retention of drug and its metabolites.
CVVHD Methotrexate is poorly dialyzedPeritoneal Dialysis Methotrexate is poorly dialyzedBile Methotrexate is hepatically metabolized and hepatotoxic. Doses should be
reduced or eliminated in the setting of severe hyperbilirubinemia or transaminitis. Feces <10% Renal insufficiency Reduced solubility of 7-OH-MTX may result in tubular precipitation of the
metabolite during renal elimination and subsequent nephrotoxicity. Doses should be reduced or withheld depending on the extent of renal failure.

— 53 —
Methotrexate – High Dose Intravenous (IV)A Guide to Therapeutic Drug MonitoringDrug Interactions
Drug MechanismIncrease Concentrations
NSAIDs Reduction in renal elimination of methotrexate by inhibiting renal transport proteins
Penicillins Competition for renal transport sites and renal elimination Probenecid Inhibition of MTX renal tubular secretionProton Pump Inhibitors Potentially via PPI-mediated inhibition of protein
transporters. May also be related to a reduction in active secretion in the distal tubules of the kidney as a result of PPI inhibition of hydrogen ion secretion at the H+/K+ ATPase pump in the tubules
Sulfas (ex. TMP/SMX) Increased free/unbound methotrexate level, decreases renal elimination of methotrexate, increases folate deficiency through similar mechanism of action
Vitamin C Acidification of the urine resulting in precipitation of methotrexate in the kidney
IV contrast media, aminoglycosides, amphotericin B, others
Concomitant nephrotoxicity
Decrease Concentrations
Unknown NA
Concentration Sampling
Sampling Method 1X0.6 mL Green Li Heparin/ 1X1 mL Red No AdditiveOther Analysis Fluorescence Polarization Immunoassay (FPIA)Upper Limit of Detection 1000 µmol/LLower Limit of Detection 0.01 µmol/LEstimated Turnaround time Same day
Notes on ConcentrationsSerum concentrations of methotrexate should be monitored closely according to the clinical trial or treatment plan. All “hour” time periods for sampling should be considered from time point zero being defined as the start of the infusion (or bolus prior to the infusion, if there is one). For 4-hour high-dose infusions, serum sampling is typically performed at hour 4, hour 24, and every 12 to 24 hours thereafter until clearance parameters are met. For a 24 or 36 hour infusion, serum sampling typically occurs at hours 24, 42, 48, and every 12–24 hours thereafter until clearance parameters are met. For select patients receiving a 24 hour infusion, an
early targeted approach may include serum sampling at hours 2, 6, or 8 with infusion rate changes based on serum concentrations. Refer to the clinical trial or treatment plan for additional details. Leucovorin rescue must always be given to patients receiving high-dose intravenous methotrexate. In some cases, modifications in leucovorin rescue, intravenous fluids, urinary alkalinization (e.g., sodium bicarbonate) may be required to facilitate elimination of methotrexate. In cases of extremely delayed clearance, glucarpidase may be required.
References
1. Methotrexate. LexiComp® Online. Hudson, Ohio. Copyright 1978–2014,
2. Crom WR, Evans WE (1992). Methotrexate. In (Eds.), Evans WE, Schentag JJ, Jusko WJ, Applied Pharmacokinetics: Principles of Therapeutic Drug Monitoring. Pages 29-1 – 29-42. Vancouver, WA: Applied Therapeutics, Inc.
3. Wall AM, Gajjar A, Link A, et al. Individualized metho-trexate dosing in children with relapsed acute lympho-blastic leukemia. Leukemia 2000; 14(2):221-5.
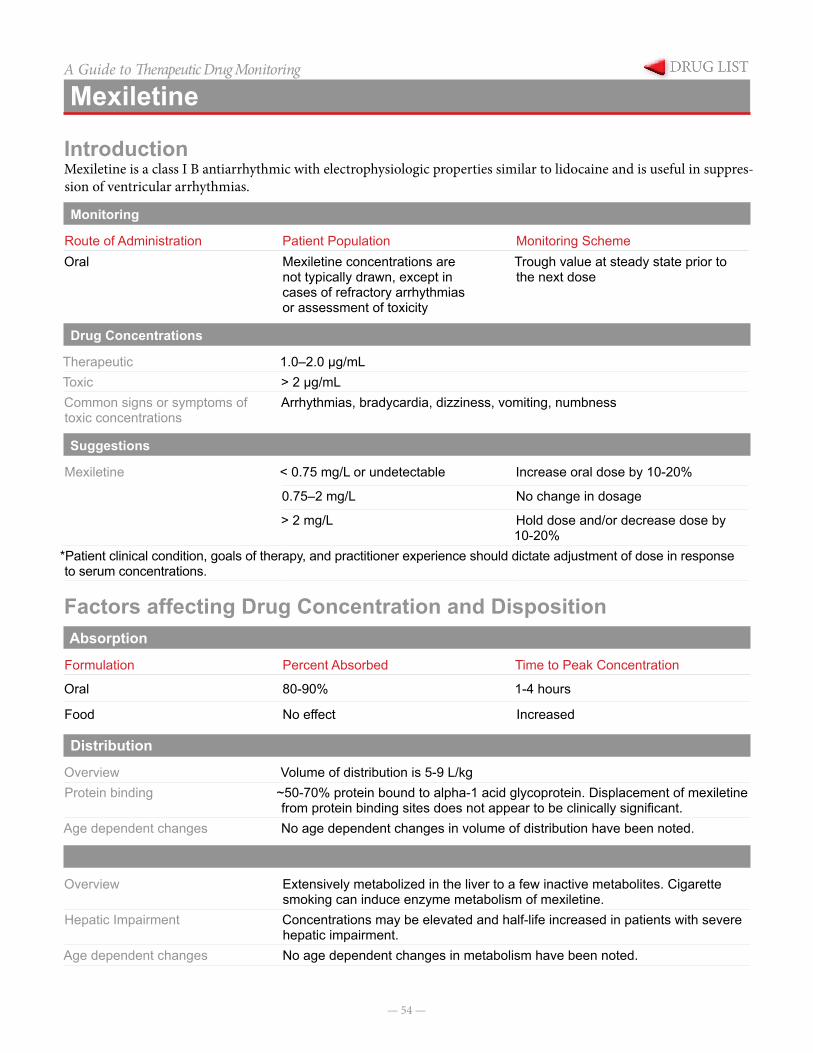
— 54 —
A Guide to Therapeutic Drug Monitoring
Mexiletine
IntroductionMexiletine is a class I B antiarrhythmic with electrophysiologic properties similar to lidocaine and is useful in suppres-sion of ventricular arrhythmias.
Monitoring Indications and Strategies
Route of Administration Patient Population Monitoring SchemeOral Mexiletine concentrations are
not typically drawn, except in cases of refractory arrhythmias or assessment of toxicity
Trough value at steady state prior to the next dose
Drug Concentrations
Therapeutic 1.0–2.0 µg/mL Toxic > 2 µg/mL Common signs or symptoms of toxic concentrations
Arrhythmias, bradycardia, dizziness, vomiting, numbness
Suggestions on Dose Modification
Mexiletine < 0.75 mg/L or undetectable Increase oral dose by 10-20%
0.75–2 mg/L No change in dosage
> 2 mg/L Hold dose and/or decrease dose by 10-20%
*Patient clinical condition, goals of therapy, and practitioner experience should dictate adjustment of dose in response to serum concentrations.
Factors affecting Drug Concentration and DispositionAbsorption
Formulation Percent Absorbed Time to Peak Concentration
Oral 80-90% 1-4 hours
Food No effect Increased
Distribution
Overview Volume of distribution is 5-9 L/kgProtein binding ~50-70% protein bound to alpha-1 acid glycoprotein. Displacement of mexiletine
from protein binding sites does not appear to be clinically significant.Age dependent changes No age dependent changes in volume of distribution have been noted.
Metabolism
Overview Extensively metabolized in the liver to a few inactive metabolites. Cigarette smoking can induce enzyme metabolism of mexiletine.
Hepatic Impairment Concentrations may be elevated and half-life increased in patients with severe hepatic impairment.
Age dependent changes No age dependent changes in metabolism have been noted.
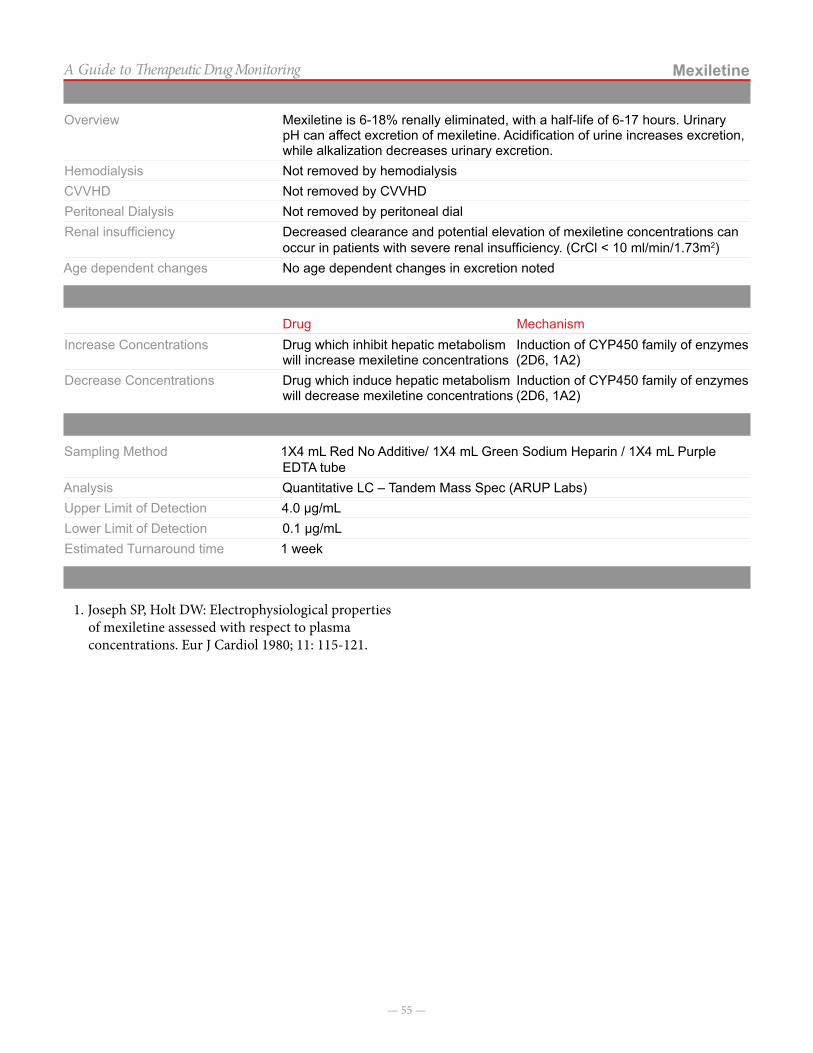
— 55 —
MexiletineA Guide to Therapeutic Drug MonitoringExcretion
Overview Mexiletine is 6-18% renally eliminated, with a half-life of 6-17 hours. Urinary pH can affect excretion of mexiletine. Acidification of urine increases excretion, while alkalization decreases urinary excretion.
Hemodialysis Not removed by hemodialysisCVVHD Not removed by CVVHDPeritoneal Dialysis Not removed by peritoneal dialRenal insufficiency Decreased clearance and potential elevation of mexiletine concentrations can
occur in patients with severe renal insufficiency. (CrCl < 10 ml/min/1.73m2)Age dependent changes No age dependent changes in excretion noted
Drug Interactions
Drug MechanismIncrease Concentrations Drug which inhibit hepatic metabolism
will increase mexiletine concentrationsInduction of CYP450 family of enzymes (2D6, 1A2)
Decrease Concentrations Drug which induce hepatic metabolism will decrease mexiletine concentrations
Induction of CYP450 family of enzymes (2D6, 1A2)
Concentration Sampling
Sampling Method 1X4 mL Red No Additive/ 1X4 mL Green Sodium Heparin / 1X4 mL Purple EDTA tube
Analysis Quantitative LC – Tandem Mass Spec (ARUP Labs)Upper Limit of Detection 4.0 µg/mLLower Limit of Detection 0.1 µg/mLEstimated Turnaround time 1 week
References
1. Joseph SP, Holt DW: Electrophysiological properties of mexiletine assessed with respect to plasma concentrations. Eur J Cardiol 1980; 11: 115-121.
— 56 —
A Guide to Therapeutic Drug Monitoring
Mycophenolate
IntroductionMycophenolate is an anti-metabolite immunosuppressant available in capsule, tablet, suspension, and injectable formulations. Two products are available: mycophenolate
mofetil (MMF) and enteric-coated mycophenolate sodium (MMS). Mycophenolate is monitored by sampling serum trough mycophenolic acid (MPA) concentrations.
Monitoring Indications and Strategies
Route of Administration Patient Population Monitoring SchemeOral/IV All Patients • Once at steady state (~3-4 days), obtain a MPA trough
level prior to next maintenance dose.• NOTE: Monitoring of trough levels is Service-specific;
discuss with medical team
Drug Concentrations
Therapeutic 1.0-3.5 mcg/mLToxic • Toxic level has not been clearly defined.
• Correlation of serum concentration and adverse effects has not been well established.
Suggestions on Dose Modification
Subtherapeutic Increases of 10-20% are generally acceptable. Serum concentrations will increase proportionally. Discuss all dosage adjustments with primary team.
Supratherapeutic Decreases of 10-20% are generally acceptable. Serum concentrations will typically decrease proportionally. For exceptionally high concentrations, doses may be held and restarted after a therapeutic concentration has been attained. Discuss all dosage adjustments with primary team.
Factors affecting Drug Concentration and DispositionAbsorption
Formulation Percent Absorbed Other NotesOral • Mycophenolate mofetil 94%
• Mycophenolate sodium 72%Rapid and nearly completeFood decreases maximum concentration by 40% following mycophenolate mofetil administration and 33% following enter-ic-coated mycophenolate sodium use; extent of absorption not changed. Recommended to be taken on an empty stomachAUC values for MPA lower in the early post-transplant period vs. later (>3 months) post-transplant period.
Intravenous 100% absorbed None
Distribution
Overview Volume of distribution range: 3.6 to 4 L/kgProtein binding MPA 97%-99% bound to albumin in patients with normal renal and liver function
Significant renal dysfunction, liver disease and hypoalbuminemia can alter serum albu-min binding, changing the fraction of free MPA available.Approximately, 99.99% of mycophenolic acid found in plasma, 0.01% in cellular elements
— 57 —
MycophenolateA Guide to Therapeutic Drug MonitoringMetabolism
Overview Mycophenolate is extensively metabolized in the liver to mycophenolic acid (MPA – active metabolite); enterohepatic recirculation (mycophenolate acid glucuronide (MPAG – inactive metabolite) to MPA) contributes approximately 40% (range 10-60%) to MPA exposure.
Renal Impairment In patients with severe renal impairment, accumulated MPAG appears to compete with free MPA for binding with albumin; thereby, increasing the serum concentration of free-fraction MPA
Excretion
Overview For mycophenolate mofetil, ~90% of the dose is eliminated in the urine (87% as MPAG) and about 6% is recovered in feces. Approximately 3% of unchanged MPA detected in urine following administration of mycophenolate sodium.
Hemodialysis No data providedCVVHD No data providedPeritoneal Dialysis No data providedBile No data providedFeces No data providedRenal insufficiency No data providedAge dependent changes No data provided
Drug Interactions
Drug MechanismIncrease Concentrations
Acyclovir/valacyclovirGanciclovir/valganciclovir
Competition for transporter-mediated elimination
Probenecid Interference with renal tubular secretion of mycophenolate metabolites
Decrease Concentrations
AntacidsCholestyramineMagnesium saltsSevelamer
Binding in the GI tract
Cyclosporine Cyclosporine-mediated inhibition of biliary excretion of MPAGAntibiotics with anaerobic coverage
Killing of glucuronidase-producing bacteria in the GI tract, thus interfering with bacteria-mediated metabolism of MPAG
Proton pump inhibitors Impaired absorption and/or hydrolysis in the lower acid environment
Rifamycin Derivatives Increased glucuronidation of MPA and increase biliary excretion of MPAG
Concentration Sampling
Sampling Method 1 X 2 mL purple EDTA tube or 1 X 2 mL Red No Additive tube (Sample drawn at Trough)Analysis ImmunoassayUpper Limit of Detection 10.0 µg/mLLower Limit of Detection 0.3 µg/mLTesting Frequency DailyEstimated Turnaround time Same day
References:1. Lexi-Comp Online™, Pediatric & Neonatal Lexi-Drugs
Online™, Hudson, Ohio: Lexi-Comp, Inc.; May 30, 2012.
2. Micromedex® Healthcare Series. n.d. Thomson Health-care, Greenwood Village, CO. May 30, 2012 <http://www.thomsonhc.com>.
3. Staatz CE, Tett SE. Clinical Pharmacokinetics and Phar-macodynamics of Mycophenolate in Solid Organ Trans-plant Recipients. Clin Pharmacokinet 2007; 46(1):13-58.
— 58 —
A Guide to Therapeutic Drug Monitoring
Oxcarbazepine
IntroductionOxcarbazepine (OXC) is the 10-keto analog of carbamaz-epine. It was approved in 2000 and has similar efficacy to carbamazepine with a less complex pharmacokinetic pro-file. It is used as monotherapy or adjunct therapy in partial seizures (Immediate release: FDA approved as monother-apy in ages ≥ 4 years and adults; FDA approved as adjunc-
tive therapy in ages ≥ 2 years and adults; Extended release: FDA approved in ages ≥6 years and adults for adjunctive therapy). It is extensively metabolized to the active 10, 11 monohydroxy metabolite (MHD) which is the measured metabolite. The mechanism of action is the blockade of voltage-gated sodium channels.
Monitoring Indications and Strategies
Route of Administration Patient Population Monitoring SchemeOral• Immediate release (tablet,
suspension)• Extended release
• Baseline level once seizure control attained• Emergency room visit for status epilepticus• Unprovoked, persistent seizure recurrence• Complaints of changes in vision, dizziness,
fatigue, or ataxia. Signs/symptoms of hyponatremia.
• Adding/removing medication that causes drug-drug interaction (see “drug interactions” below)
• Regular intervals during pregnancy
• Trough concentration when possible
• Random concentrations may be useful in determining compliance or in acute situations
Drug Concentrations
Therapeutic 15–35 µg/mLToxic > 35 µg/mL Common signs or symptoms of toxic concentrations
Nystagmus, Unsteady gait, other signs and symptoms of neurotoxicity
Suggestions on Dose Modification
No suggestions are available on appropriate dose modification. Doses should be increased slowly and gradually with expert guidance.
Factors affecting Drug Concentration and DispositionAbsorption
Formulation Percent Absorbed Time to Peak ConcentrationOral Rapidly and completely absorbed Oxcarbazepine 1 hour, MHD 3-4 hours
Distribution
Overview Widely distributed into the brain and lipid tissues. Volume of distribution of MHD in adults is 49 L.
Protein binding Oxcarbazepine: 50-70%; MHD: 35-50%, primarily to albuminAge dependent changes Neonates may have a lower degree of protein binding
— 59 —
OxcarbazepineA Guide to Therapeutic Drug MonitoringMetabolism
Overview Extensively and rapidly metabolized in the liver to active metabolites, 70% of serum concentrations appear as MHD, 2% as unchanged oxcarbazepine, and the rest as minor metabolites. Oxcarbazepine does not undergo autoinduction that is associated with carbamazepine.
Hepatic Impairment Use with caution, more extensive monitoring may be requiredAge dependent changes Half-life is highly variable and may change with age
Excretion
Overview Oxcarbazepine metabolites are excreted primarily in the urine (95%). Small amounts of carbamazepine are excreted unchanged in the urine.
Hemodialysis No data are available; oxcarbazepine should be used with cautionCVVHD No data are available; oxcarbazepine should be used with cautionPeritoneal Dialysis No data are available; oxcarbazepine should be used with cautio.Bile UnknownFeces A small amount of oxcarbazepine is excreted in the feces (~4%) Renal insufficiency No data are available; oxcarbazepine should be used with cautionAge dependent changes Clearance is greater in infants and children and decreasing with age until adult.
Drug Interactions
Drug MechanismIncrease Concentrations A large list of medications
may increase oxcarbazepine concentrations through enzyme inhibition
Cytochrome P450 Enzyme inhibition
Decrease Concentrations PhenytoinPhenobarbitalPrimidone
Cytochrome P450 Enzyme induction
OXC/MHD Increase Concentrations of… Phenytoin Cytochrome P450 Enzyme inhibition
OXC/MHD Decrease concentrations of…
Oral contraceptivesLamotrigineTopiramate
Cytochrome P450 Enzyme induction
Concentration Sampling
Sampling Method 1X1 mL Red No Additive/1X1 mL EDTA PlasmaOther Analysis HPLCUpper Limit of Detection 80 µg/mLLower Limit of Detection 0.1 µg/mLEstimated Turnaround time Done every Tuesday and Thursday at TCH Main Lab
ReferencesNone cited.
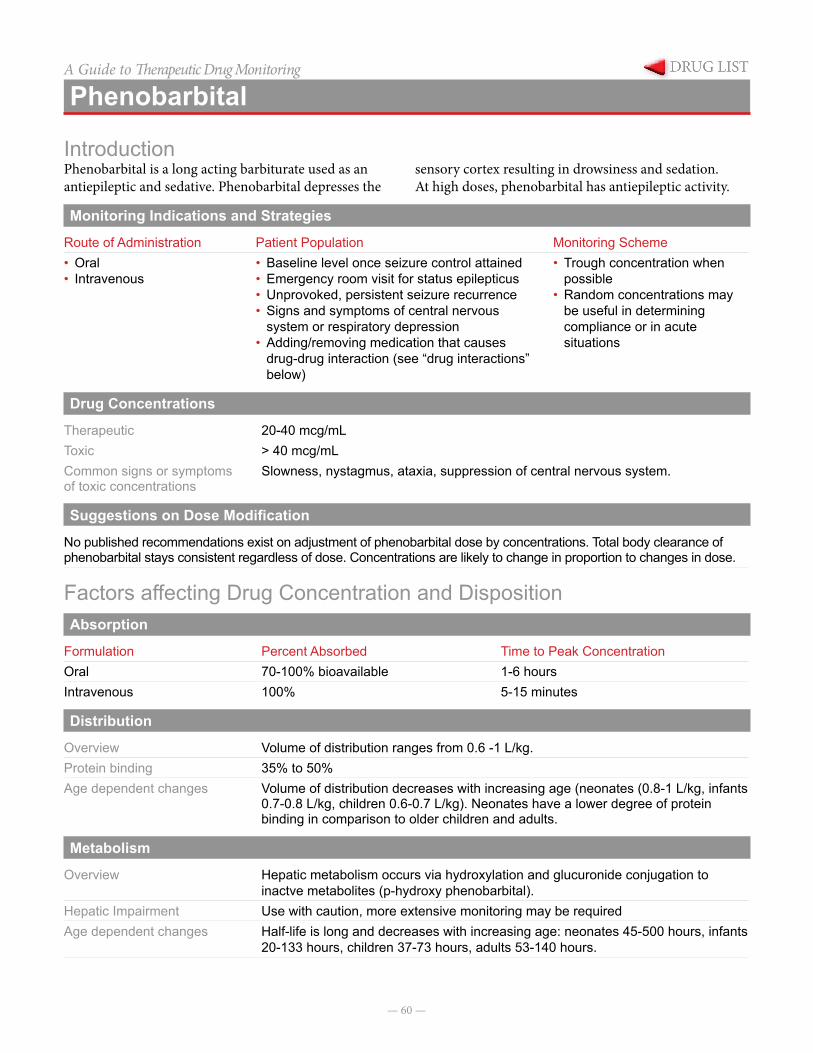
— 60 —
A Guide to Therapeutic Drug Monitoring
Phenobarbital
IntroductionPhenobarbital is a long acting barbiturate used as an antiepileptic and sedative. Phenobarbital depresses the
sensory cortex resulting in drowsiness and sedation. At high doses, phenobarbital has antiepileptic activity.
Monitoring Indications and Strategies
Route of Administration Patient Population Monitoring Scheme• Oral• Intravenous
• Baseline level once seizure control attained• Emergency room visit for status epilepticus• Unprovoked, persistent seizure recurrence• Signs and symptoms of central nervous
system or respiratory depression• Adding/removing medication that causes
drug-drug interaction (see “drug interactions” below)
• Trough concentration when possible
• Random concentrations may be useful in determining compliance or in acute situations
Drug Concentrations
Therapeutic 20-40 mcg/mLToxic > 40 mcg/mLCommon signs or symptoms of toxic concentrations
Slowness, nystagmus, ataxia, suppression of central nervous system.
Suggestions on Dose Modification
No published recommendations exist on adjustment of phenobarbital dose by concentrations. Total body clearance of phenobarbital stays consistent regardless of dose. Concentrations are likely to change in proportion to changes in dose.
Factors affecting Drug Concentration and DispositionAbsorption
Formulation Percent Absorbed Time to Peak ConcentrationOral 70-100% bioavailable 1-6 hoursIntravenous 100% 5-15 minutes
Distribution
Overview Volume of distribution ranges from 0.6 -1 L/kg.Protein binding 35% to 50%Age dependent changes Volume of distribution decreases with increasing age (neonates (0.8-1 L/kg, infants
0.7-0.8 L/kg, children 0.6-0.7 L/kg). Neonates have a lower degree of protein binding in comparison to older children and adults.
Metabolism
Overview Hepatic metabolism occurs via hydroxylation and glucuronide conjugation to inactve metabolites (p-hydroxy phenobarbital).
Hepatic Impairment Use with caution, more extensive monitoring may be requiredAge dependent changes Half-life is long and decreases with increasing age: neonates 45-500 hours, infants
20-133 hours, children 37-73 hours, adults 53-140 hours.
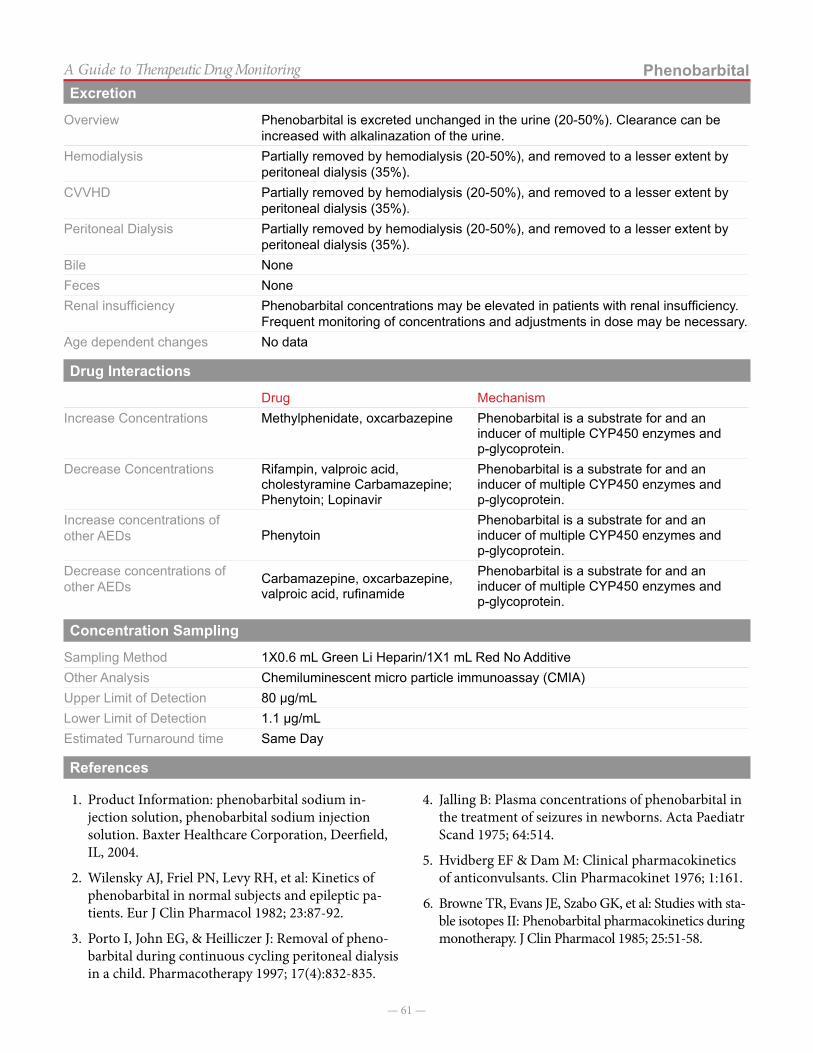
— 61 —
PhenobarbitalA Guide to Therapeutic Drug MonitoringExcretion
Overview Phenobarbital is excreted unchanged in the urine (20-50%). Clearance can be increased with alkalinazation of the urine.
Hemodialysis Partially removed by hemodialysis (20-50%), and removed to a lesser extent by peritoneal dialysis (35%).
CVVHD Partially removed by hemodialysis (20-50%), and removed to a lesser extent by peritoneal dialysis (35%).
Peritoneal Dialysis Partially removed by hemodialysis (20-50%), and removed to a lesser extent by peritoneal dialysis (35%).
Bile NoneFeces NoneRenal insufficiency Phenobarbital concentrations may be elevated in patients with renal insufficiency.
Frequent monitoring of concentrations and adjustments in dose may be necessary.Age dependent changes No data
Drug Interactions
Drug MechanismIncrease Concentrations Methylphenidate, oxcarbazepine Phenobarbital is a substrate for and an
inducer of multiple CYP450 enzymes and p-glycoprotein.
Decrease Concentrations Rifampin, valproic acid, cholestyramine Carbamazepine; Phenytoin; Lopinavir
Phenobarbital is a substrate for and an inducer of multiple CYP450 enzymes and p-glycoprotein.
Increase concentrations of other AEDs Phenytoin
Phenobarbital is a substrate for and an inducer of multiple CYP450 enzymes and p-glycoprotein.
Decrease concentrations of other AEDs Carbamazepine, oxcarbazepine,
valproic acid, rufinamide
Phenobarbital is a substrate for and an inducer of multiple CYP450 enzymes and p-glycoprotein.
Concentration Sampling
Sampling Method 1X0.6 mL Green Li Heparin/1X1 mL Red No AdditiveOther Analysis Chemiluminescent micro particle immunoassay (CMIA)Upper Limit of Detection 80 µg/mLLower Limit of Detection 1.1 µg/mLEstimated Turnaround time Same Day
References
1. Product Information: phenobarbital sodium in-jection solution, phenobarbital sodium injection solution. Baxter Healthcare Corporation, Deerfield, IL, 2004.
2. Wilensky AJ, Friel PN, Levy RH, et al: Kinetics of phenobarbital in normal subjects and epileptic pa-tients. Eur J Clin Pharmacol 1982; 23:87-92.
3. Porto I, John EG, & Heilliczer J: Removal of pheno-barbital during continuous cycling peritoneal dialysis in a child. Pharmacotherapy 1997; 17(4):832-835.
4. Jalling B: Plasma concentrations of phenobarbital in the treatment of seizures in newborns. Acta Paediatr Scand 1975; 64:514.
5. Hvidberg EF & Dam M: Clinical pharmacokinetics of anticonvulsants. Clin Pharmacokinet 1976; 1:161.
6. Browne TR, Evans JE, Szabo GK, et al: Studies with sta-ble isotopes II: Phenobarbital pharmacokinetics during monotherapy. J Clin Pharmacol 1985; 25:51-58.
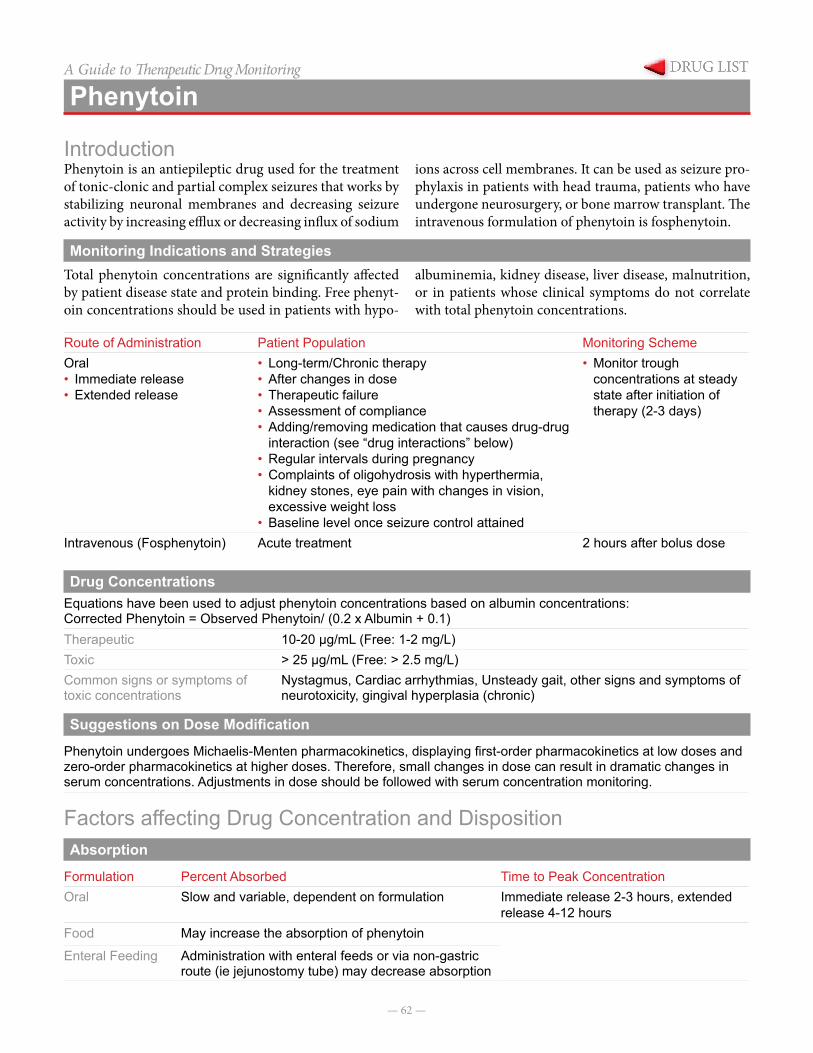
— 62 —
A Guide to Therapeutic Drug Monitoring
Phenytoin
IntroductionPhenytoin is an antiepileptic drug used for the treatment of tonic-clonic and partial complex seizures that works by stabilizing neuronal membranes and decreasing seizure activity by increasing efflux or decreasing influx of sodium
ions across cell membranes. It can be used as seizure pro-phylaxis in patients with head trauma, patients who have undergone neurosurgery, or bone marrow transplant. The intravenous formulation of phenytoin is fosphenytoin.
Monitoring Indications and StrategiesTotal phenytoin concentrations are significantly affected by patient disease state and protein binding. Free phenyt-oin concentrations should be used in patients with hypo-
albuminemia, kidney disease, liver disease, malnutrition, or in patients whose clinical symptoms do not correlate with total phenytoin concentrations.
Route of Administration Patient Population Monitoring SchemeOral• Immediate release• Extended release
• Long-term/Chronic therapy• After changes in dose• Therapeutic failure• Assessment of compliance• Adding/removing medication that causes drug-drug
interaction (see “drug interactions” below)• Regular intervals during pregnancy• Complaints of oligohydrosis with hyperthermia,
kidney stones, eye pain with changes in vision, excessive weight loss
• Baseline level once seizure control attained
• Monitor trough concentrations at steady state after initiation of therapy (2-3 days)
Intravenous (Fosphenytoin) Acute treatment 2 hours after bolus dose
Drug ConcentrationsEquations have been used to adjust phenytoin concentrations based on albumin concentrations:Corrected Phenytoin = Observed Phenytoin/ (0.2 x Albumin + 0.1)Therapeutic 10-20 µg/mL (Free: 1-2 mg/L)Toxic > 25 µg/mL (Free: > 2.5 mg/L)Common signs or symptoms of toxic concentrations
Nystagmus, Cardiac arrhythmias, Unsteady gait, other signs and symptoms of neurotoxicity, gingival hyperplasia (chronic)
Suggestions on Dose Modification
Phenytoin undergoes Michaelis-Menten pharmacokinetics, displaying first-order pharmacokinetics at low doses and zero-order pharmacokinetics at higher doses. Therefore, small changes in dose can result in dramatic changes in serum concentrations. Adjustments in dose should be followed with serum concentration monitoring.
Factors affecting Drug Concentration and DispositionAbsorption
Formulation Percent Absorbed Time to Peak ConcentrationOral Slow and variable, dependent on formulation Immediate release 2-3 hours, extended
release 4-12 hoursFood May increase the absorption of phenytoin
Enteral Feeding Administration with enteral feeds or via non-gastric route (ie jejunostomy tube) may decrease absorption
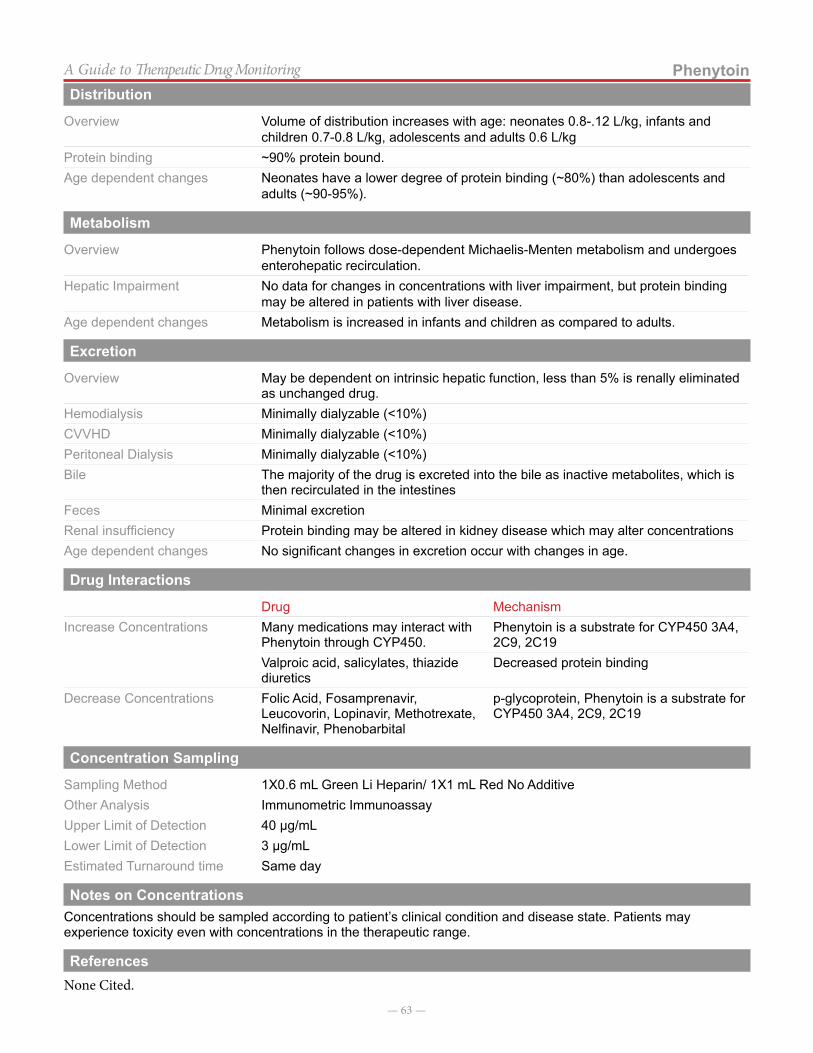
— 63 —
PhenytoinA Guide to Therapeutic Drug MonitoringDistribution
Overview Volume of distribution increases with age: neonates 0.8-.12 L/kg, infants and children 0.7-0.8 L/kg, adolescents and adults 0.6 L/kg
Protein binding ~90% protein bound.Age dependent changes Neonates have a lower degree of protein binding (~80%) than adolescents and
adults (~90-95%).
Metabolism
Overview Phenytoin follows dose-dependent Michaelis-Menten metabolism and undergoes enterohepatic recirculation.
Hepatic Impairment No data for changes in concentrations with liver impairment, but protein binding may be altered in patients with liver disease.
Age dependent changes Metabolism is increased in infants and children as compared to adults.
Excretion
Overview May be dependent on intrinsic hepatic function, less than 5% is renally eliminated as unchanged drug.
Hemodialysis Minimally dialyzable (<10%) CVVHD Minimally dialyzable (<10%) Peritoneal Dialysis Minimally dialyzable (<10%) Bile The majority of the drug is excreted into the bile as inactive metabolites, which is
then recirculated in the intestinesFeces Minimal excretionRenal insufficiency Protein binding may be altered in kidney disease which may alter concentrationsAge dependent changes No significant changes in excretion occur with changes in age.
Drug Interactions
Drug MechanismIncrease Concentrations Many medications may interact with
Phenytoin through CYP450.Phenytoin is a substrate for CYP450 3A4, 2C9, 2C19
Valproic acid, salicylates, thiazide diuretics
Decreased protein binding
Decrease Concentrations Folic Acid, Fosamprenavir, Leucovorin, Lopinavir, Methotrexate, Nelfinavir, Phenobarbital
p-glycoprotein, Phenytoin is a substrate for CYP450 3A4, 2C9, 2C19
Concentration Sampling
Sampling Method 1X0.6 mL Green Li Heparin/ 1X1 mL Red No AdditiveOther Analysis Immunometric ImmunoassayUpper Limit of Detection 40 µg/mLLower Limit of Detection 3 µg/mLEstimated Turnaround time Same day
Notes on ConcentrationsConcentrations should be sampled according to patient’s clinical condition and disease state. Patients may experience toxicity even with concentrations in the therapeutic range.
ReferencesNone Cited.
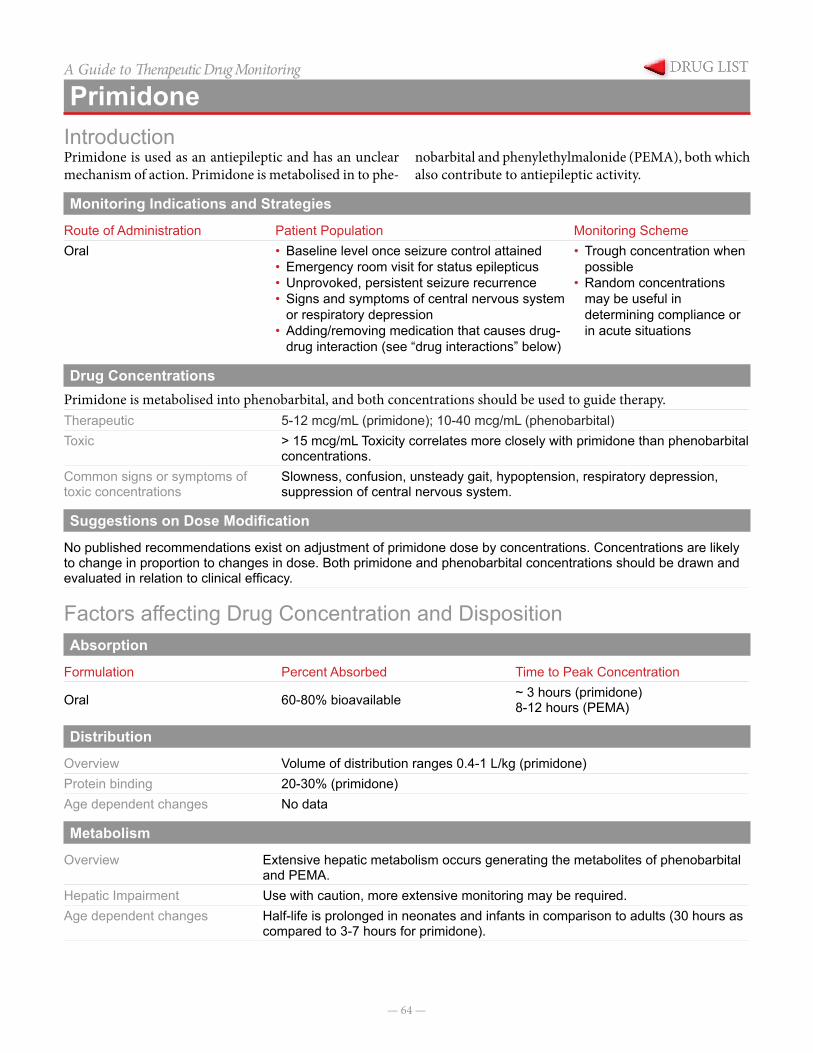
— 64 —
A Guide to Therapeutic Drug Monitoring
PrimidoneIntroductionPrimidone is used as an antiepileptic and has an unclear mechanism of action. Primidone is metabolised in to phe-
nobarbital and phenylethylmalonide (PEMA), both which also contribute to antiepileptic activity.
Monitoring Indications and Strategies
Route of Administration Patient Population Monitoring SchemeOral • Baseline level once seizure control attained
• Emergency room visit for status epilepticus• Unprovoked, persistent seizure recurrence• Signs and symptoms of central nervous system
or respiratory depression• Adding/removing medication that causes drug-
drug interaction (see “drug interactions” below)
• Trough concentration when possible
• Random concentrations may be useful in determining compliance or in acute situations
Drug ConcentrationsPrimidone is metabolised into phenobarbital, and both concentrations should be used to guide therapy.Therapeutic 5-12 mcg/mL (primidone); 10-40 mcg/mL (phenobarbital)Toxic > 15 mcg/mL Toxicity correlates more closely with primidone than phenobarbital
concentrations.Common signs or symptoms of toxic concentrations
Slowness, confusion, unsteady gait, hypoptension, respiratory depression, suppression of central nervous system.
Suggestions on Dose Modification
No published recommendations exist on adjustment of primidone dose by concentrations. Concentrations are likely to change in proportion to changes in dose. Both primidone and phenobarbital concentrations should be drawn and evaluated in relation to clinical efficacy.
Factors affecting Drug Concentration and DispositionAbsorption
Formulation Percent Absorbed Time to Peak Concentration
Oral 60-80% bioavailable ~ 3 hours (primidone)8-12 hours (PEMA)
Distribution
Overview Volume of distribution ranges 0.4-1 L/kg (primidone)Protein binding 20-30% (primidone)Age dependent changes No data
Metabolism
Overview Extensive hepatic metabolism occurs generating the metabolites of phenobarbital and PEMA.
Hepatic Impairment Use with caution, more extensive monitoring may be required.Age dependent changes Half-life is prolonged in neonates and infants in comparison to adults (30 hours as
compared to 3-7 hours for primidone).
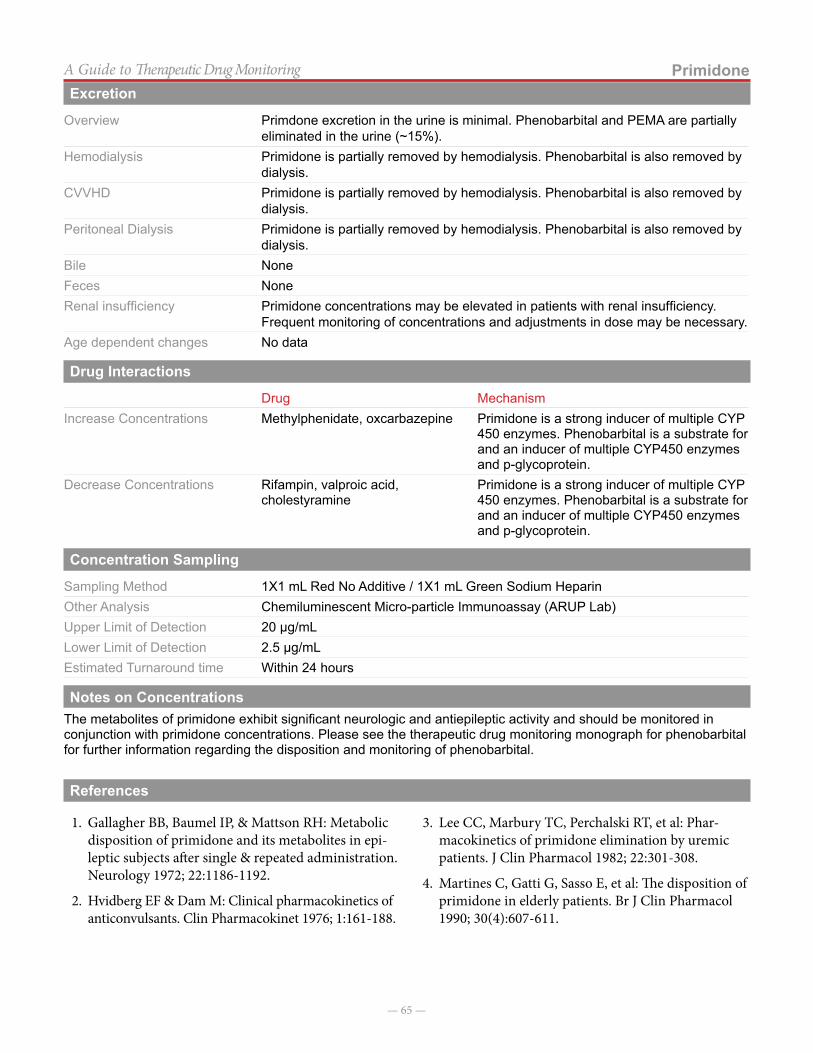
— 65 —
PrimidoneA Guide to Therapeutic Drug MonitoringExcretion
Overview Primdone excretion in the urine is minimal. Phenobarbital and PEMA are partially eliminated in the urine (~15%).
Hemodialysis Primidone is partially removed by hemodialysis. Phenobarbital is also removed by dialysis.
CVVHD Primidone is partially removed by hemodialysis. Phenobarbital is also removed by dialysis.
Peritoneal Dialysis Primidone is partially removed by hemodialysis. Phenobarbital is also removed by dialysis.
Bile None Feces NoneRenal insufficiency Primidone concentrations may be elevated in patients with renal insufficiency.
Frequent monitoring of concentrations and adjustments in dose may be necessary.Age dependent changes No data
Drug Interactions
Drug MechanismIncrease Concentrations Methylphenidate, oxcarbazepine Primidone is a strong inducer of multiple CYP
450 enzymes. Phenobarbital is a substrate for and an inducer of multiple CYP450 enzymes and p-glycoprotein.
Decrease Concentrations Rifampin, valproic acid, cholestyramine
Primidone is a strong inducer of multiple CYP 450 enzymes. Phenobarbital is a substrate for and an inducer of multiple CYP450 enzymes and p-glycoprotein.
Concentration Sampling
Sampling Method 1X1 mL Red No Additive / 1X1 mL Green Sodium HeparinOther Analysis Chemiluminescent Micro-particle Immunoassay (ARUP Lab)Upper Limit of Detection 20 µg/mLLower Limit of Detection 2.5 µg/mLEstimated Turnaround time Within 24 hours
Notes on ConcentrationsThe metabolites of primidone exhibit significant neurologic and antiepileptic activity and should be monitored in conjunction with primidone concentrations. Please see the therapeutic drug monitoring monograph for phenobarbital for further information regarding the disposition and monitoring of phenobarbital.
References
1. Gallagher BB, Baumel IP, & Mattson RH: Metabolic disposition of primidone and its metabolites in epi-leptic subjects after single & repeated administration. Neurology 1972; 22:1186-1192.
2. Hvidberg EF & Dam M: Clinical pharmacokinetics of anticonvulsants. Clin Pharmacokinet 1976; 1:161-188.
3. Lee CC, Marbury TC, Perchalski RT, et al: Phar-macokinetics of primidone elimination by uremic patients. J Clin Pharmacol 1982; 22:301-308.
4. Martines C, Gatti G, Sasso E, et al: The disposition of primidone in elderly patients. Br J Clin Pharmacol 1990; 30(4):607-611.
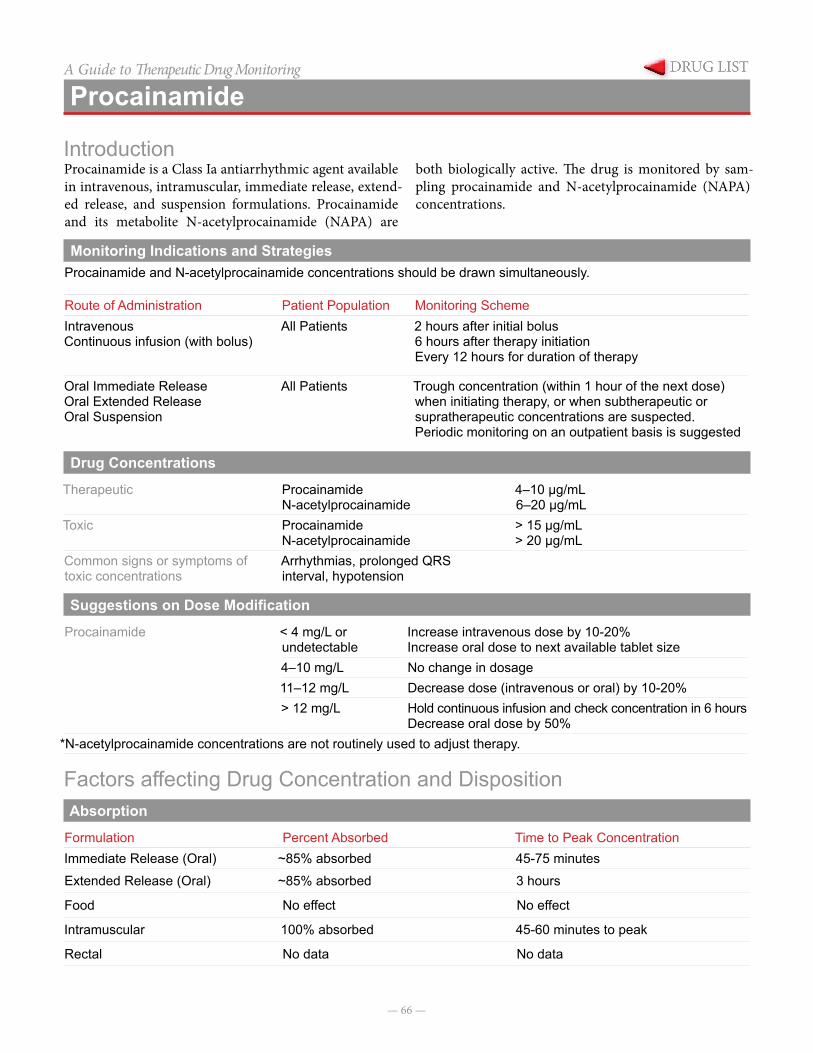
— 66 —
A Guide to Therapeutic Drug Monitoring
Procainamide
IntroductionProcainamide is a Class Ia antiarrhythmic agent available in intravenous, intramuscular, immediate release, extend-ed release, and suspension formulations. Procainamide and its metabolite N-acetylprocainamide (NAPA) are
both biologically active. The drug is monitored by sam-pling procainamide and N-acetylprocainamide (NAPA) concentrations.
Monitoring Indications and StrategiesProcainamide and N-acetylprocainamide concentrations should be drawn simultaneously.
Route of Administration Patient Population Monitoring SchemeIntravenousContinuous infusion (with bolus)
All Patients 2 hours after initial bolus6 hours after therapy initiationEvery 12 hours for duration of therapy
Oral Immediate ReleaseOral Extended ReleaseOral Suspension
All Patients Trough concentration (within 1 hour of the next dose) when initiating therapy, or when subtherapeutic or supratherapeutic concentrations are suspected.Periodic monitoring on an outpatient basis is suggested
Drug Concentrations
Therapeutic ProcainamideN-acetylprocainamide
4–10 µg/mL6–20 µg/mL
Toxic ProcainamideN-acetylprocainamide
> 15 µg/mL> 20 µg/mL
Common signs or symptoms of toxic concentrations
Arrhythmias, prolonged QRS interval, hypotension
Suggestions on Dose Modification
Procainamide < 4 mg/L or undetectable
Increase intravenous dose by 10-20%Increase oral dose to next available tablet size
4–10 mg/L No change in dosage11–12 mg/L Decrease dose (intravenous or oral) by 10-20%> 12 mg/L Hold continuous infusion and check concentration in 6 hours
Decrease oral dose by 50%*N-acetylprocainamide concentrations are not routinely used to adjust therapy.
Factors affecting Drug Concentration and DispositionAbsorption
Formulation Percent Absorbed Time to Peak ConcentrationImmediate Release (Oral) ~85% absorbed 45-75 minutes
Extended Release (Oral) ~85% absorbed 3 hours
Food No effect No effect
Intramuscular 100% absorbed 45-60 minutes to peak
Rectal No data No data
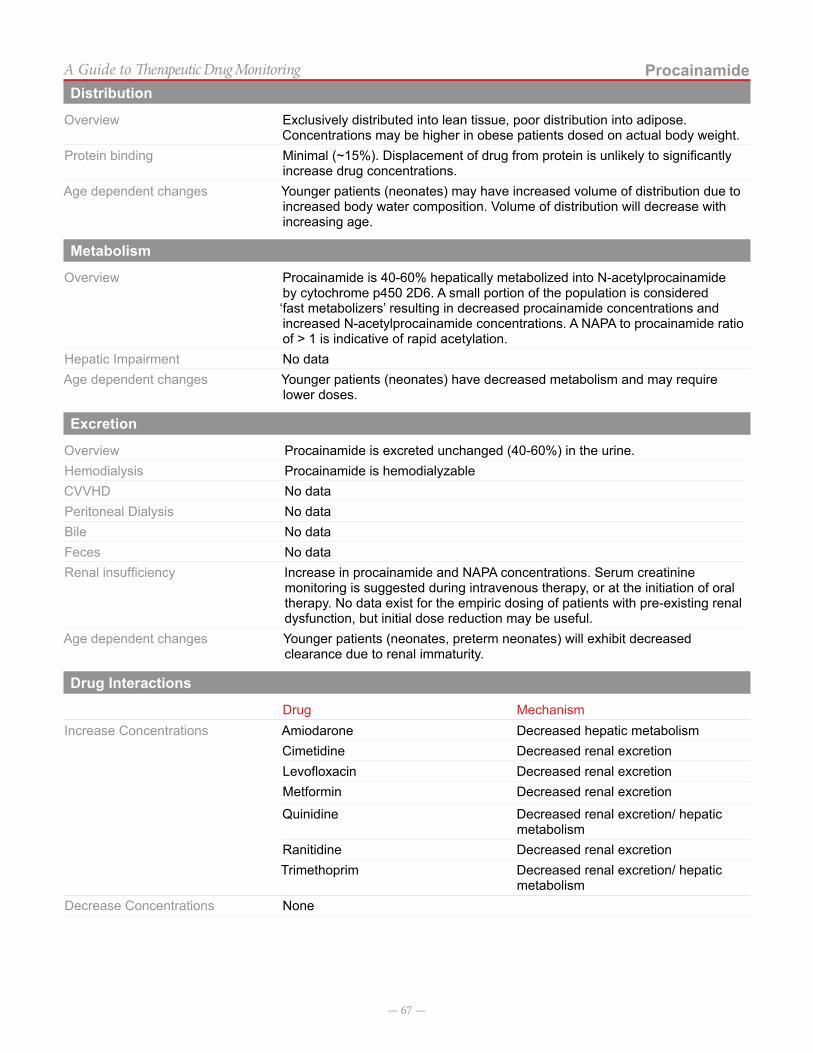
— 67 —
ProcainamideA Guide to Therapeutic Drug MonitoringDistribution
Overview Exclusively distributed into lean tissue, poor distribution into adipose. Concentrations may be higher in obese patients dosed on actual body weight.
Protein binding Minimal (~15%). Displacement of drug from protein is unlikely to significantly increase drug concentrations.
Age dependent changes Younger patients (neonates) may have increased volume of distribution due to increased body water composition. Volume of distribution will decrease with increasing age.
Metabolism
Overview Procainamide is 40-60% hepatically metabolized into N-acetylprocainamide by cytochrome p450 2D6. A small portion of the population is considered ‘fast metabolizers’ resulting in decreased procainamide concentrations and increased N-acetylprocainamide concentrations. A NAPA to procainamide ratio of > 1 is indicative of rapid acetylation.
Hepatic Impairment No dataAge dependent changes Younger patients (neonates) have decreased metabolism and may require
lower doses.
Excretion
Overview Procainamide is excreted unchanged (40-60%) in the urine.Hemodialysis Procainamide is hemodialyzableCVVHD No dataPeritoneal Dialysis No dataBile No dataFeces No dataRenal insufficiency Increase in procainamide and NAPA concentrations. Serum creatinine
monitoring is suggested during intravenous therapy, or at the initiation of oral therapy. No data exist for the empiric dosing of patients with pre-existing renal dysfunction, but initial dose reduction may be useful.
Age dependent changes Younger patients (neonates, preterm neonates) will exhibit decreased clearance due to renal immaturity.
Drug Interactions
Drug MechanismIncrease Concentrations Amiodarone Decreased hepatic metabolism
Cimetidine Decreased renal excretionLevofloxacin Decreased renal excretionMetformin Decreased renal excretion
Quinidine Decreased renal excretion/ hepatic metabolism
Ranitidine Decreased renal excretionTrimethoprim Decreased renal excretion/ hepatic
metabolismDecrease Concentrations None
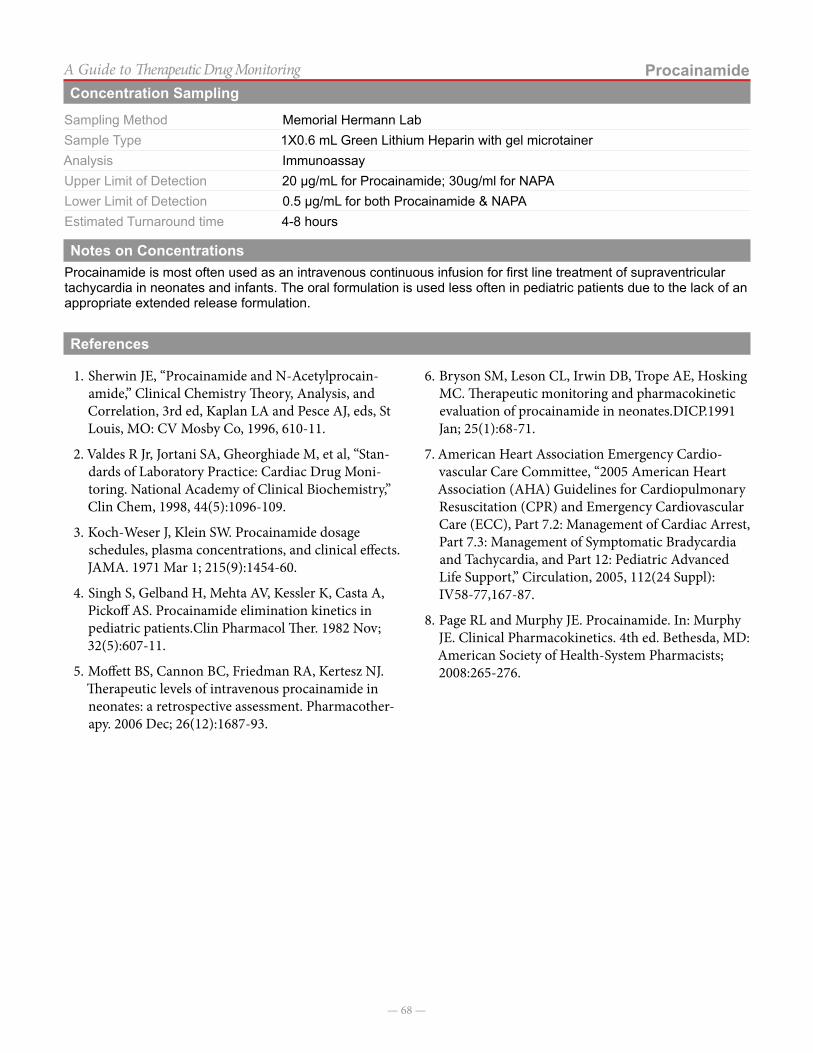
— 68 —
ProcainamideA Guide to Therapeutic Drug MonitoringConcentration Sampling
Sampling Method Memorial Hermann Lab Sample Type 1X0.6 mL Green Lithium Heparin with gel microtainerAnalysis ImmunoassayUpper Limit of Detection 20 µg/mL for Procainamide; 30ug/ml for NAPALower Limit of Detection 0.5 µg/mL for both Procainamide & NAPAEstimated Turnaround time 4-8 hours
Notes on ConcentrationsProcainamide is most often used as an intravenous continuous infusion for first line treatment of supraventricular tachycardia in neonates and infants. The oral formulation is used less often in pediatric patients due to the lack of an appropriate extended release formulation.
References
1. Sherwin JE, “Procainamide and N-Acetylprocain-amide,” Clinical Chemistry Theory, Analysis, and Correlation, 3rd ed, Kaplan LA and Pesce AJ, eds, St Louis, MO: CV Mosby Co, 1996, 610-11.
2. Valdes R Jr, Jortani SA, Gheorghiade M, et al, “Stan-dards of Laboratory Practice: Cardiac Drug Moni-toring. National Academy of Clinical Biochemistry,” Clin Chem, 1998, 44(5):1096-109.
3. Koch-Weser J, Klein SW. Procainamide dosage schedules, plasma concentrations, and clinical effects.JAMA. 1971 Mar 1; 215(9):1454-60.
4. Singh S, Gelband H, Mehta AV, Kessler K, Casta A, Pickoff AS. Procainamide elimination kinetics in pediatric patients.Clin Pharmacol Ther. 1982 Nov; 32(5):607-11.
5. Moffett BS, Cannon BC, Friedman RA, Kertesz NJ. Therapeutic levels of intravenous procainamide in neonates: a retrospective assessment. Pharmacother-apy. 2006 Dec; 26(12):1687-93.
6. Bryson SM, Leson CL, Irwin DB, Trope AE, Hosking MC. Therapeutic monitoring and pharmacokinetic evaluation of procainamide in neonates.DICP.1991 Jan; 25(1):68-71.
7. American Heart Association Emergency Cardio-vascular Care Committee, “2005 American Heart Association (AHA) Guidelines for Cardiopulmonary Resuscitation (CPR) and Emergency Cardiovascular Care (ECC), Part 7.2: Management of Cardiac Arrest, Part 7.3: Management of Symptomatic Bradycardia and Tachycardia, and Part 12: Pediatric Advanced Life Support,” Circulation, 2005, 112(24 Suppl): IV58-77,167-87.
8. Page RL and Murphy JE. Procainamide. In: Murphy JE. Clinical Pharmacokinetics. 4th ed. Bethesda, MD: American Society of Health-System Pharmacists; 2008:265-276.
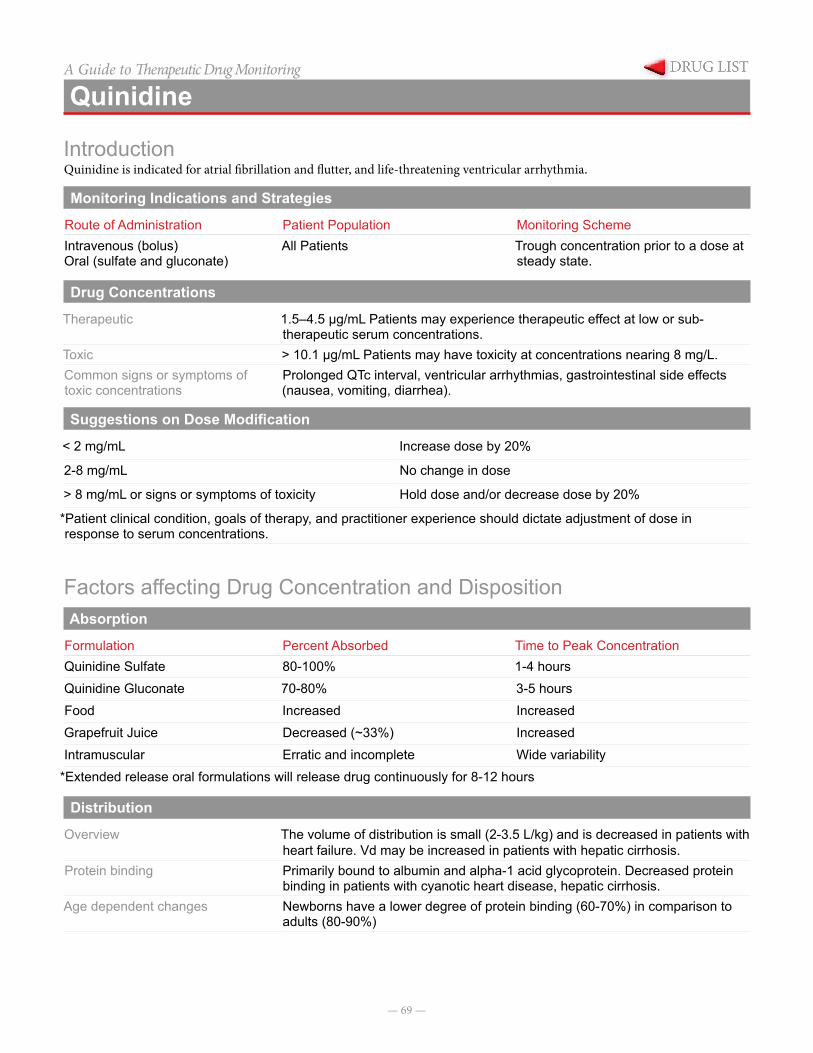
— 69 —
A Guide to Therapeutic Drug Monitoring
Quinidine
IntroductionQuinidine is indicated for atrial fibrillation and flutter, and life-threatening ventricular arrhythmia.
Monitoring Indications and Strategies
Route of Administration Patient Population Monitoring SchemeIntravenous (bolus)Oral (sulfate and gluconate)
All Patients Trough concentration prior to a dose at steady state.
Drug Concentrations
Therapeutic 1.5–4.5 µg/mL Patients may experience therapeutic effect at low or sub-therapeutic serum concentrations.
Toxic > 10.1 µg/mL Patients may have toxicity at concentrations nearing 8 mg/L.Common signs or symptoms of toxic concentrations
Prolonged QTc interval, ventricular arrhythmias, gastrointestinal side effects (nausea, vomiting, diarrhea).
Suggestions on Dose Modification
< 2 mg/mL Increase dose by 20%
2-8 mg/mL No change in dose
> 8 mg/mL or signs or symptoms of toxicity Hold dose and/or decrease dose by 20%
*Patient clinical condition, goals of therapy, and practitioner experience should dictate adjustment of dose in response to serum concentrations.
Factors affecting Drug Concentration and DispositionAbsorption
Formulation Percent Absorbed Time to Peak ConcentrationQuinidine Sulfate 80-100% 1-4 hoursQuinidine Gluconate 70-80% 3-5 hoursFood Increased IncreasedGrapefruit Juice Decreased (~33%) IncreasedIntramuscular Erratic and incomplete Wide variability
*Extended release oral formulations will release drug continuously for 8-12 hours
Distribution
Overview The volume of distribution is small (2-3.5 L/kg) and is decreased in patients with heart failure. Vd may be increased in patients with hepatic cirrhosis.
Protein binding Primarily bound to albumin and alpha-1 acid glycoprotein. Decreased protein binding in patients with cyanotic heart disease, hepatic cirrhosis.
Age dependent changes Newborns have a lower degree of protein binding (60-70%) in comparison to adults (80-90%)
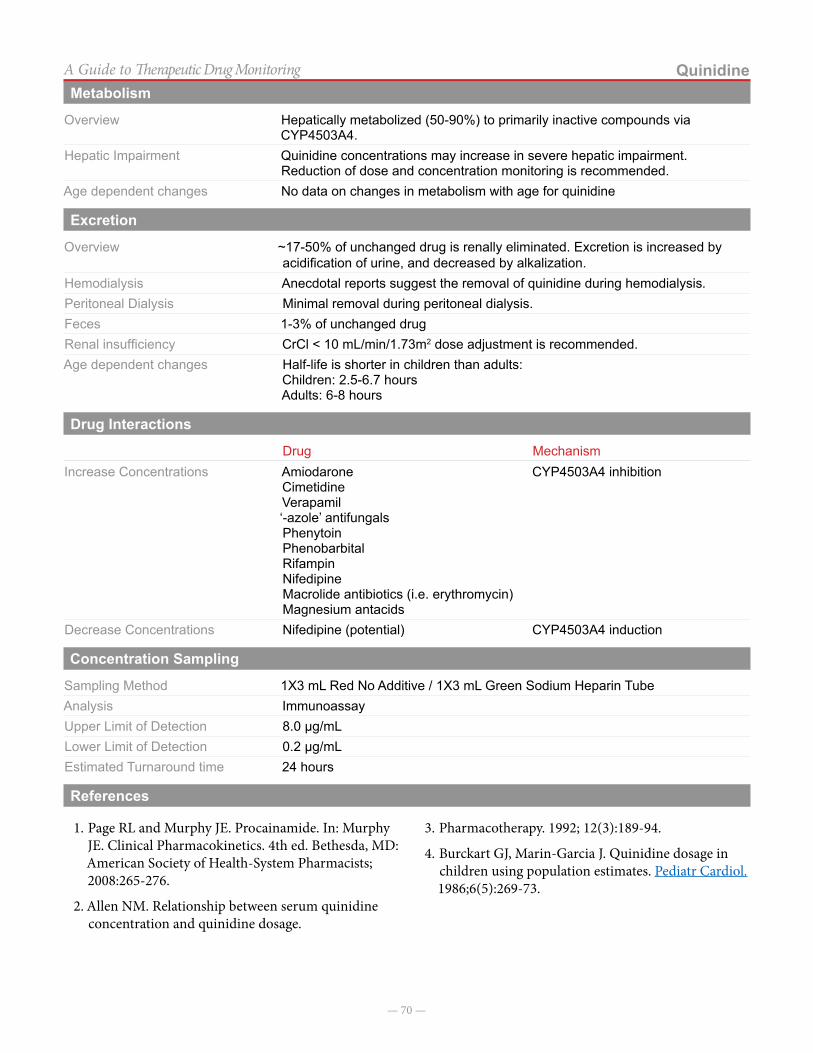
— 70 —
QuinidineA Guide to Therapeutic Drug MonitoringMetabolism
Overview Hepatically metabolized (50-90%) to primarily inactive compounds via CYP4503A4.
Hepatic Impairment Quinidine concentrations may increase in severe hepatic impairment. Reduction of dose and concentration monitoring is recommended.
Age dependent changes No data on changes in metabolism with age for quinidine
Excretion
Overview ~17-50% of unchanged drug is renally eliminated. Excretion is increased by acidification of urine, and decreased by alkalization.
Hemodialysis Anecdotal reports suggest the removal of quinidine during hemodialysis.Peritoneal Dialysis Minimal removal during peritoneal dialysis.Feces 1-3% of unchanged drugRenal insufficiency CrCl < 10 mL/min/1.73m2 dose adjustment is recommended.Age dependent changes Half-life is shorter in children than adults:
Children: 2.5-6.7 hoursAdults: 6-8 hours
Drug Interactions
Drug MechanismIncrease Concentrations Amiodarone
CimetidineVerapamil‘-azole’ antifungalsPhenytoinPhenobarbitalRifampinNifedipineMacrolide antibiotics (i.e. erythromycin)Magnesium antacids
CYP4503A4 inhibition
Decrease Concentrations Nifedipine (potential) CYP4503A4 induction
Concentration Sampling
Sampling Method 1X3 mL Red No Additive / 1X3 mL Green Sodium Heparin TubeAnalysis ImmunoassayUpper Limit of Detection 8.0 µg/mLLower Limit of Detection 0.2 µg/mLEstimated Turnaround time 24 hours
References
1. Page RL and Murphy JE. Procainamide. In: Murphy JE. Clinical Pharmacokinetics. 4th ed. Bethesda, MD: American Society of Health-System Pharmacists; 2008:265-276.
2. Allen NM. Relationship between serum quinidine concentration and quinidine dosage.
3. Pharmacotherapy. 1992; 12(3):189-94.
4. Burckart GJ, Marin-Garcia J. Quinidine dosage in children using population estimates. Pediatr Cardiol. 1986;6(5):269-73.

— 71 —
A Guide to Therapeutic Drug Monitoring
Sirolimus
Introduction1-6
Sirolimus is a macrocyclic lactone that displays a nov-el mechanism of immunosuppressive action. Similar to tacrolimus, Sirolimus binds to FKBP-12, an intracellular protein in T-Cells. Unlike tacrolimus, this complex does not inhibit calcineurin, but rather inhibits the mammali-an target of rapamycin (mTOR). The result is to arrest cy-tokine driven (IL-2, IL-4, and IL-15) T-cell proliferation.
Sirolimus is indicated for use for prophylaxis of re-jection in patients receiving renal transplants. Because of perioperative adverse effects and concerns over efficacy in absence of calcineurin inhibitors, Sirolimus and other mTOR inhibitors are rarely used de novo following any
organ transplant, however, mTOR inhibitors have found compelling indications in organ transplantation such as: transplant nephropathy related to calcineurin inhibitors, cancers like post-transplant lymphoproliferative disease or Kaposi’s sarcoma, chronic allograft vasculopathy in heart transplant recipients, and prevention of hepatocel-lular carcinoma recurrence in liver transplant recipients. Sirolimus is also used occasionally for prophylaxis or treatment of graft-versus-host disease, and treatment of chordoma, renal angiomyolipoma, and lymphangioleio-myomatosis. Its intravenous prodrug formulation, temsi-rolimus, is indicated for treatment of renal cell carcinoma.
Monitoring Indications and Strategies
Route of Administration Patient Population Monitoring SchemeOral
Tablets (0.5, 1, & 2mg)Solution (1 mg/mL)
• After changes in dosage• Therapeutic failure • Drug-Drug interactions (CYP3A/P-GP
inhibitors/inducers, calcineurin inhibitors)• Changes in hepatic function
• Monitor levels when patient reaches steady state (> 5-7 days)
• Trough Concentrations
Drug Concentrations3-6
It is necessary to monitor Sirolimus serum concentrations to optimize therapy since goal concentrations vary based on indication, organ transplanted, and use of concomitant immunosuppressants.
Therapeutic 3–15 ng/mL Toxic Correlations between steady state concentrations and toxicity have been made and can
occur at therapeutic levelsHypercholesteremia (> 400 mg/dL): > 13 ng/dLHypertriglyceridemia (> 300 mg/dL): > 11 ng/dLThrombocytopenia (< 100,000 mm3): > 14 ng/dLLeukopenia (< 4000 mm3): > 15 ng/dL
*Therapeutic concentration depend on organ transplanted, concomitant mediations, and patient specific factors.
Suggestions on Dose Modification
There is a linear relationship between dose and concentration in adults and children. There is a wide range of dose suggestions associated with optimal therapeutic levels.
Dose (new) = Dose (old) X [Cmin(new) X Cmin(old)]
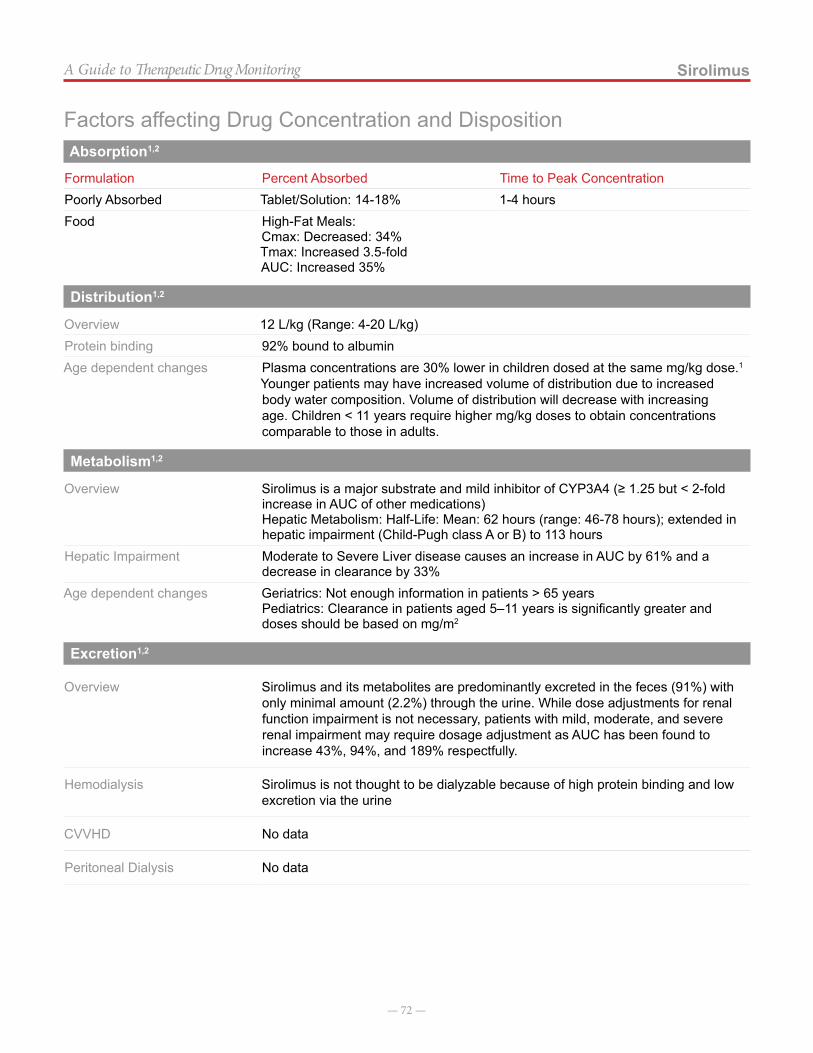
— 72 —
SirolimusA Guide to Therapeutic Drug Monitoring
Factors affecting Drug Concentration and DispositionAbsorption1,2
Formulation Percent Absorbed Time to Peak ConcentrationPoorly Absorbed Tablet/Solution: 14-18% 1-4 hoursFood High-Fat Meals:
Cmax: Decreased: 34%Tmax: Increased 3.5-foldAUC: Increased 35%
Distribution1,2
Overview 12 L/kg (Range: 4-20 L/kg)Protein binding 92% bound to albuminAge dependent changes Plasma concentrations are 30% lower in children dosed at the same mg/kg dose.1
Younger patients may have increased volume of distribution due to increased body water composition. Volume of distribution will decrease with increasing age. Children < 11 years require higher mg/kg doses to obtain concentrations comparable to those in adults.
Metabolism1,2
Overview Sirolimus is a major substrate and mild inhibitor of CYP3A4 (≥ 1.25 but < 2-fold increase in AUC of other medications)Hepatic Metabolism: Half-Life: Mean: 62 hours (range: 46-78 hours); extended in hepatic impairment (Child-Pugh class A or B) to 113 hours
Hepatic Impairment Moderate to Severe Liver disease causes an increase in AUC by 61% and a decrease in clearance by 33%
Age dependent changes Geriatrics: Not enough information in patients > 65 yearsPediatrics: Clearance in patients aged 5–11 years is significantly greater and doses should be based on mg/m2
Excretion1,2
Overview Sirolimus and its metabolites are predominantly excreted in the feces (91%) with only minimal amount (2.2%) through the urine. While dose adjustments for renal function impairment is not necessary, patients with mild, moderate, and severe renal impairment may require dosage adjustment as AUC has been found to increase 43%, 94%, and 189% respectfully.
Hemodialysis Sirolimus is not thought to be dialyzable because of high protein binding and low excretion via the urine
CVVHD No data
Peritoneal Dialysis No data
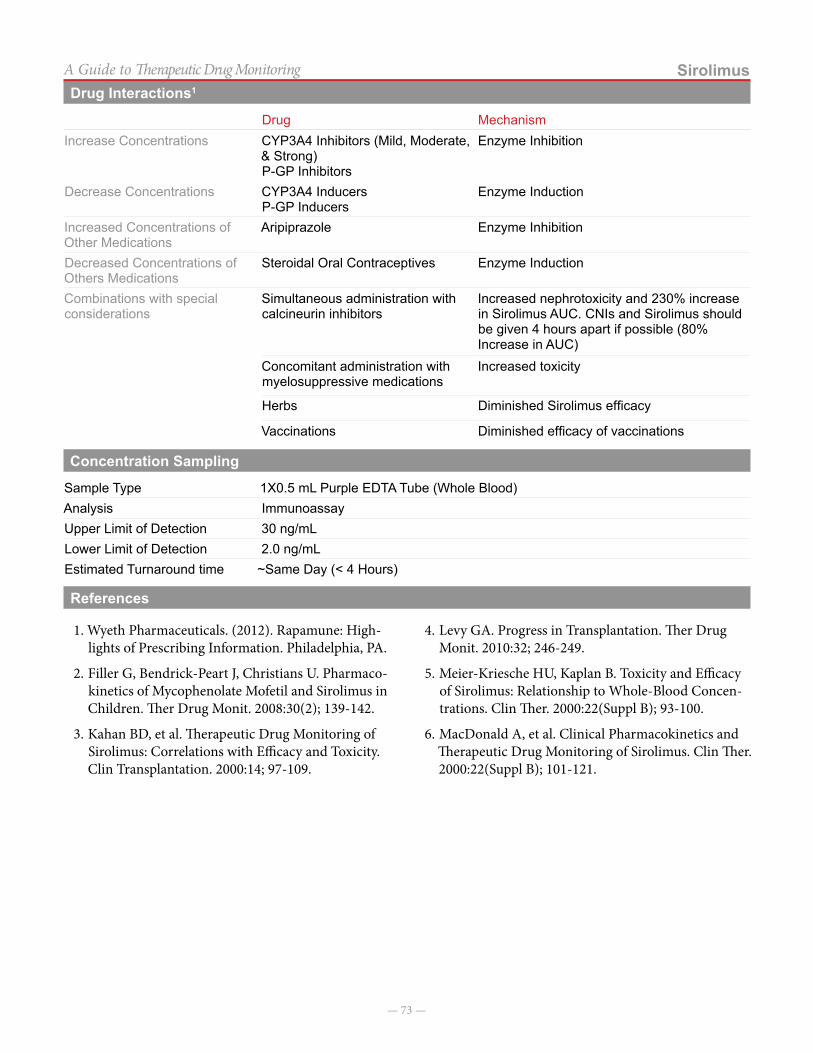
— 73 —
SirolimusA Guide to Therapeutic Drug MonitoringDrug Interactions1
Drug MechanismIncrease Concentrations CYP3A4 Inhibitors (Mild, Moderate,
& Strong)P-GP Inhibitors
Enzyme Inhibition
Decrease Concentrations CYP3A4 InducersP-GP Inducers
Enzyme Induction
Increased Concentrations of Other Medications
Aripiprazole Enzyme Inhibition
Decreased Concentrations of Others Medications
Steroidal Oral Contraceptives Enzyme Induction
Combinations with special considerations
Simultaneous administration with calcineurin inhibitors
Increased nephrotoxicity and 230% increase in Sirolimus AUC. CNIs and Sirolimus should be given 4 hours apart if possible (80% Increase in AUC)
Concomitant administration with myelosuppressive medications
Increased toxicity
Herbs Diminished Sirolimus efficacy
Vaccinations Diminished efficacy of vaccinations
Concentration Sampling
Sample Type 1X0.5 mL Purple EDTA Tube (Whole Blood)Analysis ImmunoassayUpper Limit of Detection 30 ng/mLLower Limit of Detection 2.0 ng/mLEstimated Turnaround time ~Same Day (< 4 Hours)
References
1. Wyeth Pharmaceuticals. (2012). Rapamune: High-lights of Prescribing Information. Philadelphia, PA.
2. Filler G, Bendrick-Peart J, Christians U. Pharmaco-kinetics of Mycophenolate Mofetil and Sirolimus in Children. Ther Drug Monit. 2008:30(2); 139-142.
3. Kahan BD, et al. Therapeutic Drug Monitoring of Sirolimus: Correlations with Efficacy and Toxicity. Clin Transplantation. 2000:14; 97-109.
4. Levy GA. Progress in Transplantation. Ther Drug Monit. 2010:32; 246-249.
5. Meier-Kriesche HU, Kaplan B. Toxicity and Efficacy of Sirolimus: Relationship to Whole-Blood Concen-trations. Clin Ther. 2000:22(Suppl B); 93-100.
6. MacDonald A, et al. Clinical Pharmacokinetics and Therapeutic Drug Monitoring of Sirolimus. Clin Ther. 2000:22(Suppl B); 101-121.
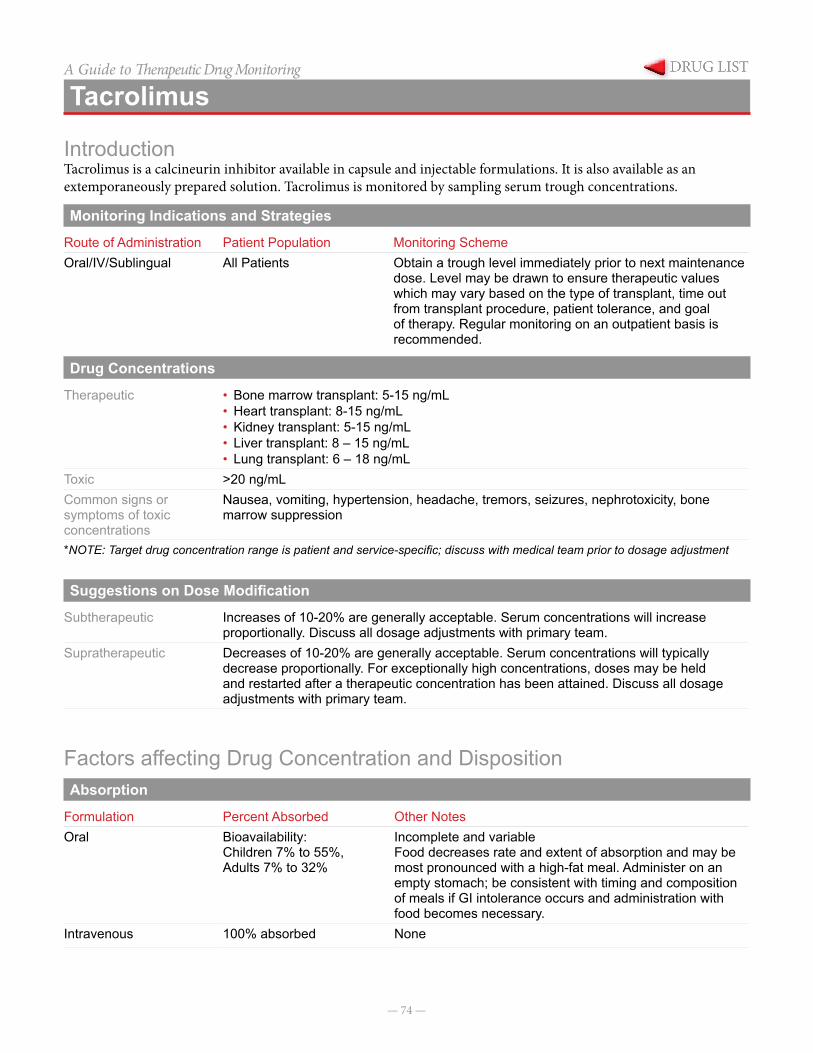
— 74 —
A Guide to Therapeutic Drug Monitoring
Tacrolimus
IntroductionTacrolimus is a calcineurin inhibitor available in capsule and injectable formulations. It is also available as an extemporaneously prepared solution. Tacrolimus is monitored by sampling serum trough concentrations.
Monitoring Indications and Strategies
Route of Administration Patient Population Monitoring SchemeOral/IV/Sublingual All Patients Obtain a trough level immediately prior to next maintenance
dose. Level may be drawn to ensure therapeutic values which may vary based on the type of transplant, time out from transplant procedure, patient tolerance, and goal of therapy. Regular monitoring on an outpatient basis is recommended.
Drug Concentrations
Therapeutic • Bone marrow transplant: 5-15 ng/mL• Heart transplant: 8-15 ng/mL• Kidney transplant: 5-15 ng/mL• Liver transplant: 8 – 15 ng/mL• Lung transplant: 6 – 18 ng/mL
Toxic >20 ng/mL Common signs or symptoms of toxic concentrations
Nausea, vomiting, hypertension, headache, tremors, seizures, nephrotoxicity, bone marrow suppression
*NOTE: Target drug concentration range is patient and service-specific; discuss with medical team prior to dosage adjustment
Suggestions on Dose Modification
Subtherapeutic Increases of 10-20% are generally acceptable. Serum concentrations will increase proportionally. Discuss all dosage adjustments with primary team.
Supratherapeutic Decreases of 10-20% are generally acceptable. Serum concentrations will typically decrease proportionally. For exceptionally high concentrations, doses may be held and restarted after a therapeutic concentration has been attained. Discuss all dosage adjustments with primary team.
Factors affecting Drug Concentration and DispositionAbsorption
Formulation Percent Absorbed Other NotesOral Bioavailability:
Children 7% to 55%, Adults 7% to 32%
Incomplete and variableFood decreases rate and extent of absorption and may be most pronounced with a high-fat meal. Administer on an empty stomach; be consistent with timing and composition of meals if GI intolerance occurs and administration with food becomes necessary.
Intravenous 100% absorbed None
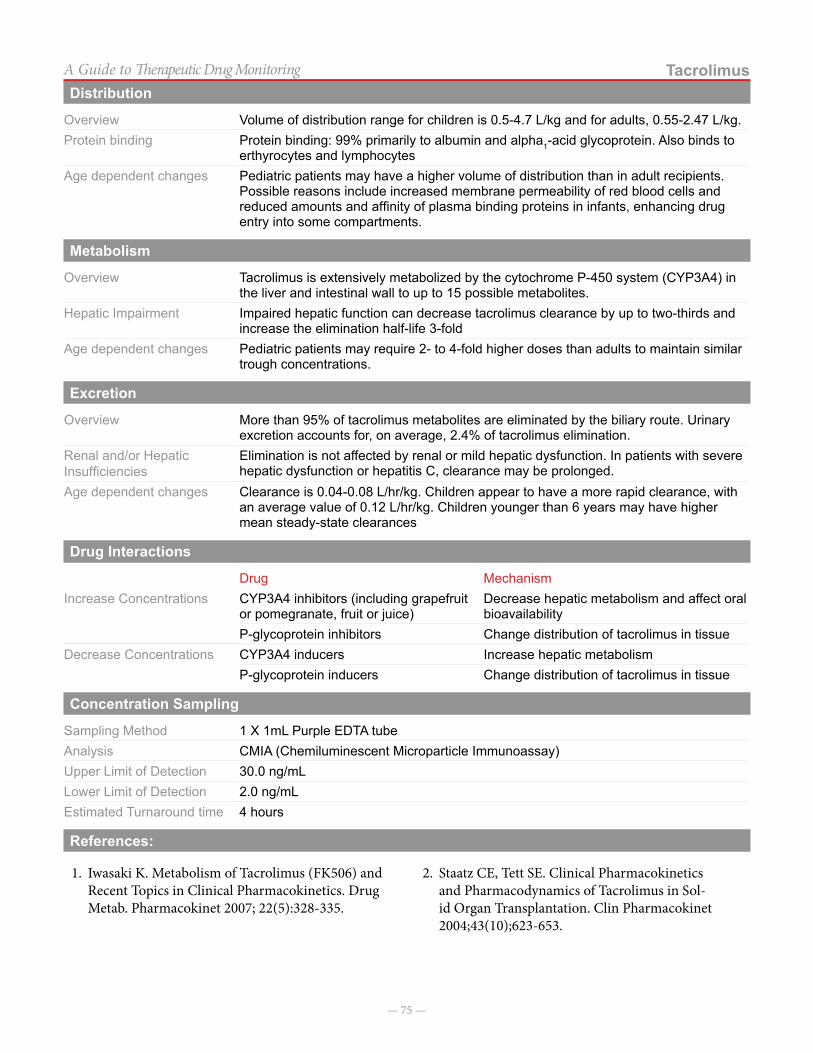
— 75 —
TacrolimusA Guide to Therapeutic Drug MonitoringDistribution
Overview Volume of distribution range for children is 0.5-4.7 L/kg and for adults, 0.55-2.47 L/kg.Protein binding Protein binding: 99% primarily to albumin and alpha1-acid glycoprotein. Also binds to
erthyrocytes and lymphocytesAge dependent changes Pediatric patients may have a higher volume of distribution than in adult recipients.
Possible reasons include increased membrane permeability of red blood cells and reduced amounts and affinity of plasma binding proteins in infants, enhancing drug entry into some compartments.
Metabolism
Overview Tacrolimus is extensively metabolized by the cytochrome P-450 system (CYP3A4) in the liver and intestinal wall to up to 15 possible metabolites.
Hepatic Impairment Impaired hepatic function can decrease tacrolimus clearance by up to two-thirds and increase the elimination half-life 3-fold
Age dependent changes Pediatric patients may require 2- to 4-fold higher doses than adults to maintain similar trough concentrations.
Excretion
Overview More than 95% of tacrolimus metabolites are eliminated by the biliary route. Urinary excretion accounts for, on average, 2.4% of tacrolimus elimination.
Renal and/or Hepatic Insufficiencies
Elimination is not affected by renal or mild hepatic dysfunction. In patients with severe hepatic dysfunction or hepatitis C, clearance may be prolonged.
Age dependent changes Clearance is 0.04-0.08 L/hr/kg. Children appear to have a more rapid clearance, with an average value of 0.12 L/hr/kg. Children younger than 6 years may have higher mean steady-state clearances
Drug Interactions
Drug MechanismIncrease Concentrations CYP3A4 inhibitors (including grapefruit
or pomegranate, fruit or juice)Decrease hepatic metabolism and affect oral bioavailability
P-glycoprotein inhibitors Change distribution of tacrolimus in tissueDecrease Concentrations CYP3A4 inducers Increase hepatic metabolism
P-glycoprotein inducers Change distribution of tacrolimus in tissue
Concentration Sampling
Sampling Method 1 X 1mL Purple EDTA tubeAnalysis CMIA (Chemiluminescent Microparticle Immunoassay)Upper Limit of Detection 30.0 ng/mLLower Limit of Detection 2.0 ng/mLEstimated Turnaround time 4 hours
References:
1. Iwasaki K. Metabolism of Tacrolimus (FK506) and Recent Topics in Clinical Pharmacokinetics. Drug Metab. Pharmacokinet 2007; 22(5):328-335.
2. Staatz CE, Tett SE. Clinical Pharmacokinetics and Pharmacodynamics of Tacrolimus in Sol-id Organ Transplantation. Clin Pharmacokinet 2004;43(10);623-653.
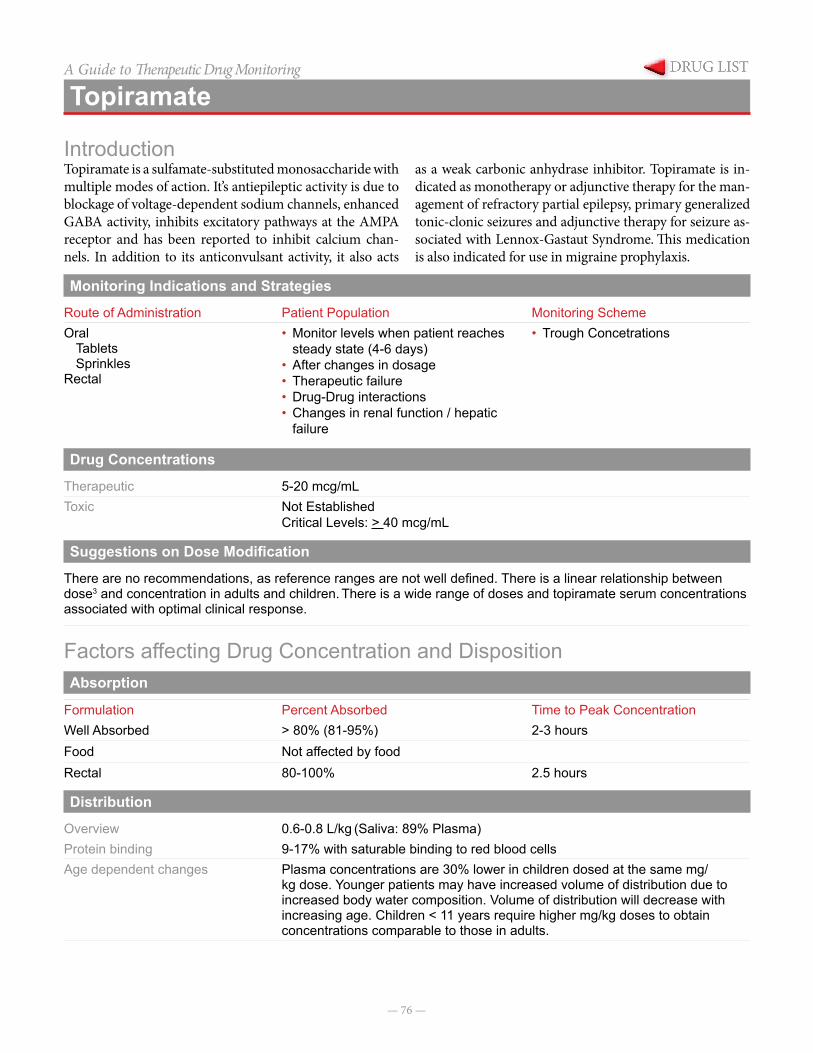
— 76 —
A Guide to Therapeutic Drug Monitoring
Topiramate
IntroductionTopiramate is a sulfamate-substituted monosaccharide with multiple modes of action. It’s antiepileptic activity is due to blockage of voltage-dependent sodium channels, enhanced GABA activity, inhibits excitatory pathways at the AMPA receptor and has been reported to inhibit calcium chan-nels. In addition to its anticonvulsant activity, it also acts
as a weak carbonic anhydrase inhibitor. Topiramate is in-dicated as monotherapy or adjunctive therapy for the man-agement of refractory partial epilepsy, primary generalized tonic-clonic seizures and adjunctive therapy for seizure as-sociated with Lennox-Gastaut Syndrome. This medication is also indicated for use in migraine prophylaxis.
Monitoring Indications and Strategies
Route of Administration Patient Population Monitoring SchemeOral
TabletsSprinkles
Rectal
• Monitor levels when patient reaches steady state (4-6 days)
• After changes in dosage• Therapeutic failure• Drug-Drug interactions• Changes in renal function / hepatic
failure
• Trough Concetrations
Drug Concentrations
Therapeutic 5-20 mcg/mLToxic Not Established
Critical Levels: > 40 mcg/mL
Suggestions on Dose Modification
There are no recommendations, as reference ranges are not well defined. There is a linear relationship between dose3 and concentration in adults and children. There is a wide range of doses and topiramate serum concentrations associated with optimal clinical response.
Factors affecting Drug Concentration and DispositionAbsorption
Formulation Percent Absorbed Time to Peak ConcentrationWell Absorbed > 80% (81-95%) 2-3 hoursFood Not affected by foodRectal 80-100% 2.5 hours
Distribution
Overview 0.6-0.8 L/kg (Saliva: 89% Plasma) Protein binding 9-17% with saturable binding to red blood cellsAge dependent changes Plasma concentrations are 30% lower in children dosed at the same mg/
kg dose. Younger patients may have increased volume of distribution due to increased body water composition. Volume of distribution will decrease with increasing age. Children < 11 years require higher mg/kg doses to obtain concentrations comparable to those in adults.
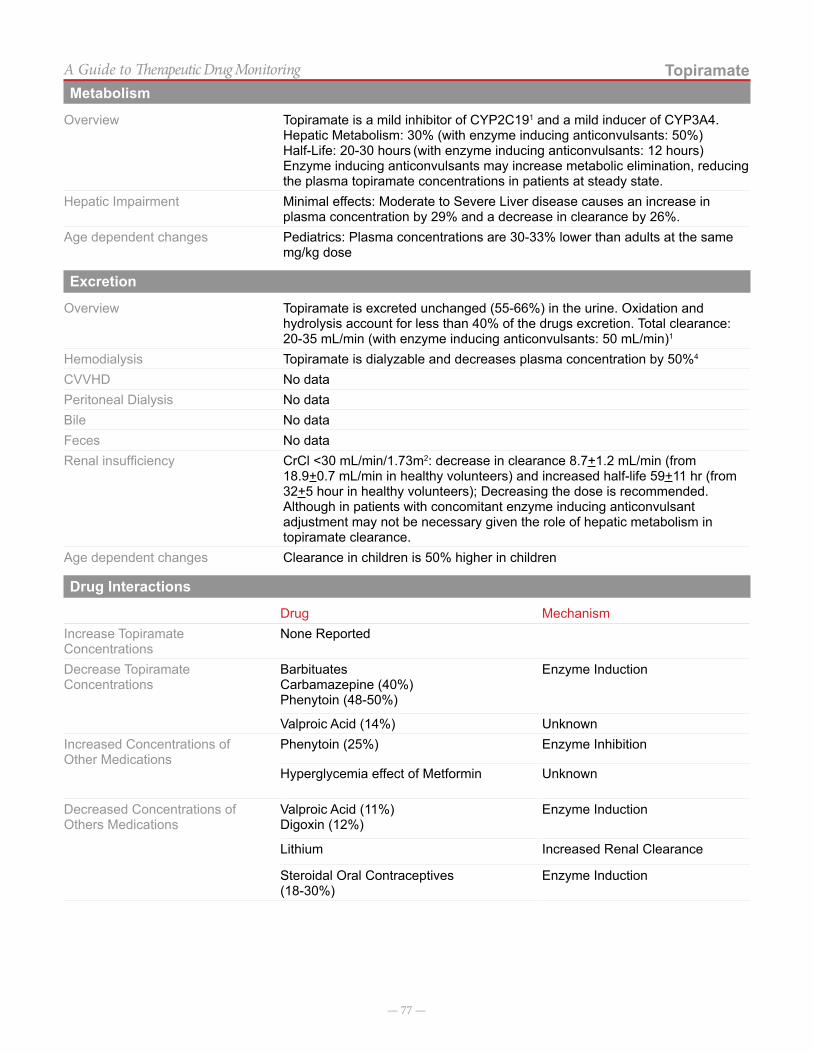
— 77 —
TopiramateA Guide to Therapeutic Drug MonitoringMetabolism
Overview Topiramate is a mild inhibitor of CYP2C191 and a mild inducer of CYP3A4.Hepatic Metabolism: 30% (with enzyme inducing anticonvulsants: 50%)Half-Life: 20-30 hours (with enzyme inducing anticonvulsants: 12 hours) Enzyme inducing anticonvulsants may increase metabolic elimination, reducing the plasma topiramate concentrations in patients at steady state.
Hepatic Impairment Minimal effects: Moderate to Severe Liver disease causes an increase in plasma concentration by 29% and a decrease in clearance by 26%.
Age dependent changes Pediatrics: Plasma concentrations are 30-33% lower than adults at the same mg/kg dose
Excretion
Overview Topiramate is excreted unchanged (55-66%) in the urine. Oxidation and hydrolysis account for less than 40% of the drugs excretion. Total clearance: 20-35 mL/min (with enzyme inducing anticonvulsants: 50 mL/min)1
Hemodialysis Topiramate is dialyzable and decreases plasma concentration by 50%4
CVVHD No dataPeritoneal Dialysis No dataBile No dataFeces No dataRenal insufficiency CrCl <30 mL/min/1.73m2: decrease in clearance 8.7+1.2 mL/min (from
18.9+0.7 mL/min in healthy volunteers) and increased half-life 59+11 hr (from 32+5 hour in healthy volunteers); Decreasing the dose is recommended. Although in patients with concomitant enzyme inducing anticonvulsant adjustment may not be necessary given the role of hepatic metabolism in topiramate clearance.
Age dependent changes Clearance in children is 50% higher in children
Drug Interactions
Drug MechanismIncrease Topiramate Concentrations
None Reported
Decrease Topiramate Concentrations
BarbituatesCarbamazepine (40%)Phenytoin (48-50%)
Enzyme Induction
Valproic Acid (14%) UnknownIncreased Concentrations of Other Medications
Phenytoin (25%) Enzyme Inhibition
Hyperglycemia effect of Metformin Unknown
Decreased Concentrations of Others Medications
Valproic Acid (11%)Digoxin (12%)
Enzyme Induction
Lithium Increased Renal Clearance
Steroidal Oral Contraceptives(18-30%)
Enzyme Induction
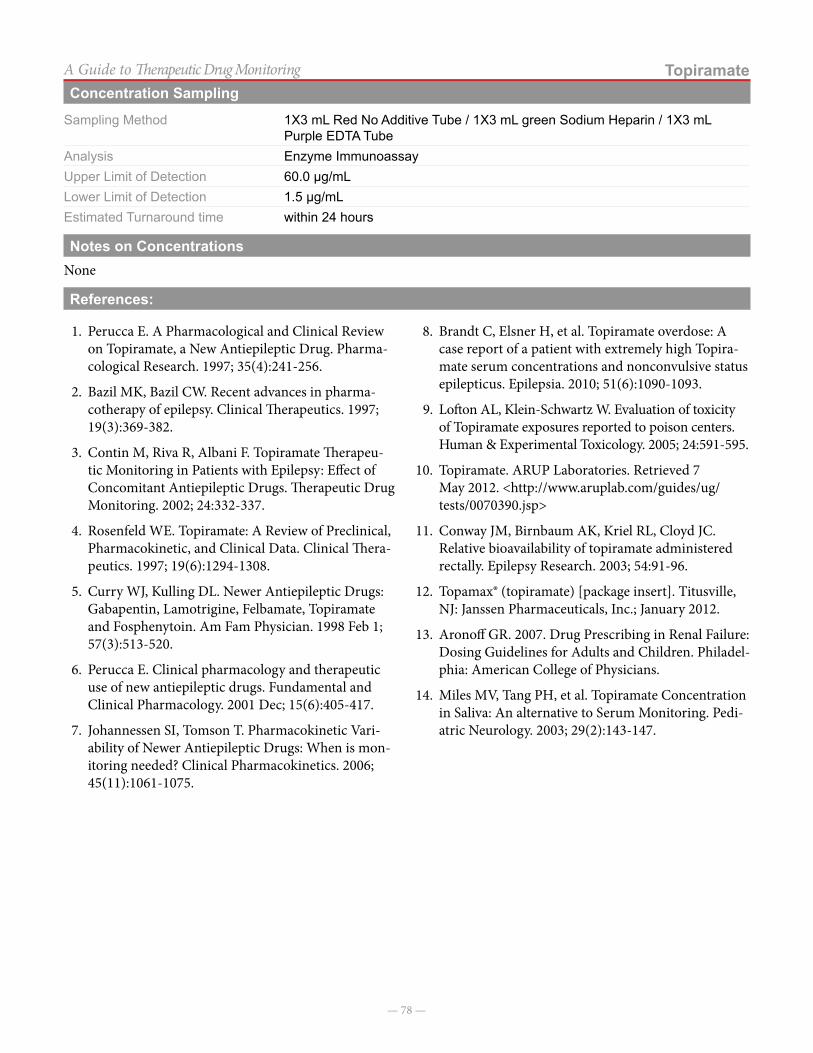
— 78 —
TopiramateA Guide to Therapeutic Drug MonitoringConcentration Sampling
Sampling Method 1X3 mL Red No Additive Tube / 1X3 mL green Sodium Heparin / 1X3 mL Purple EDTA Tube
Analysis Enzyme ImmunoassayUpper Limit of Detection 60.0 µg/mLLower Limit of Detection 1.5 µg/mLEstimated Turnaround time within 24 hours
Notes on ConcentrationsNone
References:
1. Perucca E. A Pharmacological and Clinical Review on Topiramate, a New Antiepileptic Drug. Pharma-cological Research. 1997; 35(4):241-256.
2. Bazil MK, Bazil CW. Recent advances in pharma-cotherapy of epilepsy. Clinical Therapeutics. 1997; 19(3):369-382.
3. Contin M, Riva R, Albani F. Topiramate Therapeu-tic Monitoring in Patients with Epilepsy: Effect of Concomitant Antiepileptic Drugs. Therapeutic Drug Monitoring. 2002; 24:332-337.
4. Rosenfeld WE. Topiramate: A Review of Preclinical, Pharmacokinetic, and Clinical Data. Clinical Thera-peutics. 1997; 19(6):1294-1308.
5. Curry WJ, Kulling DL. Newer Antiepileptic Drugs: Gabapentin, Lamotrigine, Felbamate, Topiramate and Fosphenytoin. Am Fam Physician. 1998 Feb 1; 57(3):513-520.
6. Perucca E. Clinical pharmacology and therapeutic use of new antiepileptic drugs. Fundamental and Clinical Pharmacology. 2001 Dec; 15(6):405-417.
7. Johannessen SI, Tomson T. Pharmacokinetic Vari-ability of Newer Antiepileptic Drugs: When is mon-itoring needed? Clinical Pharmacokinetics. 2006; 45(11):1061-1075.
8. Brandt C, Elsner H, et al. Topiramate overdose: A case report of a patient with extremely high Topira-mate serum concentrations and nonconvulsive status epilepticus. Epilepsia. 2010; 51(6):1090-1093.
9. Lofton AL, Klein-Schwartz W. Evaluation of toxicity of Topiramate exposures reported to poison centers. Human & Experimental Toxicology. 2005; 24:591-595.
10. Topiramate. ARUP Laboratories. Retrieved 7 May 2012. <http://www.aruplab.com/guides/ug/tests/0070390.jsp>
11. Conway JM, Birnbaum AK, Kriel RL, Cloyd JC. Relative bioavailability of topiramate administered rectally. Epilepsy Research. 2003; 54:91-96.
12. Topamax® (topiramate) [package insert]. Titusville, NJ: Janssen Pharmaceuticals, Inc.; January 2012.
13. Aronoff GR. 2007. Drug Prescribing in Renal Failure: Dosing Guidelines for Adults and Children. Philadel-phia: American College of Physicians.
14. Miles MV, Tang PH, et al. Topiramate Concentration in Saliva: An alternative to Serum Monitoring. Pedi-atric Neurology. 2003; 29(2):143-147.
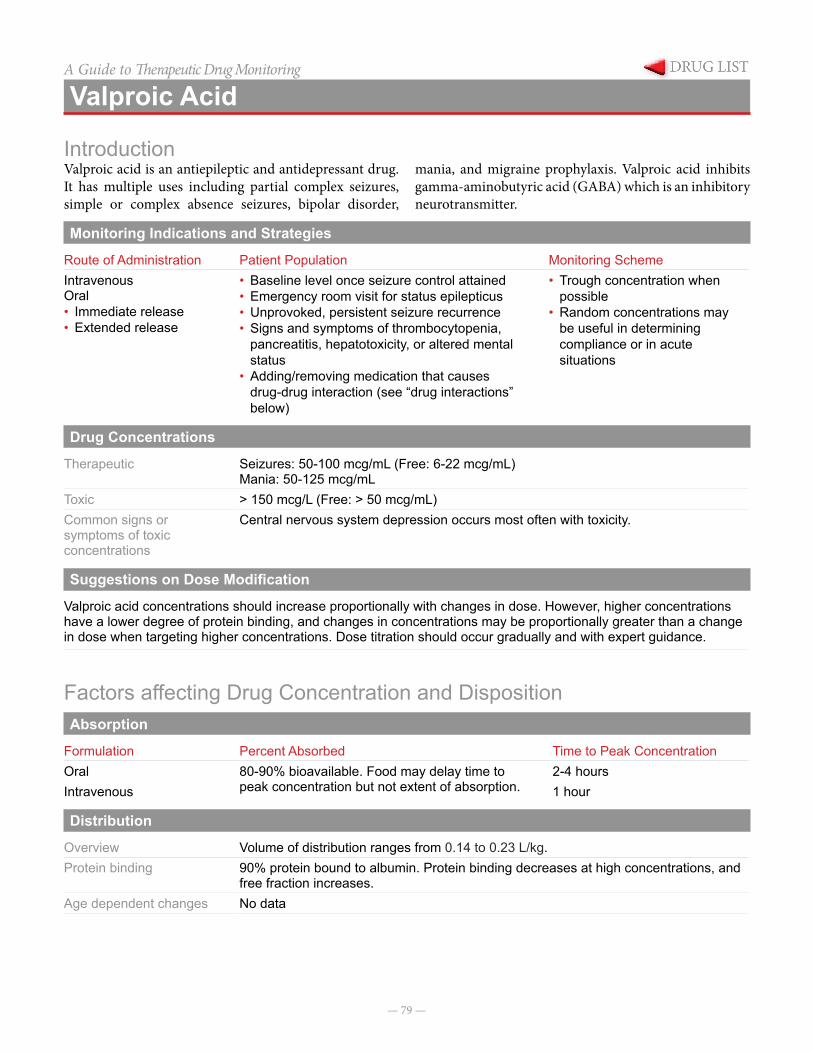
— 79 —
A Guide to Therapeutic Drug Monitoring
Valproic Acid
IntroductionValproic acid is an antiepileptic and antidepressant drug. It has multiple uses including partial complex seizures, simple or complex absence seizures, bipolar disorder,
mania, and migraine prophylaxis. Valproic acid inhibits gamma-aminobutyric acid (GABA) which is an inhibitory neurotransmitter.
Monitoring Indications and Strategies
Route of Administration Patient Population Monitoring SchemeIntravenousOral• Immediate release• Extended release
• Baseline level once seizure control attained• Emergency room visit for status epilepticus• Unprovoked, persistent seizure recurrence• Signs and symptoms of thrombocytopenia,
pancreatitis, hepatotoxicity, or altered mental status
• Adding/removing medication that causes drug-drug interaction (see “drug interactions” below)
• Trough concentration when possible
• Random concentrations may be useful in determining compliance or in acute situations
Drug Concentrations
Therapeutic Seizures: 50-100 mcg/mL (Free: 6-22 mcg/mL)Mania: 50-125 mcg/mL
Toxic > 150 mcg/L (Free: > 50 mcg/mL)Common signs or symptoms of toxic concentrations
Central nervous system depression occurs most often with toxicity.
Suggestions on Dose Modification
Valproic acid concentrations should increase proportionally with changes in dose. However, higher concentrations have a lower degree of protein binding, and changes in concentrations may be proportionally greater than a change in dose when targeting higher concentrations. Dose titration should occur gradually and with expert guidance.
Factors affecting Drug Concentration and DispositionAbsorption
Formulation Percent Absorbed Time to Peak ConcentrationOral 80-90% bioavailable. Food may delay time to
peak concentration but not extent of absorption.2-4 hours
Intravenous 1 hour
Distribution
Overview Volume of distribution ranges from 0.14 to 0.23 L/kg.Protein binding 90% protein bound to albumin. Protein binding decreases at high concentrations, and
free fraction increases.Age dependent changes No data
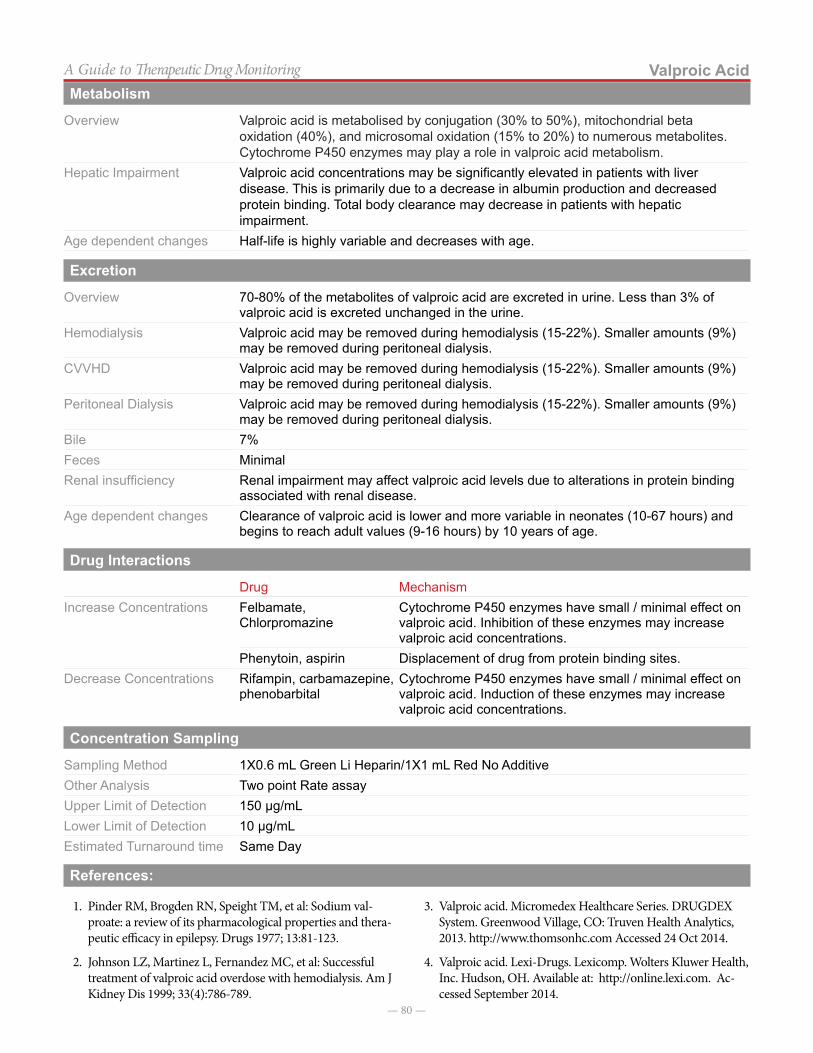
— 80 —
Valproic AcidA Guide to Therapeutic Drug MonitoringMetabolism
Overview Valproic acid is metabolised by conjugation (30% to 50%), mitochondrial beta oxidation (40%), and microsomal oxidation (15% to 20%) to numerous metabolites. Cytochrome P450 enzymes may play a role in valproic acid metabolism.
Hepatic Impairment Valproic acid concentrations may be significantly elevated in patients with liver disease. This is primarily due to a decrease in albumin production and decreased protein binding. Total body clearance may decrease in patients with hepatic impairment.
Age dependent changes Half-life is highly variable and decreases with age.
Excretion
Overview 70-80% of the metabolites of valproic acid are excreted in urine. Less than 3% of valproic acid is excreted unchanged in the urine.
Hemodialysis Valproic acid may be removed during hemodialysis (15-22%). Smaller amounts (9%) may be removed during peritoneal dialysis.
CVVHD Valproic acid may be removed during hemodialysis (15-22%). Smaller amounts (9%) may be removed during peritoneal dialysis.
Peritoneal Dialysis Valproic acid may be removed during hemodialysis (15-22%). Smaller amounts (9%) may be removed during peritoneal dialysis.
Bile 7%Feces Minimal Renal insufficiency Renal impairment may affect valproic acid levels due to alterations in protein binding
associated with renal disease.Age dependent changes Clearance of valproic acid is lower and more variable in neonates (10-67 hours) and
begins to reach adult values (9-16 hours) by 10 years of age.
Drug Interactions
Drug MechanismIncrease Concentrations Felbamate,
ChlorpromazineCytochrome P450 enzymes have small / minimal effect on valproic acid. Inhibition of these enzymes may increase valproic acid concentrations.
Phenytoin, aspirin Displacement of drug from protein binding sites.Decrease Concentrations Rifampin, carbamazepine,
phenobarbital Cytochrome P450 enzymes have small / minimal effect on valproic acid. Induction of these enzymes may increase valproic acid concentrations.
Concentration Sampling
Sampling Method 1X0.6 mL Green Li Heparin/1X1 mL Red No AdditiveOther Analysis Two point Rate assayUpper Limit of Detection 150 µg/mLLower Limit of Detection 10 µg/mLEstimated Turnaround time Same Day
References:
1. Pinder RM, Brogden RN, Speight TM, et al: Sodium val-proate: a review of its pharmacological properties and thera-peutic efficacy in epilepsy. Drugs 1977; 13:81-123.
2. Johnson LZ, Martinez L, Fernandez MC, et al: Successful treatment of valproic acid overdose with hemodialysis. Am J Kidney Dis 1999; 33(4):786-789.
3. Valproic acid. Micromedex Healthcare Series. DRUGDEX System. Greenwood Village, CO: Truven Health Analytics, 2013. http://www.thomsonhc.com Accessed 24 Oct 2014.
4. Valproic acid. Lexi-Drugs. Lexicomp. Wolters Kluwer Health, Inc. Hudson, OH. Available at: http://online.lexi.com. Ac-cessed September 2014.
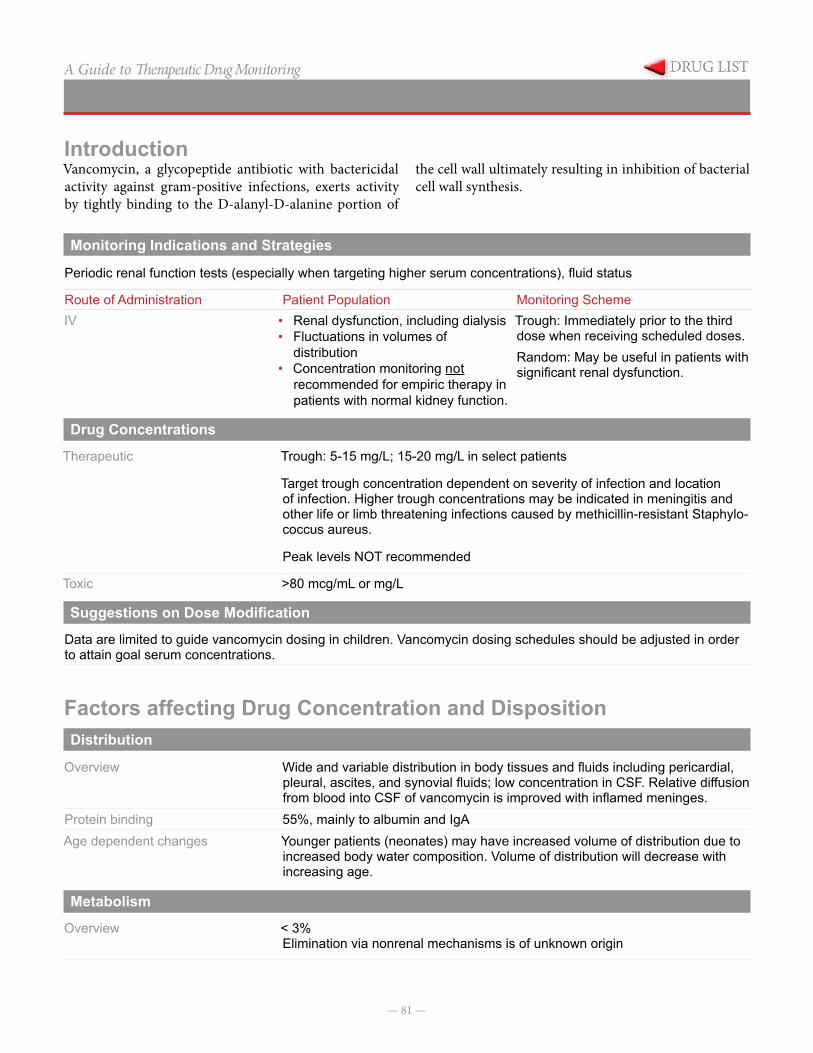
— 81 —
A Guide to Therapeutic Drug Monitoring
Vancomycin
IntroductionVancomycin, a glycopeptide antibiotic with bactericidal activity against gram-positive infections, exerts activity by tightly binding to the D-alanyl-D-alanine portion of
the cell wall ultimately resulting in inhibition of bacterial cell wall synthesis.
Monitoring Indications and Strategies
Periodic renal function tests (especially when targeting higher serum concentrations), fluid status
Route of Administration Patient Population Monitoring SchemeIV • Renal dysfunction, including dialysis
• Fluctuations in volumes of distribution
• Concentration monitoring not recommended for empiric therapy in patients with normal kidney function.
Trough: Immediately prior to the third dose when receiving scheduled doses.Random: May be useful in patients with significant renal dysfunction.
Drug Concentrations
Therapeutic Trough: 5-15 mg/L; 15-20 mg/L in select patients
Target trough concentration dependent on severity of infection and location of infection. Higher trough concentrations may be indicated in meningitis and other life or limb threatening infections caused by methicillin-resistant Staphylo-coccus aureus.
Peak levels NOT recommended
Toxic >80 mcg/mL or mg/L
Suggestions on Dose Modification
Data are limited to guide vancomycin dosing in children. Vancomycin dosing schedules should be adjusted in order to attain goal serum concentrations.
Factors affecting Drug Concentration and DispositionDistribution
Overview Wide and variable distribution in body tissues and fluids including pericardial, pleural, ascites, and synovial fluids; low concentration in CSF. Relative diffusion from blood into CSF of vancomycin is improved with inflamed meninges.
Protein binding 55%, mainly to albumin and IgAAge dependent changes Younger patients (neonates) may have increased volume of distribution due to
increased body water composition. Volume of distribution will decrease with increasing age.
Metabolism
Overview < 3% Elimination via nonrenal mechanisms is of unknown origin
— 82 —
VancomycinA Guide to Therapeutic Drug MonitoringExcretion
Overview Primarily via glomerular filtration; excreted as unchanged drug in the urine (80% to 90%)
HemodialysisCVVHDPeritoneal Dialysis
Poorly dialyzable by intermittent hemodialysis (0% to 5%); clearance can be variable in patients on CVVHD and PD and concentrations should be monitored closely.
Renal insufficiency Vancomycin levels should be monitored in renal impairment and doses should be given in response to concentration monitoring.
Age dependent changes Younger patients (neonates, preterm neonates) will exhibit decreased clearance due to renal immaturity.
Drug Interactions
Vancomycin serum concentrations may increases/decreases in response to the addition/discontinuation and sub-sequent renal function changes caused by other nephrotoxicity agents (e.g. aminoglycosides, colistimethate, and nonsteroidal anti-inflammatory agents).
Concentration Sampling
Sampling Method 1X0.6 mL Amber Microtainer with gel / 1X1mL Red /black SSTSample Type SerumOther Analysis Two Point RateUpper Limit of Detection 50 µg/mLLower Limit of Detection 5.0 µg/mLEstimated Turnaround time Same Day
Notes on Concentrations
Peak levels should not be performed.
Trough levels: Optimal sampling time: Infuse over 1 hour; levels warranted only when therapy has continued for > 72 hours or 5 half-lives and should be considered only if the patient has renal dysfunction or at the request of Infectious Diseases, Renal Service or a Clinical Pharmacy Specialist. Note: Vancomycin troughs should be obtained before the 4th dose in all cystic fibrosis patients.
Trough: Immediately prior to next maintenance dose Optimal serum concentration: NOTE: Target trough serum concentration may vary depending on organism, MIC, source of infection, and other patient factors.
Trough: 15-20 mcg/mL: for select patients with serious infections, such as bacteremia, infective endocarditis, osteomyelitis, meningitis, pneumonia, and severe SSTI caused by methicilllin-resistant Staphylococcus aureus. A vancomycin trough of 15-20 µg/mL in adults exhibits an AUC/MIC > 400 if the MIC of Staphylococcus aureus is < 1 µg/mL. Vancomycin trough concentrations in children of 7-10 µg/mL per simulation data were predictive of achieving an AUC/MIC > 400.
For select patients demonstrating clinical improvement (eg, bacteremia that has cleared), further dose adjustments to keep target trough 15-20 mcg/mL has not been proven beneficial.
— 83 —
VancomycinA Guide to Therapeutic Drug MonitoringReferences
1. Liu C, Bayer A, Cosgrove SE, et al. Clinical prac-tice guidelines by the Infectious Diseases Society of America for the treatment of methicillin-resis-tant Staphlococcus aureus infections in adults and children: executive summary. Clin Infect Dis. 2011; 52:282-292.
2. Frymoyer A, Guglielmo BJ, Hersh AL. Desired vancomycin trough serum concentration for treating invasive methicillin-resistant Staphylococcal infec-tions. Pediatr Infect Dis J. 2013 Oct: 32(10):1077-9.
3. de Hoog M, Mouton JW, and van den Anker JN, “Vancomycin: Pharmacokinetics and Administration Regimens in Neonates,” Clin Pharmacokinet, 2004, 43(7):417-40.
4. Marsot A, Boulamery A, Bruguerolle B, et al, “Van-comycin: A Review of Population Pharmacokinetic Analyses,” Clin Pharmacokinet, 2012, 51(1):1-13.
5. Aronoff GR, Bennett WM, Berns JS, et al, Drug Prescribing in Renal Failure: Dosing Guidelines for Adults and Children, 5th ed. Philadelphia, PA: Amer-ican College of Physicians; 2007, 154.
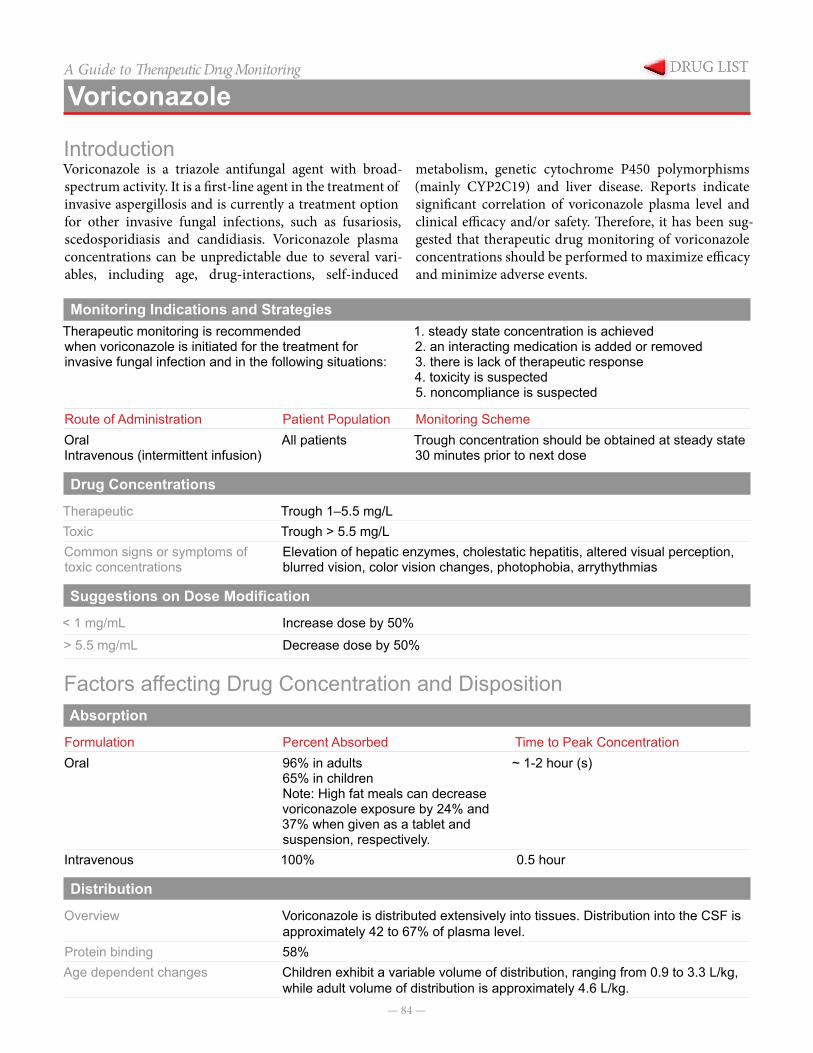
— 84 —
A Guide to Therapeutic Drug Monitoring
Voriconazole
IntroductionVoriconazole is a triazole antifungal agent with broad- spectrum activity. It is a first-line agent in the treatment of invasive aspergillosis and is currently a treatment option for other invasive fungal infections, such as fusariosis, scedosporidiasis and candidiasis. Voriconazole plasma concentrations can be unpredictable due to several vari-ables, including age, drug-interactions, self-induced
metabolism, genetic cytochrome P450 polymorphisms (mainly CYP2C19) and liver disease. Reports indicate significant correlation of voriconazole plasma level and clinical efficacy and/or safety. Therefore, it has been sug-gested that therapeutic drug monitoring of voriconazole concentrations should be performed to maximize efficacy and minimize adverse events.
Monitoring Indications and StrategiesTherapeutic monitoring is recommended when voriconazole is initiated for the treatment for invasive fungal infection and in the following situations:
1. steady state concentration is achieved2. an interacting medication is added or removed3. there is lack of therapeutic response4. toxicity is suspected5. noncompliance is suspected
Route of Administration Patient Population Monitoring SchemeOralIntravenous (intermittent infusion)
All patients Trough concentration should be obtained at steady state 30 minutes prior to next dose
Drug Concentrations
Therapeutic Trough 1–5.5 mg/LToxic Trough > 5.5 mg/LCommon signs or symptoms of toxic concentrations
Elevation of hepatic enzymes, cholestatic hepatitis, altered visual perception, blurred vision, color vision changes, photophobia, arrythythmias
Suggestions on Dose Modification
< 1 mg/mL Increase dose by 50%
> 5.5 mg/mL Decrease dose by 50%
Factors affecting Drug Concentration and DispositionAbsorption
Formulation Percent Absorbed Time to Peak ConcentrationOral 96% in adults
65% in childrenNote: High fat meals can decrease voriconazole exposure by 24% and 37% when given as a tablet and suspension, respectively.
~ 1-2 hour (s)
Intravenous 100% 0.5 hour
Distribution
Overview Voriconazole is distributed extensively into tissues. Distribution into the CSF is approximately 42 to 67% of plasma level.
Protein binding 58%Age dependent changes Children exhibit a variable volume of distribution, ranging from 0.9 to 3.3 L/kg,
while adult volume of distribution is approximately 4.6 L/kg.
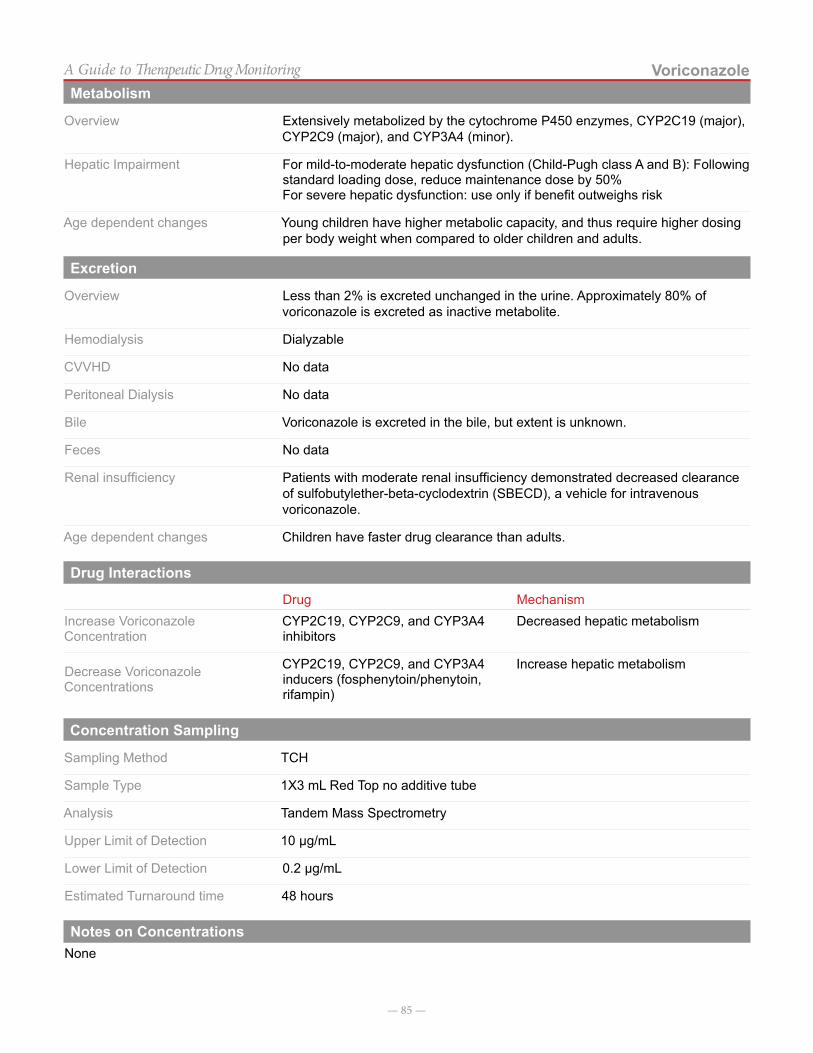
— 85 —
VoriconazoleA Guide to Therapeutic Drug MonitoringMetabolism
Overview Extensively metabolized by the cytochrome P450 enzymes, CYP2C19 (major), CYP2C9 (major), and CYP3A4 (minor).
Hepatic Impairment For mild-to-moderate hepatic dysfunction (Child-Pugh class A and B): Following standard loading dose, reduce maintenance dose by 50%For severe hepatic dysfunction: use only if benefit outweighs risk
Age dependent changes Young children have higher metabolic capacity, and thus require higher dosing per body weight when compared to older children and adults.
Excretion
Overview Less than 2% is excreted unchanged in the urine. Approximately 80% of voriconazole is excreted as inactive metabolite.
Hemodialysis Dialyzable
CVVHD No data
Peritoneal Dialysis No data
Bile Voriconazole is excreted in the bile, but extent is unknown.
Feces No data
Renal insufficiency Patients with moderate renal insufficiency demonstrated decreased clearance of sulfobutylether-beta-cyclodextrin (SBECD), a vehicle for intravenous voriconazole.
Age dependent changes Children have faster drug clearance than adults.
Drug Interactions
Drug MechanismIncrease Voriconazole Concentration
CYP2C19, CYP2C9, and CYP3A4 inhibitors
Decreased hepatic metabolism
Decrease Voriconazole Concentrations
CYP2C19, CYP2C9, and CYP3A4 inducers (fosphenytoin/phenytoin, rifampin)
Increase hepatic metabolism
Concentration Sampling
Sampling Method TCH
Sample Type 1X3 mL Red Top no additive tube
Analysis Tandem Mass Spectrometry
Upper Limit of Detection 10 µg/mL
Lower Limit of Detection 0.2 µg/mL
Estimated Turnaround time 48 hours
Notes on ConcentrationsNone
— 86 —
VoriconazoleA Guide to Therapeutic Drug MonitoringReferences
1. Chen J, Chan C, Calantonio D, and Seto W. Thera-peutic Drug Monitoring of Voriconazole in Children. Ther Drug Monit 2012; 34 (1):77–84.
2. Gerin M, Mahlaoui N, Elie C, et al. Therapeutic Drug Monitoring of Voriconazole After Intravenous Administration in Infants and Children With Prima-ry Immunodefiency. Ther Drug Monit 2011; 33 (4): 464– 466.
3. Michael C, Bierbach UU, et al. Voriconazole Phar-macokinetics and Safety in Immunocompromised Children Compared to Adult Patients. Antimicrobial Agents and Chemotherapy 2010; 54(8): 3225-3232.
4. Steinbach WE. Antifungal Agents in Children. Pedi-atr Clin N Am 2005; 52: 895–915.
5. Walsh TJ, Karlsson MO, et al. Pharmacokinetics and Safety of Intravenous Voriconazole in Children after Single- or Multiple-Dose Administration. Anti-microbial Agents and Chemotherapy 2004; 48(6): 2166-2172.
6. Walsh TJ, Driscoll T, et al Pharmacokinetics, Safety, and Tolerability of Voriconazole in Immunocompro-mised Children. Antimicrobial Agents and Chemo-therapy 2010; 54(10): 4116–4123.
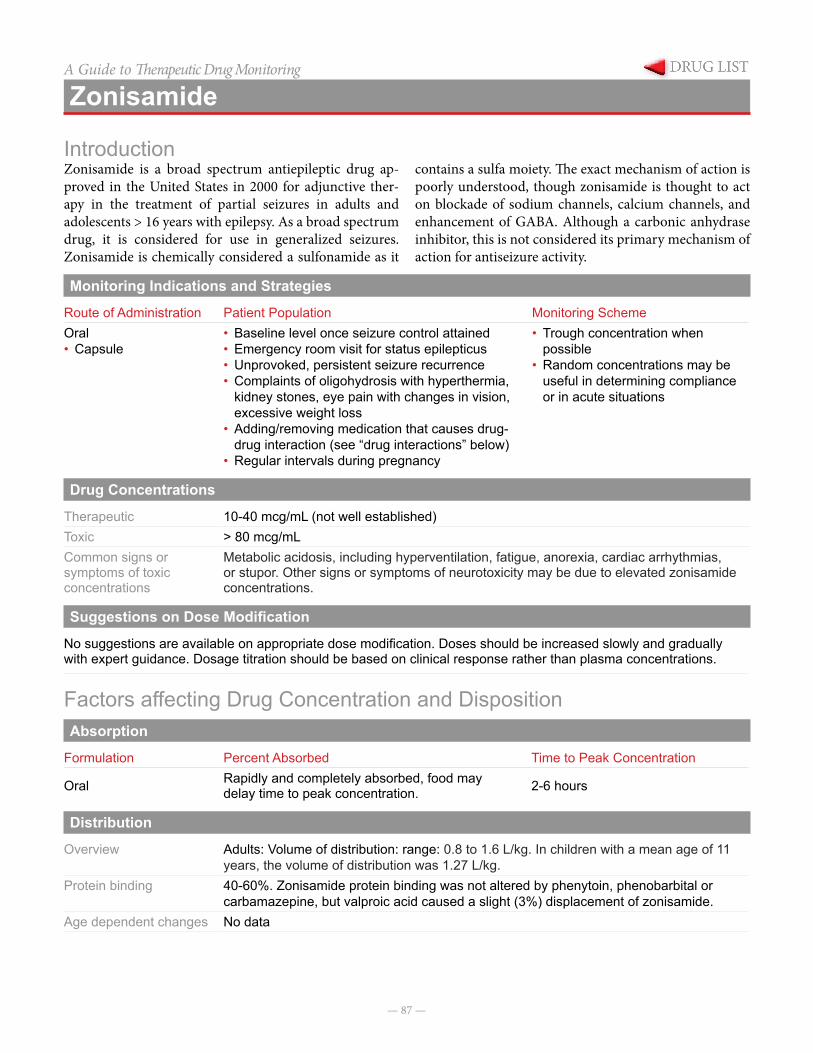
— 87 —
A Guide to Therapeutic Drug Monitoring
Zonisamide
IntroductionZonisamide is a broad spectrum antiepileptic drug ap-proved in the United States in 2000 for adjunctive ther-apy in the treatment of partial seizures in adults and adolescents > 16 years with epilepsy. As a broad spectrum drug, it is considered for use in generalized seizures. Zonisamide is chemically considered a sulfonamide as it
contains a sulfa moiety. The exact mechanism of action is poorly understood, though zonisamide is thought to act on blockade of sodium channels, calcium channels, and enhancement of GABA. Although a carbonic anhydrase inhibitor, this is not considered its primary mechanism of action for antiseizure activity.
Monitoring Indications and Strategies
Route of Administration Patient Population Monitoring SchemeOral• Capsule
• Baseline level once seizure control attained• Emergency room visit for status epilepticus• Unprovoked, persistent seizure recurrence• Complaints of oligohydrosis with hyperthermia,
kidney stones, eye pain with changes in vision, excessive weight loss
• Adding/removing medication that causes drug-drug interaction (see “drug interactions” below)
• Regular intervals during pregnancy
• Trough concentration when possible
• Random concentrations may be useful in determining compliance or in acute situations
Drug Concentrations
Therapeutic 10-40 mcg/mL (not well established)Toxic > 80 mcg/mL Common signs or symptoms of toxic concentrations
Metabolic acidosis, including hyperventilation, fatigue, anorexia, cardiac arrhythmias, or stupor. Other signs or symptoms of neurotoxicity may be due to elevated zonisamide concentrations.
Suggestions on Dose Modification
No suggestions are available on appropriate dose modification. Doses should be increased slowly and gradually with expert guidance. Dosage titration should be based on clinical response rather than plasma concentrations.
Factors affecting Drug Concentration and DispositionAbsorption
Formulation Percent Absorbed Time to Peak Concentration
Oral Rapidly and completely absorbed, food may delay time to peak concentration. 2-6 hours
Distribution
Overview Adults: Volume of distribution: range: 0.8 to 1.6 L/kg. In children with a mean age of 11 years, the volume of distribution was 1.27 L/kg.
Protein binding 40-60%. Zonisamide protein binding was not altered by phenytoin, phenobarbital or carbamazepine, but valproic acid caused a slight (3%) displacement of zonisamide.
Age dependent changes No data
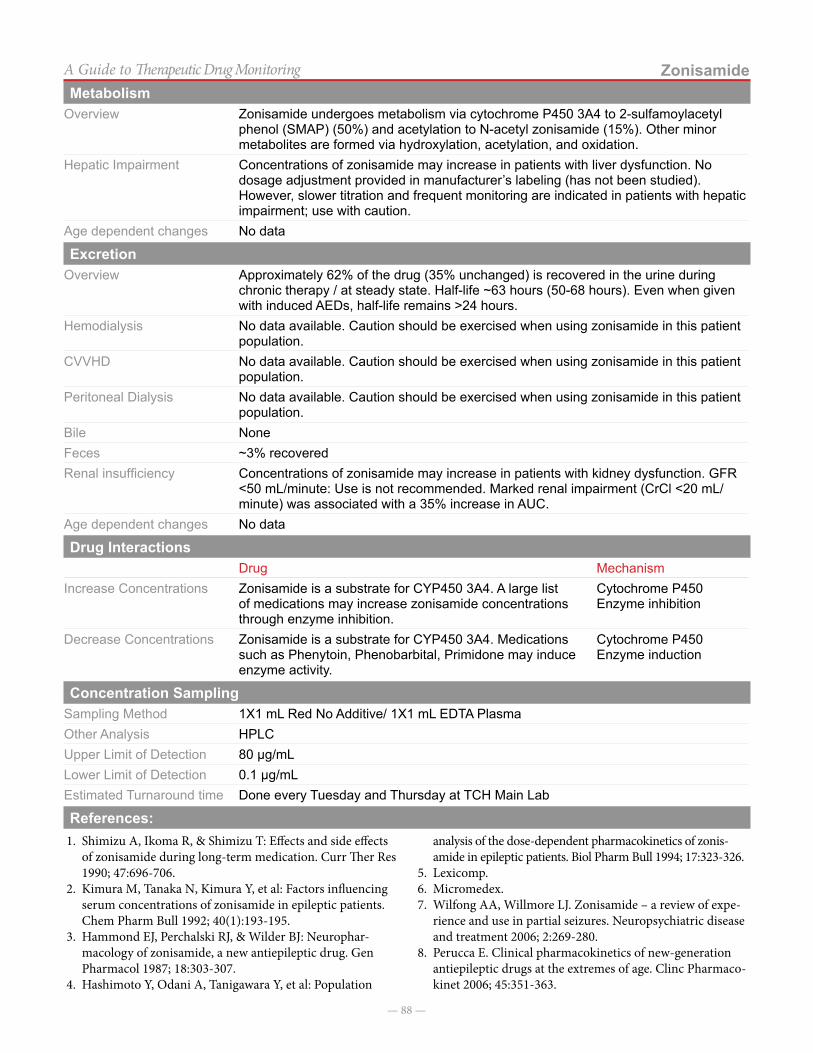
— 88 —
ZonisamideA Guide to Therapeutic Drug MonitoringMetabolism
Overview Zonisamide undergoes metabolism via cytochrome P450 3A4 to 2-sulfamoylacetyl phenol (SMAP) (50%) and acetylation to N-acetyl zonisamide (15%). Other minor metabolites are formed via hydroxylation, acetylation, and oxidation.
Hepatic Impairment Concentrations of zonisamide may increase in patients with liver dysfunction. No dosage adjustment provided in manufacturer’s labeling (has not been studied). However, slower titration and frequent monitoring are indicated in patients with hepatic impairment; use with caution.
Age dependent changes No data
ExcretionOverview Approximately 62% of the drug (35% unchanged) is recovered in the urine during
chronic therapy / at steady state. Half-life ~63 hours (50-68 hours). Even when given with induced AEDs, half-life remains >24 hours.
Hemodialysis No data available. Caution should be exercised when using zonisamide in this patient population.
CVVHD No data available. Caution should be exercised when using zonisamide in this patient population.
Peritoneal Dialysis No data available. Caution should be exercised when using zonisamide in this patient population.
Bile None Feces ~3% recoveredRenal insufficiency Concentrations of zonisamide may increase in patients with kidney dysfunction. GFR
<50 mL/minute: Use is not recommended. Marked renal impairment (CrCl <20 mL/minute) was associated with a 35% increase in AUC.
Age dependent changes No data
Drug InteractionsDrug Mechanism
Increase Concentrations Zonisamide is a substrate for CYP450 3A4. A large list of medications may increase zonisamide concentrations through enzyme inhibition.
Cytochrome P450 Enzyme inhibition
Decrease Concentrations Zonisamide is a substrate for CYP450 3A4. Medications such as Phenytoin, Phenobarbital, Primidone may induce enzyme activity.
Cytochrome P450 Enzyme induction
Concentration SamplingSampling Method 1X1 mL Red No Additive/ 1X1 mL EDTA PlasmaOther Analysis HPLCUpper Limit of Detection 80 µg/mLLower Limit of Detection 0.1 µg/mLEstimated Turnaround time Done every Tuesday and Thursday at TCH Main Lab
References:1. Shimizu A, Ikoma R, & Shimizu T: Effects and side effects
of zonisamide during long-term medication. Curr Ther Res 1990; 47:696-706.
2. Kimura M, Tanaka N, Kimura Y, et al: Factors influencing serum concentrations of zonisamide in epileptic patients. Chem Pharm Bull 1992; 40(1):193-195.
3. Hammond EJ, Perchalski RJ, & Wilder BJ: Neurophar-macology of zonisamide, a new antiepileptic drug. Gen Pharmacol 1987; 18:303-307.
4. Hashimoto Y, Odani A, Tanigawara Y, et al: Population
analysis of the dose-dependent pharmacokinetics of zonis-amide in epileptic patients. Biol Pharm Bull 1994; 17:323-326.
5. Lexicomp.6. Micromedex.7. Wilfong AA, Willmore LJ. Zonisamide – a review of expe-
rience and use in partial seizures. Neuropsychiatric disease and treatment 2006; 2:269-280.
8. Perucca E. Clinical pharmacokinetics of new-generation antiepileptic drugs at the extremes of age. Clinc Pharmaco-kinet 2006; 45:351-363.
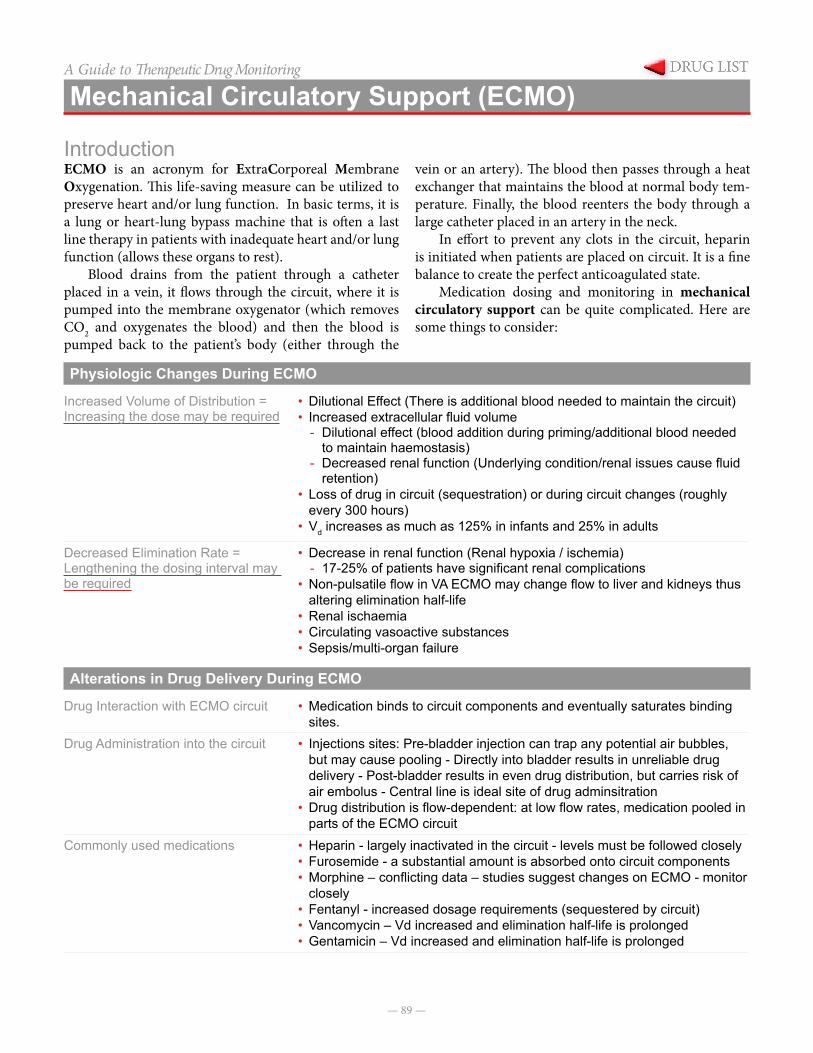
— 89 —
A Guide to Therapeutic Drug Monitoring
Mechanical Circulatory Support (ECMO)
IntroductionECMO is an acronym for ExtraCorporeal Membrane Oxygenation. This life-saving measure can be utilized to preserve heart and/or lung function. In basic terms, it is a lung or heart-lung bypass machine that is often a last line therapy in patients with inadequate heart and/or lung function (allows these organs to rest).
Blood drains from the patient through a catheter placed in a vein, it flows through the circuit, where it is pumped into the membrane oxygenator (which removes CO2 and oxygenates the blood) and then the blood is pumped back to the patient’s body (either through the
vein or an artery). The blood then passes through a heat exchanger that maintains the blood at normal body tem-perature. Finally, the blood reenters the body through a large catheter placed in an artery in the neck.
In effort to prevent any clots in the circuit, heparin is initiated when patients are placed on circuit. It is a fine balance to create the perfect anticoagulated state.
Medication dosing and monitoring in mechanical circulatory support can be quite complicated. Here are some things to consider:
Physiologic Changes During ECMO
Increased Volume of Distribution = Increasing the dose may be required
• Dilutional Effect (There is additional blood needed to maintain the circuit) • Increased extracellular fluid volume
- Dilutional effect (blood addition during priming/additional blood needed to maintain haemostasis)
- Decreased renal function (Underlying condition/renal issues cause fluid retention)
• Loss of drug in circuit (sequestration) or during circuit changes (roughly every 300 hours)
• Vd increases as much as 125% in infants and 25% in adults
Decreased Elimination Rate = Lengthening the dosing interval may be required
• Decrease in renal function (Renal hypoxia / ischemia) - 17-25% of patients have significant renal complications
• Non-pulsatile flow in VA ECMO may change flow to liver and kidneys thus altering elimination half-life
• Renal ischaemia• Circulating vasoactive substances• Sepsis/multi-organ failure
Alterations in Drug Delivery During ECMO
Drug Interaction with ECMO circuit • Medication binds to circuit components and eventually saturates binding sites.
Drug Administration into the circuit • Injections sites: Pre-bladder injection can trap any potential air bubbles, but may cause pooling - Directly into bladder results in unreliable drug delivery - Post-bladder results in even drug distribution, but carries risk of air embolus - Central line is ideal site of drug adminsitration
• Drug distribution is flow-dependent: at low flow rates, medication pooled in parts of the ECMO circuit
Commonly used medications • Heparin - largely inactivated in the circuit - levels must be followed closely• Furosemide - a substantial amount is absorbed onto circuit components• Morphine – conflicting data – studies suggest changes on ECMO - monitor
closely• Fentanyl - increased dosage requirements (sequestered by circuit)• Vancomycin – Vd increased and elimination half-life is prolonged• Gentamicin – Vd increased and elimination half-life is prolonged
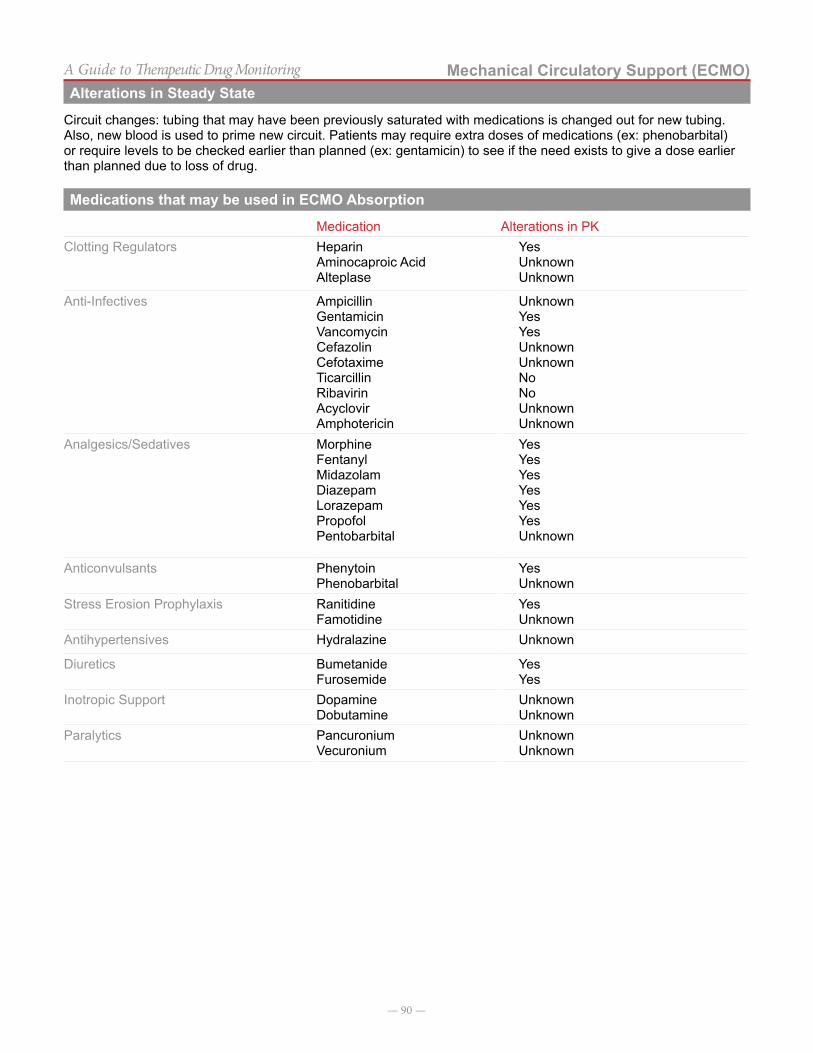
— 90 —
Mechanical Circulatory Support (ECMO)A Guide to Therapeutic Drug MonitoringAlterations in Steady State
Circuit changes: tubing that may have been previously saturated with medications is changed out for new tubing. Also, new blood is used to prime new circuit. Patients may require extra doses of medications (ex: phenobarbital) or require levels to be checked earlier than planned (ex: gentamicin) to see if the need exists to give a dose earlier than planned due to loss of drug.
Medications that may be used in ECMO Absorption
Medication Alterations in PKClotting Regulators Heparin
Aminocaproic Acid Alteplase
YesUnknownUnknown
Anti-Infectives Ampicillin GentamicinVancomycin Cefazolin CefotaximeTicarcillin RibavirinAcyclovir Amphotericin
UnknownYesYesUnknownUnknownNoNoUnknownUnknown
Analgesics/Sedatives MorphineFentanylMidazolamDiazepam Lorazepam Propofol Pentobarbital
YesYes Yes YesYesYes Unknown
Anticonvulsants Phenytoin Phenobarbital
Yes Unknown
Stress Erosion Prophylaxis RanitidineFamotidine
Yes Unknown
Antihypertensives Hydralazine Unknown
Diuretics BumetanideFurosemide
YesYes
Inotropic Support DopamineDobutamine
UnknownUnknown
Paralytics Pancuronium Vecuronium
UnknownUnknown
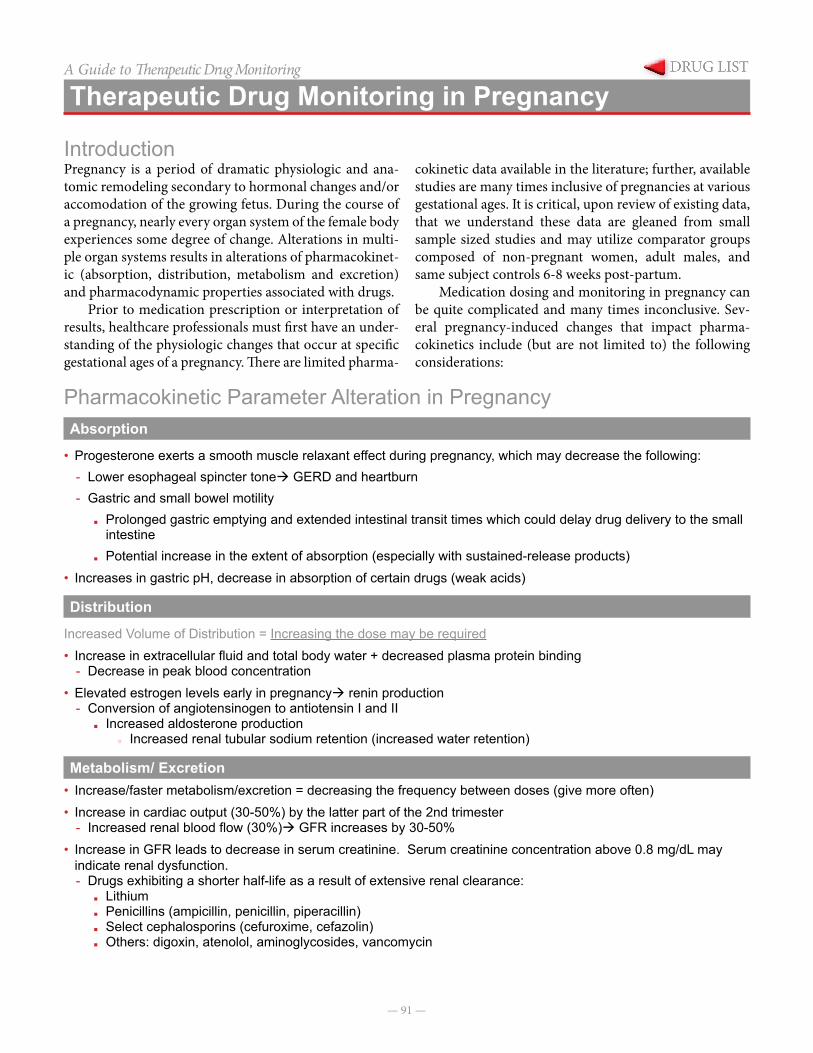
— 91 —
A Guide to Therapeutic Drug Monitoring
Therapeutic Drug Monitoring in Pregnancy
IntroductionPregnancy is a period of dramatic physiologic and ana-tomic remodeling secondary to hormonal changes and/or accomodation of the growing fetus. During the course of a pregnancy, nearly every organ system of the female body experiences some degree of change. Alterations in multi-ple organ systems results in alterations of pharmacokinet-ic (absorption, distribution, metabolism and excretion) and pharmacodynamic properties associated with drugs.
Prior to medication prescription or interpretation of results, healthcare professionals must first have an under-standing of the physiologic changes that occur at specific gestational ages of a pregnancy. There are limited pharma-
cokinetic data available in the literature; further, available studies are many times inclusive of pregnancies at various gestational ages. It is critical, upon review of existing data, that we understand these data are gleaned from small sample sized studies and may utilize comparator groups composed of non-pregnant women, adult males, and same subject controls 6-8 weeks post-partum.
Medication dosing and monitoring in pregnancy can be quite complicated and many times inconclusive. Sev-eral pregnancy-induced changes that impact pharma-cokinetics include (but are not limited to) the following considerations:
Pharmacokinetic Parameter Alteration in PregnancyAbsorption
• Progesterone exerts a smooth muscle relaxant effect during pregnancy, which may decrease the following: - Lower esophageal spincter tone GERD and heartburn - Gastric and small bowel motility
■ Prolonged gastric emptying and extended intestinal transit times which could delay drug delivery to the small intestine
■ Potential increase in the extent of absorption (especially with sustained-release products)• Increases in gastric pH, decrease in absorption of certain drugs (weak acids)
Distribution
Increased Volume of Distribution = Increasing the dose may be required• Increase in extracellular fluid and total body water + decreased plasma protein binding
- Decrease in peak blood concentration• Elevated estrogen levels early in pregnancy renin production
- Conversion of angiotensinogen to antiotensin I and II ■ Increased aldosterone production
○ Increased renal tubular sodium retention (increased water retention)
Metabolism/ Excretion• Increase/faster metabolism/excretion = decreasing the frequency between doses (give more often)• Increase in cardiac output (30-50%) by the latter part of the 2nd trimester
- Increased renal blood flow (30%) GFR increases by 30-50%• Increase in GFR leads to decrease in serum creatinine. Serum creatinine concentration above 0.8 mg/dL may
indicate renal dysfunction. - Drugs exhibiting a shorter half-life as a result of extensive renal clearance:
■ Lithium ■ Penicillins (ampicillin, penicillin, piperacillin) ■ Select cephalosporins (cefuroxime, cefazolin) ■ Others: digoxin, atenolol, aminoglycosides, vancomycin
Pregnancy
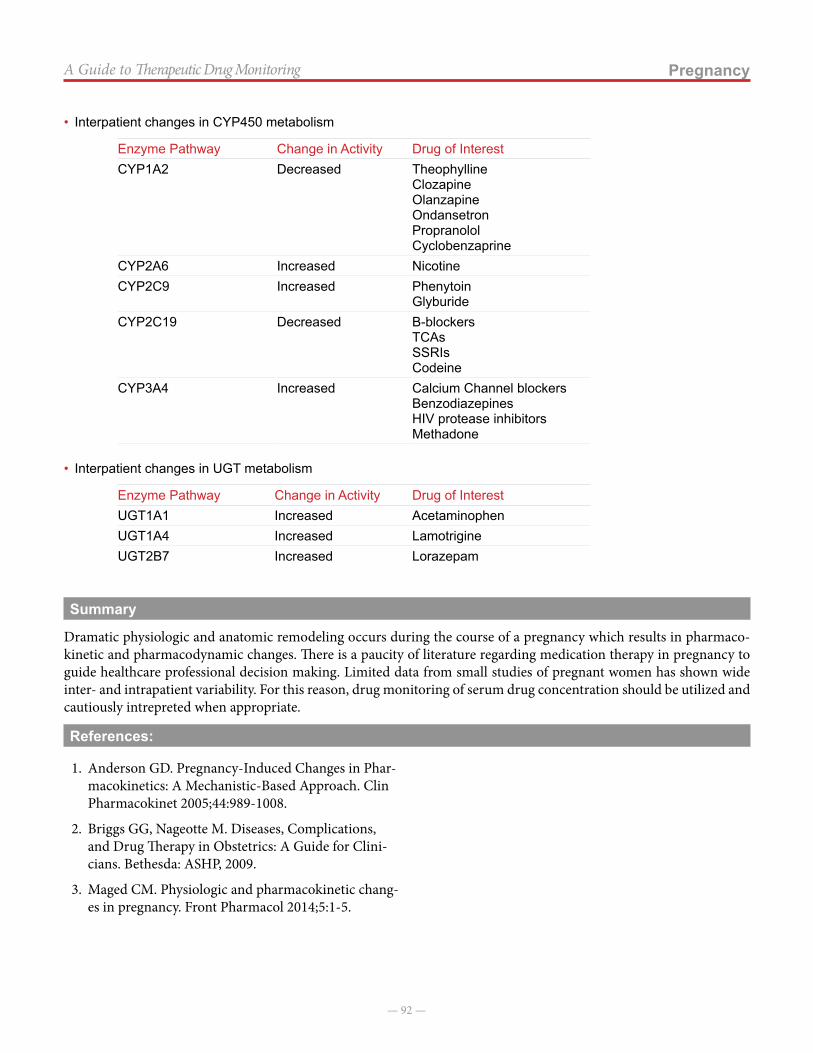
— 92 —
PregnancyA Guide to Therapeutic Drug Monitoring
• Interpatient changes in CYP450 metabolism
Enzyme Pathway Change in Activity Drug of InterestCYP1A2 Decreased Theophylline
ClozapineOlanzapineOndansetronPropranololCyclobenzaprine
CYP2A6 Increased NicotineCYP2C9 Increased Phenytoin
GlyburideCYP2C19 Decreased Β-blockers
TCAsSSRIsCodeine
CYP3A4 Increased Calcium Channel blockersBenzodiazepinesHIV protease inhibitorsMethadone
• Interpatient changes in UGT metabolism
Enzyme Pathway Change in Activity Drug of InterestUGT1A1 Increased AcetaminophenUGT1A4 Increased LamotrigineUGT2B7 Increased Lorazepam
Summary
Dramatic physiologic and anatomic remodeling occurs during the course of a pregnancy which results in pharmaco-kinetic and pharmacodynamic changes. There is a paucity of literature regarding medication therapy in pregnancy to guide healthcare professional decision making. Limited data from small studies of pregnant women has shown wide inter- and intrapatient variability. For this reason, drug monitoring of serum drug concentration should be utilized and cautiously intrepreted when appropriate.
References:
1. Anderson GD. Pregnancy-Induced Changes in Phar-macokinetics: A Mechanistic-Based Approach. Clin Pharmacokinet 2005;44:989-1008.
2. Briggs GG, Nageotte M. Diseases, Complications, and Drug Therapy in Obstetrics: A Guide for Clini-cians. Bethesda: ASHP, 2009.
3. Maged CM. Physiologic and pharmacokinetic chang-es in pregnancy. Front Pharmacol 2014;5:1-5.