A Hybrid Legal and Economic Development Model that...
66
A Hybrid Legal and Economic Development Model that Balances Intellectual Property Protection and Economic Growth: A Case Study of India, Brazil, Indonesia, and Vietnam Garrett Halydier * INTRODUCTION .......................................................................................... 87 I. SURVEYING THE LEGAL AND ECONOMIC LITERATURE ......................... 92 A. Legal Literature on the Relationship Between IPR Regime Strength and Economic Growth and Industry Development in Developing Countries ............................................................................................... 93 1. Summary of the Legal Analysis of the Connections Between IPR Regime Strength and Economic Growth .......................................... 93 2. The United States as an Analytical Example of the Connections Between IPR Regime Strength and Economic Growth .................... 95 3. TRIPS Compliance and Developing Countries.......................... 96 B. Economic Literature on the Relationship Between IPR Regime Strength and Economic Growth and Industry Development in Developing Countries ........................................................................... 98 1. Foreign Direct Investment .......................................................... 99 2. Technology Transfer ................................................................. 100 3. Economic Development ........................................................... 101 4. The Pharmaceutical Industry.................................................... 102 5. The U-Shaped Curves .............................................................. 104 II. SYNTHESIZING A PRESCRIPTIVE MODEL RELATING IPR REGIME STRENGTH TO THE LEVEL OF ECONOMIC DEVELOPMENT IN LEAST DEVELOPED AND DEVELOPING COUNTRIES ....................................... 105 A. The Gibbons Prescriptive Legal Model ....................................... 105 B. The Chen, Puttitanun, and Qian U-Shaped Economic Model ..... 108 C. Synthesizing the Hybrid Model .................................................... 110 D. Extending the Hybrid Model: The Stagnation Stage ................... 112 E. Applying the Hybrid Model to the Pharmaceutical Industry ....... 115 1. The Dissemination Stage.......................................................... 115 2. The Absorption Stage ............................................................... 116 3. The Innovation Stage ............................................................... 116 * Garrett Halydier is a J.D. Candidate in the William S. Richardson School of Law at the University of Hawai‘i. He has an MBA in International Business and a B.S. in Math and History from Liberty University. The author would like to thank Professor Sayoko Blodgett-Ford for her subject-matter expertise, insight, and frequent content reviews, as well as the APLPJ editing team for their excellent advice and meticulous Bluebooking.
Transcript of A Hybrid Legal and Economic Development Model that...

A Hybrid Legal and Economic Development Model that Balances Intellectual Property Protection and Economic Growth: A Case Study of India, Brazil,
Indonesia, and Vietnam
Garrett Halydier*
INTRODUCTION .......................................................................................... 87 I. SURVEYING THE LEGAL AND ECONOMIC LITERATURE ......................... 92
A. Legal Literature on the Relationship Between IPR Regime Strength and Economic Growth and Industry Development in Developing Countries ............................................................................................... 93
1. Summary of the Legal Analysis of the Connections Between IPR Regime Strength and Economic Growth .......................................... 93 2. The United States as an Analytical Example of the Connections Between IPR Regime Strength and Economic Growth .................... 95 3. TRIPS Compliance and Developing Countries .......................... 96
B. Economic Literature on the Relationship Between IPR Regime Strength and Economic Growth and Industry Development in Developing Countries ........................................................................... 98
1. Foreign Direct Investment .......................................................... 99 2. Technology Transfer ................................................................. 100 3. Economic Development ........................................................... 101 4. The Pharmaceutical Industry .................................................... 102 5. The U-Shaped Curves .............................................................. 104
II. SYNTHESIZING A PRESCRIPTIVE MODEL RELATING IPR REGIME STRENGTH TO THE LEVEL OF ECONOMIC DEVELOPMENT IN LEAST
DEVELOPED AND DEVELOPING COUNTRIES ....................................... 105 A. The Gibbons Prescriptive Legal Model ....................................... 105 B. The Chen, Puttitanun, and Qian U-Shaped Economic Model ..... 108 C. Synthesizing the Hybrid Model .................................................... 110 D. Extending the Hybrid Model: The Stagnation Stage ................... 112 E. Applying the Hybrid Model to the Pharmaceutical Industry ....... 115
1. The Dissemination Stage .......................................................... 115 2. The Absorption Stage ............................................................... 116 3. The Innovation Stage ............................................................... 116
*Garrett Halydier is a J.D. Candidate in the William S. Richardson School of
Law at the University of Hawai‘i. He has an MBA in International Business and a B.S. in Math and History from Liberty University. The author would like to thank Professor Sayoko Blodgett-Ford for her subject-matter expertise, insight, and frequent content reviews, as well as the APLPJ editing team for their excellent advice and meticulous Bluebooking.

2012 Halydier 87
4. The Stagnation Stage ................................................................ 116
III. CORROBORATING THE MODEL: THE CASES OF INDIA, BRAZIL, INDONESIA, AND VIETNAM ................................................................. 117
A. India ............................................................................................. 117 1. History ...................................................................................... 117 2. Data .......................................................................................... 119 3. Analysis .................................................................................... 122
B. Brazil ............................................................................................ 122 1. History ...................................................................................... 123 2. Data .......................................................................................... 123 3. Analysis .................................................................................... 127
C. Indonesia ...................................................................................... 128 1. History ...................................................................................... 129 2. Data .......................................................................................... 130 3. Analysis .................................................................................... 132
D. Vietnam ........................................................................................ 136 1. History ...................................................................................... 136 2. Data .......................................................................................... 137 3. Analysis .................................................................................... 140
E. Summary of Results and Lessons for Developing Countries ....... 141
CONCLUSION: FUTURE RESEARCH AND POLICIES .................................... 142 A. Future Research ........................................................................... 142 B. Policy Conclusions for the U.S. and Other Developed Countries 143
APPENDIX A ............................................................................................. 146
APPENDIX B ............................................................................................. 148
APPENDIX C ............................................................................................. 151
INTRODUCTION
Industrialized countries are using the Agreement on Trade Related Aspects of Intellectual Property Rights (“TRIPS”)1 to harmonize
1 TRIPS was negotiated at the end of the Uruguay Round of the General Agreement on Tariffs and Trade (“GATT”) in 1994 and is administered by the World Trade Organization (“WTO”). Thomas F. Cotter, Market Fundamentalism and the TRIPS Agreement, 22 CARDOZO ARTS & ENT. L.J. 307, 307-08 (2004). TRIPS requires that parties to the WTO implement and enforce domestic IP laws that meet specific standards in the areas of trademarks, copyrights, patents, trade secrets, geographical designations, layout designs of integrated circuits, and industrial designs. Kevin Kennedy, The 2005 TRIPS Extension for the Least-Developed Countries: A Failure of the Single Undertaking Approach, 40 INT’L LAW 683, 683 (2006).
Developing countries (see infra note 5) that were members of GATT before 1994 were given until the year 2000 (extended to 2005 if a country did not have patent protection before 1995) to make their domestic IPR regimes TRIPS compliant. Least

88 Asian-Pacific Law & Policy Journal Vol. 14:1
international intellectual property rights (“IPR”)2 regimes. Their goal is to make it easier and more affordable for their own domestic corporations to operate globally without fear of rampant piracy or the burden of meeting different requirements for IPR protection in every new market.3 Often found leading the charge, the pharmaceutical industry dedicates substantial resources toward lobbying industrialized governments to enforce the terms of TRIPS in developing and least developed countries (“LDC”).4 In particular, the United States pharmaceutical industry has long been among the chief proponents for using Section 301 of the Trade Act of 1974 (“Special 301”) to pressure developing countries into strengthening their IPR regimes.5 Although dozens of countries have been placed on the Special 301 Watch List6 over the years, countries with emerging domestic Developed Countries (infra note 5) that were members of GATT before 1994 were given an extension until 2013 (2016 for pharmaceutical patent laws), with the possibility of future extensions, to make their domestic IPR regimes TRIPS compliant. New members to the WTO have generally agreed to apply TRIPS requirements from the date they become official members of the WTO. See World Trade Organization, Frequently Asked Questions About TRIPS (last visited November 10, 2012), http://www.wto.org/english/tratop_e/trips_e/tripfq_e.htm#WIPO.
2 For the purposes of this paper, “intellectual property rights” refers to any number of protectable innovative activities that have the potential to greatly affect the economy of LDC or developing countries, including those protectable by patent, trademark, license, and copyright. However, the empirical analysis in this paper will focus specifically on innovative activities that are protected by patents, such as pharmaceutical research, because of the vastly better quality and availability of data. See Yongmin Chen & Thitima Puttitanun, Intellectual Property Rights and Innovation in Developing Countries, 78 J. OF DEV. ECONS. 474, 475-76 (2005); Walter G. Park & Douglas C. Lippoldt, Technology Transfer and the Economic Implications of the Strengthening of Intellectual Property Rights in Developing Countries, 21-22 (Org. for Econ. Co-operation & Dev., Working Paper No. 62, 2008), available at http://dx.doi.org/10.1787/244764462745.
3 Cotter, supra note 1, at 307-08. 4 Pervez N. Ghauri and P.M. Rao, Intellectual Property, Pharmaceutical MNE’s
and the Developing World, 44 J. OF WORLD BUS. 206, 206-07 (2009). 5 Robert Weissman, A Long, Strange Trips: The Pharmaceutical Industry Drive
to Harmonize Global Intellectual Property Rules, and the Remaining WTO Legal Alternatives Available to Third World Countries, 17 U. PA. J. INT’L ECON. L. 1069, 1078 (1996).
6 Under Special 301, the United States Trade Representative (“USTR”), advised by private groups such as the Pharmaceutical Research and Manufacturers Association (“PRMA”), the International Intellectual Property Alliance (“IIPA”), and the Business Software Alliance (“BSA”), can (1) classify countries into one of three categories depending on the degree of “onerous or egregious acts, policies, or practices that deny adequate and effective intellectual property rights,” 19 U.S.C. 2242 (b)(1)(A)(i)(ii), (2) publish their names and violations on the “Special 301 Watch List”, and (3) implement economic sanctions against them, David Fidler, Neither Science Nor Shamans: Globalization of Markets and Health in the Developing World, 7 IND. J. GLOBAL LEGAL STUD. 191, 194 (1999).
2012 Halydier 89
pharmaceutical industries that have the potential to challenge the U.S. pharmaceutical industry; such as India, Brazil, Indonesia, and Vietnam; have been the primary targets of sanction threats.7
Developed countries continue to push for a homogenized global IPR regime that will protect their multi-national enterprises (“MNE”). Meanwhile, LDC and developing countries have their own political and economic realities to address as they seek to enter the world economic order.8 These countries desperately need Foreign Direct Investment (“FDI”)9 and international Technology Transfers10 to promote their
7 Weissman, supra note 5. 8 Kennedy, supra note 1, at § II. LDC are classified by the UN and WTO as
having low income per capita, weak human capital resources, high economic vulnerability, and low economic diversification. Any non-LDC is classified as either a developing country or developed country by self-election upon ascension to the WTO.
9 For the purposes of this paper, FDI includes investments in a country by foreign citizens, organizations, and governments but not portfolio investments. Specifically, FDI is "an investment involving a long-term relationship and reflecting a lasting interest of a resident entity in one economy (direct investor) in an entity resident in an economy other than of the investor. The direct investor's purpose is to exert a significant degree of influence on the management of the enterprise resident in the other economy. FDI involves both the initial transaction between the two entities and all subsequent transactions between them and among affiliated enterprises, both incorporated and unincorporated. FDI may be undertaken by individuals, as well as business entities.” See U.N. Conference on Trade and Development Secretary-General, World Investment Directory Volume VIII: Central and Eastern Europe, 65, U.N. Doc. UNCTAD/ITE/IIT/2003/2 (March 2003), available at http://unctad.org/en/Docs/iteiit20032_en.pdf.
10 For the purposes of this paper, “technology transfers” include any technology acquired by LDC or developing countries through market-based channels such as licensing, exports, FDI, and intra-firm trade with subsidiaries and affiliates, or through non-market-based channels such as reverse engineering and imitation of otherwise protected or proprietary technologies. MNEs and developed countries prefer market-based transfers of technology to LDC and developing countries with strong intellectual property regimes, as these methods allow MNEs to retain control of their proprietary technologies. Historically, many LDC and developing countries have benefitted when their own weak IPR regimes allowed for non-market-based transfers of technology. EMMANUEL HASSAN ET AL., INTELLECTUAL PROPERTY AND DEVELOPING COUNTRIES: A REVIEW OF THE LITERATURE, xv (RAND Europe 2010), available at http://www.rand.org/pubs/technical_reports/2010/RAND_TR804.pdf; see e.g. Jennifer Tann, Technology Transfer, Getting from Here to There: From “Know How” to “How To,” 21 INTERDISC. SCI. REV 215, 217-18 (1996) (discussing America’s acquisition of industrial textile technology from Britain [industrial espionage]); see e.g. Janice M. Mueller, The Tiger Awakens: The Tumultuous Transformation of India’s Patent System and the Rise of Indian Pharmaceutical Innovation, 68 U. PITT. L. REV. 491, 513-14 (2007) (discussing the initial technologies and products of India’s pharmaceutical industry [imitation]); see Kathryn Steen, Confiscated Commerce: American Importers of German Synthetic Organic Chemicals, 1914-1919, 12 HIST & TECH: AN INT’L J. 261 (1995) (discussing America’s creation of a synthetic chemical industry using the import businesses of German expatriates confiscated during World War I [confiscated commerce]); see Anja Breitwieser & Neil Foster, Intellectual Property Rights, Innovation

90 Asian-Pacific Law & Policy Journal Vol. 14:1
growth.11 They must simultaneously provide IPR regimes that are sufficiently TRIPS compliant to encourage FDI and technology transfer, yet remain weak and locally preferential enough to encourage the growth of the domestic industries essential to the creation of a sustainable economy.12
The cases of India, Brazil, Indonesia, and Vietnam illustrate the potential outcomes of different responses to the tension between international obligations, IPR regime strength, and economic growth. India successfully resisted decades of international pressure to implement a stronger IPR regime and emerged as a world-leading supplier of affordable generic drugs.13 Meanwhile, both Brazil and Indonesia bowed to international pressure to implement stronger IPR protections, and both countries continue to struggle to maintain their once promising domestic pharmaceutical industries.14 Vietnam currently stands on the cusp of rapid economic transition.15 Prematurely implementing stronger IPR protections will significantly impact the success or failure of that transition.16 These cases highlight the importance of properly balancing economic growth and IPR regime strength for LDC and developing countries currently pursuing entry into the global economic order.
A growing body of legal and economic research over the last decade focuses on how to manage the contrary policy goals of developed and developing countries. This research examines when, how much, of
and Technology Transfer: A Survey 12-13 (The Vienna Institute for International Economic Studies, Working Paper No. 88, 2012), available at http://wiiw.ac.at/?action=publ&id=details&publ=WP88 (discussing Japan’s rapid creation of a world-class, technology production industry [reverse engineering of products and industrial processes]).
11 Kennedy, supra note 1, at § III. 12 Kennedy, supra note 1, at § IV; Keith E. Maskus, The Role of Intellectual
Property Rights in Encouraging Foreign Direct Investment and Technology Transfer, 9 DUKE J. COMP. & INT’L L. 109, 112-13 (2004) [hereinafter Maskus, Role of Intellectual Property Rights]; Lee Petherbridge, Intelligent Trips Implementation: A Strategy for Countries on the Cusp of Development, 22 U. PA. J. INT’L ECON. L. 1029, 1037-47 (2001); United Nations Ministerial Conference of the Least Developed Countries, Istanbul, Turk., July 9-11, 2007, Globalization and the Least Developed Countries: Issues in Technology, available at http://www.unohrlls.org/UserFiles/File/LDC%20Documents/Turkey/Technology-Final.pdf [hereinafter Globalization].
13 Mueller, supra note 10, at 495-96. 14 Weissman, supra note 5; Charles Gielen, New Copyright Law of Indonesia –
Implications for Future Investment, 10 EUR. INTELL. PROP. REV 101, 102 (1988). 15 Lory Nguyen, International Perspective: Vietnam’s 2005 Accession Bid to the
WTO: The Harmful Effects Facing Less Developed Countries, 6 J.L. & SOC. CHALLENGES 131, 132-33 (2004).
16 See infra Part III.D.

2012 Halydier 91
what type, and for which industries developing countries should expand or reduce their IPR protections. This body of research also analyzes the effects of different levels of IPR protection on economic growth in LDC and developing countries, as well as those countries’ ability to attract FDI and technology transfer. Despite the abundance of literature on the subject of economic growth in LDC and developing countries, these studies tend to remain within the bounds of either the legal or economic discipline. Very few articles weave together the legal and economic literature in an interdisciplinary analysis with the intent of making policy recommendations for LDC, developing countries, and developed countries. Ideally, such policy recommendations would adequately balance the perceived conflict of interests of economic growth for the domestic industries of LDC and developing countries and sufficient IPR protections for the domestic industries of developed countries.
This paper seeks to contribute to the growing body of legal and economic research on the subject by combining insights from both disciplines to create a hybrid model that examines the relationship between the strength of a country’s IPR protections and its level of economic development over time. This hybrid model will be used to analyze whether or not implementing different levels of IPR protections at varying stages of economic development has the potential to enhance or stagnate economic growth in LDC and developing countries. While this paper lacks the scope to comprehensively establish the appropriate level of IPR protection for a developing country, it will attempt to expand the conversation in two important ways. First, this paper will exemplify a process for integrating the exceptional theoretical and case analysis of legal literature with the rigorous empirical and statistical analysis of economic literature. Second, this paper will develop a hybrid of the empirical economic and theoretical legal models and apply it to the cases of India, Brazil, Indonesia, and Vietnam to show that implementing an improper level of IPR protections during certain phases of economic development can stagnate economic growth in LDC and developing countries.
Part I examines the legal and economic literature identifying the theoretical and statistical relationships that exist between the strength of a country’s IPR regimes and various indicators of a country’s economic development, such as FDI, technology transfer, Gross Domestic Product (“GDP”) growth, and domestic industry development. Part II synthesizes the aforementioned legal and economic literature and proposes a prescriptive hybrid model that describes the proper level of IPR protections LDC or developing countries should implement throughout the three stages of economic growth before reaching full industrialization: the dissemination stage, the absorption stage, and the innovation stage.17 The
17 Llewellyn Joseph Gibbons, Do as I Say (Not as I Did): Putative Intellectual

92 Asian-Pacific Law & Policy Journal Vol. 14:1
hybrid model predicts that LDC or developing countries may stagnate if they violate the proper balance between IPR regime strength and the level of economic development as measured by GDP per capita (stagnation stage).18 Part III uses economic and legal case studies of India, Brazil, and Indonesia to corroborate the hybrid model, and a similar case study of Vietnam to predict a possible future that could verify the hybrid model’s predictive viability. It then summarizes the results of each case study. While the hybrid model will be developed and applied at a national level, the pharmaceutical industry will be utilized throughout the paper to demonstrate the effects that different ratios of economic development and IPR protections may induce at the industry level. The paper concludes with suggestions for future research and policy recommendations for both developed and developing countries.
I. SURVEYING THE LEGAL AND ECONOMIC LITERATURE
There are growing bodies of legal and economic literature addressing the manifold effects of varying levels of IPR protections on developing countries;19 however, these disciplines rarely interact on a substantive level.20 This section will review the current literature in each discipline to create a conversation between the prescriptive legal analysis and the descriptive economic models. This conversation will yield a prescriptive hybrid model that offers new insights into the current plight of developing countries: countries torn between international obligations to strengthen their IPR regimes and the simultaneous need to enact policies that favor their domestic industries in order to foster sustainable economic growth.
Property Lessons for Emerging Economies from the Not So Long Past of the Developed Nations, 64 SMU L. REV. 923, 931-35 (2011).
18 Chen & Puttitanun, supra note 2, at 477. 19 Keith E. Maskus, Intellectual Property Challenges for Developing Countries:
An Economic Perspective, 2001 U. ILL. L. REV. 457, 458-59 (2001) [hereinafter Maskus, Intellectual Property Challenges]; HASSAN ET AL., supra note 10, at xiii.
20 There are exceptions to this observation. For instance Dr. Keith E. Maskus, an economist at the University of Colorado, Boulder, CO, has written on both the legal and economic aspects of TRIPS and IPR protections in developing countries for over twenty years. However, he notes that the conversation between the two disciplines remains small. See Keith E. Maskus, Lessons From Studying the International Economics of Intellectual Property Rights, 53 VAND. L. REV 2219, 2220, 2225-26 (2000); see, e.g. Matthew Turk, Note: Bargaining and Intellectual Property Treaties: The Case for a Pro-Development Interpretation of TRIPS but Not TRIPS Plus, 42 N.Y.U. J. INT’L L. & POL. 981, 997-98 (2010).

2012 Halydier 93
A. Legal Literature on the Relationship Between IPR Regime Strength and Economic Growth and Industry Development in Developing
Countries
The international legal community focuses its scholarship on the ways in which the strength of IPR regimes affect economic growth in developing countries. These scholars use historical and legal analysis of the IPR regimes in developed countries to predict the role that IPR regimes will play in the economic growth of developing countries.21 Most of the legal literature on this topic is written in the context of whether or not compliance with TRIPS will help or harm the interests of LDC and developing countries.22 To provide background information for the discussions that follow, this section will begin with an overview of common legal evaluations of the role of IPR regimes during different phases of economic development. The section will conclude with a presentation of the legal side of the current scholarly debate over whether or not a TRIPS-compliant IPR regime will restrict or enhance the growth of LDC and developing countries.
1. Summary of the Legal Analysis of the Connections Between IPR Regime Strength and Economic Growth
Legal scholars have long found that the U.S. and other developed countries purposefully maintained weak IPR regimes during their developmental years to facilitate economic growth and the development of their domestic industrial capabilities.23 Llewellyn Gibbons, Associate Professor of Law at the University of Toledo College of Law and specialist in international and domestic intellectual property law, systemizes this common legal approach when he argues that a developing country will go through three stages of economic development before arriving at full industrialization: a dissemination stage, an absorption stage, and an innovation stage.24 Gibbons explains that the dissemination
21 Michael W. Carroll, One Size Does Not Fit All: A Framework for Tailoring
Intellectual Property Rights, 70 OHIO ST. L. J. 1361, 1364-65 (2009). 22 See e.g. Frederick M. Abbott, The WTO TRIPS Agreement and Global
Economic Development, 72 CHI.-KENT L. REV. 385 (1996); see e.g. Ferris K. Nesheiwat, The Adoption of Intellectual Property Standards Beyond TRIPS — Is it a Misguided Legal and Economic Obsession by Developing Countries?, 32 LOY. L.A. INT’L & COMP. L. REV. 361 (2010).
23 Maskus, Intellectual Property Challenges, supra note 19, at 460-61; Laurel Kilgour, Note: Building Intellectual Property Management Capacity in Public Research Institutions in Vietnam: Current Needs and Future Directions, 9 MINN. J.L. SCI. & TECH. 317, 321-22 (2008); Gibbons, supra note 14, at 924, 936-37; B. Zorina Khan, Intellectual Property and Economic Development: Lessons from American and European History, 45-46, (Commission on Intellectual Property Rights, Study Paper 1a, 2002), available at http://www.iprcommission.org/papers/pdfs/study_papers/sp1a_khan_study.pdf.
24 Gibbons, supra note 17, at 931; Christopher S. Mayer, Notes & Comments:

94 Asian-Pacific Law & Policy Journal Vol. 14:1
stage is characterized by low levels of FDI, poverty, and illiteracy.25 To move beyond this stage, a country must invest in its natural resources and human capital to develop a skilled and independent workforce.26 A country in the dissemination stage is not in a position to create or enforce a significant IPR regime.27
As a country economically matures by developing its natural resources and educating its human capital, it will move into the absorption stage.28 A country in the absorption stage will increase its ability to absorb and imitate new technologies, and even begin to make minor innovations.29 New research and development spur domestic industry growth and increasing amounts of FDI and technology transfer from developed countries during the absorption stage; however, truly new innovations remain infrequent.30 A country’s IPR regime may remain stunted during the absorption stage due to the lack of technical capabilities and resources for enforcement.31
When a country begins to produce its own intellectual property (“IP”) and increases its innovation, industrial capacity, and technical capabilities, it will move into the innovation stage.32 During this stage, countries will selectively choose which IP to protect based on the industries they want to succeed.33 As more industries succeed and IPR protections grow, countries in the innovation stage will transition to a fully industrialized, modern economy and implement a comprehensive, TRIPS-compliant IPR regime.34
The Brazilian Pharmaceutical Industry Goes Walking From Ipanema To Prosperity: Will the New Intellectual Property Law Spur Domestic Investment?, 12 TEMP. INT’L & COMP. L.J. 377, 378-79 (1998). Examples of such developed countries include the U.S., Japan, Singapore, South Korea, Britain, Germany, and France, as well as Brazil, Russia, India, and China (the “BRIC” countries). Gibbons, supra note 17, at 936, 940; Khan, supra note 23, at 49, 51; Mayer, supra at 397-98.
25 Gibbons, supra note 17, at 932; Kennedy, supra note 1, at § II. 26 Gibbons, supra note 17, at 932. 27 Globalization, supra note 12, at 3-4. 28 Gibbons, supra note 17, at 932-33. 29 Id. 30 Id.; Kilgour, supra note 23, at 322, 365-66. 31 Globalization, supra note 12, at 7-8; WORLD BANK, GLOBAL ECONOMIC
PROSPECTS AND THE DEVELOPING COUNTRIES 132 (2001). 32 Gibbons, supra note 17, at 933. 33 Id.; INTELLECTUAL PROPERTY HARMONIZATION WITHIN ASEAN AND APEC
109-118 (Christopher Antons et al. eds., 2004).
34 Gibbons, supra note 17, at 933-34; World Bank, supra note 31, at 132.

2012 Halydier 95
Legal scholars use the above analysis to identify connections between IPR regime strength and economic development in different countries at different times in history.35 They find that LDC and developing countries require IPR regimes with different levels of strength depending on their phase of economic development: a strong IPR regime during the dissemination stage that encourages FDI;36 a weaker IPR regime during the absorption stage that benefits domestic citizens;37 a gradually stronger IPR regime during the innovation stage that preferences particular industries;38 and, a very strong IPR regime as the country transitions into a fully industrialized economy.39
2. The United States as an Analytical Example of the Connections Between IPR Regime Strength and Economic Growth
Based on the stages of economic development above, this section uses the U.S. as an example of the legal literature’s case analysis process. This process provides a model for analyzing the legal systems of other countries and a basis on which to make projections about their future economic development in later sections of this paper.
Beginning in the dissemination stage, the original thirteen American colonies, heavily dependent on FDI and technology transfer from Britain, worked to develop their human capital and create a workforce of independent, motivated, and literate workers.40 In 1790, after gaining independence from Britain and nearing the end of the dissemination stage, the U.S. implemented its first patent system.41
As the U.S. developed its natural and human resources by fostering a market for innovation, it rapidly entered the absorption stage.42 To facilitate its economic growth, the U.S. sought to “borrow of Europe their inventions.”43 Consequently, in 1793, the U.S. replaced the 1790 Patent Law with a new, substantially weaker law that prevented non-citizens from obtaining patents.44 This change facilitated development of the
35 See supra note 10. 36 Gibbons, supra note 17, at 932. 37 Gibbons, supra note 17, at 932-33. 38 Gibbons, supra note 17, at 933. 39 Gibbons, supra note 17, at 933-34. 40 Gibbons, supra note 17, at 936-37.
41 Id. at 937; Khan, supra note 23, at 20. The U.S. system, which differed substantially from contemporary European systems, included robust requirements for legal conformity, novelty, and affordable fees and made no distinction between the rights of citizens and foreigners. Khan, supra note 23, at 21-23.
42 Khan, supra note 23, at 23-24; Gibbons, supra note 17, at 937-38. 43 Gibbons, supra note 17, at 937. 44 Khan, supra note 23, at 22-24.

96 Asian-Pacific Law & Policy Journal Vol. 14:1
industrial sectors of its economy and its innovation capabilities throughout the early nineteenth century.45
In 1836, the U.S. signaled its entry into the innovation stage by replacing the citizenship requirement of the 1793 Patent Law with a slightly stronger law that implemented highly discriminatory filing fees favoring U.S. citizens.46 In 1861, the U.S. began its transition from the innovation stage into a fully industrialized economy by significantly reducing the structural discriminations against foreigners that remained in its 1836 Patent Law.47 As its manufacturing and technical base expanded to dominate new industries, the U.S. became a global industry leader with a strong IPR regime.48
The above analysis shows the ways in which the U.S. used the inherent malleability of its IPR regime to craft a national strategy that carried it successfully through all three stages of economic development to a fully industrialized economy.49 Additionally, this analysis demonstrates an analytical process of legal and historical investigation that may be used to conduct case studies that compare the current developments in LDC and developing countries to the historical development of the U.S. and other developed countries.
3. TRIPS Compliance and Developing Countries
Despite finding that successful countries historically navigate the stages of economic development by changing the strength of their IPR regimes, legal scholars remain divided on the specifics of that relationship. The current debate centers on whether implementation and enforcement of a homogenized, TRIPS-compliant IPR regime would advance50 or restrict51 the economic growth of LDC or developing countries. This section will present both sides of the issue.
Proponents of stringent, globally-homogenized IPR protections contend that TRIPS compliance is necessary for several reasons. First, TRIPS compliance will help LDC and developing countries gain membership and advancement in the WTO, an essential element of a country’s ability to participate in free trade.52 Second, stronger IPR
45 Gibbons, supra note 17, at 938. 46 Khan, supra note 23, at 23. 47 Id. 48 Id.; Gibbons, supra note 17, at 938-39. 49 Gibbons, supra note 17, at 938. 50 Petherbridge, supra note 12, at 1032-33. 51 Srividhya Ragavan, Of the Inequals of the Uruguay Round, 10 MARQ. INTELL.
PROP. L. REV. 273, 274-75 (2006).
52 Michael W. Smith, Bringing Developing Countries’ Intellectual Property Laws to TRIPs Standards: Hurdles and Pitfalls Facing Vietnam's Efforts to Normalize an

2012 Halydier 97
protections can increase the international competitiveness of LDC and developing countries by contributing to technical infrastructure development that enables them to compete in the markets of developed countries where profit margins are higher.53 Third, stronger IPR protections can also protect the domestic industries of developed countries from piracy, thereby encouraging the FDI needed for economic growth in developing countries.54 Finally, strong IPR protections in developing countries decrease the amount of generic drugs on the market that drive prices down. This effect is crucial, as low market prices deter developed countries from researching and developing drugs that populations of LDC and developing countries need for survival.55
On the other hand, opponents of stronger IPR protections espouse a number of criticisms against strict adherence to TRIPS as well as the treaty’s tendency to restrict economic growth in LDC and developing countries.56 First, from an economic standpoint, analyses of the affects of the TRIPS agreement on developing countries have shown that stronger IPR regimes disadvantage domestic industries that are not as legally, politically, or fiscally mature and sophisticated as compared to MNEs.57 Second, a stronger IPR regime can deter domestic and foreign investment in the technical infrastructure and specialized education needed to develop domestic industries like pharmaceuticals.58 Third, stronger IPR regimes allow MNEs to crowd out generic options and raise domestic market prices so that the majority of the population cannot afford goods essential to economic development, such as medicine, chemicals, and machinery.59 Finally, several less tangible disadvantages of stronger IPR protections can contribute to the continued inhibition of economic growth in developing countries. These disadvantages include a lack of respect for differing cultural values over the nature of property rights;60 the danger of homogenizing various global cultures; and the view that such protections
Intellectual Property Regime, 31 CASE W. RES. J. INT’L L. 211, 223 (1999).
53 Petherbridge, supra note 12, at 1039. 54 Id. 55 Id. 56 Ragavan, supra note 51, at 273-76. 57 Petherbridge, supra note 12, at 1041, 1059; Maskus, Role of Intellectual
Property Rights, supra note 12, at 145-47. 58 Petherbridge, supra note 12, at 1039. 59 Id.; Radhika Bhattacharya, Notes and Comments: Are Developing Countries
Going Too Far on Trips? A Closer Look at the New Laws in India, 34 AM. J.L. & MED. 395, 397-98 (2008).
60 Afifah Kusumadara, Problems of Enforcing Intellectual Property Laws in Indonesia, INT’L ASS’N OF LAW SCH. 1, 4-5 (2008).

98 Asian-Pacific Law & Policy Journal Vol. 14:1
are merely another form of economic imperialism over traditional forms of indigenous knowledge and resources, which are exploited61 by developed countries for international profit.62
The legal literature readily acknowledges a connection between the strength of a country’s IPR regime and its level of economic development. As shown, the strength of this literature lies in its creation of a general theoretical model for this connection based on analysis of the development of IPR regimes in developed countries. Yet, the literature remains unsettled about the specifics of that connection and the consequences of particular IPR polices. The scope of legal research, including applied methods of analysis and corresponding theoretical focus, seems to lack the quantitative rigor necessary to independently resolve these particulars. The next section will examine the economic literature addressing the connection between IPR regimes and economic development to identify new data for the legal literature to analyze in the future.
B. Economic Literature on the Relationship Between IPR Regime Strength and Economic Growth and Industry Development in
Developing Countries
Currently, there is neither a theoretical nor an empirical consensus about how to determine the best IPR policy choice for developing countries to pursue at any particular level of economic development. In the seventeen years since the adoption of TRIPS, economics scholars have diligently tried to answer this controversial question. Specifically, they have sought to ascertain what effects different levels of IPR protections have on the levels of FDI, technology transfer, and innovation in LDC and developing countries.63 Despite the great number of complicating variables,64 resolving the quantitative aspects of this question is vital
61 See J. Janewa OseiTutu, Emerging Scholars Series: A Sui Generis Regime for
Traditional Knowledge: The Cultural Divide in Intellectual Property Law, 15 MARQ. INTELL. PROP. L. REV. 147 (2011) (discussing the nature of traditional indigenous and local knowledge and resources and the negative effects that any type of international homogenization of IPR regimes, even a regime specific to traditional knowledge, would have on the economic and cultural development, education, and public health of LDC and developing countries).
62 Petherbridge, supra note 12, at 1039. 63 Yi Qian, Do National Patent Laws Stimulate Domestic Innovation in a Global
Patenting Environment? A Cross-Country Analysis of Pharmaceutical Patent Protection, 1978–2002, 89 REV. OF ECON. & STAT. 436, 436 (2007); Chen & Puttitanun, supra note 2, at 476, 488-89; Walter G. Park, International Patent Protection: 1960–2005, 37 RES. POL’Y 761, 761 (2008).
64 See generally Chen & Puttitanun, supra note 2 (discussing a wide variety of variables that an effective empirical model of IPR protection in LDC and developing countries should take in to account including differences in size, age, political situation, economic freedom, natural resource allocation, technological absorptive capability, WTO accession, and level of development of LDC and developing countries, as well as small
2012 Halydier 99
because FDI, technology transfer, and innovation are essential components of poverty reduction and economic growth for developing countries.65
This section will discuss the empirical economic studies that relate IPR regime strength to FDI, technology transfer, and innovation, as well as issues specific to the domestic pharmaceutical industries of LDC and developing countries.
1. Foreign Direct Investment This section discusses the economic scholars’ findings regarding
the relationship between FDI inflows and IPR protection in LDC and developing countries. Generally, the literature focuses on how different levels of IPR protection will affect MNEs’ profits, willingness to invest, and amount of investment in LDC and developing countries.66 Comparatively little research examines the effect of varying levels of FDI on industries in LDC and developing countries as a result of different levels of IPR protections.67
Initial studies in the early 1990s did not find a stable, statistically significant relationship between the composition of IPR regimes and the volume of FDI received by LDC and developing countries prior to TRIPS’ passage in 1994.68 Subsequent studies, which were more precise in their measurement of the strength of IPR regimes, found a significant relationship between the strength of an IPR regime and FDI received as a national aggregate; however, no significant relationship existed between the strength of an IPR regime and the amount of FDI received by any particular industry.69 This suggests that it is the foreign firms’ perception of the strength of an IPR regime, rather than the actual strength of the regime within particular industries, that is responsible for determining the level of FDI.70 Recent studies, using data collected from numerous countries since the implementation of TRIPS, confirm that stronger IPR regimes in LDC or developing countries will generally increase the volume of FDI in that country,71 subject to the complicating factors
sample sizes, poor data collection, and regional instability.); Maskus, Role of Intellectual Property Rights, supra note 12, at 138-47, 149, 152; Carlos A. Primo Braga & Carsten Fink, The Economic Justification for The Grant Of Intellectual Property Rights: Patterns Of Convergence And Conflict, 72 CHI.-KENT L. REV. 439, 444-54 (1996).
65 HASSAN ET AL., supra note 10, at 3. 66 Id. at 5. 67 Id. 68 Id.; Maskus, Role of Intellectual Property Rights, supra note 12, at 137-38. 69 Braga & Fink, supra note 64, at 445-55. 70 Maskus, Role of Intellectual Property Rights, supra note 12, at 137; HASSAN
ET AL., supra note 10, at 6. 71 Maskus, Role of Intellectual Property Rights, supra note 12, at 144-5, 149-50;

100 Asian-Pacific Law & Policy Journal Vol. 14:1
mentioned above.72 Similarly, current studies that have refined the data from previous research suggest that there is a statistically significant relationship between IPR regimes and the amount and quality of FDI in a particular industry.73 For instance, the level of IPR protection affects the amount and quality of FDI in the pharmaceutical industry in LDC and developing countries, while the level of IPR protection does not affect the amount or quality of FDI in the metals and transportation industries in these same countries.74 In summary, a review of the economics literature reveals that when LDC and developing countries strengthen their IPR regimes, the amount and quality of FDI they receive increases, especially in IPR intensive industries.
2. Technology Transfer
Research discussing the relationship between IPR regimes and technology transfer is not as robust as that of the relationship between IPR regimes and FDI; however, the literature demonstrates a statistically significant relationship between the strength of IPR regimes and the methods of technology transfer.75 International technology transfer from MNEs to developing countries principally occurs through technology licensing, exports, FDI in technology development, and capital construction, or through intra-firm trade with subsidiaries and affiliates.76 In countries with weak IPR regimes and soft enforcement policies, technology transfer may also occur through non-market channels via reverse engineering, imitation, industrial espionage, and confiscated commerce.77 In particular, recent empirical work demonstrates that stronger IPR regimes increase the amount of technology transferred
HASSAN ET AL., supra note 10, at 6-7.
72 HASSAN ET AL., supra note 10, at 6-7. 73 Id. at 7-8. 74 Id. This result is due to the differing amount of reliance on IPR protection
between industries. The pharmaceutical industry relies heavily on IPR protections to ensure that it will profit and invest in future R&D. The metals industry does not actively rely on IPR protections or continuous capital investment, and levels of FDI in these industries are likely more sensitive to commodity prices, political instability, resource availability, and changes in access restrictions. Id.; Walter G. Park & Douglas C. Lippoldt, Org. for Econ. Co-operation & Dev., The Impact of Trade-Related Intellectual Property Rights on Trade and Foreign Direct Investment in Developing Countries, at 5, 11, 15-17, 19-20, TD/TC/WP(2002)42/FINAL (May 28, 2003), available at http://dx.doi.org/10.1787/oecd_papers-v3-11-en.
75 HASSAN ET AL., supra note 10, at 20-21. 76 See supra note 10. 77 See supra note 10.

2012 Halydier 101
through licensing, while MNEs tend to limit transfer of production and technological knowledge to their affiliates under weak regimes.78
Although empirical studies confirm that the strength of the IPR regime determines the manner in which technology is transferred to developing countries, that strength does not seem to impact the volume or type of technology transferred.79 Instead, each country’s level of economic development and the market attractiveness of an industry determine the volume and type of technology transferred.80 Overall, the economics literature shows that when LDC and developing countries strengthen their IPR regimes, the number of ways that technology is transferred increases. However, the amount and type of technology transferred remains dependent on other factors.
3. Economic Development The previous sections illustrate that the strength of IPR regimes in
developing countries affects the amount and quality of FDI and the methods of technology transfer in LDC and developing countries. However, this information does not directly address whether a stronger IPR regime contributes to or inhibits the economic growth of LDC and developing countries. This section will discuss recent studies that synthesize the data regarding FDI, technology transfers, and IPR regime strength to identify a relationship between IPR regime strength and economic development.
A recent empirical study, conducted by economic scholars Drs. Yongmin Chen and Thitima Puttitanun, shows that strong IPR protections: (1) increase useful technology inflows and economic growth in low-income LDC; (2) reduce imitation, innovation, and economic growth in middle-income LDC and developing countries; and, (3) increase innovation and economic growth in high-income developing countries.81 Together, these three relationships form a U-shaped curve that statistically represents the interaction between the strength of a country’s IPR regime and level of economic development as measured by its gross domestic product (“GDP”).82 The U-shape represents a three-way relationship
78 Pamela J. Smith, How Do Foreign Patent Rights Affect U.S. Exports, Affiliate
Sales, and Licenses?, 55 J. OF INT’L ECON 411, 433-34 (2001). 79 HASSAN ET AL., supra note 10, at 21; Park & Lippoldt, supra note 2, at 12, 28-
29. 80 HASSAN ET AL., supra note 10, at 21; Park & Lippoldt, supra note 2, at 22. 81 HASSAN ET AL., supra note 10, at 21-22; Chen & Puttitanun, supra note 2, at
488-90 (analyzing over ten years of data on LDC and developing countries collected by international organizations since the adoption of TRIPS in 1994).
82 HASSAN ET AL., supra note 10, at 21-22; Chen & Puttitanun, supra note 2, at 488; This paper will discuss this U-shaped curve and its ramifications in greater detail, infra, in Part II.A.
102 Asian-Pacific Law & Policy Journal Vol. 14:1
between innovation, imitation, and the level of economic development.83 For a country with specified levels of technological and economic development, the curve will predict the impact of various levels of IPR protection on the countries’ economic growth through technology transfers and FDI.84
Countries at different stages of economic development face varied benefits and costs to innovation, imitation, and economic growth when creating a strong IPR regime.85 Extending the U-shaped curve to include additional metrics, the economics literature reveals the following conclusions.86 First, LDC and developing countries with low income and strong IPR regimes receive greater flows of relevant technology and FDI that improve the training of their human capital and development of their natural resources to enhance their economic growth.87 Second, LDC and developing countries with average incomes and strong IPR regimes receive average levels of technology inflows and FDI, and the strong IPR regimes discriminate in favor of MNEs and discourage imitation, innovation, domestic industry development, and economic growth.88 Finally, LDC and developing countries with high income and strong IPR regimes receive high levels of technology transfer and FDI that benefit established domestic industries, fund innovation, and enhance economic growth.89
The economics literature has identified a U-shaped relationship between IPR regime strength and economic development at the national level. The next section will use the pharmaceutical industry as an example to discuss whether or not the U-shaped relationship holds true at the industry level.
4. The Pharmaceutical Industry
Over the last fifty years, economics scholars have devoted significant efforts toward studying pharmaceutical industries in developing countries as a means to determine whether differing levels of IPR protections encourage or inhibit economic growth at the industry
83 Chen & Puttitanun, supra note 2, at 489. 84 Id. at 489-90. 85 Sanjaya Lall, Indicators of the Relative Importance of IPRs in Developing
Countries, 32 RES. POL’Y 1657, 1678 (2003). 86 Id. at 1658-62, 1678; HASSAN ET AL., supra note 10, at 21-22; KEITH E.
MASKUS, INTELLECTUAL PROPERTY RIGHTS IN THE GLOBAL ECONOMY 160-63, 170 (2000) [hereinafter MASKUS, INTELLECTUAL PROPERTY RIGHTS]; Chen & Puttitanun, supra note 2, at 475-77, 489.
87 Chen & Puttitanun, supra note 2, at 475-76. 88 Chen & Puttitanun, supra note 2, at 476. 89 Chen & Puttitanun, supra note 2, at 476-77.
2012 Halydier 103
level.90 This vast amount of data regarding the relationships between countries, their IPR protections, their pharmaceutical industries, and their level of economic development serves as a useful test bed in which to create and evaluate economic theories.91
It is important to note when examining the pharmaceutical industry that two competing national policy goals complicate the issue of whether strong IPR protections will encourage or inhibit the growth of competitive domestic companies. First, LDC and developing countries need to ensure that their populations have access to affordable drugs to combat high mortality rates that reduce economic activity. Second, LDC and developing countries must incentivize their pharmaceutical industries to continue to spend billions of dollars researching new drugs.92
The IPR tools available to LDC and developing countries to achieve each of these goals often interfere with each other.93 For example, India used weak IPR protections to significantly increase the industrial capacity and market share of its domestic pharmaceutical companies and to provide cost-effective generic drugs to its population; however, these initiatives simultaneously undercut India’s ability to use strong IPR protections to incentivize its domestic pharmaceutical industry to engage in substantive innovation, research, and development.94 In 2005, India increased the strength of its IPR protections for its pharmaceutical industry.95 As a result, India’s domestic pharmaceutical industry appeared to enjoy a correlative increase in innovation.96 Yet, a study by Dr. Yi Qian, Kraft Research Professor at Northwestern University’s Kellogg School of Management warns that increasing IPR protections on developing industries before the industry is ready will inhibit domestic innovation by increasing the amount of money, time, effort, litigation costs, and sophistication that domestic companies will need in order to compete with MNEs.97 Thus, there is a distinct U-shaped relationship between the
90 HASSAN ET AL., supra note 10, at 26. 91 MASKUS, INTELLECTUAL PROPERTY RIGHTS , supra note 86, 160-61. 92 HASSAN ET AL., supra note 10, at 26; MASKUS, INTELLECTUAL PROPERTY
RIGHTS , supra note 86, 162. 93 HASSAN ET AL., supra note 10, at 26, 29-30. 94 HASSAN ET AL., supra note 10, at 33; Mueller, supra note 10, at 532, 536-37. 95 Mueller, supra note 10, at 514, 518-19. In 2005, India implemented the
Patents (Amendment) Act, 2005, to complete the transition to a fully TRIPS-compliant IPR regime. The key element of the Patents (Amendment) Act, 2005, was implementation of full pharmaceutical product patent protection on an industry that had not experienced IPR protection since 1970. Id. at 18-19.
96 Id. 97 Qian, supra note 63, at 450 (showing results based on controlling for the
complicating factors of general education level and the level of economic development. Dr. Qian found that for LDC and developing countries, all else equal, increasing IPR

104 Asian-Pacific Law & Policy Journal Vol. 14:1
strength of IPR protection and the level of an industry’s economic development in LDC and developing countries.
5. The U-Shaped Curves
For LDC and developing countries, the relationship between the strength of IPR protections and the growth and development of an innovative, domestic industry is similar to the U-shaped relationship between the level of economic development and the strength of IPR protections.98 The chief difference between these relationships is the addition of timing. The U-shape of this new relationship is defined as follows: (1) weak IPR protections in LDC and developing countries contribute to the establishment of growing, innovative, domestic industries; (2) switching to a strong IPR regime before an industry is ready hobbles the industry, inhibits domestic innovation, and increases the costs of competing with MNEs; and, (3) switching to a strong IPR regime when an industry is ready contributes to the industry’s ability to innovate through licensing, collaborative research and development, and contract research.99
The economics literature has identified two U-shaped curves that represent the relationship between IPR regime strength and economic development, and IPR regime strength and industry development, respectively. The results of applying either of these U-shaped relationships will depend on the current level of economic development of both the LDC or developing country and its industry.100 The next section will examine specific values for key transition points on the U-shaped curves identified by the economics literature. These values will be combined with the legal theoretical and case analysis discussed previously to create a hybrid model that seeks to accurately predict how much and what type of IPR protections a country should implement for a given stage of economic development.
protections on domestic industries, especially pharmaceutical industries, would inhibit innovation, raise the cost of doing business for domestic companies, and slow the industry’s growth.); see Mayer, supra note 24, at 397-98 (showing Brazil’s experience with its pharmaceutical industry since 1994 as an excellent historical example of the consequences of increasing IPR protections prematurely).
98 Qian, supra note 63, at 436; see discussion infra Part III.B. 99 HASSAN ET AL., supra note 10, at 34; Mueller, supra note 10, at 537. 100 Rod Falvey & Neil Foster, The Role of Intellectual Property Rights in
Technology Transfer and Economic Growth: Theory and Evidence 16 (January, 2006) (not formally published) (on file with the U.N. Indus. Dev. Org.) available at http://www.unido.org/fileadmin/import/60030_05_IPR_rights_in_technology_transfer.pdf.

2012 Halydier 105
II. SYNTHESIZING A PRESCRIPTIVE MODEL RELATING IPR REGIME
STRENGTH TO THE LEVEL OF ECONOMIC DEVELOPMENT IN LEAST
DEVELOPED AND DEVELOPING COUNTRIES
Recent articles have called for a synthesis of the legal theoretical and case analyses and the empirical economics models to create specific policy recommendations for LDC and developing countries.101 This paper proposes a possible answer to this call: a hybrid model based on the legal analysis systemized by Gibbons and the U-shaped relationships identified by Drs. Chen, Puttitanun, and Qian.
The first element of the hybrid model is the prescriptive legal model that places all countries and their industries on a continuum of economic development over time. The second element is the descriptive economic model — the U-shaped curves — that provide a framework for understanding the relationships between IPR regime strength, GDP, level of economic development, innovation, imitation, FDI, and technology transfer. These curves utilize the Ginarte and Park index (the “GP Index”) for measuring the comparative strength of IPR protections in different countries.102 Together, these elements create a hybrid model with four chief dimensions: level of economic development, time, IPR regime strength, and GDP per capita.
The following sections will examine each element in turn, describe the hybrid model as a whole, extend the model to propose a new stage of economic development, and apply the model to a generic case study in order to generate predictions that will serve as a baseline for future applications.
A. The Gibbons Prescriptive Legal Model
The first element of the hybrid model is Gibbons’ prescriptive legal model, previously discussed in Section I.A.1 and Section I.A.2. This
101 HASSAN ET AL., supra note 10. RAND Europe has compiled a collection and
analysis of the international economic literature on the topic of IPR regimes in LDC and developing countries. Throughout the collection, the authors conclude that more work needs to be done synthesizing the empirical and theoretical studies to provide actionable policy options for LDC and developing countries. See Albert G.Z. Hu & Adam B. Jaffe, IPR, Innovation, Economic Growth and Development, 1-2, 16 (2007) (unpublished manuscript) (on file as background material for the Intellectual Property and Development Task Force Meeting, Manchester 2009, of the Initiative for Policy Dialogue, based at Columbia University), available at http://policydialogue.org/events/meetings/intellectual_property_and_development_task_force_meeting_manchester_2009/materials.
102 Chen & Puttitanun, supra note 2, at 483; Juan C. Ginarte & Walter G. Park, Determinants of Patent Rights: A Cross-National Study, 26 RES. POL’Y 283, 283 (1997); Park, supra note 63, at 761. Juan C. Ginarte, of the World Bank, and Dr. Walter G. Park, from the American University Department of Economics, Ginarte & Park, supra, at 283, developed the GP Index in 1997, Chen & Puttitanun, supra note 2, at 483, and Dr. Park updated the GP Index in 2008 with data from 1960-2005, Park, supra note 63, at 761.

106 Asian-Pacific Law & Policy Journal Vol. 14:1
prescriptive legal model analyzes the relationship between the first two dimensions of the hybrid model: the level of economic development and time.
According to Gibbons’ model, a country moves through three, time-sequential stages of economic development prior to achieving full economic maturity: the dissemination, absorption, and innovation stages.103 As discussed in Section I, Gibbons identified different indicators for each stage of a country’s economic development over time.
Figure 1: Graph of a country’s Level of Economic Development over Time.104
In the dissemination stage, a country’s economy is pre-industrialized and heavily dependent on natural resource exploitation and a large, uneducated labor market.105 The country has little industrial capacity, scant technological absorption resources, and limited FDI and technology transfer opportunities.106 MNEs choose to retain their
103 Gibbons, supra note 17, at 939-41, 944; See supra Part I.A.1. 104 See generally Gibbons, supra note 17, at 939-41, 944. In Figure 1, The Y-
Axis is the economic maturity of a country. The X-Axis is time. This graph shows that, while it is possible to draw a direct relationship between time and increases in economic development, in reality a country will move along the stair step line up to the right. A LDC or developing country will stay in each of the stages until it amasses enough economic momentum to make it to the next stage. See infra Appendix A.
105 Gibbons, supra note 17, at 932-39; see supra Part I.A.1. 106 Gibbons, supra note 17, at 932-39; see supra Part I.A.1.

2012 Halydier 107
production knowledge via licensing to their own affiliates or through inter-firm trade.107
In the absorption stage, a developing country’s economy is differentiated from the dissemination stage by a growing class of motivated, educated workers, expanding industrial capacity, and rising income levels.108 Technological absorption capability increases as the labor force becomes more adept, but FDI and legitimate technology transfer opportunities remain limited due to multi-national enterprises that generally retain their production knowledge via licensing or inter-firm trade.109 The higher technical base of the economy allows for greater amounts of illegitimate technology transfer via reverse engineering and imitation.110 With MNEs unwilling to compete in the market due to low priced generic products, domestic industries are able to expand their production and industrial bases substantially.111
In the innovation stage, a developing economy is characterized by rapidly expanding industrial capacity and rising income levels. The government uses IPR protections to foster domestic innovation.112 Technological absorption capability is high and FDI in domestic firms continues to rise as domestic industries become more lucrative.113 MNEs face market barriers to entry, including low-priced generic products and government policies that favor local industries.114 FDI and technology transfer (both legitimate and illegitimate) generally expand at this stage as MNEs and domestic enterprises attempt to take advantage of the growing market for brand-name products created by rising income levels.115
A country leaves the innovation stage of development when it implements and enforces an IPR regime that covers every industry, thereby signaling full industrialization and a mature, sustainable economy.116
107 Gibbons, supra note 17, at 932-39; see supra Part I.A.1. 108 Gibbons, supra note 17, at 932-39; see supra Part I.A.1. 109 Gibbons, supra note 17, at 932-39; see supra Part I.A.1. 110 Gibbons, supra note 17, at 932-39; see supra Part I.A.1. 111 Gibbons, supra note 17, at 932-39; see supra Part I.A.1. 112 Gibbons, supra note 17, at 932-39; see supra Part I.A.1. 113 Gibbons, supra note 17, at 932-39; see supra Part I.A.1. 114 Gibbons, supra note 17, at 932-39; see supra Part I.A.1. 115 Gibbons, supra note 17, at 932-39; see supra Part I.A.1. 116 Gibbons, supra note 17, at 932-39; HASSAN ET AL., supra note 10, at 3; see
supra Part I.A.1.

108 Asian-Pacific Law & Policy Journal Vol. 14:1
B. The Chen, Puttitanun, and Qian U-Shaped Economic Model
The second element of the hybrid model is the U-shaped curve of Chen, Puttitanun, and Qian’s economic model.117 This U-shaped economic model describes the relationship between the second two dimensions of the hybrid model: IPR regime strength and GDP per capita.
To measure IPR regime strength, the U-shaped economic model uses the GP Index. This index contains data on over one hundred and twenty-two countries at varying levels of economic development from 1960-2005.118 The GP Index number for each country is constructed on a scale of zero to five, with zero being low levels of patent protection and five being high levels of patent protection.119 The GP Index measures: (1) patent laws regarding different classes of products; (2) membership status in international patent treaties and length of membership; (3) patent protections actually in place; (4) effectiveness of a country’s enforcement of patent protections; and, (5) potential restrictions that disadvantage foreign patent filers.120 The benefits of this widely used index include its coverage over time (from 1960 to 2005), the number and variety of countries currently evaluated (122 countries), and its measurement of both the strength of a country’s IPR regime and its track record for enforcing that regime.121
117 See supra Part I.B.3-5. 118 Park, supra note 63, at 761. 119 See infra Appendix C. 120 See infra Appendix C. 121 Chen & Puttitanun, supra note 2, at 483; Park, supra note 63, at 762, Table 1.

2012 Halydier 109
Figure 2: Graph of IPR Strength v. GDP per capita.122
On the upper left of the U-shaped curve in Figure 2, countries with a very low GDP per capita, usually under about $1,260, are stongly correlated with stronger IPR regimes.123 In the lower middle of the curve, countries with a higher GDP per capita, hovering around 1,260 dollars, maintain weaker IPR regimes.124 On the upper right of the curve, countries with a GDP per capita exceeding 1,260 dollars evidence a growing reliance on stronger IPR regimes.125 Chen and Puttitanun found that this relationship persisted despite the presence of potentially confounding variables, such as education levels, economic freedom, trade freedom, colonial history, and WTO membership.126 This statistical robustness is an important measure of the reliability of the relationship between the strength of an IPR regime and a country’s GDP per capita.
122 Figure 2, which is also listed, infra, in Appendix A, provides Chen and Puttitanun’s model of the U-shaped curve that describes the relationship between the GP Index strength of a country’s IPR regime and its GDP per capita. Chen & Puttitanun, supra note 2, at 488.
123 Chen and Puttitanun, supra note 2, at 483. The GDP per capita value is derived from the following formula: 854 dollars (1995 U.S. dollars)/.678 (CPI) = 1260 dollars (2011 US dollars). Robert C. Sahr, Download Conversion Factors, CONSUMER PRICE INDEX (CPI) CONVERSION FACTORS 1774 TO ESTIMATED 2022 TO CONVERT TO
DOLLARS OF 2011, (2012), http://oregonstate.edu/cla/polisci/download-conversion-factors.
124 Chen and Puttitanun, supra note 2, at 483. 125 Id. 126 Id. at 489; Qian, supra note 63, at 437.

110 Asian-Pacific Law & Policy Journal Vol. 14:1
C. Synthesizing the Hybrid Model Synthesizing these legal and economic models and their methods
of analysis yields a predictive hybrid model. This model creates the potentiality for new, predictive comparisons between the strength of a country’s IPR regime and its GDP per capita over time within the context of the country’s current level of economic development. This section will briefly outline the hybrid model, its specific factors, and its initial benchmarks.
The hybrid model is a procedure for evaluating a country’s balance of economic development and IPR regime strength over time. It distills the varied methods of legal, historical, economic, theoretical, empirical, and case study analysis into a single process with three steps: (1) joint legal-historical analysis that identifies key inflection points in the development of a country’s IPR regime; (2) economic analysis of specific measurable factors at those key inflection points; and (3) comparative analysis of the results of step two, the hybrid model’s benchmarks, and other country’s results to identify specific recommendations for future action. This three-step process allows the hybrid model to effectively evaluate all four of the dimensions derived from Gibbons legal model and the U-shaped economic model: time, the stages of economic development, IPR regime strength, and GDP per capita.
The first step of the hybrid model—joint legal-historical analysis— should resemble Gibbon’s study of the development of the U.S. IPR regime through history from Section I.A.2. The hybrid model is heavily dependent on the passage of time in relation to a country’s adoption of IPR regimes and progression through the stages of economic development. The analysis in step one should focus on identifying the dates of historical inflection points—points at which a country implemented policies that would theoretically affect the strength of its IPR regime.
The second step should consist of economic data gathering and analysis of specific, measurable factors. This process begins by correlating the inflection points identified in step one with economic data. This is done to examine the economic changes that a country experienced between inflection points and to identify the country’s current and past stages of economic development.
To facilitate a more precise comparison between countries, the hybrid model uses specific factors to benchmark the level of a country’s economic development at each inflection point identified in step one. Because several of these factors could be misleading due to the disparate size of developing countries, the hybrid model uses percentages to arrive at more reliable results:
Education level of workers Exports as a percentage of GDP Gross National Income (“GNI”) per capita

2012 Halydier 111
Percentage of patents filed by residents FDI as a percentage of GDP GDP per capita GP Index value
Step three should synthesize the data from steps one and two and compare it to both the hybrid model’s benchmarks and the results of similar countries. Once the inflection points, stages of economic development, and rates of economic change have been identified, the results should be compared with the hybrid model’s benchmarks regarding the appropriate balance between the level of economic development and IPR regime strength. Additionally, the results should be compared to the results of other country’s to identify similarities and differences between the cases. Based on these two comparisons, step three’s analysis should seek to identify specific recommendations for future action.
Similar to the integration of processes in the hybrid model, the initial benchmarks will combine the data from Gibbon’s legal model in Section II.A. and from the economic U-shaped model in Section II.B. Gibbons’ legal model analyzes the stages of economic development over time; but it says little about the level of strength a country’s IPR regime needs during any particular stage to facilitate growth. Similarly, the U-shaped economic model describes a relationship between the strength of a country’s IPR regime and its GDP per capita; but it does not purport to illustrate that this relationship exists linearly over the course of a country’s development. Individually, both Gibbons’ legal model and the U-shaped curve of the economic model remain generalized descriptions of different correlations between the strength of a country’s IPR regime and its level of economic development. However, integrating the data from these two models in Figure 3, the hybrid model hypothesizes the following initial benchmarks127:
When a country moves through time it also advances through
the stages of economic development as its level of economic maturity increases (dotted line).
A country in the dissemination stage should maintain relatively high levels of IPR regime strength (top left of U-shaped curve).
A country moving through the absorption stage into the innovation stage should maintain relatively low levels of IPR regime strength (bottom center of U-shaped curve).
A country moving through the innovation stage should gradually increase its levels of IPR regime strength (middle right of U-shaped curve).
127 The graphical representation of the hybrid model is shown in Figure 3, infra
p. 112 and Appendix A.
112 Asian-Pacific Law & Policy Journal Vol. 14:1
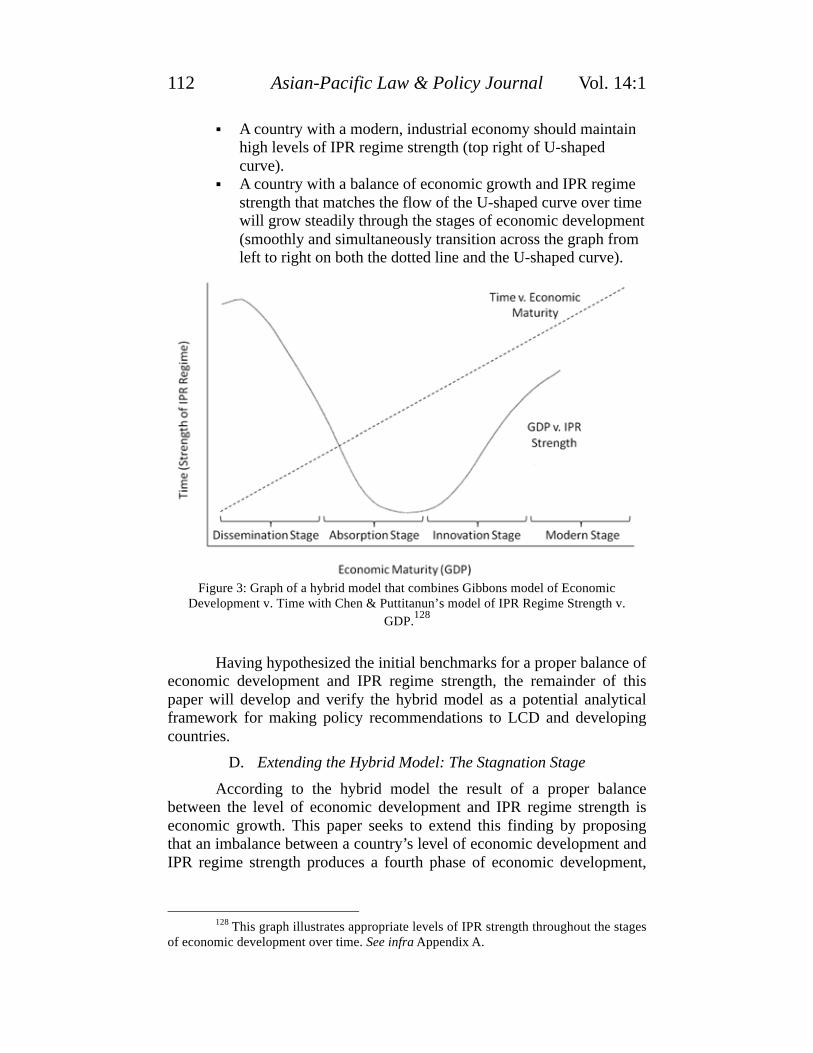
A country with a modern, industrial economy should maintain high levels of IPR regime strength (top right of U-shaped curve).
A country with a balance of economic growth and IPR regime strength that matches the flow of the U-shaped curve over time will grow steadily through the stages of economic development (smoothly and simultaneously transition across the graph from left to right on both the dotted line and the U-shaped curve).
Figure 3: Graph of a hybrid model that combines Gibbons model of Economic Development v. Time with Chen & Puttitanun’s model of IPR Regime Strength v.
GDP.128
Having hypothesized the initial benchmarks for a proper balance of economic development and IPR regime strength, the remainder of this paper will develop and verify the hybrid model as a potential analytical framework for making policy recommendations to LCD and developing countries.
D. Extending the Hybrid Model: The Stagnation Stage
According to the hybrid model the result of a proper balance between the level of economic development and IPR regime strength is economic growth. This paper seeks to extend this finding by proposing that an imbalance between a country’s level of economic development and IPR regime strength produces a fourth phase of economic development,
128 This graph illustrates appropriate levels of IPR strength throughout the stages
of economic development over time. See infra Appendix A.

2012 Halydier 113
the stagnation stage. This section will hypothesize the likely causes, characteristics, and cures of a stagnation stage based on the hybrid model.
The stagnation stage is not an independent stage of economic development; rather, it is a substantial elongation of any of the other stages that holds the country back from fulfilling its economic potential. Within the hybrid model, this stage is postulated to occur when a country deviates from the U-shaped relationship between IPR regime strength and GDP per capita, that is, when a country implements an IPR regime significantly stronger or weaker than its location on the U-shape recommends. For instance, if a country implements a TRIPS-compliant or nearly TRIPS-compliant IPR regime while it is in the absorption stage of economic development, the hybrid model predicts that this will inhibit the growth of the country while privileging the short-term interests of foreign industries. The country will remain in the absorption stage for a longer period of time. Figure 4 demonstrates the effect that such a scenario might have on the country’s economic development over time.

114 Asian-Pacific Law & Policy Journal Vol. 14:1
Figure 4: Graph of both proper and improper levels of GDP v. IPR strength and the
resulting effects on the level of Economic Development v . Time.129
The hybrid model predicts that countries mired in the stagnation stage will exhibit economic indicators characteristic of their previous stage of economic development, depending on the country’s level of economic development and the severity of the imbalance introduced. These characteristics are not individually detrimental or throwbacks to conditions in previous stage of economic development. However, these characteristics will distract LDC and developing countries stuck in stagnation from the practices necessary to continue to advance along the path of economic development. For instance, in the above example of a country that enters the stagnation stage instead of leaving the absorption stage, the hybrid model predicts it will exhibit characteristics of the dissemination stage, while remaining in the absorption stage. Income levels will drop. Citizens will no longer be able to afford the higher cost of living. The country’s technological absorption and imitation capabilities will remain minimal because MNEs will continue control its industries. FDI will continue and MNEs will only transfer technology to affiliates and subsidiaries. The countries GDP might rise gradually, but most of the
129 The bottom U-shaped curve is the proper balance of GDP versus IPR
Strength. The top dotted line represents the resulting path of normal, steady progress through the stages of Economic Development over Time. The top solid line flattens the U-shaped curve and shows how a premature increase in the strength of a country’s IPR regime can unbalance the ratio of GDP v. IPR Strength. This imbalance results in a stagnation stage, as represented by the bottom dotted line, which lengthens a country’s stay in its current stage of Economic Development and significantly reduces its rate of economic growth over Time. See infra Appendix A.
2012 Halydier 115
profits, which are tied up in the MNEs, will leave the country, thereby minimizing any cumulative effect from the growth.
The dimension of time in the hybrid model implies that a stagnation stage is a substantial elongation of the growth progress for a country. Eventually, a sufficiently educated class of workers will emerge and use their knowledge to increase the technological absorption capability of the country, creating industries and markets based on reverse engineering and imitation. This could propel the country into the next stage of economic development. However, this progress will take time to materialize, as the new companies are forced to compete with established MNEs, protected by FDI and a sophisticated knowledge of the country’s IPR regime. The country’s improperly calibrated IPR regime created the conditions that placed the country in a stagnation stage; recalibrating the IPR regime to the country’s level of development should help it grow out of the stagnation stage faster.
E. Applying the Hybrid Model to the Pharmaceutical Industry This section will begin the process of validating the hybrid model
by generating a testable hypothesis that will then be refined and verified in Section III when it is applied to real world data from India, Brazil, Indonesia, and Vietnam. The hybrid model will be used to generate a testable hypothesis about the characteristics of a hypothetical developing country’s pharmaceutical industry as the country properly balances economic development, IPR protections, innovation, and time. The hybrid model will also generate the characteristics of a pharmaceutical industry in a country that enters a stagnation stage for comparison. The application of the hybrid model in the following paragraphs will use the method of analysis outlined earlier in this paper,130 and characteristics of the stages of economic development and the pharmaceutical industry131 to create a working hypothesis.
1. The Dissemination Stage
High drug prices, the market dominance of MNEs, an uneducated labor force, and low levels of domestic innovation would characterize the dissemination stage of a pharmaceutical industry in a developing country. Medicines would be subject to high import rates and industrial capacity would be limited. The market would be characterized by high ratios of brand name to generic drugs. IPR regulations would be relatively strong and might even be TRIPS-compliant, but they would only serve to increase FDI and technology transfer through intra-firm trade and affiliate licensing. The influx of money, technology and FDI, and MNEs use of inexpensive labor would catalyze the growth of an educated populace and
130 See supra Part I.A.2. 131 See supra Parts I.A.1., I.B.4., II.A., II.D.

116 Asian-Pacific Law & Policy Journal Vol. 14:1
initial technical base, setting the stage for advancement to the absorption stage.
2. The Absorption Stage
The absorption stage of a pharmaceutical industry in a developing country would be characterized by lower drug prices, due to the prevalence of generic drugs, and a retreat by MNEs from both the market and industrial locations. The domestic market would maintain a large ratio of generic to brand name drugs. The pharmaceutical industry would engage in low levels of domestic innovation, and technology transfers (legitimate and illegitimate) from developed countries would gradually increase. IPR protections would be limited and enforcement inefficient. Because MNEs are unable to compete with the market for inexpensive generic drugs, the domestic pharmaceutical industry would expand, preparing for advancement to the innovation stage.
3. The Innovation Stage
In the innovation stage of a developing country, the pharmaceutical industry would benefit from a highly trained educational, scientific, and industrial talent pool. The industry would be characterized by burgeoning innovation and development throughout the industrial sector. The industry would accelerate its level of domestic innovation and create truly novel applications and drugs. Faced with this new reality, the developing country would begin to use its limited resources to implement a gradually stronger IPR regime focused on protecting and fostering chosen industries. Inexpensive generic drugs and an increasing influx of new, domestically created drugs would characterize the pharmaceutical market. The international competitiveness of domestic companies would gradually increase. When the government begins to apply stronger IPR protections to the industry, MNEs would return to take advantage of the educated labor pool, growing industrial base, and new markets. As the country applies stronger IPR protections to every industry it would leave the innovation stage behind and emerge as a fully industrialized economy.
4. The Stagnation Stage
The stagnation stage of a hypothetical developing country’s pharmaceutical industry would be characterized by strong IPR protections and high drug prices due to the resulting foreign patent monopolies. Domestic pharmaceutical companies would suffer high opportunity costs from researching, manufacturing, patenting, and marketing brand name drugs. MNEs would maintain their market and industrial dominance with cheap labor from domestic industries. The market would contain a high ratio of brand name to generic drugs. The industry would suffer from low levels of domestic innovation. MNEs would restrict legitimate technology transfers to affiliates and intra-firm trade.

2012 Halydier 117
III. CORROBORATING THE MODEL: THE CASES OF INDIA, BRAZIL, INDONESIA, AND VIETNAM
The hybrid model, which measures economic growth, IPR protection, and time, has generated a testable hypothesis about conditions within LDC and developing countries at different stages of economic development, including a hypothesis concerning the possible characteristics of the stagnation stage. With these hypotheses in mind, this section applies the hybrid model using World Bank data sets on India, Brazil, and Indonesia to generate a set of numerical expectations, corroborate the hypotheses of the hybrid model, and validate its prescriptive capabilities. The hybrid model will then be applied to the Vietnamese case, a country just beginning to progress through the stages of economic development, in an attempt to gain unique insight into possible directions or policies the Vietnamese government can implement as it considers strengthening or weakening its IPR protections in the coming years. This section closes with a summary of the results.
A. India As an advanced developing economy, India serves as a useful
control case with which to correlate the hybrid model’s analysis of the stages of economic development and the numerical factors that describe each stage.132 Supplying the hybrid model with data about India’s economy will show that the country has successfully progressed through all three stages of economic development and is rapidly achieving full industrialization. This section will: (1) conduct a brief historical overview of Indonesia’s economy and IPR regimes in order to identify the key inflection points of transition between stages of economic development; (2) display the data related to each inflection point and stage of economic development; and (3) analyze the data related to each stage of economic development to identify baseline numerical values for each of the hybrid model’s metrics.133
1. History
India gained independence from Great Britain in 1947 during the dissemination stage. In the following years, the country was notorious for its high population density, poor economy, and high rates of disease.134 MNEs established during the British colonial period dominated the young country’s industries. India began to search for specific policies that would
132 Mueller, supra note 10, at 501. 133 These metrics are identified, supra, in Part II.B. as the education level of
workers, exports as a percentage of GDP, Gross National Income (“GNI”) per capita, percentage of patents filed by residents, FDI as a percentage of GDP, GDP per capita, and the GP Index value.
134 Mueller, supra note 10, at 509-11.

118 Asian-Pacific Law & Policy Journal Vol. 14:1
foster a domestic pharmaceutical industry, provide its citizens with affordable drugs, and foster its transition to the absorption stage.135 This search resulted in the passage of the 1970 India Patents Act, which went into effect in 1972, and repealed patentability for all pharmaceutical products.136 Foreign pharmaceutical companies abandoned India, causing a “dramatic increase in domestic generic drug manufacturing and a sharp decline in the price of medication in India.”137 The nascent Indian pharmaceutical industry devoted itself to developing alternative, cost-effective manufacturing processes for existing drugs rather than focusing on the development of new drugs.138
More recently, India entered the innovation stage of economic development when it agreed in 1994 to a three-phase, ten-year plan to bring its patent system into compliance with TRIPS.139 This plan allowed India to modernize its patent system by gradually increasing IPR protections over the course of ten years.140 Domestic pharmaceutical firms now account for seventy-seven percent of the market share in India.141 This demonstrates India’s success in both implementing an intellectual property strategy and facilitating the growth of a domestic pharmaceutical industry. Further,
signals indicate that India’s adoption of product patent protection is positively impacting its economy. Indian pharmaceutical firms are increasing their investments in new chemical entity (NCE) research and development. Although the percentage of their revenues devoted to research and development is still well below that of western multinational corporations (MNCs), investment by the [local] firms in health care innovation is steadily increasing. India is increasingly viewed as an ideal venue for clinical testing of new drugs and for contract drug manufacturing.142
135 Johanna Sheehe, Indian Patent Law: Walking The Line?, 29 NW. J. INT’L L.
& BUS. 577, 580-81 (2009). 136 Mueller, supra note 10, at 513-14. 137 Id. at 514. 138 Id. at 516; Sheehe, supra note 135, at 581. 139 Sheehe, supra note 135, at 581-83. 140 Mueller, supra note 10, at 517-19, 640; Bhattacharya, supra note 59, at 397-
98. 141 Mueller, supra note 10, at 532-33. 142 Id. at 509-15.

2012 Halydier 119
Given this brief history, the hybrid model will consider the following key inflection points during India’s economic growth when it adopted IPR protections: 1947, when India achieved independence from Britain; 1972, when India enacted its first IPR regime (except in the pharmaceutical industry); and 2005, when India completed a ten-year plan to apply its IPR regime to its pharmaceutical industry.
2. Data Immediately following its independence from Great Britain and its
new start as a country in 1947,143 India transitioned through the dissemination stage, which lasted until 1972.144 The following values depict each of the hybrid model’s factors as India neared the end of the dissemination stage:
4.5 percent, population pursuing college degrees or higher
education.145 4 percent, industrial capacity, measured by exports as a
percentage of GDP.146 110 dollars, GNI per capita.147 20 percent, technical absorption capacity, measured as the
percentage of all Indian patents filed by Indian citizens.148
143 Id. at 509. 144 Id. at 512. 145 See ProQuest Statistical Datasets, World Development Indicators: Education
– Participation, School enrollment, tertiary, Brazil, Indonesia, India, Vietnam, 1970-2010 [Data file] (2011), http://data.worldbank.org/data-catalog/world-development-indicators [hereinafter Education]; see infra Appendix B, Table 1.
146 See ProQuest Statistical Datasets, World Development Indicators: Economic Policy and Debt – Balance of payments, Goods exports, Brazil, Indonesia, India, Vietnam, 1970-2009 [Data file] (2011), http://data.worldbank.org/data-catalog/world-development-indicators [hereinafter Exports]; see ProQuest Statistical Datasets, World Development Indicators: Economic Policy and Debt—National accounts, GDP, Brazil, Indonesia, India, Vietnam, 1970-2010 [Data file] (2011), http://data.worldbank.org/data-catalog/world-development-indicators [hereinafter GDP]; see infra Appendix B, Tables 2-4.
147 See ProQuest Statistical Datasets, World Development Indicators: Economic Policy and Debt – National Accounts, GNI per capita, Atlas Method, Brazil, Indonesia, India, Vietnam, 1970-2010 [Data file] (2011), http://data.worldbank.org/data-catalog/world-development-indicators [hereinafter Gross National Income]; see infra Appendix B, Table 5.
148 See ProQuest Statistical Datasets, World Development Indicators: Infrastructure – Technology, Patent applications, residents, Brazil, Indonesia, India, Vietnam, 1970-2009 [Data file] (2011), http://data.worldbank.org/data-catalog/world-development-indicators [hereinafter Residential Patents] and see ProQuest Statistical Datasets, World Development Indicators: Infrastructure—Technology, Patent applications, nonresidents, Brazil, Indonesia, India, Vietnam, 1970-2009 [Data file]
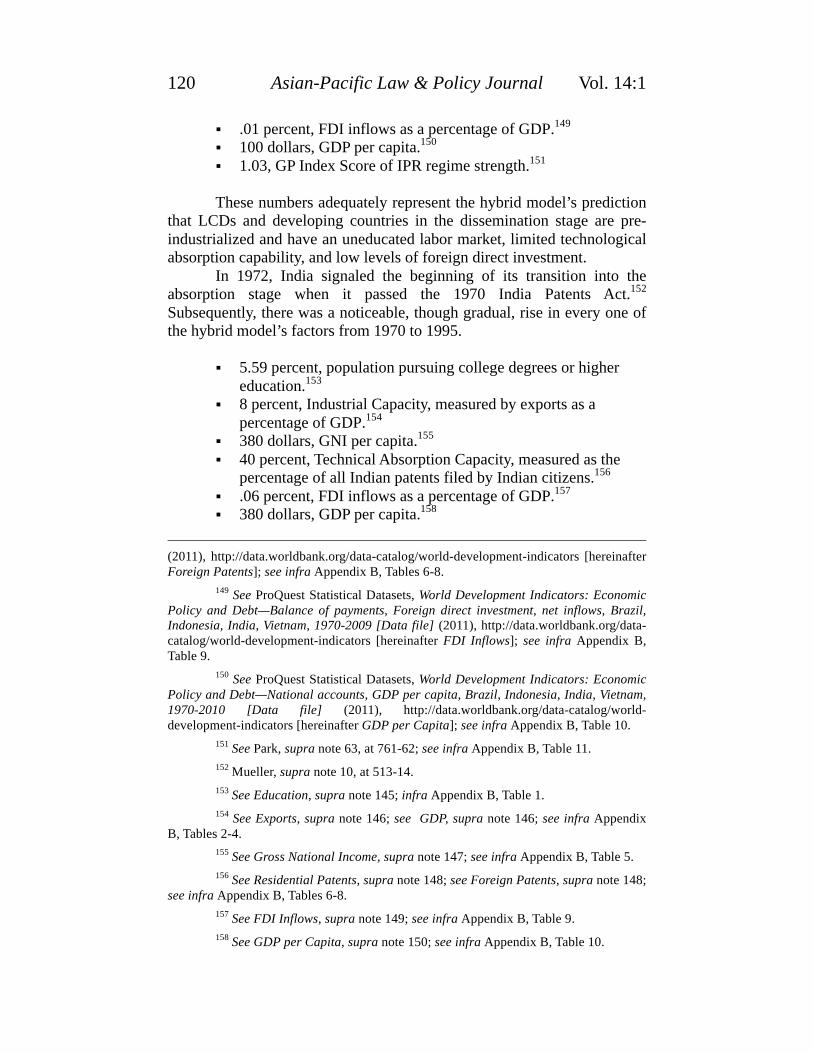
120 Asian-Pacific Law & Policy Journal Vol. 14:1
.01 percent, FDI inflows as a percentage of GDP.149 100 dollars, GDP per capita.150 1.03, GP Index Score of IPR regime strength.151
These numbers adequately represent the hybrid model’s prediction that LCDs and developing countries in the dissemination stage are pre-industrialized and have an uneducated labor market, limited technological absorption capability, and low levels of foreign direct investment.
In 1972, India signaled the beginning of its transition into the absorption stage when it passed the 1970 India Patents Act.152 Subsequently, there was a noticeable, though gradual, rise in every one of the hybrid model’s factors from 1970 to 1995.
5.59 percent, population pursuing college degrees or higher
education.153 8 percent, Industrial Capacity, measured by exports as a
percentage of GDP.154 380 dollars, GNI per capita.155 40 percent, Technical Absorption Capacity, measured as the
percentage of all Indian patents filed by Indian citizens.156 .06 percent, FDI inflows as a percentage of GDP.157 380 dollars, GDP per capita.158
(2011), http://data.worldbank.org/data-catalog/world-development-indicators [hereinafter Foreign Patents]; see infra Appendix B, Tables 6-8.
149 See ProQuest Statistical Datasets, World Development Indicators: Economic Policy and Debt—Balance of payments, Foreign direct investment, net inflows, Brazil, Indonesia, India, Vietnam, 1970-2009 [Data file] (2011), http://data.worldbank.org/data-catalog/world-development-indicators [hereinafter FDI Inflows]; see infra Appendix B, Table 9.
150 See ProQuest Statistical Datasets, World Development Indicators: Economic Policy and Debt—National accounts, GDP per capita, Brazil, Indonesia, India, Vietnam, 1970-2010 [Data file] (2011), http://data.worldbank.org/data-catalog/world-development-indicators [hereinafter GDP per Capita]; see infra Appendix B, Table 10.
151 See Park, supra note 63, at 761-62; see infra Appendix B, Table 11. 152 Mueller, supra note 10, at 513-14. 153 See Education, supra note 145; infra Appendix B, Table 1. 154 See Exports, supra note 146; see GDP, supra note 146; see infra Appendix
B, Tables 2-4. 155 See Gross National Income, supra note 147; see infra Appendix B, Table 5. 156 See Residential Patents, supra note 148; see Foreign Patents, supra note 148;
see infra Appendix B, Tables 6-8. 157 See FDI Inflows, supra note 149; see infra Appendix B, Table 9. 158 See GDP per Capita, supra note 150; see infra Appendix B, Table 10.

2012 Halydier 121
1.03, GP Index Score of IPR regime strength.159
As the hybrid model predicted for the absorption stage, the continuing low IPR regime strength correlates with India’s gradually increasing economic development. The education and income levels of India’s population rose as the economy expanded. In addition, domestic industries in India improved their ability to absorb new technologies, and domestic innovation increased. MNEs continued to retreat throughout this period because of India’s low IPR protections, and they remained unwilling to commit substantial amounts of FDI resources.
India successfully implemented a strong IPR regime and simultaneously made the transition to an innovation economy between 1995 and 2005. According to the hybrid model, a stronger IPR regime correlates with the next step towards economic development, and places the country on the top right portion of the U-shaped curve shown in Figure 4. This transition from the absorption stage to the innovation stage in particular will provide important data for the hybrid model. The following numbers help to validate the hybrid model by establishing a baseline for the kind and volume of economic activity a country needs to successfully transition to the innovation stage while simultaneously implementing a strong IPR regime and avoiding a slip into stagnation:
11 percent, population pursuing college degrees or higher
education.160 12 percent, Industrial Capacity, measured by exports as a
percentage of GDP.161 750 dollars, GNI per capita.162 18 percent, Technical Absorption Capacity, measured as the
percentage of all Indian patents filed by Indian citizens.163 1 percent, FDI inflows as a percentage of GDP.164 762 dollars, GDP per capita.165 3.76, GP Index Score of IPR regime strength.166
159 See Park, supra note 63, at 761-62; see infra Appendix B, Table 11. 160 See Education, supra note 145; see infra Appendix B, Table 1. 161 See Exports, supra note 146; see GDP, supra note 146; see infra Appendix B,
Tables 2-4. 162 See Gross National Income, supra note 147; see infra Appendix B, Table 5. 163 See Residential Patents, supra note 148; see Foreign Patents, supra note 148;
see infra Appendix B, Tables 6-8. 164 See FDI Inflows, supra note 149; see infra Appendix B, Table 9. 165 See GDP per Capita, supra note 150; see infra Appendix B, Table 10. 166 See Park, supra note 63, at 761-62; see infra Appendix B, Table 11.

122 Asian-Pacific Law & Policy Journal Vol. 14:1
As the hybrid model predicted, the higher IPR regime strength score closely correlated with India’s increasingly steep economic growth throughout the innovation stage. India’s education statistics increased and its industrial capacity, FDI, and technology transfer expanded. Although the number of patents filed by residents fell, the success of India’s domestic industries, measured against that of MNEs throughout this period,167 shows that India was ready to make the transition from an absorption economy to an innovation economy.
3. Analysis
According to the hybrid model’s economic values, the timing of India’s national economic growth corresponds exactly with the inflection points identified by the hybrid model. The inflection points are the key moments when India had the opportunity to either transition into the next level of economic development or enact an IPR policy out of sync with its economic position and enter a stagnation stage. While the hybrid model has, so far, only predicted events that have already happened, the data gained from its application to the Indian case serves as a critical, initial validation of the model’s core assumptions, and will make a useful starting point for the next case analysis: Brazil.
B. Brazil Like India, Brazil currently has an advanced developing economy
that moved through various stages of economic development over the last few decades. Brazil is a good case study on which to test the validity of the hybrid model for three reasons. First, application of the hybrid model’s hypotheses to Brazil’s economy will show that, while Brazil’s economy is growing, its pharmaceutical industry has for decades moved from one stagnation stage to another. Second, studying Brazil’s economy provides data on a developing country that is roughly on par with India in terms of geography, population size, and the amount of time each country has been independent. Third, Brazil has a sizeable pharmaceutical industry that is responsible for some of its prosperity. However, although India has successfully managed its transition through the levels of economic development, the Brazil case correlates closely with the projections of the hybrid model for a country that moves in and out of a stagnation stage, especially with regard to its pharmaceutical industry. This case analysis would be a good test of the hybrid model’s universality, i.e. whether it can accurately predict the economic journey of a relatively young developing country that is mostly underdeveloped, that is located in a different hemisphere, that has a vastly different culture, and that cannot easily trade with China or Japan.
167 Mueller, supra note 10, at 532.
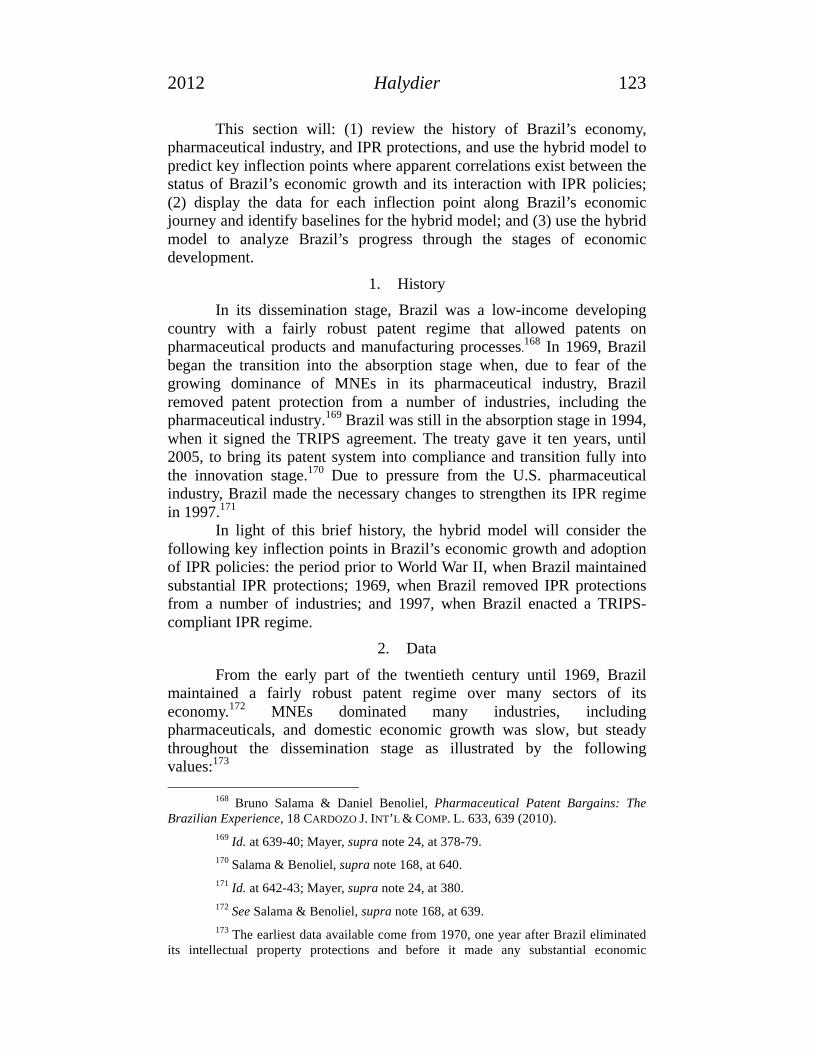
2012 Halydier 123
This section will: (1) review the history of Brazil’s economy, pharmaceutical industry, and IPR protections, and use the hybrid model to predict key inflection points where apparent correlations exist between the status of Brazil’s economic growth and its interaction with IPR policies; (2) display the data for each inflection point along Brazil’s economic journey and identify baselines for the hybrid model; and (3) use the hybrid model to analyze Brazil’s progress through the stages of economic development.
1. History In its dissemination stage, Brazil was a low-income developing
country with a fairly robust patent regime that allowed patents on pharmaceutical products and manufacturing processes.168 In 1969, Brazil began the transition into the absorption stage when, due to fear of the growing dominance of MNEs in its pharmaceutical industry, Brazil removed patent protection from a number of industries, including the pharmaceutical industry.169 Brazil was still in the absorption stage in 1994, when it signed the TRIPS agreement. The treaty gave it ten years, until 2005, to bring its patent system into compliance and transition fully into the innovation stage.170 Due to pressure from the U.S. pharmaceutical industry, Brazil made the necessary changes to strengthen its IPR regime in 1997.171
In light of this brief history, the hybrid model will consider the following key inflection points in Brazil’s economic growth and adoption of IPR policies: the period prior to World War II, when Brazil maintained substantial IPR protections; 1969, when Brazil removed IPR protections from a number of industries; and 1997, when Brazil enacted a TRIPS-compliant IPR regime.
2. Data
From the early part of the twentieth century until 1969, Brazil maintained a fairly robust patent regime over many sectors of its economy.172 MNEs dominated many industries, including pharmaceuticals, and domestic economic growth was slow, but steady throughout the dissemination stage as illustrated by the following values:173
168 Bruno Salama & Daniel Benoliel, Pharmaceutical Patent Bargains: The Brazilian Experience, 18 CARDOZO J. INT’L & COMP. L. 633, 639 (2010).
169 Id. at 639-40; Mayer, supra note 24, at 378-79. 170 Salama & Benoliel, supra note 168, at 640. 171 Id. at 642-43; Mayer, supra note 24, at 380. 172 See Salama & Benoliel, supra note 168, at 639. 173 The earliest data available come from 1970, one year after Brazil eliminated
its intellectual property protections and before it made any substantial economic

124 Asian-Pacific Law & Policy Journal Vol. 14:1
4.7 percent, population pursuing college degrees or higher
education.174 6 percent, Industrial Capacity, measured by exports as a
percentage of GDP.175 440 dollars, GNI per capita.176 25 percent, Technical Absorption Capacity, measured as the
percentage of all Brazilian patents filed by Brazilian citizens.177 1 percent, FDI inflows as a percentage of GDP.178 441 dollars, GDP per capita.179 1.21, GP Index Score of IPR regime strength.180
According to these values, Brazil entered the U-shaped curve with
a low level of economic development and a high level of intellectual property protection. When it transitioned to the absorption stage, Brazil exhibited values that were strikingly similar India’s. As a result the hybrid model predicts that Brazil was economically ready to make the transition from the dissemination stage to the absorption stage in roughly 1969.
In 1969, Brazil signaled its intent to transition into the absorption stage of economic development by eliminating its patent protections for the pharmaceutical industry. The following numbers depict the hybrid model’s values for Brazil in 1975, 1980, and 1985, respectively:
10, 11, and 10 percent, population pursuing college degrees or
higher education.181 6, 8, and 11 percent, Industrial Capacity, measured by exports
as a percentage of GDP. 182 1,170 dollars, 2,190 dollars, and 1,570 dollars GNI per
capita.183
improvement. See infra Appendix B.
174 See Education, supra note 145; see infra Appendix B, Table 1. 175 See Exports, supra note 146; see GDP, supra note 146; see infra Appendix B,
Tables 2-4. 176 See Gross National Income, supra note 147; see infra Appendix B, Table 5. 177 See Residential Patents, supra note 148; see Foreign Patents, supra note 148;
see infra Appendix B, Tables 6-8. 178 See FDI Inflows, supra note 149; see infra Appendix B, Table 9. 179 See GDP per Capita, supra note 150; see infra Appendix B, Table 10. 180 See Park, supra note 63, at 761-62; see infra Appendix B, Table 11. 181 See Education, supra note 145; see infra Appendix B, Table 1. 182 See Exports, supra note 146; see GDP, supra note 146; see infra Appendix B,
Tables 2-4.

2012 Halydier 125
25, 25, and 29 percent, Technical Absorption Capacity, measured as the percentage of all Brazilian patents filed by Brazilian citizens.184
1.1, .8, and .6 percent, FDI inflows as a percentage of GDP.185 1,143 dollars, 1,931 dollars, and 1,636 dollars GDP per
capita.186 1.08, 1.28, and 1.28 GP Index Score of IPR regime strength.187
The hybrid model predicts that an imbalance between the strength
of an IPR regime and the level of economic development would negatively affect a country’s ability to innovate. Brazil’s values show that it prematurely lowered its IPR restrictions before it reached the proper level of economic development. Instead of transitioning through the absorption stage when it abolished its IPR protections, Brazil entered a stagnation stage.188 This stage substantially elongated the time that Brazil would spend in the absorption stage. In this case, Brazil’s economy lacked both the structural and behavioral incentives for innovation that a country needs to successfully transition through the absorption stage.189 Consequently, instead of growing under the protection of a weaker IPR regime, the pharmaceutical industry turned to imitation and other illegitimate methods of technology transfer.190 Although the Brazilian government attempted to take a direct hand in the management of the pharmaceutical industry, its actions only damaged the industry further.191 MNEs continued to dominate the pharmaceutical industry in Brazil, but they reduced their FDI and technology transfers because of the lack of patent protection.192
The hybrid model’s values193 show that Brazil’s economy began to recover and grow again in the late 1980s and early 1990s, after remaining in a stagnation stage for nearly twenty years. The hybrid model predicts
183 See Gross National Income, supra note 147; see infra Appendix B, Table 5. 184 See Residential Patents, supra note 148; see Foreign Patents, supra note 148;
see infra Appendix B, Tables 6-8. 185 See FDI Inflows, supra note 149; see infra Appendix B, Table 9. 186 See GDP per Capita, supra note 150; see infra Appendix B, Table 10. 187 See Park, supra note 63, at 761-62; see infra Appendix B, Table 11. 188 Appendix B, Tables 1, 4, 5, 8, 9, 10, and 11, infra, show a representation of
the slowed growth and visible setbacks that Brazil suffered because of this decision. 189 Salama & Benoliel, supra note 168, at 639-40. 190 Mayer, supra note 24, at 379-80. 191 Id. 192 Id. at 396. 193 See infra Appendix B, Tables 1, 4, 5, 8, 9, 10, 11.

126 Asian-Pacific Law & Policy Journal Vol. 14:1
this growth because the stagnation stage is not permanent; it only results in a substantial elongation of the current stage of economic development. In 1994, as Brazil continued to transition through the middle of the absorption stage, Brazil signed the TRIPS Agreement.194 In 1997, under pressure from the U.S. commercial pharmaceutical industry, Brazil instituted a TRIPS-compliant IPR regime that included new provisions for patents on the pharmaceutical industry (despite the fact that under TRIPS, Brazil had until January 1, 2005, to comply).195 The following list shows the hybrid model’s economic values for Brazil in 1995 and 2000, respectively:
11 and 16 percent, population pursuing college degrees or
higher education.196 6 and 8 percent, Industrial Capacity, measured by exports as a
percentage of GDP.197 3,730 dollars and 3,860 dollars GNI per capita.198 36 and 17 percent, Technical Absorption Capacity, measured as
the percentage of all Brazilian patents filed by Brazilian citizens.199
.6 and 5 percent, FDI inflows as a percentage of GDP.200 4,751 dollars and 3,696 dollars GDP per capita.201 1.48 and 3.59 GP Index Score of IPR regime strength.202
The adoption of a TRIPS-compliant IPR regime typically indicates
that a country has moved into the innovation stage. For this transition to be successful, the hybrid model’s values should place the country near the top right of the U-shaped curve, with strong IPR protections and advanced levels of economic development. However, if a country adopts a strong IPR regime before it reaches the proper level of economic development, it risks entering a stagnation stage that will keep the country in the absorption stage. In this case, Brazil nearly doubled its economic activity
194 Salama & Benoliel, supra note 168, at 639-40. 195 Id. 196 See Education, supra note 145; see infra Appendix B, Table 1. 197 See Exports, supra note 146; see GDP, supra note 146; see infra Appendix B,
Tables 2-4. 198 See Gross National Income, supra note 147; see infra Appendix B, Table 5. 199 See Residential Patents, supra note 148; see Foreign Patents, supra note 148;
see infra Appendix B, Tables 6-8. 200 See FDI Inflows, supra note 149; see infra Appendix B, Table 9. 201 See GDP per Capita, supra note 150; see infra Appendix B, Table 10. 202 See Park, supra note 63, at 761-62; see Appendix B, Table 11.

2012 Halydier 127
between 1985 and 1995. Yet, after implementing a TRIPS-compliant IPR regime, Brazil lost almost every trace of new economic activity by the year 2000 and the country entered another stagnation stage. This shows that Brazil’s economy was still in the absorption stage and unable to support the strong IPR regimes that characterize the innovation stage.
Two values from the hybrid model provide an explanation for Brazil’s entry into a second stagnation stage: the massive spike in college attendance, and the increase in FDI and technology transfers. First, the spike in college attendance provides an accurate estimate of the percentage of the skilled workforce that abandoned the economy to attend school when Brazil implemented a TRIPS-compliant IPR regime. This demographic shift indicates that Brazil’s economy was still in the middle of the absorption stage and lacked the innovative capacity to progress to the innovation stage. Second, FDI and technology transfer spiked by 500 percent, indicating that MNEs capitalized on Brazil’s immature level of economic development when it implemented a TRIPS-compliant IPR regime. The MNEs used this investment to establish a significant physical presence in the world’s fourth-largest market, thereby forcing out Brazil’s already struggling domestic industries and prolonging Brazil’s stay in the absorption stage.
In sync with its economic stagnation, Brazil’s recovering pharmaceutical industry nose-dived in 1997.203 The new IPR protections that would typically usher Brazil into the innovation stage instead throttled the potential of its emerging industries. Brazil’s volatile economy, its struggling pharmaceutical industry, its lack of innovation, its domestic firms’ failure to cooperate with each other and invest in R&D, and its detrimental focus on imitation and illegitimate forms of technology transfer (all symptoms of an improper balance of IPR protection and economic development)204 led the industry, and the whole economy, into the second stagnation stage.
3. Analysis In summary, because Brazil had incredible, built-in competitive
advantages as the world’s fourth-largest pharmaceutical market, with vast natural resources and an educated populace, it gained an economic head start in the 1960s.205 Yet, over the last fifty years, Brazil acted to change its economy, pharmaceutical industry, and IPR protections out of sync with each other. These actions increased the length of time the country spent in
203 Salama & Benoliel, supra note 168, at 642-43; Mayer, supra note 24, at 380-
81. 204 Qian, supra note 63, at 450. 205 Salama & Benoliel, supra note 168, at 641-43; Mayer, supra note 24, at 397-
98; Lawrence A. Kogan, Brazil’s IP Opportunism Threatens U.S. Private Property Rights, 38 U. MIAMI INTER-AM. L. REV. 1, 4-5 (2006).

128 Asian-Pacific Law & Policy Journal Vol. 14:1
each stage of economic development. Were it not for the imbalances between IPR protections and economic development, Brazil could have developed a world-class pharmaceutical industry to rival even India’s.
Brazil’s case validates two dynamics of the hybrid model and its accuracy as a potential tool for evaluating policy choices for LDC and developing countries seeking to manage the relationship between economic development, innovation, and IPR protections. First, Brazil’s case confirms that the hybrid model accurately predicted the nature of the stagnation stage. Specifically, that a stagnation stage can lengthen a country’s current stage of economic development for decades at a time. Second, Brazil’s case effectively amplifies what happens when LDC and developing countries either: (1) eliminate IPR protections before the domestic industry is able to effectively innovate; or (2) implement new IPR protections before the domestic industry is ready to compete with MNEs.
Thus far, the cases of India and Brazil validate the hybrid model’s application to large countries moving through the stages of economic development. The following two sections analyze Indonesia, which has suffered severe economic setbacks, and Vietnam, which is near the middle of its own economic development process, respectively. These cases will be used to validate the model’s predictive accuracy and reliability when applied to countries of different sizes, demographics, locations, and histories.
C. Indonesia Indonesia’s progress through the stages of economic development
offers a useful case to further discuss the potential for stagnation stages predicted by the hybrid model. The Indian case and Indonesian case share many historical, demographic, and geographic similarities. Yet, while India successfully took advantage of these opportunities to progress steadily through each level of economic development, Indonesia has been less successful at managing its growth. The purpose of this section is to evaluate the Indonesian case and compare it to the successful economic transition of the Indian case and the unsuccessful economic transition of the Brazilian case. This comparison will provide insight into the circumstances of Indonesia’s past economic setbacks and prescriptive policy options for Indonesia’s future.
This section will: (1) include a brief historical overview of Indonesia’s economy and IPR regimes in order to identify the key inflection points for transition between stages of economic development; (2) lay out the data related to each inflection point and stage of economic development; and (3) analyze the data by comparing the cases of India and Indonesia and discussing possible policy solutions for Indonesia.

2012 Halydier 129
1. History After gaining independence from Dutch control in 1945,206
Indonesia maintained a minimal IPR regime, a holdover from the old Dutch legal system that never played a role in its economy.207 Due to its flourishing oil industry, Indonesia experienced decades of gradual economic growth and successfully resisted both domestic and international calls to institute stronger IPR protections.208 But in the late 1980s and early 1990s, Indonesia passed numerous laws to create a basic IPR regime, due to increased economic pressure from the U.S.209 Indonesia’s economy continued to expand until a regional economic crisis in the mid- to late 1990s.210 In 1997, despite the ongoing economic crisis, Indonesia bowed to renewed economic pressure from the U.S., the World Bank, the International Monetary Fund, and other international organizations, and ratified the TRIPS agreement.211 The Indonesian government immediately rushed to pass a number of strict domestic laws in order to comply with its new international commitments.212 Despite creating this new TRIPS-compliant IPR regime in 1997, Indonesia lacked the ability to enforce it in any substantive fashion. As a result, a decade plus later, Indonesia remains a haven for pirating and other forms of illegitimate technology transfers.213
In light of this brief history, the hybrid model will focus on the following key inflection points regarding Indonesia’s economic growth and IPR policy adoptions: the period from 1945 through the early 1980s, when Indonesia maintained minimal IPR protections; the mid-1980s to 1996, when Indonesia first implemented domestic IPR protections on a number of industries; and the period after 1997, when Indonesia enacted a TRIPS-compliant IPR regime.
206 Simon Butt, Intellectual Property in Indonesia: A Problematic Legal
Transplant, 22 EUR. INTELL. PROP. REV. 429, 436 (2002). 207 Id. at 436; Darko Djaic, Why Does the Enforcement of Indonesia’s
Intellectual Property Laws Continue to be a Problem?, 22 EUR. INTELL. PROP. REV. 454, 457-58 (2000); Ronan Sheehan, Downloading the Book of Kells, 34 EUR. INTELL. PROP. REV. 534, 537 (2012).
208 Id, at 457; Charles Gielen, supra note 14, at 102. 209 Kusumadara, supra note 60, at 4; Butt, supra note 206, at 436. 210 Butt, supra note 206, at 432. 211 Jacqueline Mowbray, Western Property Laws in China and Indonesia, 26
COMP. L. Y.B. INT’L BUS. 215, 246 (2005); Butt, supra note 206, at 432; Djaic, supra note 207, at 456; Gielen, supra note 14, 102.
212 Kusumadara, supra note 60, at 8; Butt, supra note 206, at 436-37. 213 Djaic, supra note 207, at 457; Kusumadara, supra note 60, at 1.

130 Asian-Pacific Law & Policy Journal Vol. 14:1
2. Data At the time it won its independence in 1945, Indonesia maintained
a dissemination stage economy and minimal IPR protections. Throughout the period from 1945 to 1980, Indonesia’s economy gradually improved, arriving at the following values for the hybrid model in 1980:214
3.7 percent, population pursuing college degrees or higher
education.215 510 dollars, GNI per capita.216 1 percent, Technical Absorption Capacity, measured as the
percentage of all Indonesian patents filed by Indonesian citizens.217
532 dollars, GDP per capita.218 .2, GP Index Score of IPR regime strength.219
These numbers indicate that Indonesia’s economic growth was very slow and that the country remained in the dissemination stage of economic development through the early 1980s. Over the same period, Indonesia’s GP Index Score of .2 shows that it maintained a weak IPR regime that lacked enforcement. The hybrid model suggests that this combination of low levels of IPR protection and economic development caused Indonesia to enter a stagnation stage that significantly prolonged its dissemination stage. This stagnation stage substantially lengthened the amount of time Indonesia needed to build up the national resources necessary to advance to the absorption stage.
Stagnation stages are not permanent, and Indonesia’s economy began to show signs of leaving its stagnated dissemination stage in the late 1980s. By passing the Patent Act in 1991, Indonesia signaled its readiness to transition into the absorption stage. As a result of this transition, the hybrid model’s values rose markedly between 1980 and 1997:
12 percent, population pursuing college degrees or higher
education.220
214 See Exports, supra note 146; see GDP, supra note 146; see infra Appendix B, Tables 2-4. (no data is available for this time period for either Industrial Capacity, measured by exports as a percentage of GDP) and see FDI Inflows, supra note 149; see infra Appendix B, Table 9 (or for FDI inflows as a percentage of GDP).
215 See Education, supra note 145; see infra Appendix B, Table 1. 216 See Gross National Income, supra note 147; see infra Appendix B, Table 5. 217 See Residential Patents, supra note 148; see Foreign Patents, supra note 148;
see infra Appendix B, Tables 6-8. 218 See GDP per Capita, supra note 150; see infra Appendix B, Table 10. 219 See Park, supra note 63, at 761-62; see infra Appendix B, Table 11.
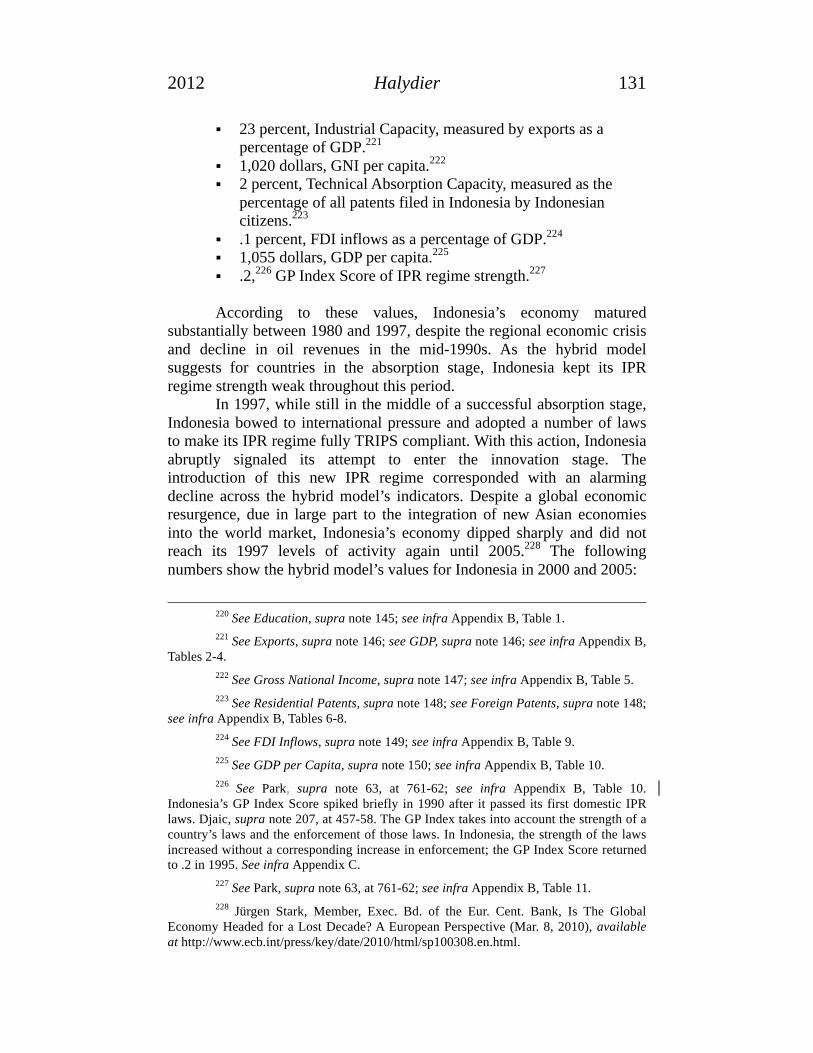
2012 Halydier 131
23 percent, Industrial Capacity, measured by exports as a percentage of GDP.221
1,020 dollars, GNI per capita.222 2 percent, Technical Absorption Capacity, measured as the
percentage of all patents filed in Indonesia by Indonesian citizens.223
.1 percent, FDI inflows as a percentage of GDP.224 1,055 dollars, GDP per capita.225 .2,226 GP Index Score of IPR regime strength.227
According to these values, Indonesia’s economy matured substantially between 1980 and 1997, despite the regional economic crisis and decline in oil revenues in the mid-1990s. As the hybrid model suggests for countries in the absorption stage, Indonesia kept its IPR regime strength weak throughout this period.
In 1997, while still in the middle of a successful absorption stage, Indonesia bowed to international pressure and adopted a number of laws to make its IPR regime fully TRIPS compliant. With this action, Indonesia abruptly signaled its attempt to enter the innovation stage. The introduction of this new IPR regime corresponded with an alarming decline across the hybrid model’s indicators. Despite a global economic resurgence, due in large part to the integration of new Asian economies into the world market, Indonesia’s economy dipped sharply and did not reach its 1997 levels of activity again until 2005.228 The following numbers show the hybrid model’s values for Indonesia in 2000 and 2005:
220 See Education, supra note 145; see infra Appendix B, Table 1. 221 See Exports, supra note 146; see GDP, supra note 146; see infra Appendix B,
Tables 2-4. 222 See Gross National Income, supra note 147; see infra Appendix B, Table 5. 223 See Residential Patents, supra note 148; see Foreign Patents, supra note 148;
see infra Appendix B, Tables 6-8. 224 See FDI Inflows, supra note 149; see infra Appendix B, Table 9. 225 See GDP per Capita, supra note 150; see infra Appendix B, Table 10. 226 See Park, supra note 63, at 761-62; see infra Appendix B, Table 10.
Indonesia’s GP Index Score spiked briefly in 1990 after it passed its first domestic IPR laws. Djaic, supra note 207, at 457-58. The GP Index takes into account the strength of a country’s laws and the enforcement of those laws. In Indonesia, the strength of the laws increased without a corresponding increase in enforcement; the GP Index Score returned to .2 in 1995. See infra Appendix C.
227 See Park, supra note 63, at 761-62; see infra Appendix B, Table 11. 228 Jürgen Stark, Member, Exec. Bd. of the Eur. Cent. Bank, Is The Global
Economy Headed for a Lost Decade? A European Perspective (Mar. 8, 2010), available at http://www.ecb.int/press/key/date/2010/html/sp100308.en.html.

132 Asian-Pacific Law & Policy Journal Vol. 14:1
13 and 17 percent, population pursuing college degrees or
higher education.229 39 and 30 percent, Industrial Capacity, measured by exports as
a percentage of GDP.230 580 dollars and 1,260 dollars, GNI per capita.231 4 and 5 percent, Technical Absorption Capacity, measured as
the percentage of all Indonesian patents filed by Indonesians.232 -2.76 and 2.92 percent, FDI inflows as a percentage of GDP.233 803 dollars and 1,304 dollars, GDP per capita.234 2.46 and 2.77, GP Index Score of IPR regime strength.235
These values show that between 1997 and 2005, Indonesia’s economy entered a period of rapid decline, followed by a period of slow recovery. Instead of securing new investment and technology from MNEs, Indonesia’s inflows of FDI and technology collapsed. The country’s national income and GDP declined by roughly fifty percent between 1997 and 2000. Indonesia’s industrial capacity did grow, but the MNEs dominated the export market. Moreover, because the Indonesian government failed to enforce its new IPR regimes,236 domestic industries failed to innovate and turned instead to illegitimate methods of technology transfer.237 According to the hybrid model, Indonesia’s premature adoption of a strong IPR regime caused it to enter another stagnation stage, this time prolonging its stay in the absorption stage.
3. Analysis Using the data above, this section will engage in a comparative
analysis of India and Indonesia’s paths of economic development. This section will use the Indian case as a comparison because of its successful progress through the stages of economic development and because of its historical, geographic, and demographic similarities to Indonesia.
229 See Education, supra note 145; see infra Appendix B, Table 1. 230 See Exports, supra note 146; see GDP, supra note 146; see infra Appendix B,
Tables 2-4. 231 See Gross National Income, supra note 147; see infra Appendix B, Table 5. 232 See Residential Patents, supra note 148; see Foreign Patents, supra note 148;
see infra Appendix B, Tables 6-8. 233 See FDI Inflows, supra note 149; see infra Appendix B, Table 9. 234 See GDP per Capita, supra note 150; see infra Appendix B, Table 10. 235 See Park, supra note 63, at 761-62; see infra Appendix B, Table 11. 236 Kusumadara, supra note 60, at 6-8. 237 Butt, supra note 206, at 433; Djaic, supra note 207, at 457-58; Id.
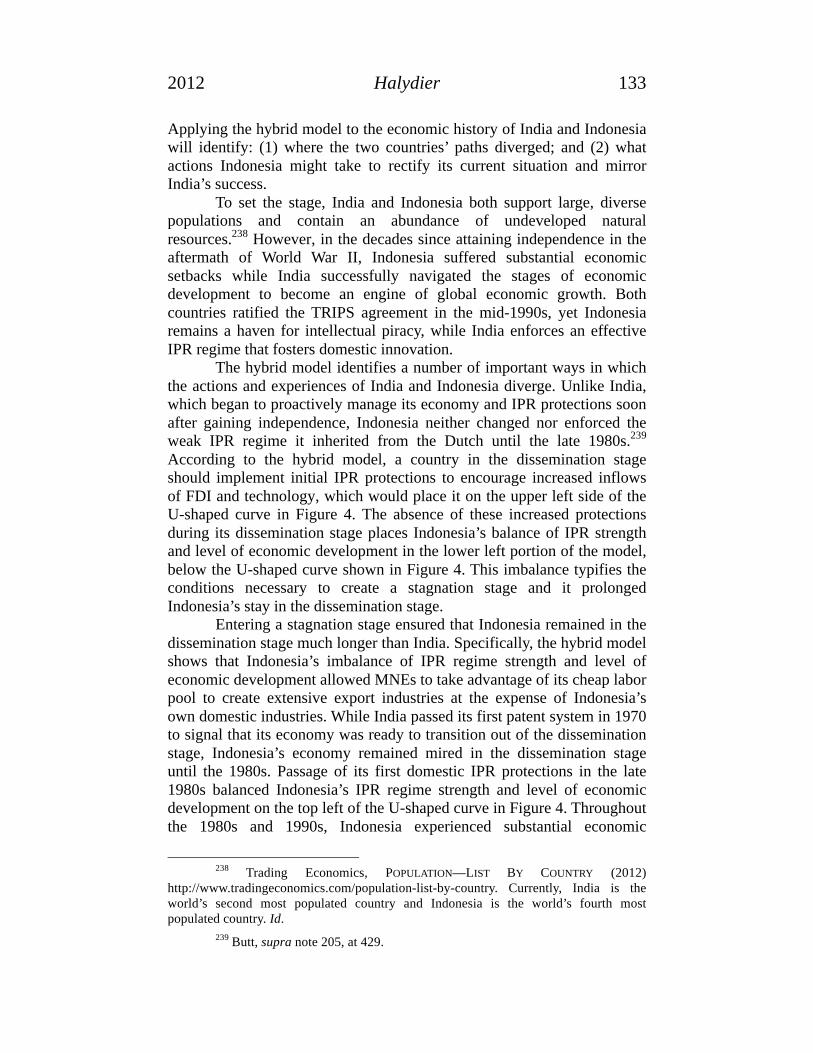
2012 Halydier 133
Applying the hybrid model to the economic history of India and Indonesia will identify: (1) where the two countries’ paths diverged; and (2) what actions Indonesia might take to rectify its current situation and mirror India’s success.
To set the stage, India and Indonesia both support large, diverse populations and contain an abundance of undeveloped natural resources.238 However, in the decades since attaining independence in the aftermath of World War II, Indonesia suffered substantial economic setbacks while India successfully navigated the stages of economic development to become an engine of global economic growth. Both countries ratified the TRIPS agreement in the mid-1990s, yet Indonesia remains a haven for intellectual piracy, while India enforces an effective IPR regime that fosters domestic innovation.
The hybrid model identifies a number of important ways in which the actions and experiences of India and Indonesia diverge. Unlike India, which began to proactively manage its economy and IPR protections soon after gaining independence, Indonesia neither changed nor enforced the weak IPR regime it inherited from the Dutch until the late 1980s.239 According to the hybrid model, a country in the dissemination stage should implement initial IPR protections to encourage increased inflows of FDI and technology, which would place it on the upper left side of the U-shaped curve in Figure 4. The absence of these increased protections during its dissemination stage places Indonesia’s balance of IPR strength and level of economic development in the lower left portion of the model, below the U-shaped curve shown in Figure 4. This imbalance typifies the conditions necessary to create a stagnation stage and it prolonged Indonesia’s stay in the dissemination stage.
Entering a stagnation stage ensured that Indonesia remained in the dissemination stage much longer than India. Specifically, the hybrid model shows that Indonesia’s imbalance of IPR regime strength and level of economic development allowed MNEs to take advantage of its cheap labor pool to create extensive export industries at the expense of Indonesia’s own domestic industries. While India passed its first patent system in 1970 to signal that its economy was ready to transition out of the dissemination stage, Indonesia’s economy remained mired in the dissemination stage until the 1980s. Passage of its first domestic IPR protections in the late 1980s balanced Indonesia’s IPR regime strength and level of economic development on the top left of the U-shaped curve in Figure 4. Throughout the 1980s and 1990s, Indonesia experienced substantial economic
238 Trading Economics, POPULATION—LIST BY COUNTRY (2012)
http://www.tradingeconomics.com/population-list-by-country. Currently, India is the world’s second most populated country and Indonesia is the world’s fourth most populated country. Id.
239 Butt, supra note 205, at 429.

134 Asian-Pacific Law & Policy Journal Vol. 14:1
improvements across the hybrid model’s values by using its new IPR regime strength to hasten its progression through the dissemination stage.
In the late 1990s, the hybrid model shows that Indonesia’s level of economic development matched that of India in 1970. The hybrid model suggests that because of its rising level of economic development, Indonesia should have begun to relax its IPR regime on certain handpicked industries in order to foster domestic industry growth and innovation. This would have placed Indonesia’s balance of IPR regime strength and economic development on the bottom center of the U-shaped curve. Reducing the strength of its IPR regime, similar to India’s course of action with regard to its pharmaceutical industry in 1972, would have allowed Indonesia’s economy to transition through the absorption stage in the late 1990s and early 2000s. However, significant economic pressure from the international community and regional economic instability caused Indonesia to do exactly the opposite. In 1997, Indonesia significantly strengthened its IPR regime, placing its balance of IPR regime strength and economic development well above the center of the U-shaped curve in Figure 4.
As a result of the imbalance between the strength of its IPR protections and its level of economic development, Indonesia entered a second stagnation stage that significantly prolonged its absorption stage. Specifically, the hybrid model shows that Indonesia lacked the innovative and industrial capacity necessary to advance to the innovation stage when it implemented its new IPR regime. Indonesia intended for its new IPR regime to incentivize MNEs to transfer advanced technology to local affiliates and their Indonesian counterparts; but due to its low technical absorption capacity, MNEs only transferred easily imitated technologies that did not advance the sophistication of Indonesia’s domestic industries.240 Instead of protecting and encouraging innovation in its domestic industries, Indonesia’s new IPR regime privileged the sophistication of foreign intellectual property owners. Countries with extensive economic resources and advanced technological innovation capacity now dominate the majority of Indonesia’s patent filings.241 Indonesia remains in this stagnation stage and has not transitioned into the innovation stage.
At present, Indonesia is struggling to generate sufficient economic growth to place its balance of IPR regime strength and economic development back on the U-shaped curve in Figure 4.242 Its progress is complicated by the difficulties of enforcing a strong IPR regime in a
240 Kusumadara, supra note 60, at 8. 241 Id. 242 Currently, the hybrid model places Indonesia well above the middle of the U-
shaped curve in Figure 4, supra p. 114 and infra Appendix A, because it maintains a strong IPR regime and a low level of economic development.

2012 Halydier 135
country where many citizens remain ignorant of their intellectual property rights and the benefits and consequences of those rights.243 According to the hybrid model, if Indonesia continues on its current path, it will continue to grow slowly throughout its stagnated absorption stage, just as it did during its stagnated dissemination stage, and eventually make the transition to the innovation stage of economic development.
In addition to describing Indonesia’s current situation, the hybrid model also suggests a possible way for Indonesia to accelerate its growth, transitioning it out of the stagnated absorption stage and into the innovation stage. Specifically, the hybrid model shows that Indonesia should proactively work to balance the strength of its IPR regime and its level of economic development.244 Just as adopting an initial IPR regime in the 1980s accelerated its transition out of its stagnated dissemination stage and into the absorption stage, implementing new policies that strategically change the strength of its IPR regime could accelerate Indonesia’s transition out of its stagnated absorption stage and into the innovation stage. To accomplish this goal, the hybrid model suggests that Indonesia needs to change how its current IPR regime functions. Using a process similar to that used by India when it developed its first patent law in 1970, changes should be made to integrate the legal requirements of TRIPS, Indonesia’s unique cultural conceptions of property rights, and the results of a strategic economic development plan. Changes that integrate these three elements would successfully avoid violating Indonesia’s TRIPS obligations, increase Indonesia’s ability to enforce its IPR regime domestically, and provide Indonesia with the tools it needs to coordinate its future economic growth.
Specifically, the hybrid model predicts that such changes need to be carefully selected to privilege the establishment of domestic industries capable of innovation. Indonesia should consider changes that: (1) incentivize citizens to pursue higher education; (2) encourage domestic industries to increase their industrial capacity; (3) rebalance the economic and legal costs of patent protection to no longer disadvantage Indonesian citizens; (4) encourage FDI inflows to domestic industries; (5) create and protect new industries with unique competitive advantages until they are able to compete internationally; and (6) encourage legitimate forms of technology transfer to chosen domestic industries via licensing and improved enforcement against piracy. It will take time, resources, and political will to develop and implement changes that meet these needs and successfully rebalance the strength of Indonesia’s IPR regime and its level of economic development. If Indonesia is successful, the hybrid model
243 Kusumadara, supra note 60, at 1. 244 A proper balance of IPR regime strength and level of economic development
would place Indonesia back on the bottom-center of the U-shaped curve in Figure 4, supra p. 114 and infra Appendix A.

136 Asian-Pacific Law & Policy Journal Vol. 14:1
predicts that it will experience economic growth similar to that of India in the 1980s and 1990s.
D. Vietnam Currently the world’s fourteenth most populous country,245
Vietnam entered the world economy much more recently than India, Brazil, or Indonesia. Moving rapidly through the levels of economic development over the last twenty years, Vietnam now stands on the cusp of a transition from the absorption stage to the innovation stage. Application of the hybrid model to Vietnam’s unique situation yields two important benefits. First, the predictions of the hybrid model, as well as the examples of India, Brazil, and Indonesia, may influence Vietnam to craft an evolving IPR regime in sync with its level of economic development. Achieving the proper balance of IPR regime strength and economic development would help Vietnam reach its economic potential without entering a prolonged, detrimental stagnation stage. Second, Vietnam’s current stage of economic development and its potential for growth will serve as a validity test of the hybrid model’s predictions.
This section will: (1) include a brief historical overview of Vietnam’s economic development and IPR protection in order to identify the key inflection points for transition between stages of economic development; (2) display the data related to each inflection point and stage of economic development; and (3) use the hybrid model to create policy prescriptions for Vietnam’s economic future.
1. History
In 1981, Vietnam, then a communist state, enacted its first IPR regime, vesting within the state the right to use all inventions.246 Vietnam modified this IPR regime in 1989 to create a more modern system that recognized patents as exclusive rights.247 With the introduction of the Civil Code of 1995, Vietnam again modified its IPR regime in 1995 by replacing all of its previous IPR regimes.248 The Vietnamese government created Civil Code 1995 to facilitate both Vietnam’s transition to a market economy and its negotiations for accession to the WTO.249 Civil Code 1995, together with over forty subsequent legal documents, created a legal foundation for the ownership of IPR in Vietnam and the recognition of
245 Nguyen, supra note 15, at 132-33. 246 Id. at 139. 247 Id. 248 Nguyen Nguyet Dzung, Vietnam Patent Law: Substantive Law Provisions
and Existing Uncertainties, 6 CHI.-KENT J. INTELL. PROP. 138, 140 (2007).
249 Kilgour, supra note 23, at 333.

2012 Halydier 137
IPR as a civil right.250 Vietnam’s IPR regime, while not fully compliant, now met the minimum requirements of TRIPS.251
In the late 1990s, Vietnam signed a Bilateral Trade Agreement with the U.S., an unprecedented expansion of economic freedom under Vietnam’s communist government, that required Vietnam to increase its political and economic transparency.252 In 2005, Vietnam passed Intellectual Property Law 50/2005 to consolidate and strengthen its IPR regime.253 This law replaced the large number of inconsistent legal documents in the previous IPR regime, improved Vietnam’s enforcement mechanisms, and addressed almost every subject of IP protection required by TRIPS.254 A year later, Vietnam acceded to the WTO due to its progress in improving its IPR regime and its political and economic transparency.255
As in the cases of India, Brazil, and Indonesia, application of the hybrid model will use data from the time periods during which Vietnam made significant changes to its IPR regime. In light of the brief history provided above, the hybrid model will consider the data available for the following key inflection points: the period prior to 1989, when the country lacked both significant IPR protections and economic growth; 1995, the year Vietnam enacted its first modern IPR regime; and 2005, the year Vietnam updated its IPR regime in preparation for WTO accession.
2. Data
In 1981, Vietnam began to modernize its economy by implementing its first IPR regime. This IPR regime focused on the personal moral rights of the inventor, rather than the inventor’s property rights, and vested the right to use every invention in the state.256 Vietnam replaced this law in 1989 with an IPR regime that recognized the exclusivity of patent rights rather than de facto government ownership.257 As Vietnam modernized its IPR regime, it began to transition through the dissemination stage and its economy grew rapidly. During the 1980s, Vietnam’s values for the hybrid model’s factors were:
250 Dzung, supra note 248, at 140. 251 Dzung, supra note 248, at 140-41. 252 Nguyen, supra note 15, at 134. 253 Dzung, supra note 248, at 140-41. 254 Id.; Nguyen, supra note 15, at 134; Kilgour, supra note 23, at 339. 255 Kilgour, supra note 23, at 338. 256 Dzung, supra note 248, at 138-39. 257 Id. at 139-40.

138 Asian-Pacific Law & Policy Journal Vol. 14:1
2.5 percent, population pursuing college degrees or higher education.258
0 percent, Industrial Capacity, measured by exports as a percentage of GDP.259
130 dollars, GNI per capita.260 90 percent, Technical Absorption Capacity, measured as the
percentage of all Vietnamese patents filed by Vietnamese citizens.261
2.8 percent, FDI inflows as a percentage of GDP.262 240 dollars, GDP per capita.263 1.13, GP Index Score of IPR regime strength.264
These numbers describe a country at the beginning stages of economic development — largely unindustrialized, with a poorly-educated labor force, and limited opportunities for FDI and technology transfers. Prior to the 1980s, Vietnam did not experience any significant economic growth nor did it have an established IPR regime. Like Indonesia, its balance of IPR regime strength and level of economic development placed it below the U-shaped curve on the lower right side of Figure 4. Implementation of its initial IPR regime in 1981 properly balanced Vietnam’s IPR regime strength and level of economic development for the first time, placing it in the top right of the U-shaped curve in Figure 4. Vietnam’s economy moved rapidly through the dissemination stage and into the absorption stage thereafter.
In 1995, while negotiating its accession to the WTO, Vietnam signaled its readiness to rapidly transition its economy through the absorption stage by replacing its IPR regime with Civil Code 1995 and related legal documents.265 However, this new IPR regime lacked enforcement and suffered from multiple inconsistencies, despite meeting
258 See Education, supra note 145; see infra Appendix B, Table 1. 259 See Exports, supra note 146; see GDP, supra note 146; see infra Appendix B,
Tables 2-4. 260 See Gross National Income, supra note 147; see infra Appendix B, Table 5. 261 See Residential Patents, supra note 148; see Foreign Patents, supra note 148;
see infra Appendix B, Tables 6-8. Despite this high percentage, Vietnam’s technical absorption capacity was actually quite low. The number is inflated here because the IPR regime recognized only the state’s right of ownership; therefore, the majority of the patents filed were filed in relation to the state in the 1980s. Dzung, supra note 248, at 138-39.
262 See FDI Inflows, supra note 149; see infra Appendix B, Table 9. 263 See GDP per Capita, supra note 150; see infra Appendix B, Table 10. 264 See Park, supra note 63, at 761-62; see infra Appendix B, Table 11. 265 Dzung, supra note 248, at 140.

2012 Halydier 139
the minimum requirements of TRIPS.266 The hybrid model contains the following values for Vietnam in 2005:
10 percent, population pursuing college degrees or higher
education.267 60 percent, Industrial Capacity, measured by exports as a
percentage of GDP.268 620 dollars, GNI per capita.269 9 percent, Technical Absorption Capacity, measured as the
percentage of all Vietnamese patents filed by Vietnamese citizens.270
4 percent, FDI inflows as a percentage of GDP.271 637 dollars, GDP per capita.272 3.03, GP Index Score of IPR regime strength.273
Between 1995 and 2005, Vietnam’s values for the hybrid model’s
factors grew substantially as its weak IPR regime fostered its growth through the absorption stage in preparation for transition into the innovation stage. These values place Vietnam’s balance of IPR regime strength and level of economic development at the bottom center of the U-shaped curve in Figure 4, the appropriate place for a country moving through the absorption stage.
In 2005, Vietnam replaced its IPR regime with Intellectual Property Law 50/2005 and become fully TRIPS-compliant in time for WTO accession in 2006. To date, data for the factors of the hybrid model are not yet available to determine whether Vietnam successfully completed its transition to the innovation stage after 2006, or whether the implementation of a stronger IPR regime occurred too soon and caused Vietnam to enter a stagnation stage. When it becomes available, this data will provide a key test of the predictive power of the hybrid model.
266 Id. 267 See Education, supra note 145; see infra Appendix B, Table 1. 268 See Exports, supra note 146; see GDP, supra note 146; see infra Appendix B,
Tables 2-4. Approximately one-third of this increase was due to agriculture exports. Nguyen, supra note 15, at 138.
269 See Gross National Income, supra note 147; see infra Appendix B, Table 5. 270 See Residential Patents, supra note 148; see Foreign Patents, supra note 148;
see infra Appendix B, Tables 6-8. 271 See FDI Inflows, supra note 149; see infra Appendix B, Table 9. 272 See GDP per Capita, supra note 150; see infra Appendix B, Table 10. 273 See Park, supra note 63, at 761-62; see infra Appendix B, Table 11.

140 Asian-Pacific Law & Policy Journal Vol. 14:1
3. Analysis Based on the data above, this section will use the hybrid model to:
(1) evaluate Vietnam’s progress through the stages of economic development; and (2) suggest policy actions for Vietnam to consider in order to mirror India’s success.
Vietnam began its transition into the dissemination stage with the passage of its first IPR regime in 1981, placing it at the top left of the U-shaped curve in Figure 4. Thereafter, it moved rapidly to encourage economic growth and simultaneously strengthen its IPR regime. It is important to note that the balance of economic development and IPR protection is a measure of an economy’s ability to innovate. In the dissemination stage, stronger IPR regimes inhibit domestic innovation and streamline economic development through FDI and technology transfer. Vietnam’s initial IPR regime accomplished this goal by privileging state ownership of IPR.
Vietnam entered the absorption stage when it adopted a modern IPR regime in 1995, and its economy continued to grow rapidly. While the new IPR regime was conceptually stronger than the previous law, it was weaker in effect and privileged domestic industries due to its internal inconsistencies and lax enforcement. Vietnam’s IPR regime strength and economic growth were properly balanced, thereby placing Vietnam at the bottom center of the U-shaped curve in Figure 4. In 2005, Vietnam updated its IPR regime by acquiring full TRIPS compliance. This signaled its attempt to transition into the innovation stage and move its balance of IPR regime strength and level of economic development towards the top right of the U-shaped curve in Figure 4.
Application of the hybrid model indicates that Vietnam’s ten-year absorption stage, from 1995 to 2005, was much shorter than India’s successful thirty-three year absorption stage from 1972 to 2005. Instead, the length and circumstances of Vietnam’s absorption stage are strikingly similar to those of Indonesia’s eleven-year absorption stage from 1985 to 1996. While India carefully managed its IPR regime to allow for the development of its domestic industries throughout the absorption stage, Indonesia prematurely instituted a generic, TRIPS-compliant IPR regime due to international pressure. This action inhibited its economic growth and placed it in a stagnation stage. Like India, Vietnam specifically applied its 1995 IPR regime to help create domestic economic growth; and similar to Indonesia, Vietnam adopted a generic, TRIPS-compliant regime ten-years later.
The hybrid models’ values for Vietnam’s balance of IPR regime strength and level of economic development indicate that, as of 2005, it is ready to begin its transition into the innovation stage. For Vietnam to avoid stagnation, it will need to carefully evaluate its IPR regime to ensure that its policies balance economic growth through FDI inflows and technology transfers while still encouraging domestic innovation and
2012 Halydier 141
industry growth. Like India, Vietnam may even need to relax enforcement on certain industries to promote domestic innovation until its transition into the innovation stage is complete. Whether Vietnam’s economy successfully made the transition or entered a stagnation stage in the years since 2005 will provide a useful test for the predictive ability of the hybrid model.
E. Summary of Results and Lessons for Developing Countries This paper endeavored to synthesize a hybrid model based on the
theoretical developments of the legal literature and the empirical research of the economics literature to provide insight into the relationship between the strength of a country’s IPR regime and its economic growth over time. This hybrid model predicted that as LDC and developing countries move through various stages of economic growth, the level of IPR protections fluctuate in a U-shaped curve over time. At the top left of the U-shaped curve in Figure 4, increased protections in the early stages of economic development facilitate needed FDI and technology transfer while a country builds a base of educated workers and a sufficiently sized domestic market. As the curve reaches the bottom center, a country’s economy matures and IPR protections should decrease, that is, they should discriminate in favor of domestic industries to allow them to grow and contribute to the country’s innovative capacity and stock of educated workers. The curve then moves up to the top right as domestic industries begin to innovate. Here, the level of IPR protections should gradually increase to protect the innovations of the domestic industries and foster competition with MNEs. The hybrid model predicts that this stage of economic growth continues until the country has a modern, TRIPS-compliant IPR regime and a fully industrialized, modern economy.
The hybrid model accurately mapped India’s successful economic rise. India implemented IPR protections while in the dissemination stage of economic development; removed those protections over time, including protections for its pharmaceutical industry; and experienced a marked uptick in economic activity as it transitioned into the absorption stage. As its domestic industries began to innovate and it transitioned into the innovation stage, India significantly increased its IPR protections in accordance with its TRIPS obligations. India continues to grow and improve the enforcement of its IPR regimes as it now begins the transition into a fully industrialized economy.
Brazil and Indonesia, on the other hand, both failed to properly balance their economic growth and IPR regime strength over time as they suffered through successive stagnation stages. According to the hybrid model, these countries entered stagnation stages when they prematurely lowered their IPR regime strengths in an attempt to boost their domestic industries. They lacked the necessary economic development and innovative capacity to take advantage of these measures and allowed

142 Asian-Pacific Law & Policy Journal Vol. 14:1
MNEs to continue to dominate their economies. Brazil and Indonesia also succumbed to international pressure, especially from the U.S., and substantially increased the strength of their IPR regimes in a manner inconsistent with their economic development and capacity for domestic innovation. Despite being two of the most populous countries in the world with increasingly educated labor pools, an abundance of natural resources, high GNI per capita, and similar starting positions to that of India, both Brazil and Indonesia’s economies did not perform well due in large part to the timing of the changes to their IPR regimes. Brazil’s and Indonesia’s experiences provide validation for the hybrid model and show how a country can enter stagnation at any level of economic development by implementing an inappropriate amount of IPR protections.
Finally, this study examined the Vietnamese case, a country that will provide a key test for the validity of the hybrid model in coming years. Currently, the model predicts that Vietnam will grow substantially under a rather strong IPR regime as it continues to expand its domestic industrial capacity and transition through the innovation stage. This growth should be similar to the growth experienced by India from 1995 to 2005. If this growth is derailed, and Vietnam stagnates after 2005, the likely explanation is that Vietnam increased its IPR protections before its emerging domestic industrial base could successfully compete with MNEs. If this is indeed the case, the hybrid model predicts that Vietnam’s transition from the absorption stage to the innovation stage will take more time, thereby delaying Vietnam’s transition into a fully industrialized economy.
CONCLUSION: FUTURE RESEARCH AND POLICIES
A. Future Research This study combined legal and economic studies to create a hybrid
model of economic development and IPR regime strength. Future research is necessary to refine the factors of the hybrid model by determining whether there exist specific values for each factor that signals when a country is ready to make a successful transition. Alternatively, future research may reveal that the amount of change a factor experiences over time, rather than absolute values, is a more accurate signal of a successful transition. Moreover, the hybrid model should be applied to the historical development of additional countries before it is used to recommend a course of action for LDC and developing countries that are currently struggling to balance their economic growth and IPR regime strength.
Further research opportunities in this area abound, not the least of which is the growing intersection between the legal and economic literature. Both the legal and economic disciplines contain a wealth of information that could inform and benefit the analyses. Legal scholars can benefit extensively from the rigor and breadth of the economic studies conducted in the last fifteen years on issues of intellectual property rights

2012 Halydier 143
in LDC and developing countries. These studies will provide insight into the empirical effects that IPR regimes of different strengths have on different countries. They will also help legal scholars explain why conceptually sound IPR regimes sometimes fail to protect intellectual property rights and promote the economy, while less legitimate methods of protection sometimes prove to be effective in achieving both. Conversely, economists can use the legal theoretical frameworks and policy projections as useful roadmaps to suggest areas for future research and subjects for new empirical studies.
B. Policy Conclusions for the U.S. and Other Developed Countries This study’s combination of the legal and economic literature
provides new insights into the current tension between the developed countries’ push for a system of globally homogenized IPR regimes and the LDC and developing countries’ need to maintain weak IPR regimes that protect their fledgling domestic industries. Moving towards an integrated set of standards for effective IPR regimes would ideally result in the global implementation of legally sound and conceptually strong IPR regimes. Yet, implementing these polices in a vacuum, without accounting for the economic costs of premature implementation on LDC and developing countries, will compromise the integrity of the system and reduce the long-term economic growth of the entire world. Implementing these global requirements tends to benefit foreign MNEs at the expense of the developing country’s own domestic industries, and privileges international rather than domestic innovation. Further, as illustrated by the hybrid model, the implementation of IPR restrictions out of sync with economic development set Indonesia and Brazil back economically and caused both countries to enter stagnation stages. Only in recent years have Indonesia and Brazil begun to recover and reach their previous levels of economic development. For current LDC and developing countries in Latin America, Africa, the Middle East, Asia, and Eastern Europe, adoption of international standards without a prior evaluation of the effects on their particular economies may significantly inhibit their future economic growth.
The U.S. is at the forefront of this movement to implement a globally homogenous system of IPR regimes. It currently uses Section 301 of the Trade Act of 1974 (“Special 301”) as one of its main policy tools for requesting that developing countries strengthen their IPR regimes. The use of Special 301 often benefits U.S. MNEs at the expense of the domestic industries in developing countries. For example, the Office of the United States Trade Representative (“USTR”) currently maintains extensive pressure on developing countries to reform their pharmaceutical IPR regimes in its most recent Special 301 Report (“Report”) at the request of

144 Asian-Pacific Law & Policy Journal Vol. 14:1
the U.S. pharmaceutical industry.274 The general Report contains a special section devoted to the pharmaceutical industry,275 and of the forty countries currently listed on either the U.S. “Watch List” or “Priority Watch List,” the USTR requests that twenty-four of them increase the strength of their pharmaceutical IPR regimes.276
Specifically, the Special 301 finds that India must change its laws to allow the patenting of new chemicals, even without a showing of increased efficacy; address its patent court and registration backlogs; streamline its patent opposition proceedings; protect against unfair commercial use and disclosure of test data; provide stricter, deterrent-level sentences for IPR violations; and prioritize the prosecution of IPR offenses.277 Similarly, the Special 301 requires Brazil to continue to address piracy by generally increasing its enforcement measures, by providing deterrent-level sentences, and by increasing its protections against unfair commercial use and unauthorized disclosure of test data for pharmaceutical products.278 The Special 301 is concerned with Indonesia’s failure to adequately police its counterfeit pharmaceutical market279 and requests that Indonesia: substantially increase its enforcement efforts; update its judicial system to provide deterrent-level penalties for IPR violations; implement a system to protect test results and data used to win marketing approval for pharmaceutical products; and address market barriers to IPR-intensive industries, such as import restrictions.280 For Vietnam, the Special 301 requests a substantial increase in enforcement and better coordination of enforcement agencies; a crack down on counterfeit goods sold in the marketplace; an increase in the number of IPR prosecutions; implementation of higher, deterrent-level sentences for IPR violations; and administrative clarification of Vietnam’s system for protection against unfair commercial use and unauthorized disclosure of test data in the pharmaceutical industry.281
The findings of the hybrid model may reduce the growing tension between the developed countries’ request for strong global IPR standards and the developing countries’ need for locally preferential IPR regimes. As
274 Ronald Kirk, OFF. U.S. TRADE REPRESENTATIVE, 2011 Special 301 Report 1
(2011). 275 Id. at 14-15. 276 See id. These numbers were compiled by identifying each of the offending
countries listed in the 2011 Special 301 Report. 277 Id. at 28-29. 278 Id. at 32. 279 Id. at 28-29. 280 Id. at 29. 281 Id. at 41-42.

2012 Halydier 145
illustrated in India’s case study, allowing a country to adopt economically appropriate IPR regimes that gradually increase in strength as the economy grows, provides richer markets and better partnership opportunities for MNEs in the long-term. MNEs’ inability to obtain short-term profits in India between 1970 and 1990 allowed India to create a market and domestic industry from which the U.S. pharmaceutical industry now benefits. In fact, U.S. pharmaceutical companies are now eager to partner with India’s pharmaceutical industry because of its success as an emerging world leader in pharmaceuticals. India’s low labor costs, skilled workforce, and increasingly affluent population are additional incentives for U.S.-Indian pharmaceutical partnerships.282 Rather than remain an ostracized imitator, relegated to pumping out cheap generic drugs that undercut the profits of MNEs around the world, India now presents significantly enhanced economic opportunities to the benefit of MNEs.
The hybrid model indicates that it would behoove the international community to facilitate the expansion of domestic industries in developing countries so as to reduce innovation, production, and testing costs and create new affluent markets, rather than focusing on efforts to freeze LDC and developing countries out of the market. Furthermore, if LDC and developing countries were allowed to create their own domestic generic drug industries, there would be significant public health benefits for those afflicted with deadly diseases in developing countries around the world.283 The international community needs solutions that balance economic development and IPR regime strength to the benefit of developed countries, LDC and developing countries, the international pharmaceutical industry, and the public health of citizens around the world. Hopefully the hybrid model developed here can serve as a basis for future collaboration and new solutions from the legal and economic disciplines.
282 Mueller, supra note 10, at 533-34. 283 Mueller, supra note 10, at 537.

146 Asian-Pacific Law & Policy Journal Vol. 14:1
APPENDIX A
Figure 1: Graph of a country’s Gibbon’s model of Economic Development over Time.284
Figure 2: Graph of Chen & Puttitanun’s model of IPR Strength v. GDP per capita.285
284 Gibbons, supra note 17, at 937, 939-41, 944. 285 Chen & Puttitanun, supra note 2, at 488.

2012 Halydier 147
Figure 3: Graph of the hybrid model that combines Gibbons model of Economic Development v. Time with Chen & Puttitanun’s model of IPR Regime Strength v. GDP.
Figure 4: Graph of both proper and improper levels of GDP v. IPR strength and the resulting effects on the level of Economic Development v. Time.

148 Asian-Pacific Law & Policy Journal Vol. 14:1
APPENDIX B
Table 1: Percentage of population enrolled in a bachelors-level degree or higher in Brazil,
Indonesia, India, and Vietnam.286
Table 2: Goods exports in current U.S. dollars for Brazil, Indonesia, India, and
Vietnam.287
Table 3: GDP in current U.S. dollars for Brazil, Indonesia, India, and Vietnam.288
Table 4: Industrial Capacity - Goods Exports as a percentage of GDP in Brazil,
Indonesia, India, and Vietnam.289
Table 5: GNI Per Capital, calculated via the World Bank’s Atlas estimation method for
Brazil, Indonesia, India, and Vietnam.290
286 See Education, supra note 145. 287 See Exports, supra note 146. 288 See GDP, supra note 146. 289 Data derived from Tables 2 and 3.
290 See Gross National Income, supra note 147.
Education Level of Population 1960 1965 1970 1975 1980 1985 1990 1995 2000 2005
India 4.92 4.99 4.96 5.9 6.01 5.59 9.56 11.01Brazil 4.74 10.08 11.15 10.615 10.81 11.585 16.06 25.49
Vietnam 1.77 1.77 2.56 2.01 2.83 2.89 9.6 9.68Indonesia 2.67 2.49 3.685 6.31 8.66 11.71 13.395 17.55
Industrial Capacity - Goods Exports 1960 1965 1970 1975 1980 1985 1990 1995 2000 2005
India 4.7E+09 8.3E+09 9.5E+09 1.8E+10 3.1E+10 4.3E+10 1E+11Brazil 8.5E+09 2E+10 2.6E+10 3.1E+10 4.7E+10 5.5E+10 1.2E+11
Vietnam 1.4E+10 3.2E+10Indonesia 1.9E+10 2.7E+10 4.7E+10 6.5E+10 8.7E+10
Industrial Capacity - Gross Domestic Product 1960 1965 1970 1975 1980 1985 1990 1995 2000 2005
India 6.1E+10 9.7E+10 1.8E+11 2.3E+11 3.2E+11 3.6E+11 4.6E+11 8.3E+11Brazil 4.2E+10 1.2E+11 2.4E+11 2.2E+11 4.6E+11 7.7E+11 6.4E+11 8.8E+11
Vietnam 1.4E+10 6.5E+09 2.1E+10 3.1E+10 5.3E+10Indonesia 9.7E+09 3.2E+10 7.8E+10 8.7E+10 1.1E+11 2E+11 1.7E+11 2.9E+11
Industrial Capacity - Exports as a Percentage of GDP 1960 1965 1970 1975 1980 1985 1990 1995 2000 2005
India 4 4 4 5 8 9 12Brazil 6 8 11 6 6 8 13
Vietnam 46 61Indonesia 25 21 23 23 39 30

2012 Halydier 149
Table 6: Resident Patent Applications for Brazil, Indonesia, India, and Vietnam.291
Table 7: Non-Resident Patent Applications for Brazil, Indonesia, India, and Vietnam.292
Table 8: Technical Absorption Capacity - Percentage of Patents Filed by Residents for
Brazil, Indonesia, India, and Vietnam.293
Table 9: FDI inflows as a percentage of GDP for Brazil, Indonesia, India, and
Vietnam.294
291 See Residential Patents, supra note 148. 292 See Foreign Patents, supra note 148. 293 Data derived from Tables 6 and 7.
294 See FDI Inflows, supra note 149.
Gross National Income Per Capita, Atlas Method 1960 1965 1970 1975 1980 1985 1990 1995 2000 2005
India 110 190 270 300 390 380 450 750Brazil 440 1170 2190 1570 2700 3730 3860 3960
Vietnam 130 250 390 620Indonesia 80 230 510 530 630 1020 580 1260
Technical Absorption Capacity - Resident Patent Applications 1960 1965 1970 1975 1980 1985 1990 1995 2000 2005
India 1278 1122 1207 982 1147 1545 2179 4521Brazil 3839 2533 2149 1954 2389 2707 3080 3905
Vietnam 30 58 23 34 180Indonesia 4 3 5 49 74 61 156 234
Technical Absorption Capacity - Foreign Patent Applications 1960 1965 1970 1975 1980 1985 1990 1995 2000 2005
India 3864 1917 1817 2493 2673 5021 6324 19984Brazil 5385 7293 6228 4565 5148 4741 14296 16100
Vietnam 3 17 659 1210 1767Indonesia 276 494 475 731 1941 2813 3733 4069
Technical Absorption Capacity - % of Patents Filed by Residents 1960 1965 1970 1975 1980 1985 1990 1995 2000 2005
India 24 36 39 28 30 23 25 18Brazil 41 25 25 29 31 36 17 19
Vietnam 90 77 3 2 9Indonesia 1 1 6 71 2 4 5
FDI inflows % of GDP 1960 1965 1970 1975 1980 1985 1990 1995 2000 2005
India -0.01 0.04 0.05 0.07 0.6 0.78 0.91Brazil 1.05 0.81 0.65 0.21 0.63 5.08 1.71
Vietnam 2.78 8.59 4.16 3.69Indonesia 0.35 0.96 2.15 -2.76 2.92

150 Asian-Pacific Law & Policy Journal Vol. 14:1
Table 10: National GDP per Capita in Current U.S. dollars for Brazil, Indonesia, India,
and Vietnam.295
Table 11: Ginarte & Park’s Index of Intellectual Property Regime Strength for Brazil,
Indonesia, India, and Vietnam. Scale of 0-5.296
295 See GDP per Capita, supra note 150. 296 See Park, supra note 63, at 761-62.
National GDP Per Capita 1960 1965 1970 1975 1980 1985 1990 1995 2000 2005
India 111.76 158.12 267.41 300.52 373.7 382.22 452.97 761.97Brazil 440.55 1143.09 1930.99 1636.32 3086.88 4751.07 3696.15 4743.26
Vietnam 239.43 97.76 284.13 401.52 636.91Indonesia 82.59 244.79 532.22 537.97 645.07 1055.51 803.88 1304.08
GP Index 1960 1965 1970 1975 1980 1985 1990 1995 2000 2005India 1.03 1.03 1.03 1.03 1.03 1.03 1.23 1.03 2.27 3.76
Brazil 1.21 1.21 1.21 1.08 1.28 1.28 1.28 1.48 3.59 3.59Vietnam 1.13 1.13 1.13 1.13 1.13 1.13 1.38 2.9 2.9 3.03
Indonesia 0.2 0.2 0.2 0.2 0.2 0.2 1.56 0.2 2.47 2.77

2012 Halydier 151
APPENDIX C
Table 12: Components and Scoring Method of the GP Intellectual Property Regime
Strength Index.297
297 Id. at 761, 765; See Walter G. Park & Smita Wagh, Chapter 2: Index of
Patent Rights, Economic Freedom of the World: 2002 Annual Report 33 (2002) (providing a full explanation of the measures used).