A Holistic Paleolimnological Study of North-Central
148
A Holistic Paleolimnological Study of North-Central Mongolian Lakes Part I: A Physical, Chemical, and Geological Survey of North-Central Mongolian Lakes Part II: Development of Spectral Reflectance Methodologies to Infer Pigment Concentrations in Mongolian Lake Sediments Part III: Reconstruction of Holocene Lake Productivity and Inferred Climate Histories from High- Altitude Sites in the Baroon Taiga Mountains, Northern Mongolia By Kevin Daniel Robinson BPhil Geology, University of Pittsburgh, 2004 Submitted to the Graduate Faculty of College of Arts and Sciences in partial fulfillment of the requirements for the degree of Master in Science University of Pittsburgh 2007
Transcript of A Holistic Paleolimnological Study of North-Central
A Holistic Paleolimnological Study of North-Central Mongolian Lakes
Part I: A Physical, Chemical, and Geological Survey of North-Central Mongolian Lakes
Part II:
Development of Spectral Reflectance Methodologies to Infer Pigment Concentrations in Mongolian Lake Sediments
Part III:
Reconstruction of Holocene Lake Productivity and Inferred Climate Histories from High-Altitude Sites in the Baroon Taiga Mountains, Northern Mongolia
By
Kevin Daniel Robinson
BPhil Geology, University of Pittsburgh, 2004
Submitted to the Graduate Faculty of
College of Arts and Sciences in partial fulfillment
of the requirements for the degree of
Master in Science
University of Pittsburgh
2007

ii
UNIVERSITY OF PITTSBURGH
College of Arts and Sciences
This thesis was presented
by
Kevin Daniel Robinson
It was defended on
6/12/2007
and approved by
Mark Abbott, PhD, Departmental of Geology and Planetary Science
Charles Jones, PhD, Departmental of Geology and Planetary Science
Joseph Ortiz, PhD, Department of Geology, Kent State University
Thesis Director: Michael Rosenmeier, PhD, Department of Geology and Planetary Science

iii
Concern for environmental degradation in response to recent warming trends is highly relevant
for modern Mongolian society. A general lack of high-resolution, long-term information on
regional environmental history however, limits any thorough understanding of the potential rate
and extent of such ecosystem alteration. Paleoenvironmental methods are thereby required to
assess baseline conditions within sensitive ecosystems and thereby evaluate past climate and
environmental changes. Here, a detailed paleolimnological study of northern Mongolian lakes is
presented in an effort to examine the response of sensitive lake systems to climatic variation
during the Holocene. More specifically, eight high-alpine lakes with the Baroon Taiga
A Holistic Paleolimnological Study of North-Central Mongolian Lakes
Part I: A Physical, Chemical, and Geological Survey of North-Central Mongolian Lakes
Part II:
Development of Spectral Reflectance Methodologies to Infer Pigment Concentrations in Mongolian Lake Sediments
Part III:
Reconstruction of Holocene Lake Productivity and Inferred Climate Histories from High-Altitude Sites in the Baroon Taiga Mountains, Northern Mongolia
Kevin Daniel Robinson, M.S.
University of Pittsburgh, 2007
iv
Mountains of northern Mongolia were identified and studied as part of a broad survey of
north/central Mongolian lake systems. The application of diffuse reflectance spectroscopy and
standard loss-on-ignition techniques to radiocarbon-dated sediment core samples provides a
high-resolution history of late Holocene algal productivity within the basins of Sanjin, Asgat and
Ganbold Nuur, and a low-resolution full-Holocene paleoproductivity history for Mustei Nuur.
Evidence for a long-term decrease in production rates in response to orbital forcing from 8000
cal yr B.P. is provided by the Mustei Nuur record. Inter-core comparison of high-resolution
records provides evidence for regional growing season temperature variations as the dominant
mechanism controlling higher frequency aquatic productivity variations during the late Holocene
period. Diminished regional aquatic productivity trends are observed during the Little Ice Age
(300 – 100 cal yr B.P.). Increased productivity is noted between 900 and 1100 cal yr B.P.
(coincident with the so-called Medieval Climatic Anomaly) and from ~ 100 cal yr B.P. to the
present, likely in response to 20th century warming trends. A direct comparison of the Sanjin
and Ganbold Nuur aquatic productivity records to nearby tree-ring based temperature
reconstructions supports the hypothesis that the high-frequency aquatic productivity changes
reflect regional temperature variations, and thereby extend the regional temperature
reconstructions to 3000 cal yr B.P.
v
TABLE OF CONTENTS
PREFACE............................................................................................................................... XVII
1.0 INTRODUCTION TO THE INVESTIGATION...................................................... 1
1.1 INVESTIGATIVE RELEVANCE..................................................................... 3
1.2 MODERN GEOGRAPHY, ECOLOGY, AND CLIMATE OF MONGOLIA
5
1.3 PALEOCLIMATIC HISTORY OF MONGOLIA......................................... 10
2.0 BASIC LIMNOLOGICAL SURVEY OF TWENTY-ONE NORTH/CENTRAL
MONGOLIAN LAKES.............................................................................................................. 18
2.1 INTRODUCTION ............................................................................................. 18
2.2 MATERIALS AND METHODS...................................................................... 19
2.3 RESULTS ........................................................................................................... 20
2.3.1 Central Mongolian lakes ............................................................................ 21
2.3.1.1 Shireet Nuur........................................................................................ 22
2.3.1.2 Hoh Nuur............................................................................................. 22
2.3.1.3 Tsagaan Nuur...................................................................................... 23
2.3.2 North-Central Mongolia............................................................................. 24
2.3.2.1 Terhin Tsagaan Nuur......................................................................... 24
2.3.2.2 Har Nuur ............................................................................................. 25

vi
2.3.2.3 Baga Nuur ........................................................................................... 26
2.3.2.4 Tsegan Nuur........................................................................................ 27
2.3.2.5 Holvoo Nuur........................................................................................ 28
2.3.2.6 Oigon Nuur.......................................................................................... 29
2.3.2.7 Buust Nuur .......................................................................................... 29
2.3.2.8 Zuun Nuur........................................................................................... 30
2.3.2.9 Gandan Nuur ...................................................................................... 31
2.3.2.10 Sangeen Dalai Nuur.......................................................................... 32
2.3.2.11 Tunamal Nuur................................................................................... 32
2.3.2.12 Tevdan Nuur ..................................................................................... 33
2.3.3 Northern Mongolia ..................................................................................... 33
2.3.3.1 Sanjin Nuur......................................................................................... 34
2.3.3.2 Mustei Nuur ........................................................................................ 35
2.3.3.3 Ganbold Nuur ..................................................................................... 36
2.3.3.4 Tsogtoo Nuur....................................................................................... 37
2.3.3.5 Batbold Nuur ...................................................................................... 38
2.3.3.6 Mandax Nuur...................................................................................... 38
2.4 DISCUSSION..................................................................................................... 39
2.4.1 Factors controlling chemical enrichment of Mongolian lake water....... 40
2.4.2 Factors controlling pH of Mongolian lake water ..................................... 44
2.5 CONCLUSIONS................................................................................................ 46

vii
3.0 SEDIMENTARY PIGMENT AND DIFFUSE REFLECTANCE
SPECTROSCOPY ANALYSES: INTRODUCTION, METHODOLOGIES, AND
APPLICATIONS ........................................................................................................................ 48
3.1 SEDIMENTARY PIGMENT ANALYSES..................................................... 48
3.1.1 Introduction to Pigment Analysis in Lake Sediments ............................. 48
3.2 CHLOROPHYLL A DEGRADATION PROCESSES .................................. 49
3.3 PIGMENT ANALYSIS TECHNIQUES ......................................................... 52
3.3.1 High performance liquid chromatography (HPLC)................................ 53
3.3.1.1 Pigment extraction and HPLC analysis............................................ 53
3.3.2 Transmittance Spectrophotometry ........................................................... 55
3.3.2.1 Pigment extraction and spectrophotometric analysis ..................... 56
3.4 VISIBLE AND NEAR-INFRARED DIFFUSE REFLECTANCE
SPECTROSCOPY.............................................................................................................. 56
3.4.1 Introduction to diffuse reflectance spectroscopy ..................................... 56
3.4.2 Absorption processes .................................................................................. 59
3.4.2.1 Electronic processes............................................................................ 59
3.4.2.2 Vibrational processes ......................................................................... 61
3.4.3 VNIRS analysis ........................................................................................... 62
3.5 VNIR SPECTRAL PROPERTIES OF CHLOROPHYLL A AND
CHLOROPHYLL A DERIVATIVES.............................................................................. 64
3.6 HISTORY OF THE USE OF SPECTROSCOPIC TECHNIQUES IN
SEDIMENTARY PIGMENT STUDIES.......................................................................... 65
viii
4.0 USE OF DIFFUSE REFLECTANCE SPECTROSCOPY AS A QUALITATIVE
INDICATOR OF PALEOPIGMENT CONCENTRATIONS IN THE LAKE SEDIMENTS
OF NORTHERN MONGOLIA................................................................................................. 71
4.1 INTRODUCTION ............................................................................................. 71
4.2 STUDY AREA AND FIELD METHODS ....................................................... 73
4.3 METHODS......................................................................................................... 74
4.4 RESULTS ........................................................................................................... 76
4.5 DISCUSSION..................................................................................................... 81
4.5.1 VNIRS as a valid determinant of CDP and Chl a concentrations.......... 81
4.5.2 VNIRS as a valid indicator of paleoproductivity ..................................... 83
4.6 CONCLUSIONS................................................................................................ 85
5.0 RECONSTRUCTION OF HOLOCENE LAKE PRODUCTIVITY AND
INFERRED CLIMATE HISTORIES FROM HIGH-ALTITUDE SITE IN THE BAROON
TAIGA MOUNTAINS, NORTHERN MONGOLIA, USING SPECTRAL
REFLECTANCE ANALYSES.................................................................................................. 87
5.1 INTRODUCTION ............................................................................................. 87
5.2 STUDY AREA ................................................................................................... 89
5.3 FIELD METHODS............................................................................................ 94
5.4 LABORATORY METHODS ........................................................................... 95
5.5 RESULTS ........................................................................................................... 97
5.5.1 Ganbold Nuur.............................................................................................. 97
5.5.2 Sanjin Nuur ............................................................................................... 103
5.5.3 Asgat Nuur................................................................................................. 104

ix
5.5.4 Boorog Nuur.............................................................................................. 106
5.5.5 Batbold Nuur............................................................................................. 107
5.5.6 Tsogtoo Nuur............................................................................................. 108
5.5.7 Mustei Nuur............................................................................................... 108
5.5.8 Mandax Nuur ............................................................................................ 110
5.6 DISCUSSION................................................................................................... 111
5.7 CONCLUSIONS.............................................................................................. 118
6.0 CONCLUSION......................................................................................................... 119
6.1 FUTURE LIMNOLOGICAL ANALYSES................................................... 120
6.2 FUTURE APPLICATIONS OF PIGMENT ANALYSES AND SPECTRAL
REFLECTANCE METHODOLOGIES ........................................................................ 121
6.3 FUTURE PALEOLIMNOLOGICAL ANALYSES..................................... 122
6.4 FUTURE FIELDWORK................................................................................. 122
BIBLIOGRAPHY..................................................................................................................... 124

x
LIST OF TABLES
Table 2-1. General surveyed lake data......................................................................................... 21
Table 2-2. Lake's physical and physiolimnological characteristics ............................................. 39
Table 2-3 WMO station information for central/northern Mongolia........................................... 43
Table 4-1. Baroon Taiga lake site characteristics. ....................................................................... 73
Table 4-2. Spectral index data for SAN-A-6-VIII-05 and GAN-B-10-VIII-05 sediments based
on algorithms presented by Das et al (2005) and Wolfe et al (2006). .......................................... 78
Table 4-3. Total determined Chl a + CDP concentrations for SAN-A-6-VIII-05 and GAN-B-10-
VIII-05 sediments from HPLC and spectrophotometric analyses. ............................................... 79
Table 4-4. Correlation coefficients (r2) from linear regressions between spectral indices and total
determined Chl a + CDP concentrations for SAN-A-6-VIII-05 (n = 20) and GAN-B-10-VIII-05
sediments (n = 9) from HPLC and spectrophotometric analyses (*P<0.0001, **P<0.001,
***P<0.01). .................................................................................................................................. 80
Table 5-1. General site characteristics for the studies lakes. ....................................................... 93
Table 5-2. Sediment core information. ........................................................................................ 94
Table 5-3. AMS radiocarbon dates for samples from the Baroon Taiga Mountain lakes. *Dated
horizons not included in age-models. **Dated horizons with ultimately altered sample depths. 98

xi
LIST OF FIGURES
Figure 1-1. Geographic, ecology and climate maps of Mongolia: (a) elevation map (m.a.m.s.l.),
(b) ecological zones, (c) total annual precipitation (mm), (d) average winter temperatures (°C),
(e) average summer temperatures (°C). .......................................................................................... 6
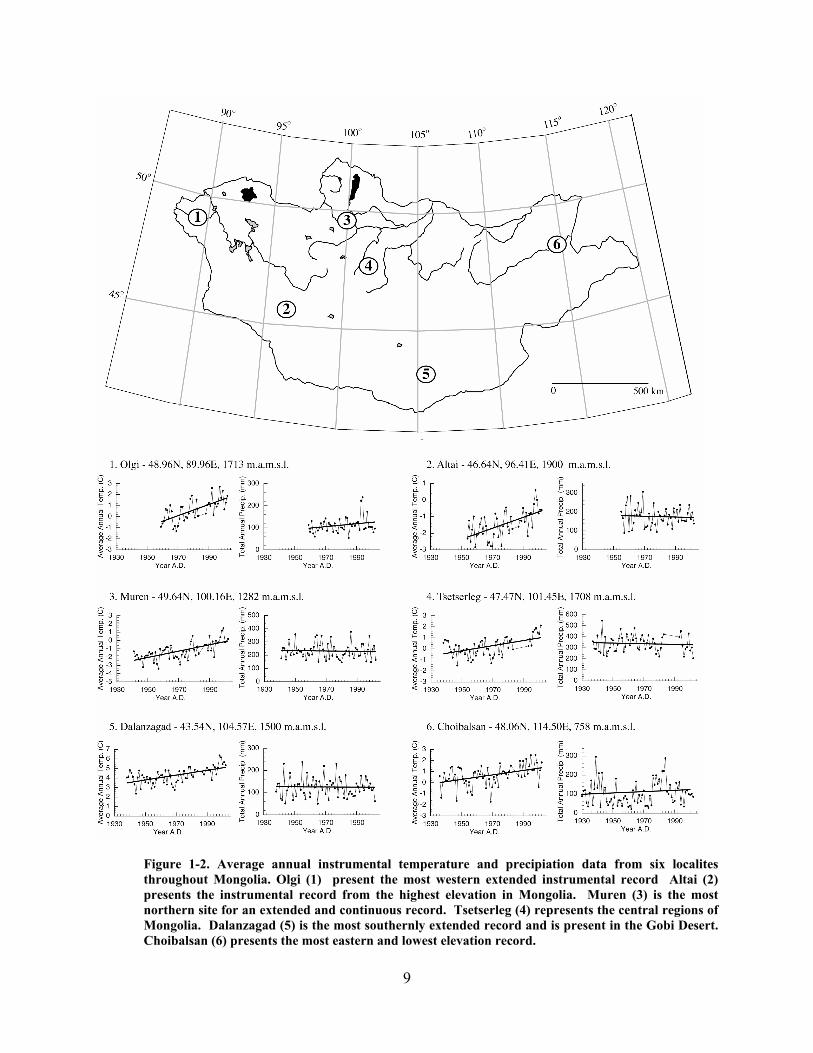
Figure 1-2. Average annual instrumental temperature and precipiation data from six localites
throughout Mongolia. Olgi (1) present the most western extended instrumental record Altai (2)
presents the instrumental record from the highest elevation in Mongolia. Muren (3) is the most
northern site for an extended and continuous record. Tsetserleg (4) represents the central regions
of Mongolia. Dalanzagad (5) is the most southernly extended record and is present in the Gobi
Desert. Choibalsan (6) presents the most eastern and lowest elevation record. ............................ 9
Figure 1-3. Previous Mongolian paleoenvironmental studies site map. T = tree-ring study, L =
lake deposit study, G = geomorphological study, I = ice deposit study. ...................................... 11
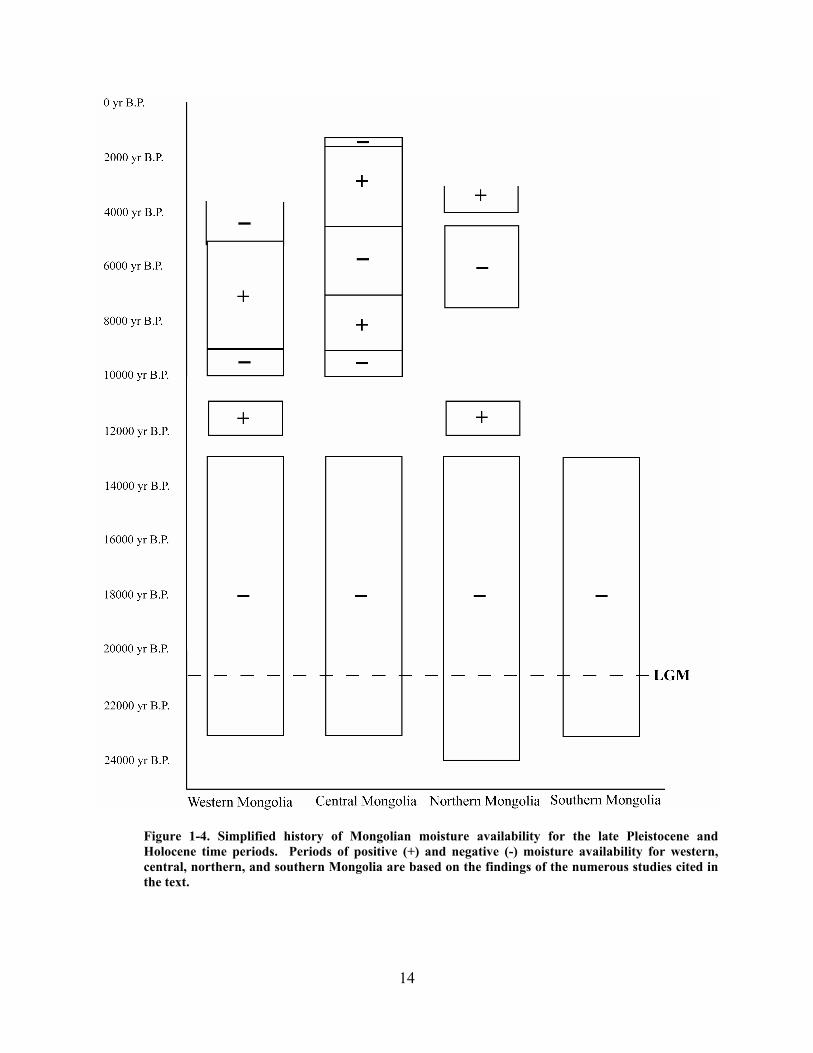
Figure 1-4. Simplified history of Mongolian moisture availability for the late Pleistocene and
Holocene time periods. Periods of positive (+) and negative (-) moisture availability for western,
central, northern, and southern Mongolia are based on the findings of the numerous studies cited
above. ............................................................................................................................................ 14
Figure 1-5. Temperature-inferred tree ring chronologies for northern and central Mongolia
(Jacoby et al. 1996; D'Arrigo et al. 2000; D'Arrigo et al. 2001). All tree ring widths are

xii
standardized to their mean with the exception of the Sol Dav record (presented as published).
LIA = Little Ice Age, MWP = Medieval Warm Period as presented by the studies. ................... 15
Figure 1-6. Precipitation-inferred tree ring chronologies for northern and central Mongolia
(Pederson et al. 2001; Davi et al. 2006). All tree ring widths are standardized to their mean. ... 16
Figure 2-1. Mongolian Lake Survey Site Map. 1 = Shireet Nuur, 2= Hoh Nuur, 3= Tsagaan
Nuur, 4 = Terhin Tsagaan Nuur, 5 = Har Nuur, 6= Baga Nuur, 7 = Tsegan Nuur, 8 = Holvoo
Nuur, 9 = Oigon Nuur, 10 = Buust Nuur, 11 = Zuun Nuur, 12 = Gandan Nuur, 13 = Sangeen
Dalai Nuur, 14 = Tunamal Nuur, 15 = Tevdan Nuur, 16-21 = Sanjin Nuur, Mustei Nuur,
Ganbold Nuur, Batbold Nuur, Tsogtoo Nuur, Mandax Nuur. ...................................................... 20
Figure 2-2. Tsagaan Nuur bathymetric map and water column physical profile......................... 24
Figure 2-3. Map showing spatial distribution of Har Nuur, Baga Nuur, and Tsegan Nuur as well
as surrounding lakes and ecological zones ................................................................................... 26
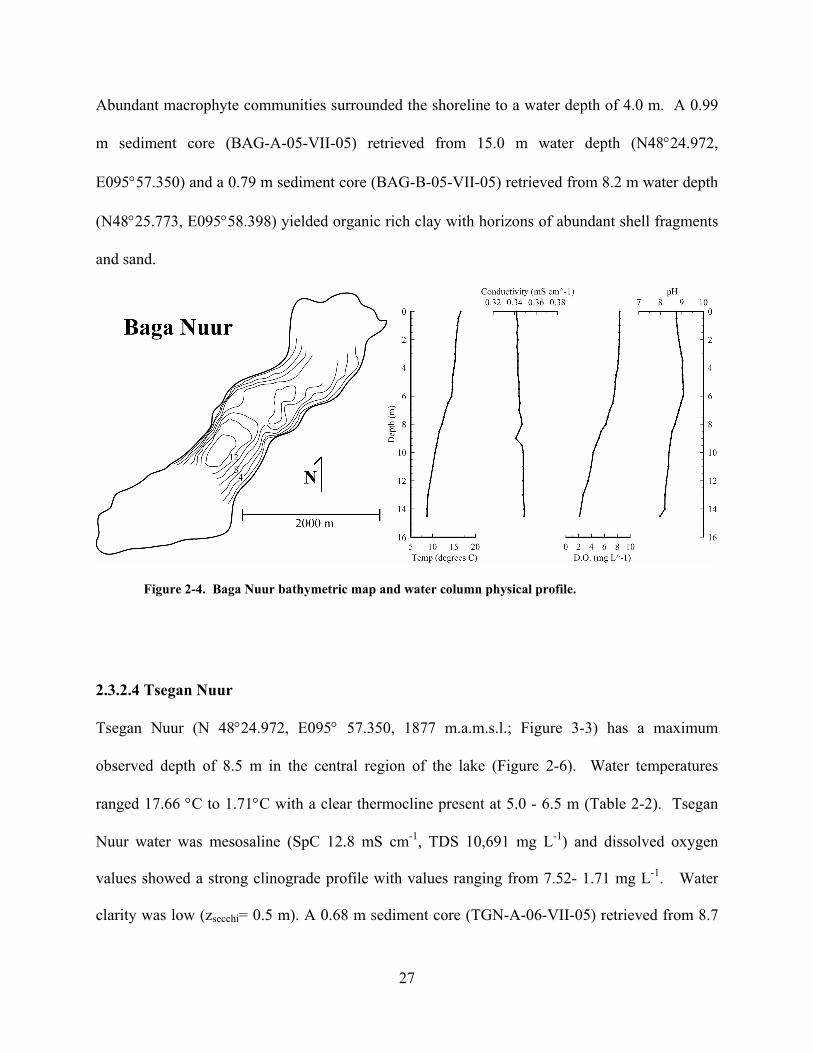
Figure 2-4. Baga Nuur bathymetric map and water column physical profile.............................. 27
Figure 2-5. Tsegan Nuur bathymetric map and water column physical profile. ......................... 28
Figure 2-6. Map showing spatial distribution of Holvoo Nuur, Buust Nuur, and Oigon Nuur as
well as surrounding lakes and ecological zones. .......................................................................... 29
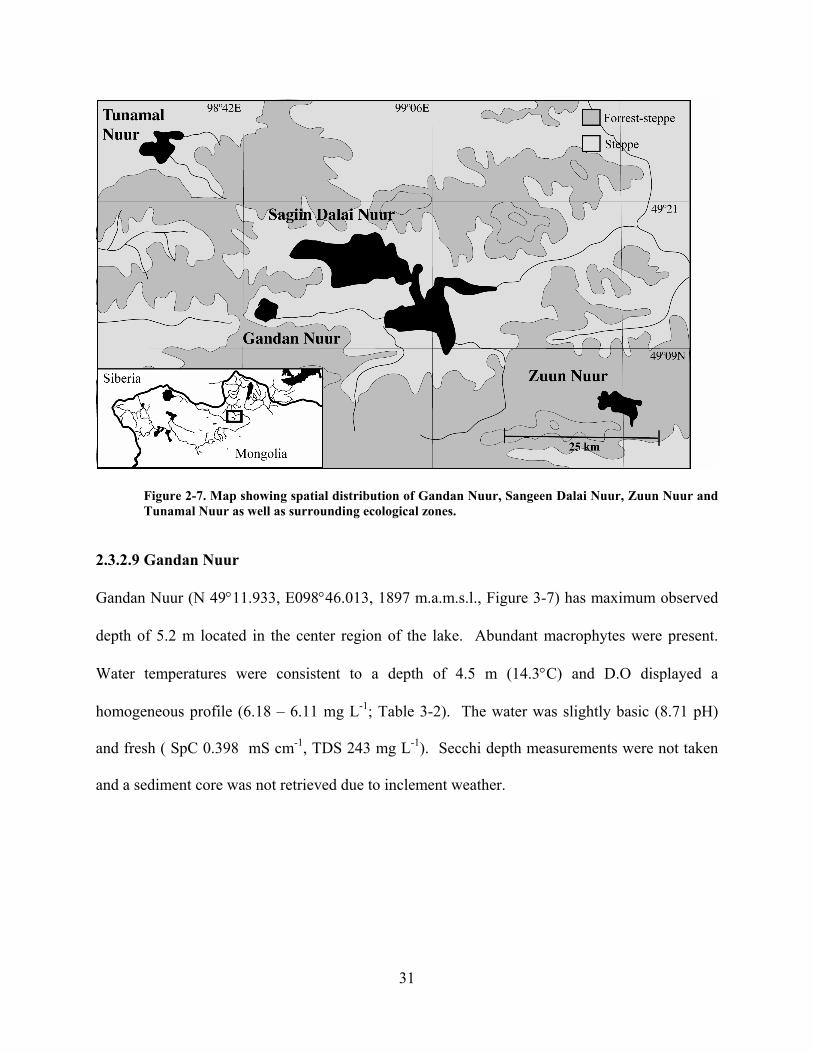
Figure 2-7. Map showing spatial distribution of Gandan Nuur, Sangeen Dalai Nuur, Zuun Nuur
and Tunamal Nuur as well as surrounding ecological zones. ....................................................... 31
Figure 2-8. Locations of surveyed lakes in the Baroon Taiga Mountains of northern Mongolia.
The lakes are present in two glacially scoured two valleys located approximately 15 km apart
and are at the alpine tundra/taiga transition zone.......................................................................... 33
Figure 2-9. Sanjin Nuur bathymetric map and water column physical profile............................ 35
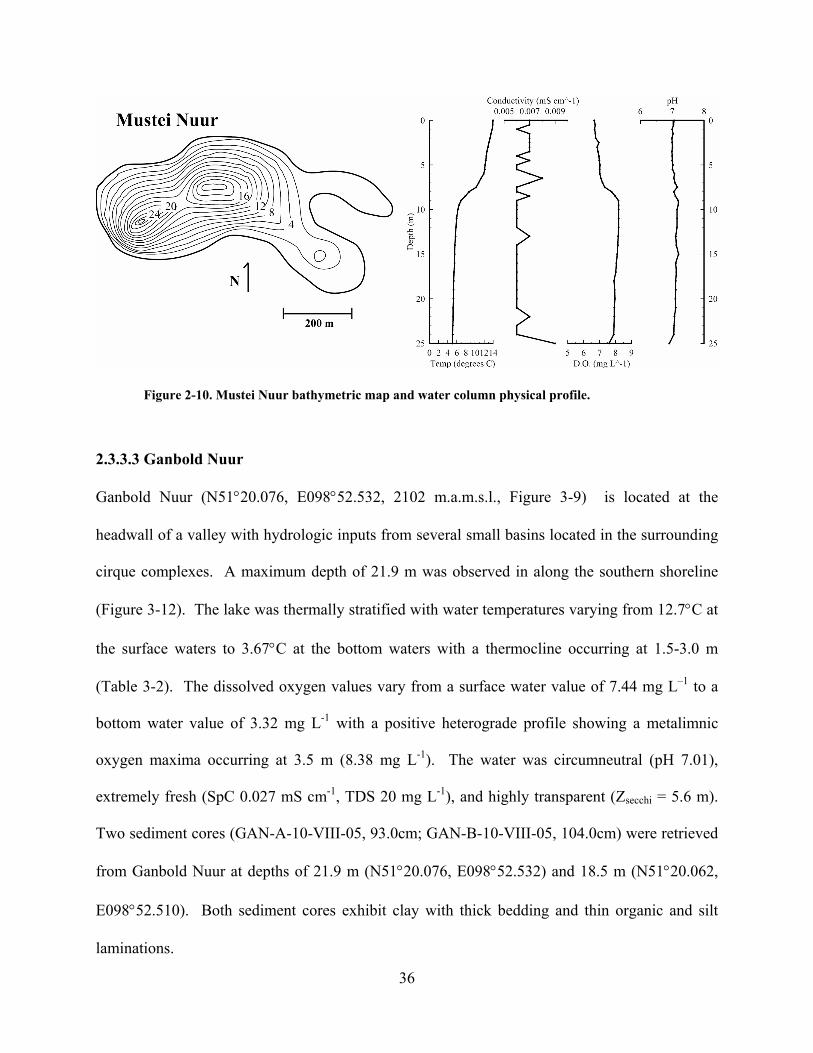
Figure 2-10. Mustei Nuur bathymetric map and water column physical profile.......................... 36

xiii
Figure 2-11. Ganbold Nuur bathymetric map and water column physical profile. ..................... 37
Figure 2-12. Batbold Nuur bathymetric map and water column physical profile. ...................... 38
Figure 2-13. Specific conductivity values (mS cm-1) plotted against (a) elevation (m.a.m.s.l) and
b) surface area (km2) for the six surveyed northern Mongolian lake systems.............................. 41
Figure 2-14. Specific conductivity values (mS cm-1) plotted against (a) elevation (m.a.m.s.l.), (b)
surface area (km2), (c) longitude (°E), and (d) latitude (°N) for all the surveyed central and north-
central Mongolian lake systems. The black rectangle encompasses the lakes designated as
oligosaline and the dotted rectangle encompasses the lakes designated as mesosaline, determined
from TDS concentrations. Specific lakes may be omitted from the graphs dependent upon
availability of data......................................................................................................................... 42
Figure 2-15 Average annual precipitation data from 1997-2005 from central/northern Mongolia
WMO stations plotted against (a) station elevation, (b) station longitude, and (c) station latitude.
....................................................................................................................................................... 43
Figure 2-16 Average water pH verse (a) elevation (m.a.m.s.l), b) surface area (km2), (c)
maximum depth (m), and (d) Secchi dish depth (m) for the six surveyed northern Mongolian lake
systems.......................................................................................................................................... 44
Figure 2-17. pH levels plotted against (a) elevation (m.a.m.s.l.), (b) longitude (°E), and (c)
latitude (°N) for all the surveyed central and north-central Mongolian lake systems. Specific
lakes may be omitted from the graphs dependent upon availability of data................................. 45
Figure 3-1. Structure of chlorophyll adapted from Hendry et al (1987)...................................... 50
Figure 3-2. Chlorophyll a degradation pathways adapted from Hendry et al (1987), R = phytol
chain.............................................................................................................................................. 50
Figure 3-3. Examples of detector offset corrections.................................................................... 63

xiv
Figure 3-4. (a) Absorption patterns for Chl a and Chl b over the 400 – 700 nm range, (b)
absorption patterns for Chl a and Pheophorbide a over the 400 – 700 nm range as modified from
Hendry et al. (1987). ..................................................................................................................... 65
Figure 4-1. Topographical maps of the Baroon Taiga Mountains of northern Mongolia and the
Ganbold Nuur and Sanjin Nuur catchment areas.......................................................................... 72
Figure 4-2. Visible near-infrared reflectance spectra for the sediments from core SAN-A-6-VIII-
05 over the (a) 450-900 nm and (b) 600-750 nm spectral range, and from core GAN-B-10-VIII-
05 over the (c) 450-900 nm and (d) 600-750 nm spectral range. ................................................. 77
Figure 4-3. Linear regression for the spectral index between the reflectance trough area from
650-700nm for SAN-A-6-VIII-05 sediments and (a) Chl a +CDP via HPLC and (b) Chl a +CDP
via spectrophotometry, and between the GAN-B-10-VIII-05 sediments and (c) Chl a +CDP via
HPLC and (d) Chl a +CDP via spectrophotometry ...................................................................... 81
Figure 4-4. Downcore profiles of the reflectance trough area from 650-700nm spectral index and
Chl a +CDP via HPLC and spectrophotometry for (a) SAN-A-6-VIII-05 and (b) GAN-B-10-
VIII-05. ......................................................................................................................................... 83
Figure 4-5. (a) Comparison of the VNIRS-inferred Chl a + CDP profiles with inferred internal...
productivity profiles for cores (a) SN-B-03, (b) SAN-A-6-VIII-05, and (c) GAN-B-10-VIII-05.
84
Figure 5-1. Map of the Baroon Taiga Mountains of northern Mongolia showing the locations
and topographic profiles of the studied lakes, their catchment areas, and the surrounding
ecological transition zones............................................................................................................ 90

xv
Figure 5-2. Bathymetric maps showing location of coring sites for (a) Sanjin Nuur, (b) Mustei
Nuur, (c) Ganbold Nuur, and (d) Batbold Nuur. Bathymetric maps were not produced for the
other studied lakes due to incomplete data sets. ........................................................................... 95
Figure 5-3. Age-depth models for cores (a) GAN-B-10-VIII-05, (b) SAN-A-6-VIII-05, (c) AN-
A-03, (b) BN-A-03, (e) BAT-A-8-VIII-05, (f) TSO-A-9-VIII-05, (g) MUS-A-70VIII-05, and (h)
MAN-A-9-VIII-05. Data points represent dated horizon locations with 2-sigma age error bars.99
Figure 5-4. Simplified sedimentary profiles for cores (a) GAN-B-10-VIII-05, (b) SAN-A-
60VIII-05, (c) AN-A-03, (d) BN-A-03, (e) BAT-A-9-VIII-05, (f) TSO-A-9-VIII-05, and (g)
MUS-A-7-VIII-05. Core sections within the dotted lines represent extruded sediments.......... 100
Figure 5-5. Rtrough and OM profiles plotted against age for cores (a) GAN-B-10-VIII-05, (b)
SAN-A-60VIII-05, (c) AN-A-03, (d) BN-A-03, (e) BAT-A-9-VIII-05, (f) TSO-A-9-VIII-05, and
(g) MUS-A-7-VIII-05. ................................................................................................................ 101
Figure 5-6. OM and Rtrough direct linear regression plots and associated linear equations and
coefficients of determination for cores (a) GAN-B-10-VIII-05, (b) SAN-A-60VIII-05, (c) AN-A-
03, (d) BN-A-03, (e) BAT-A-9-VIII-05, (f) TSO-A-9-VIII-05, and (g) MUS-A-7-VIII-05. .... 102
Figure 5-7. Comparison of Rtrough and OM profiles for core SAN-A-6-VIII-05 with a % BSi
reconstruction from a previously studied Sanjin Nuur sediment core (SN-B-03) (Robinson et al,
accepted). Date points represent location of 14C dated horizons and 2-sigma error ranges for core
SAN-A-6-VIII-05. ...................................................................................................................... 104
Figure 5-8. (a) Adjusted age model for core MUS-A-7-VIII-05 after removal of a slump deposit
located between 92.0-107.0 cm. Dotted line represents the adjusted age model. (b) Rtrough and
OM profiles prior to removal of the slump deposit. Location of the deposit is represented in
grey. (c) Adjustment of Rtrough and OM profiles after removal of the deposit from the record. The

xvi
doted lines exhibit the extension of the early-Holocene data from 10150 – 9400 cal yr B.P. to
10800 – 8500 cal yr B.P.............................................................................................................. 111
Figure 5-9. (a) Rtrough-inferred productivity history for lake Mustei Nuur since 10800 cal yr B.P.
Comparison of (b) a third-order polynomial fit to the Rtrough data for core MUS-A-7-VIII-05 with
(c) July 15th insolation values for N51° (Lasker 1990) and (d) the GISP2 δ18O record (Stuiver et
al. 1995; Stuvier et al. 1997)....................................................................................................... 113
Figure 5-10. Comparison of standardized Rtrough records for cores (a) GAN-B-10-VIII-05, (b)
SAN-A-6-VIII-05, and (c) AN-A-03. Grey bars denote period of below average values......... 115
Figure 5-11. Comparison of (a) the previously resolved lake Sanjin Nuur core SN-B-3
standardized biological silica record (Robinson et al accepted) with (b) the Sol Dav tree-ring
record (Jacoby et al. 1996; D'Arrigo et al. 2001). Comparison of (c) the standardized core Gan-
B-10-VIII-05 Rtrough record with (d) the Khalzan Khamar tree-ring record (D'Arrigo et al. 2000)
and (e) the IntCal04 radiocarbon production record (Reimer et al. 2004) . Grey bars denote
period of below average values................................................................................................... 117

xvii
PREFACE
I would like to thank the U.S. National Fulbright Research Program administered by the Institute
of International Education and the University of Pittsburgh University Honors College for
funding this research project. I would also like to acknowledge the generous assistance and
laboratory work provided by Dr. Joseph Ortiz, Dr. Peter Leavitt, Dr. Melanie Riedinger-
Whitmore, Dr. Mark Abbott, Dr. Soninkhishig Nergui, and Dr. Michael Walther. Additional
thanks to Dr. Michael Rosenmeier for his generous advice and support. Finally, I would like to
acknowledge Sarah Strano, Michael Roberts, Ally Reeves, Otgoobataar Baljinnyam, Enkhoyun,
Enkhbataar Demchig, Gansukh Baatarsuren, Altan-Uya Sonomdorj, M. Ganbold, T.Ganbold,
and A. Ganaa for their invaluable assistance in the field.

1
1.0 INTRODUCTION TO THE INVESTIGATION
Considerable attention has been directed in recent decades toward understanding the timing,
magnitude, and mechanisms of past climatic variations. Because high profile climatic events
such as El Niño have dramatic impacts on agricultural harvests and national economies, and
projected consequences of current global warming trends have dire implication for much of the
developing world, the desire to predict and anticipate the occurrence of climatic aberrations is
great. Reconstructing the history of both global and regional climate helps modern society to
understand the baseline conditions from which to extrapolate future trends. Instrumental records
of climate, however, only span the last two centuries, severely limiting the temporal
understanding of long-term climatic trends. Furthermore, instrumental records are often sparse
or entirely absent from areas under current climatic pressure (i.e. developing nations at sea level
elevation or high-latitudes). Paleoenvironmental methods are thereby required to assess baseline
global and regional climatic conditions in order to evaluate pre-historical climate and
environmental change.
Lake sediment cores are valuable archives of regional climatology and ecology because
they accumulate in an ordered manner, deposit rapidly, and contain physical, chemical, and
biological information about past conditions both within the lakes and their surrounding
watersheds. When accurate ages are assigned to lake sediment sequences using reliable dating
techniques (14C dating, 210Pb dating, varve-chronology), the timing and causation of past changes

2
in the lake’s physical, chemical, and biological structure can be hypothesized. However,
because lakes are subject to a variety of internal and external forcing variables including both
regional and global climate aberrations, human interactions, internal biota dynamics, and
watershed evolution, it is essential that scientists take a holistic approach when attempting to
interpret signals preserved in lake sediment profiles. In other words, a thorough understanding
of the physical and chemical structure of the modern lake’s waters, biological community, and
the forces that regulate such features is essential when accurately determining the causation of
past variations in such variables. Furthermore, lake sediments are comprised of a variety of
components including terrigenous mineral and biological material, autochthonous biological
material, and chemical precipitates, with highly interactive processes determining the relative
abundances of such components. A multi-proxy approach is thereby essential when attempting
to interpret the sedimentary record. For example, a period of increased terrigenous input caused
by enhanced precipitation rates may act to dilute the relative concentration of diatoms deposited
within the sediments, or may act to alter the nutrient dynamics of the lake system effectively
increasing diatom production resulting in an increased abundance of diatom deposition. The
accurate interpretation of the relative diatom abundance signal would require a complimentary
record indicating rates of physical and chemical weathering throughout the period and/or
changes in the nutrient balance (i.e. sediment mineralogy, organic matter sources, diatom
taxonomy).
The focus of the following investigation is a holistic and multi-proxy approach in the
interpretation of sedimentary profiles from a series of alpine lakes located in the Baroon Taiga
Mountains of northern Mongolia throughout the Holocene time period. There are multiple goals
for this broad investigation. The first goal is to provide the reader with an understanding of the

3
significance of paleoclimate research in Mongolia, as well as a thorough review of both the
modern geographic and climatic characteristics of the region and its pre-determined paleoclimate
history based on published studies (chapter 1). The second objective is to provide a
comprehensive database of basic limnological information from twenty-one unstudied lake
systems in northern and central Mongolia (chapter 2). This study is essential to understanding
the spatial distribution of such lakes as well as their modern physical and chemical
characteristics. The third objective is to provide the reader with a thorough review of the
pertinent analytical methods employed in the subsequent chapters (chapter 3). The validation of
one of such analytical method (visible near-infrared diffuse reflectance spectroscopy) in the
qualitative determination of a specific indicator in the sediment profiles of two Baroon Taiga
lake systems will follow (chapter 4). The fifth and final objective is to produce the first full-
Holocene paleoclimate reconstruction for northern Mongolian based upon sediment profiles from
eight Baroon Taiga lake systems (chapter 5). This inclusive study will rely and expand upon the
findings of the prior chapters.
The three main chapters of this investigation are treated as individual studies and are
presented in a format to be submitted for publication in relevant journals. For these reasons,
redundancies will occur throughout this thesis.
1.1 INVESTIGATIVE RELEVANCE
Climatic instability is highly relevant to modern Mongolian society. For example, adverse
climate conditions between 1999 and 2003 (unusually dry summer and cold winter cycles,
known locally as dzuds) resulted in the estimated loss of 25% of the national livestock herd
4
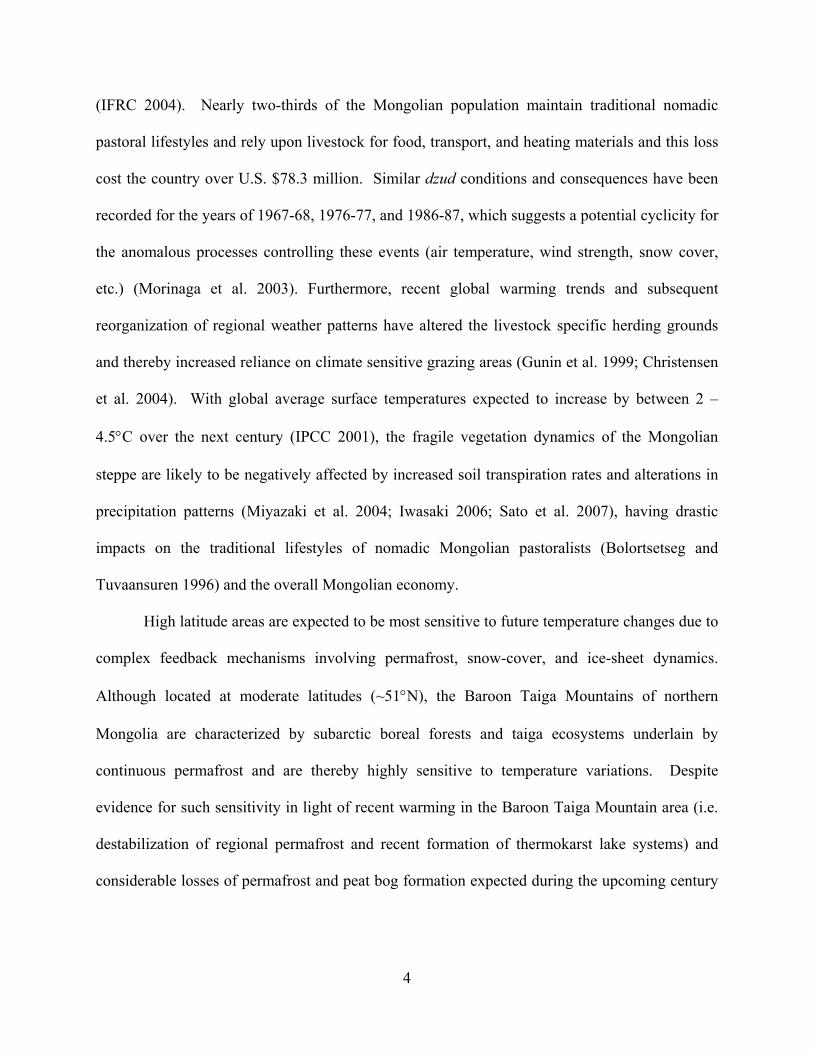
(IFRC 2004). Nearly two-thirds of the Mongolian population maintain traditional nomadic
pastoral lifestyles and rely upon livestock for food, transport, and heating materials and this loss
cost the country over U.S. $78.3 million. Similar dzud conditions and consequences have been
recorded for the years of 1967-68, 1976-77, and 1986-87, which suggests a potential cyclicity for
the anomalous processes controlling these events (air temperature, wind strength, snow cover,
etc.) (Morinaga et al. 2003). Furthermore, recent global warming trends and subsequent
reorganization of regional weather patterns have altered the livestock specific herding grounds
and thereby increased reliance on climate sensitive grazing areas (Gunin et al. 1999; Christensen
et al. 2004). With global average surface temperatures expected to increase by between 2 –
4.5°C over the next century (IPCC 2001), the fragile vegetation dynamics of the Mongolian
steppe are likely to be negatively affected by increased soil transpiration rates and alterations in
precipitation patterns (Miyazaki et al. 2004; Iwasaki 2006; Sato et al. 2007), having drastic
impacts on the traditional lifestyles of nomadic Mongolian pastoralists (Bolortsetseg and
Tuvaansuren 1996) and the overall Mongolian economy.
High latitude areas are expected to be most sensitive to future temperature changes due to
complex feedback mechanisms involving permafrost, snow-cover, and ice-sheet dynamics.
Although located at moderate latitudes (~51°N), the Baroon Taiga Mountains of northern
Mongolia are characterized by subarctic boreal forests and taiga ecosystems underlain by
continuous permafrost and are thereby highly sensitive to temperature variations. Despite
evidence for such sensitivity in light of recent warming in the Baroon Taiga Mountain area (i.e.
destabilization of regional permafrost and recent formation of thermokarst lake systems) and
considerable losses of permafrost and peat bog formation expected during the upcoming century
5
(Bohner and Lehmkuhl 2005), no paleoclimatic studies have been reported for the immediate
region.
1.2 MODERN GEOGRAPHY, ECOLOGY, AND CLIMATE OF MONGOLIA
Mongolia is a vast (1,564,000 km2) central Asian country with high and rugged topography
averaging ~1400 meters above mean seal level (m.a.m.s.l.) (Figure 2-1a). Prominent natural
features include mountain ranges in the northern, western, and central regions with peaks
exceeding 4000 m in height, the Gobi Desert that straddles the southern border with China, and
one of the world’s largest continuous grassland steppe systems located throughout the eastern
region. The transitions between such natural features are often sharp with sand dune fields
located adjacent to grassland steppe within intermontane valleys. Mongolia’s numerous rivers
are concentrated in the northern half of the country, the most notable of which is the Selenga
River, draining one third of the country to the northern Lake Baikal. Numerous varieties of lakes
are present throughout Mongolia including perennial saline lakes in the Gobi regions, large
depression lakes, glacial lakes in the high mountains of the northern, central, and western
regions, and tectonic lakes located in the Baikal Rift Zone of the northern Khovsgul province.
The northern central regions are underlain by discontinuous and continuous permafrost and have
related thermokarst, frost-wedges, and pingo structures.
6
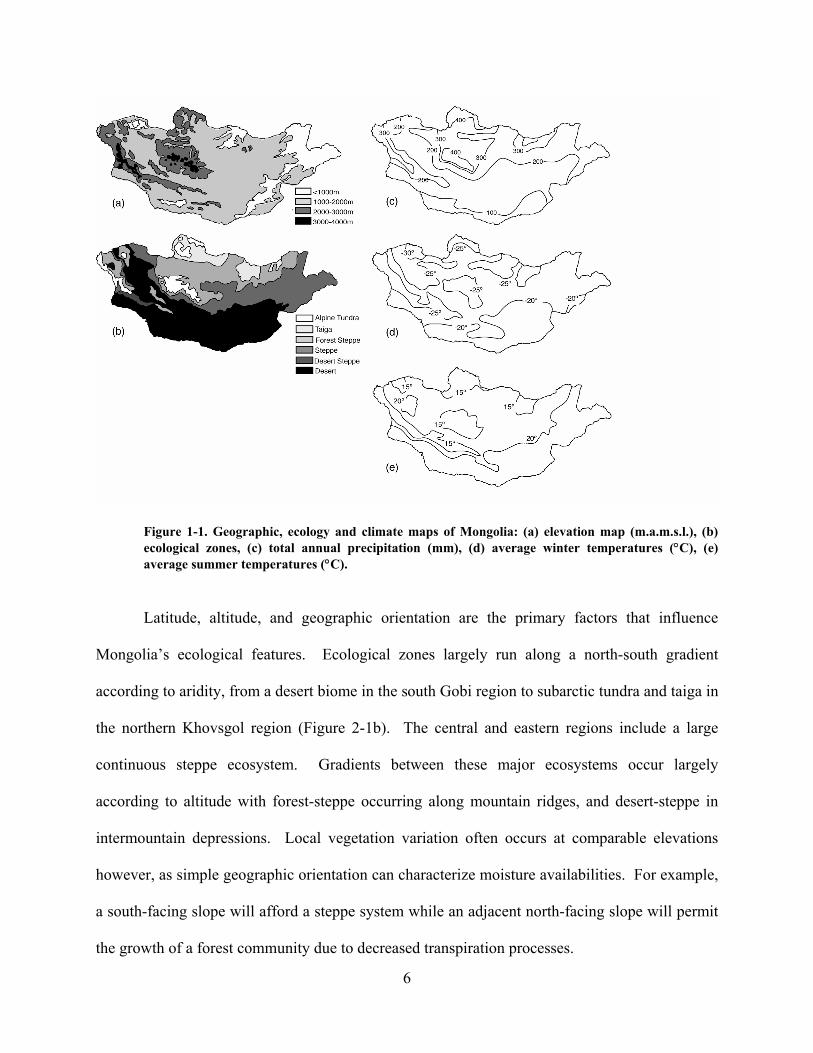
Figure 1-1. Geographic, ecology and climate maps of Mongolia: (a) elevation map (m.a.m.s.l.), (b) ecological zones, (c) total annual precipitation (mm), (d) average winter temperatures (°C), (e) average summer temperatures (°C).
Latitude, altitude, and geographic orientation are the primary factors that influence
Mongolia’s ecological features. Ecological zones largely run along a north-south gradient
according to aridity, from a desert biome in the south Gobi region to subarctic tundra and taiga in
the northern Khovsgol region (Figure 2-1b). The central and eastern regions include a large
continuous steppe ecosystem. Gradients between these major ecosystems occur largely
according to altitude with forest-steppe occurring along mountain ridges, and desert-steppe in
intermountain depressions. Local vegetation variation often occurs at comparable elevations
however, as simple geographic orientation can characterize moisture availabilities. For example,
a south-facing slope will afford a steppe system while an adjacent north-facing slope will permit
the growth of a forest community due to decreased transpiration processes.
7
The modern climate of Mongolia is largely dictated by the position and strength of the
Siberian or Asiatic high, a large high-pressure anticyclone centered at approximately 100°E,
50°N, during the extensive boreal winter months (Lydolph 1977; Ding et al. 1995). An extended
period of low temperatures associated with decreased insolation rates during such months leads
to the formation of this high-pressured system. Corresponding low pressure systems over the
surrounding oceans (Icelandic Low, Aleutian Low) create an anti-cyclone affect (Harrison et al.
1996). The Siberian high often extends as far west as 30°E, prohibiting the movement of moist
airflow from the Icelandic Low into Eurasia, leaving the Mongolian plateau region exceptionally
arid (Wallen 1970). The eastern boundary of the Asiatic high extends to the Pacific Ocean and
dominates the winter wind patterns for Eastern China and Siberia.
During the summer months high insolation rates lead to heating of the Mongolian region,
resulting in the formation of a low-pressure cell over Siberia. The Icelandic Low is forced
northward and weakened by strengthened westerly winds (Martyn 1992). Because northern Asia
is an area of generally low-lying plains with a gentle increasing slope eastward, these westerlies
can penetrate far within the Asian continent and constitute the dominant summer wind patterns
over the Mongolian Plateau.
Convection cells as a result of high insolation rates and related surface heating provide
the majority of the precipitation to Mongolia, with the highest rates occurring in June, July and
August. Precipitation during the winter months generally constitutes 10-40% of the annual total
precipitation with a maximum occurring during January (Morinaga et al. 2003; Sato et al. 2007).
Total annual precipitation varies with latitude from 600 mm yr-1 in the north to less than 100 mm
yr-1 in the south (Figure 2-1c). Mongolia remains largely unaffected by the East Asian and
Indian Monsoonal air masses due to its continental positioning and the buffering abilities of the

8
Tibetan Plateau and the Gobi Desert. However, recent studies have demonstrated an indirect
relationship between northern Mongolian snow depth and Indian Monsoonal intensity (Kripalani
and Kulkarni 1999).
The sharp contrast in seasonal climatic influences and the lack of an oceanic influence
results in a dramatic annual temperature gradient for Mongolia. Winter temperatures often fall
below -40°C and summer temperature rise above 35°C (Figure 1-1d,e). Average annual
temperatures vary dependent upon region, but are consistently near or below freezing point.
Recent instrumental climate data shows an increase in average annual temperatures of as much
as 2°C throughout Mongolia over the past several decades (Figure 1-2). Such trends are in
agreement with global average temperature trends (IPCC 2001). Precipitation data do not show
any definable trend over the measured period, yet with increased annual temperatures in the
oncoming decades a decrease of precipitation over northern Mongolia and an increase over
southern Mongolia is expected (Sato et al. 2007).
9
Figure 1-2. Average annual instrumental temperature and precipiation data from six localites throughout Mongolia. Olgi (1) present the most western extended instrumental record Altai (2) presents the instrumental record from the highest elevation in Mongolia. Muren (3) is the most northern site for an extended and continuous record. Tsetserleg (4) represents the central regions of Mongolia. Dalanzagad (5) is the most southernly extended record and is present in the Gobi Desert. Choibalsan (6) presents the most eastern and lowest elevation record.

10
1.3 PALEOCLIMATIC HISTORY OF MONGOLIA
A sparse paleoenvironmental history of Mongolia has been compiled through multiple studies of
lake deposits (Tarasov et al. 1998; Tarasov et al. 1999; Tarasov et al. 2000; Grunert et al. 2000;
Peck et al. 2002; Walther 2002; Fowell et al. 2003; Soninkhishig et al. 2003; Fedotov et al. 2004;
Fedotov et al. 2004; Poberezhnaya et al. 2006), tree-rings (Jacoby et al. 1996; Jacoby et al. 1999;
D'Arrigo et al. 2000; D'Arrigo et al. 2001; Pederson et al. 2001; Jacoby et al. 2003; Davi et al.
2006), geomorophological features (Owen et al. 1997; Owen et al. 1998; Lehmkuhl and Lang
2001; Komatsu et al. 2001; Feng 2001), and ice-deposits (Schotterer et al. 1997) (Figure 1-3).
Late Pleistocene records from Lake Khovsgol provide evidence for lake-level
fluctuations since 230,000 yr B.P. with periodicities at 17, 24, and 47 ka year that have been
attributed to orbital cycles (Poberezhnaya et al. 2006). Paleoshoreline studies from south-central
Mongolia provide evidence for dramatically increased lake-levels between 70,000 and 30,000 yr
B.P. (Lehmkuhl and Lang 2001; Komatsu et al. 2001), coincident with the interstadial period
Oxygen Isotope Stage 3 (OIS 3). Lake-level high stands are hypothesized to have occurred
during OIS 3 as a result from the suppression of evaporation rates due to lower global
temperatures coupled with an increase in meltwater sources from local Altai and Khangai
Mountain glaciers. The general timing of such lake-level high stands is coincident with the
hypothesized formation of alluvial fans indicating a wet period in the southern Gobi of Mongolia
(Owen et al. 1997), formation of paleosols indicative of moist conditions in northern Mongolia
(Feng 2001), and is in accordance with increased lake levels in northern China (Pachur et al.
1995; Rhodes et al. 1996).

11
Figure 1-3. Previous Mongolian paleoenvironmental studies site map. T = tree-ring study, L = lake deposit study, G = geomorphological study, I = ice deposit study.
Geomorphological evidence for the last glacial advance has been reported down to 2200
m.a.m.s.l. in the western and central mountains of Mongolia with an age of 21,000 yr B.P.
designated for the timing of this last maximum advance (Figure 1-4) (Lehmkuhl and Lang 2001).
In the Gobi region, evidence of permafrost located as low as 1400 m.a.m.s.l. has been reported
between 22,000 and 15,000 yr B.P. (Owen et al. 1998), marking the most southern advance of
northern Asian permafrost during the last glaciation. Increased aridity occurred during the LGM
period (23,000 – 13,000 yr B.P.) is evident from alluvium deposits in the Gobi (Owen et al.
1997) and paleosol deposits in northern Mongolia (Feng 2001). Evidence for low lake levels
between 24,000 – 15,000 yr B.P. similarly exist for northwestern Mongolia (Grunert et al. 2000).
The onset of deglaciation in the mountains of the northern Baikal region occurred
between 18,000 – 15,000 yr B.P. (Horiuchi et al. 2000). Meltwater and sediment loading

12
impacted the lithology of Lake Khovsgol sediments during this time period and potentially
increased lake levels by as much as 20 m (Fedotov et al. 2004). Degradation and disappearance
of permafrost structures (ice-wedges) from the Gobi occurred from 13,000 – 10,000 yr B.P.,
marking the end of the glacial period in the region. Increased moisture availability during the
terminal stages of the LGM is evident by increased lake levels in western and northwestern
Mongolia by 12,000 yr B.P., likely as a result of increased meltwater from surrounding mountain
glaciers (Harrison et al. 1996; Grunert et al. 2000). Evidence for increased precipitation in
northern Mongolia during this period is reported in the sediments of Lake Khovsgol (Fedotov et
al. 2004) and paleosol formation (Feng 2001). Fedotov et al (2004) hypothesize this increase in
moisture availability as representing evidence for the Bolling-Allerod event, during which
increased precipitation is seen in tropical regions (Severinghaus and Brook 1999), as well as
local regions (Chebykin et al. 2002).
The Early Holocene in western Mongolia was marked by arid conditions between 10,000
– 9,000 yr B.P., as evident from pollen records from the Hoton-Nuur basin (Tarasov et al. 2000).
Similar dry conditions are reported for central Mongolia during this time period (Harrison et al.
1996). Moisture availability over Mongolia increased following 9000 yr B.P. (Komatsu et al.
2001) and western Mongolian lake-levels remain high until 4000 yr B.P., where after lake levels
regressed in response to increased aridity (Tarasov et al. 2000; Komatsu et al. 2001). Similarly,
lake Adagin Tsagaan Nuur in central Mongolia is hypothesized to have had an increase in lake
levels to 15–20 m higher than present level at 8500 yr B.P. (Lehmkuhl and Lang 2001).
However, water levels at Lake Telmen, central Mongolia, were at least 14 m shallower than
present from 7110 – 4500 yr B.P. (Peck et al. 2002; Fowell et al. 2003). Evidence for aridity
during this time period is also found in soil/loess sequence data from northern Mongolia (Feng
13
2001). A reconstruction of temperatures inferred from pollen data show an increase in summer
temperatures throughout Mongolia at 6000 yr B.P. (Tarasov et al. 1999). These higher
temperatures do not necessarily coincide with an overall increase in regional moisture
availability however, as lake level reconstructions during this time period show large regional
effects (Tarasov et al. 2000; Peck et al. 2002).
Grunert et al (2000) demonstrates lake level regression following 5000 yr B.P. and
describes this time period to be an arid phase for northwestern Mongolia. These findings are in
agreement with pollen data demonstrating a transition from a forest-steppe to steppe ecosystem
in western Mongolia following 4000 yr B.P. (Tarasov et al. 2000). Furthermore, Fedotov et al
(2004) reports evidence for lake level regression in Lake Khovsgol at 5,500 yr B.P. Lake levels
at Lake Telmen in central Mongolia however, are believed to have increased beyond the prior
lowstand beginning at 4390 cal yr B.P., as evident from the deposition of deep water sediments,
as well as pollen and diatom records (Peck et al. 2002; Fowell et al. 2003; Soninkhishig et al.
2003). This time period is believed to be a period of “maximum humidity” for the central
Mongolian region (Fowell et al. 2003), with the highest inferred lake levels throughout the
Holocene. Paleosol data from northern Mongolia similarly show an increase in moisture
availability after 4070 yr B.P.(Feng 2001). High lake levels and inferred positive moisture
balance continued in the Lake Telmen region through 1600 yr B.P., followed by a brief arid
period from 1600-1200 yr B.P. (Peck et al. 2002; Fowell et al. 2003; Soninkhishig et al. 2003).
14
Figure 1-4. Simplified history of Mongolian moisture availability for the late Pleistocene and Holocene time periods. Periods of positive (+) and negative (-) moisture availability for western, central, northern, and southern Mongolia are based on the findings of the numerous studies cited in the text.

15
Late Holocene temperatures for central and western Mongolia are well constrained as
tree-ring records provide high-resolution temperature reconstructions since 282 yr A.D. (Figure
2-5). Periods of low temperature conditions occurred at ~540, 920, and 1850 yr A.D. (Jacoby et
al. 1996; D'Arrigo et al. 2000; D'Arrigo et al. 2001). The oldest cold period coincides with
historical records of Chinese famine and summer frosts (Baillie 1999). The youngest cold period
is roughly coincident with the timing of the Little Ice Age (LIA), a historical period of
diminished temperatures throughout much of the Northern Hemisphere between 1600 and 1900
yr A.D. (Lamb 1965). Periods of inferred warmth occurred at ~800, 1400, and from 1900 yr
A.D. to present (Jacoby et al. 1996; D'Arrigo et al. 2000; D'Arrigo et al. 2001). The two older
periods correlate to the “Medieval Warm Epoch”(Lamb 1965), while the latter is in high
agreement with northern hemisphere temperature reconstructions (Overpeck et al. 1997; Mann et
al. 1999) and is likely a result of anthropogenic influences (Jacoby et al. 1996).
Figure 1-5. Temperature-inferred tree ring chronologies for northern and central Mongolia (Jacoby et al. 1996; D'Arrigo et al. 2000; D'Arrigo et al. 2001). All tree ring widths are standardized to their mean with the exception of the Sol Dav record (presented as published). LIA = Little Ice Age, MWP = Medieval Warm Period as presented by the studies.

16
Figure 1-6. Precipitation-inferred tree ring chronologies for northern and central Mongolia (Pederson et al. 2001; Davi et al. 2006). All tree ring widths are standardized to their mean.
Tree-ring chronologies have been similarly employed to reconstruct precipitation and
stream flow histories for central Mongolia since 1560 A.D. (Pederson et al. 2001; Davi et al.
2006). Precipitation variations occurred at ~11-13 year periodicities and stream flow variation
occurred at ~13 and ~22 year periodicities throughout the records. Pronounced arid periods in
central eastern Mongolia occurred between 1692-1700, 1723-1735, 1771-1775, 1791-1795,
1801-1805, 1841-1845, 1903-1907, 1925-1932, 1943-1947, and 1978-1982 A.D.. Pronounced
wet periods in central eastern Mongolia occurred between 1652-1656, 1687-1691, 1702-1706,
1717-1721, 1740-1744, 1752-1756, 1761-1765, 1803-1807, 1810-1814, 1826-1830, 1908-1912,
1917-1921, 1934-1938, 1956-1960, and 1991-1995 A.D. (Pederson et al. 2001). Pronounced
arid periods in western central Mongolia occurred between 1641-1645, 1696-1700, 1736-1741,
1778-1783, 1854-1859, 1863-1867, and 1901-1905 A.D. Periods of wet conditions in western
central Mongolia occurred between 1763-1769, 1794-1802, 1917-1921, and 1990-1994 A.D.
(Davi et al. 2006). Differences between the timings of such events from eastern central and

17
western central are likely due to circulation variations due to the mountainous topography
separating the study sites.

18
2.0 BASIC LIMNOLOGICAL SURVEY OF TWENTY-ONE NORTH/CENTRAL
MONGOLIAN LAKES
2.1 INTRODUCTION
The diverse ecology/geology of Mongolian lakes has long been recognized (Berkey and Morris
1927) and a history of limnological monitoring within Mongolia exists (Kondratiev 1929;
Tsegmid 1955; Dulmaa 1964; Kozhov 1965; Kuznetsov 1968; Tserensodnom 1971), yet a great
majority of Mongolian lakes remain unstudied. With over 3500 lakes distributed throughout
Mongolia’s rugged and sparsely populated landscape, most lakes have been completely isolated
from human activities. Such isolation has preserved a great number of natural, undisturbed lake
systems, offering biologists and geologists the unique opportunity to study such systems in their
pristine state.
Here, we report observations on the physical and chemical properties of twenty-one
north/central Mongolian lake systems, the majority of which were previously unstudied. The
simple objective of this study is to provide a basic understanding of the nature of each lake
system. Furthermore, this paper aims to document the baseline conditions of each ecosystems in
order to better assess any future alterations.
19
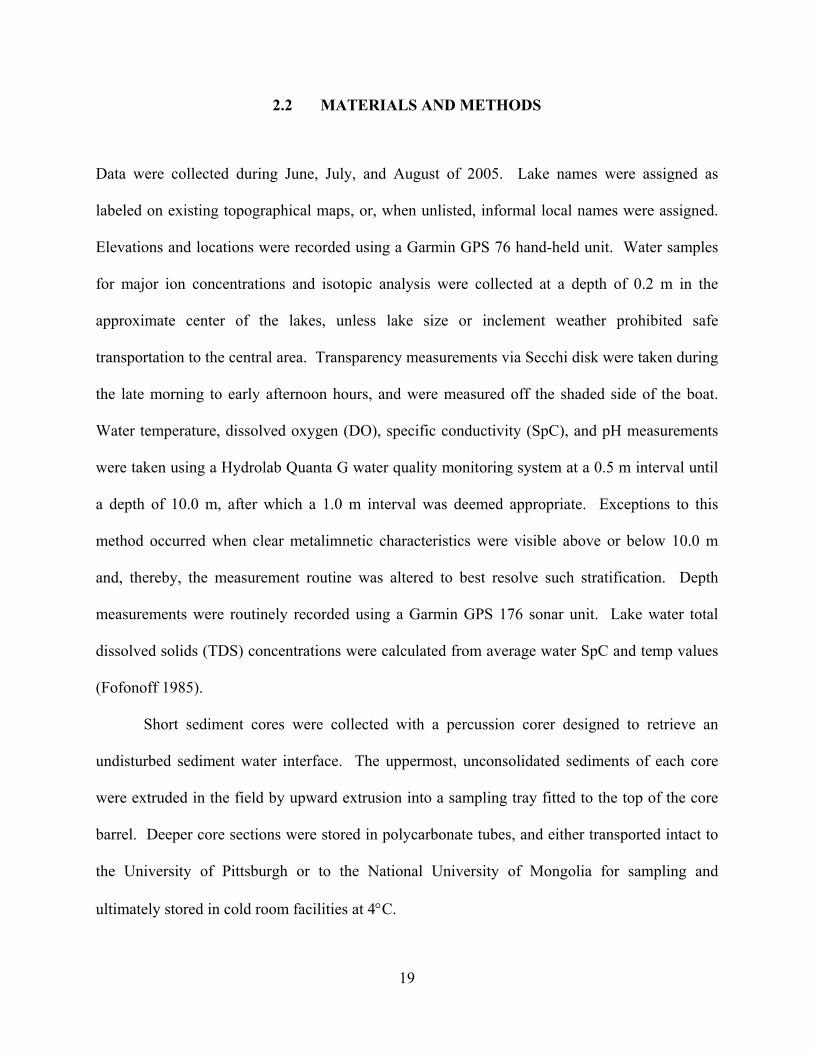
2.2 MATERIALS AND METHODS
Data were collected during June, July, and August of 2005. Lake names were assigned as
labeled on existing topographical maps, or, when unlisted, informal local names were assigned.
Elevations and locations were recorded using a Garmin GPS 76 hand-held unit. Water samples
for major ion concentrations and isotopic analysis were collected at a depth of 0.2 m in the
approximate center of the lakes, unless lake size or inclement weather prohibited safe
transportation to the central area. Transparency measurements via Secchi disk were taken during
the late morning to early afternoon hours, and were measured off the shaded side of the boat.
Water temperature, dissolved oxygen (DO), specific conductivity (SpC), and pH measurements
were taken using a Hydrolab Quanta G water quality monitoring system at a 0.5 m interval until
a depth of 10.0 m, after which a 1.0 m interval was deemed appropriate. Exceptions to this
method occurred when clear metalimnetic characteristics were visible above or below 10.0 m
and, thereby, the measurement routine was altered to best resolve such stratification. Depth
measurements were routinely recorded using a Garmin GPS 176 sonar unit. Lake water total
dissolved solids (TDS) concentrations were calculated from average water SpC and temp values
(Fofonoff 1985).
Short sediment cores were collected with a percussion corer designed to retrieve an
undisturbed sediment water interface. The uppermost, unconsolidated sediments of each core
were extruded in the field by upward extrusion into a sampling tray fitted to the top of the core
barrel. Deeper core sections were stored in polycarbonate tubes, and either transported intact to
the University of Pittsburgh or to the National University of Mongolia for sampling and
ultimately stored in cold room facilities at 4°C.

20
Figure 2-1. Mongolian Lake Survey Site Map. 1 = Shireet Nuur, 2= Hoh Nuur, 3= Tsagaan Nuur, 4 = Terhin Tsagaan Nuur, 5 = Har Nuur, 6= Baga Nuur, 7 = Tsegan Nuur, 8 = Holvoo Nuur, 9 = Oigon Nuur, 10 = Buust Nuur, 11 = Zuun Nuur, 12 = Gandan Nuur, 13 = Sangeen Dalai Nuur, 14 = Tunamal Nuur, 15 = Tevdan Nuur, 16-21 = Sanjin Nuur, Mustei Nuur, Ganbold Nuur, Batbold Nuur, Tsogtoo Nuur, Mandax Nuur.
2.3 RESULTS
All surveyed lakes were located between 46-52°N and 95-102°E (Figure 2-1). For ease of
discussion we group lakes by latitudinal location. Central Mongolian lakes are considered those
between N 46° 00’ and N 48° 00’ (n = 3). North-central Mongolian lakes are those between N
48° 00’ and N 50° 00’ (n = 12). Northern Mongolian lakes are those at latitudes higher than N
50° 00’ (n = 6).

21
Table 2-1. General surveyed lake data.
Lake Name Location N Location E Elevation
(m.a.m.s.l.) Surface area
(km2)
Maximum observed depth
(m) Central Mongolia 1. Shireet Nuur 46° 31.490 101° 50.051 2429 -- 6 2. Hoh Nuur 47° 29.069 098° 33.473 2300 12.97 17.3 3. Tsagaan Nuur 47° 38.961 097° 15.623 2257 3.55 28.5 North-central
Mongolia 4. Terhin Tsagaan
Nuur 48° 08.529 099° 39.646 2158 59.99 14 5. Har Nuur 48° 20.541 099° 11.903 1978 90.86 12.5 6. Baga Nuur 48° 24.972 095° 57.350 1982 7.98 15 7. Tsegan Nuur 48° 43.712 095° 51.750 1877 1.45 8.5 8. Holvoo Nuur 49° 02.659 097° 09.615 1952 25.2 7.5 9. Zuun Nuur 49° 03.858 099° 27.999 2012 18.65 12 10. Buust Nuur 49° 07.829 097° 26.499 1983 -- 12.1 11. Oigon Nuur 49° 09.184 096° 38.024 1667 73.46 3.5 12. Sangeen Dalai
Nuur 49° 11.034 099° 01.990 1705 181.9 -- 13. Gandan Nuur 49° 11.933 098° 46.013 1897 23 5.2 14. Tevdan Nuur 49° 14.553 095° 39.201 1705 12.17 0.5 16. Tunamal Nuur 49° 25.130 098° 31.848 1885 9.78 10 Northern Mongolia 16. Sanjin Nuur 51° 13.910 099° 01.397 2090 0.08 17.4 17. Mustei Nuur 51° 14.354 099° 00.354 2353 0.34 28 18. Ganbold Nuur 51° 20.076 098° 52.532 2102 0.12 22 19. Tsogtoo Nuur 51° 20.738 098° 53.842 2063 0.38 4 20. Batbold Nuur 51° 20.856 098° 52.496 2150 0.14 15.5 21. Mandax Nuur 51° 22.323 098° 57.494 1978 1.35 6
2.3.1 Central Mongolian lakes
All central and north-central Mongolian lakes are of deflation basin origins. They primarily
reside in granodiorite bedrock and have large surface area:depth ratios. They are all located in
steppe, forest steppe, or dessert-steppe ecosystems. When visible inputs or outputs were seen
the lakes were given an open basin status, although the large surface area of some lakes

22
prohibited even a basic investigation of basin hydrology. Therefore, the assignment of an open
basin status to the central and north-central lakes is largely arbitrary and the assumption that
lakes are not open systems should be taken with caution.
2.3.1.1 Shireet Nuur
Shireet Nuur (N 46°31.490, E101°50.051, 2429 m.a.m.s.l.) is a lake located within the Naiman
Nuur protected area. The northeastern basin was explored for this study and yielded a maximum
depth measurement of 6.0 m. The water temperature profile spanned 14.0°C at the surface water
interface to bottom water values of 9.07°C and lacked a clear thermocline (Table 2-2).
Dissolved oxygen values spanned 9.84 – 8.83 mg L-1 and similarly exhibit a generally
homogeneous profile. Water conditions were basic (8.32-9.65 pH), fresh (SpC 0.068 mS cm-1,
TDS 44.1 mg L-1), and moderately clear (Zsecchi= 3.5 m). A 0.88 m sediment core (SHR-A-25-
VI-05) retrieved from a depth of 6.0 m (N46°31.490, E101°50.051) yielded homogenous clay
with no visible stratigraphic horizons.
2.3.1.2 Hoh Nuur
Hoh Nuur (N 47° 29.069, E098°33.473, 2625 m.a.m.s.l.) is an open lake system consisting of a
western and southern basin, of which only the southern basin was explored due to extremely
inclement weather. The southern basin is entirely surrounded by raised grasslands, while the
western basin is surrounded by steep sided hills. The lake has a surface area of 13.0 km2.
Depths of up to 12.0 m were observed but local residents claim the western basin is deeper with
submerged trees present. Local residents also claim shell material is often found along the
shoreline, although none was observed during the time of sampling. The temperature profile
23
exhibited an isothermal profile with values ranging from 10.2 – 9.38°C (Table 2-2). Dissolved
oxygen had its highest concentration (9.84 mg L-1) at the air-water interface. Water conditions
were slightly basic (8.14 - 8.9 pH), fresh (SpC 0.059 mS cm-1, TDS 37.7 mg L-1) and extremely
clear (Zsecchi= 8.0 m). A 0.71 m sediment core (HOH-A-27-VI-05) retrieved from a depth of 8.0
m (N47°29.069, E098°33.473) yielded dark brown homogenous clay with no visible
stratigraphic horizons
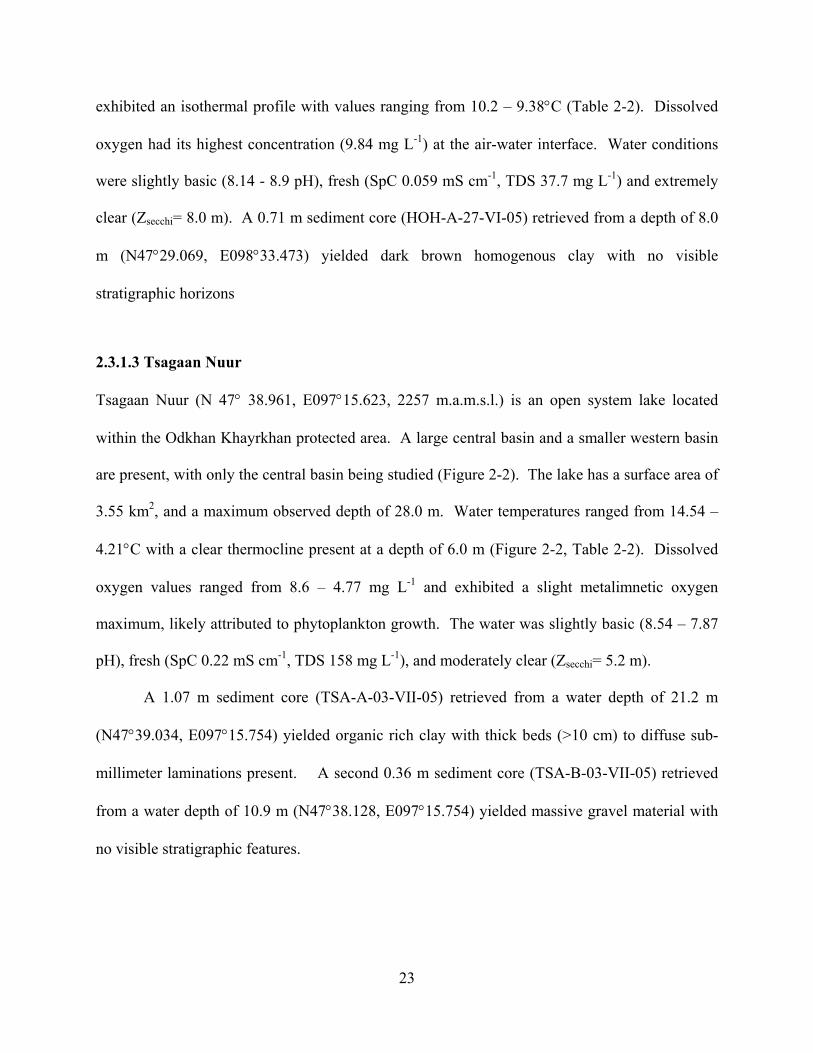
2.3.1.3 Tsagaan Nuur
Tsagaan Nuur (N 47° 38.961, E097°15.623, 2257 m.a.m.s.l.) is an open system lake located
within the Odkhan Khayrkhan protected area. A large central basin and a smaller western basin
are present, with only the central basin being studied (Figure 2-2). The lake has a surface area of
3.55 km2, and a maximum observed depth of 28.0 m. Water temperatures ranged from 14.54 –
4.21°C with a clear thermocline present at a depth of 6.0 m (Figure 2-2, Table 2-2). Dissolved
oxygen values ranged from 8.6 – 4.77 mg L-1 and exhibited a slight metalimnetic oxygen
maximum, likely attributed to phytoplankton growth. The water was slightly basic (8.54 – 7.87
pH), fresh (SpC 0.22 mS cm-1, TDS 158 mg L-1), and moderately clear (Zsecchi= 5.2 m).
A 1.07 m sediment core (TSA-A-03-VII-05) retrieved from a water depth of 21.2 m
(N47°39.034, E097°15.754) yielded organic rich clay with thick beds (>10 cm) to diffuse sub-
millimeter laminations present. A second 0.36 m sediment core (TSA-B-03-VII-05) retrieved
from a water depth of 10.9 m (N47°38.128, E097°15.754) yielded massive gravel material with
no visible stratigraphic features.
24
Figure 2-2. Tsagaan Nuur bathymetric map and water column physical profile.
2.3.2 North-Central Mongolia
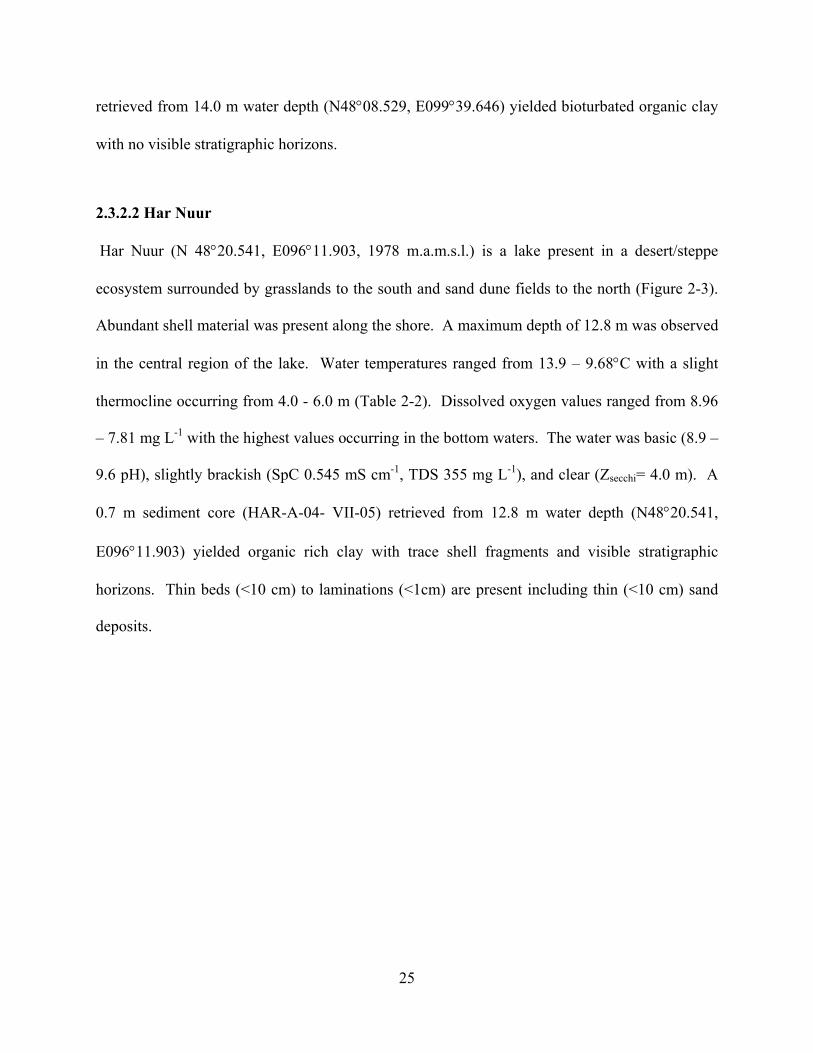
2.3.2.1 Terhin Tsagaan Nuur
Terhin Tsagaan Nuur (N 48°08.529, E099°39.646, 2158 m.a.m.s.l.) is a relatively large open
system lake (surface area = 60.0 km2) with two east-west basins. A maximum depth of 14.0 m
was found in the central area of the western basin. Water temperatures ranged from 13.6 –
9.56°C with a thermocline present from 7.0 – 9.0 m (Table 2-2). Dissolved oxygen values
ranged from 8.46 – 5.77 mg L-1 and exhibited a clinograde profile similar to that of the
temperature profile. The water was basic (8.33 – 8.01 pH), fresh (SpC 0.0149 mS cm-1, TDS 96
mg L-1), and relatively clear (Zsecchi= 2.4 m). A 0.88 m sediment core (TTN-A-29-VI-05)
25
retrieved from 14.0 m water depth (N48°08.529, E099°39.646) yielded bioturbated organic clay
with no visible stratigraphic horizons.
2.3.2.2 Har Nuur
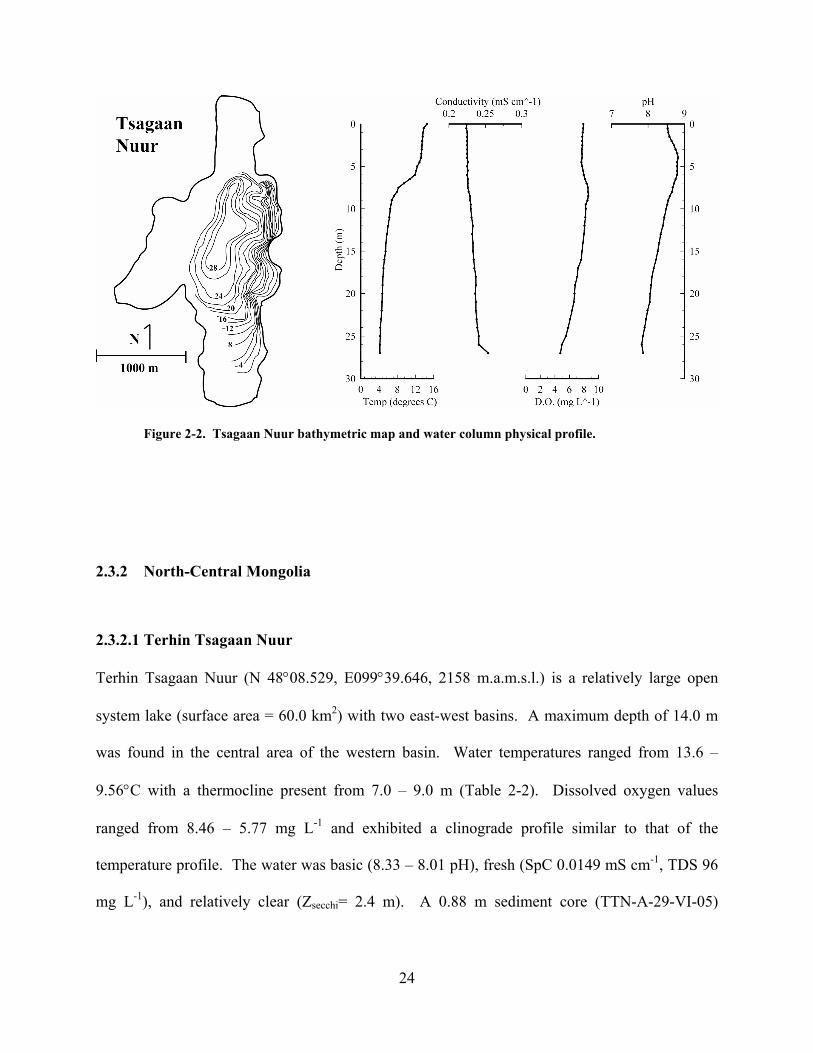
Har Nuur (N 48°20.541, E096°11.903, 1978 m.a.m.s.l.) is a lake present in a desert/steppe
ecosystem surrounded by grasslands to the south and sand dune fields to the north (Figure 2-3).
Abundant shell material was present along the shore. A maximum depth of 12.8 m was observed
in the central region of the lake. Water temperatures ranged from 13.9 – 9.68°C with a slight
thermocline occurring from 4.0 - 6.0 m (Table 2-2). Dissolved oxygen values ranged from 8.96
– 7.81 mg L-1 with the highest values occurring in the bottom waters. The water was basic (8.9 –
9.6 pH), slightly brackish (SpC 0.545 mS cm-1, TDS 355 mg L-1), and clear (Zsecchi= 4.0 m). A
0.7 m sediment core (HAR-A-04- VII-05) retrieved from 12.8 m water depth (N48°20.541,
E096°11.903) yielded organic rich clay with trace shell fragments and visible stratigraphic
horizons. Thin beds (<10 cm) to laminations (<1cm) are present including thin (<10 cm) sand
deposits.
26
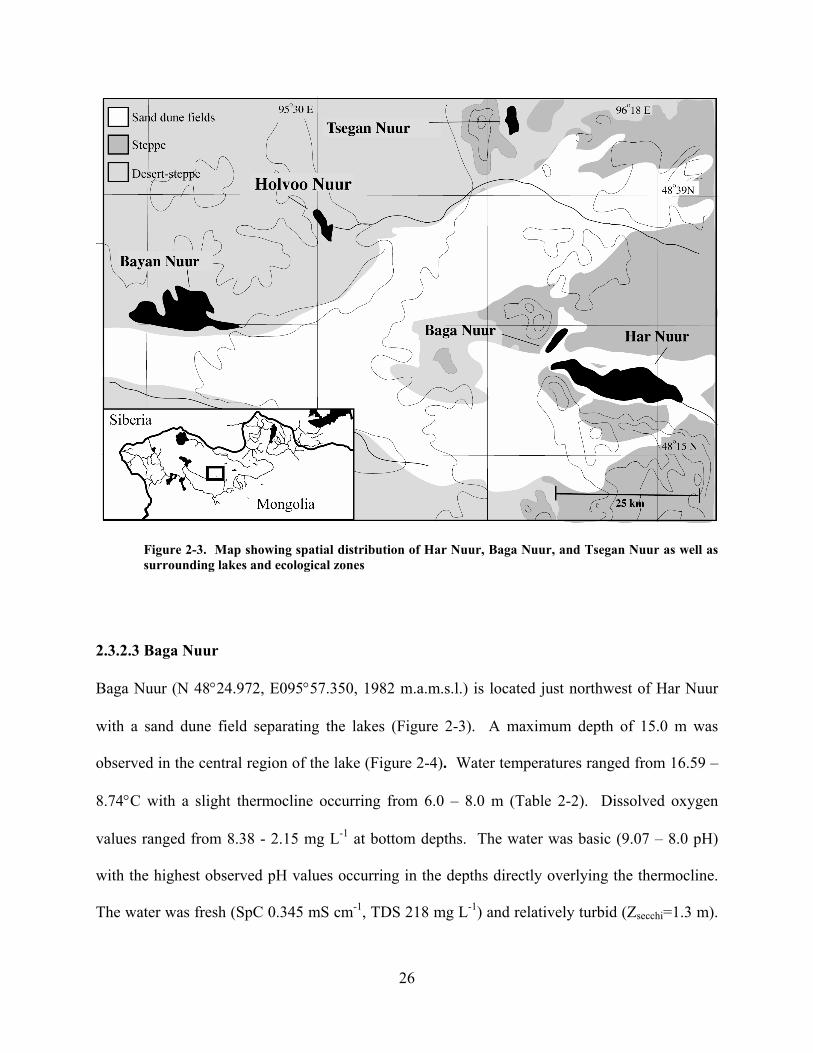
Figure 2-3. Map showing spatial distribution of Har Nuur, Baga Nuur, and Tsegan Nuur as well as surrounding lakes and ecological zones
2.3.2.3 Baga Nuur
Baga Nuur (N 48°24.972, E095°57.350, 1982 m.a.m.s.l.) is located just northwest of Har Nuur
with a sand dune field separating the lakes (Figure 2-3). A maximum depth of 15.0 m was
observed in the central region of the lake (Figure 2-4). Water temperatures ranged from 16.59 –
8.74°C with a slight thermocline occurring from 6.0 – 8.0 m (Table 2-2). Dissolved oxygen
values ranged from 8.38 - 2.15 mg L-1 at bottom depths. The water was basic (9.07 – 8.0 pH)
with the highest observed pH values occurring in the depths directly overlying the thermocline.
The water was fresh (SpC 0.345 mS cm-1, TDS 218 mg L-1) and relatively turbid (Zsecchi=1.3 m).
27
Abundant macrophyte communities surrounded the shoreline to a water depth of 4.0 m. A 0.99
m sediment core (BAG-A-05-VII-05) retrieved from 15.0 m water depth (N48°24.972,
E095°57.350) and a 0.79 m sediment core (BAG-B-05-VII-05) retrieved from 8.2 m water depth
(N48°25.773, E095°58.398) yielded organic rich clay with horizons of abundant shell fragments
and sand.
Figure 2-4. Baga Nuur bathymetric map and water column physical profile.
2.3.2.4 Tsegan Nuur
Tsegan Nuur (N 48°24.972, E095° 57.350, 1877 m.a.m.s.l.; Figure 3-3) has a maximum
observed depth of 8.5 m in the central region of the lake (Figure 2-6). Water temperatures
ranged 17.66 °C to 1.71°C with a clear thermocline present at 5.0 - 6.5 m (Table 2-2). Tsegan
Nuur water was mesosaline (SpC 12.8 mS cm-1, TDS 10,691 mg L-1) and dissolved oxygen
values showed a strong clinograde profile with values ranging from 7.52- 1.71 mg L-1. Water
clarity was low (zsecchi= 0.5 m). A 0.68 m sediment core (TGN-A-06-VII-05) retrieved from 8.7

28
m water depth (N°48.43.712, E095°51.750) yielded grey clay with thin-to-medium beds of
highly organic black clay. Diffuse laminations are present in the organic horizons.
Figure 2-5. Tsegan Nuur bathymetric map and water column physical profile.
2.3.2.5 Holvoo Nuur
Holvoo Nuur (N 49°02.659, E097° 09.615, 1952 m.a.m.s.l.; Figure 2-7) consists of two large
basins connected by a small intermittent mall strait. Only the northeastern basin was explored
for this study. Maximum observed depth of 8.5 m occurred along the southwestern shore. Water
temperatures were relatively consistent (15.5 – 15.0°C), and DO displayed a homogeneous
profile ( 8 – 7.16 mg L-1; Table 2-2). The water was basic (9.38 – 9.24 pH), oligosaline (SpC
2.67 mS cm-1, TDS 1726 mg L-1), and relatively turbid (zsecchi= 1.3 m). A 1.2 m sediment core
(HOL-A-01-VII-05) retrieved from 7.5 m water depth (N49°02.659, E097°09.615) yielded clay
with interspaced diffuse sub-millimeter dark and light brown laminations and limited
bioturbation.

29
Figure 2-6. Map showing spatial distribution of Holvoo Nuur, Buust Nuur, and Oigon Nuur as well as surrounding lakes and ecological zones.
2.3.2.6 Oigon Nuur
Oigon Nuur (N 49°09.184, E096°38.024, 1667 m.a.m.s.l., Figure 3-7) is a large (surface area =
73.46 km2), shallow (zmax=3.5 m) mesosaline lake located northwest of Holvoo Nuur. Due to
extremely inclement weather neither hydrolab data nor a sediment core were acquired.
2.3.2.7 Buust Nuur
Buust Nuur (N49°06.930, E097°27.382, 1983 m.a.m.s.l., Figure 3-6) is a relatively large lake
northwest of Holvoo Nuur. The lake is circular with a small island located in the center. Only
the lake area northwest of the island was surveyed for this investigation. A maximum depth of

30
12.0 m was found. Water temperatures ranged from 14.6°C to 5.5°C with a clear thermocline at
7-9.0 m depth (Table 3-2). The dissolved oxygen profile was consistent with the temperature
profile with values ranging from 9.1 – 3.8 mg L-1. The water was basic (pH 9.2) and oligosaline
(SpC 3.19 mS cm-1, TDS 2388 mg L-1). A 1.35 m sediment core (BST-A-30-VI-05) retrieved
from 12.1 m water depth (N49°07.829, E097°26.499) yielded organic-rich clay with visible
stratigraphic horizons. Multiple sections of diffuse sub-millimeter laminations exist with
massive intervals of organics and clay.
2.3.2.8 Zuun Nuur
Zuun Nuur (N 49° 03.858, E099° 27.999, 2012 m.a.m.s.l.; Figure 3-7) is relatively large lake
(surface are = 17.65 km2) located southeast of Sangeen Dalai Nuur. Only the western basin was
explored for this study. A maximum observed depth of 12.7 m occurred just east of the large
southwestern peninsula. Water temperatures were relatively consistent (14.0 - 13.4°C), and DO
displayed a homogeneous profile (6.18 – 5.0 mg L-1; Table 3-2). The water was basic (8.99 –
9.04 pH), oligosaline (SpC 4.67 μS cm-1, TDS 3254 mg L-1), and turbid (Zsecchi= 1.0 m). A 1.11
m sediment core (ZUN-A-16-VIII-05) retrieved from 12.7 m water depth (N49° 03.858, E099°
27.999) yielded grey fine clay with visible stratigraphic horizons. Multiple sets of sub-
millimeter laminations, silt layers, sand layers, and organic horizons are present.
31
Figure 2-7. Map showing spatial distribution of Gandan Nuur, Sangeen Dalai Nuur, Zuun Nuur and Tunamal Nuur as well as surrounding ecological zones.
2.3.2.9 Gandan Nuur
Gandan Nuur (N 49°11.933, E098°46.013, 1897 m.a.m.s.l., Figure 3-7) has maximum observed
depth of 5.2 m located in the center region of the lake. Abundant macrophytes were present.
Water temperatures were consistent to a depth of 4.5 m (14.3°C) and D.O displayed a
homogeneous profile (6.18 – 6.11 mg L-1; Table 3-2). The water was slightly basic (8.71 pH)
and fresh ( SpC 0.398 mS cm-1, TDS 243 mg L-1). Secchi depth measurements were not taken
and a sediment core was not retrieved due to inclement weather.

32
2.3.2.10 Sangeen Dalai Nuur
Sangeen Dalai Nuur (N49°11.024, E099°01.990, 1705 m.a.m.s.l., Figure 3-7) is the largest lake
(surface area =181.9 km2) in this study and is comprised of two large basins. Due to the extreme
size of this lake only the southeastern basin was surveyed. A maximum depth of 6.5m was
found 3.5 km off shore (N49°11.034, E099°01.990). All physical characteristics measured
throughout the water column displayed a consistent profile. Water temperature was warm
throughout (15.5°C), DO values were high (5.06 mg L-1), and water was basic (9.2; Table 3-2)
and oligosaline (SpC 5.06 mS cm-1, TDS 3411 mg L-1). No sediment cores were retrieved due to
high wave action and inclement weather.
2.3.2.11 Tunamal Nuur
Tunamal Nuur (N 49°25.130, E098°31.848, Figure 3-7) has a maximum depth of 9.7 m observed
in the central region of the lake. Water temperatures were consistent throughout the water
column (16.3 – 15.8°C) and DO displayed a homogeneous profile (9.07- 9.1 mg L-1; Table 3-2).
The water was basic (9.07 pH), oligosaline (SpC 5.65 mS cm-1, TDS 3724 mg L-1), and turbid
(zsecchi = 1.0 m). A 1.1 m sediment core (TUN-A-14-VIII-05) retrieved from 9.7 m water depth
(N49°25.130, E098°31.848) yielded highly organic dark grey clay. Two distinct clay horizons
make up the majority of the core with sub-millimeter diffuse laminations present in the basal
sediments.

33
2.3.2.12 Tevdan Nuur
Tevdan Nuur (N 49°14.553, E095°39.201, 1705 m.a.m.s.l.) is a hypersaline lake with a
consistent depth of 1.0 m. A thick salt crust was present at the sediment water interface and
active salt precipitation was occurring in the water column. A 0.5 m sediment core (TVD-A-06-
VII-05) was retrieved through a perforation in the salt crust yielding course grained dark grey
clay with non-horizontal sand and gravel deposits.
2.3.3 Northern Mongolia
Figure 2-8. Locations of surveyed lakes in the Baroon Taiga Mountains of northern Mongolia. The lakes are present in two glacially scoured valleys located approximately 15 km apart and are at the alpine tundra/taiga transition zone.

34
All northern lakes associated with this study are open systems located within the Baroon Taiga
mountain complex west of the Darkhad Valley, Khovsgul Aimag (Figure 3-9). The lakes all
straddle the local tree line and the taiga/alpine tundra transition zone. Evidence for late
Pleistocene glaciation in the watershed is provided by the presence of cirque and moraine
complexes and surveyed lakes likely originate from pro-glacial processes. The region is
characterized by continuous permafrost.
2.3.3.1 Sanjin Nuur
Sanjin Nuur (N 51°13.910, E099°01.397, 2090 m.a.m.s.l., Figure 3-9) is a paternoster lake
positioned at the headwall of the lower valley and drains northeastward. Hydrologic inputs are
limited to overflow from a small basin located to the south and snowmelt from the limited
catchment (~1.0 km2). A maximum depth of 17.4 m was observed in the southern regions of the
lake with an average depth of 3.1 m (Figure 3-10). The lake has a surface area of 0.094 km2. The
lake was thermally stratified with water temperatures varying from an air-water interface value
of 11.9°C to a water-sediment interface value of 4.63°C (Table 3-2). A clear thermocline was
visible at 6.0-8.0 m. The dissolved oxygen profile displayed a slight positive heterograde profile
with a metalimnic oxygen maxima occurring at 6.5 m (7.99 mg L-1). The pH of the water was
circumneutral (7.75 – 6.87 pH) with a maximum value occurring at the metalimnion. The lake
water was extremely fresh (SpC 0.01 mS cm-1, TDS 9 mg L-1) and transparent (Zsecchi = 4.75 m).
Four sediment cores ranging in length from 0.83 – 1.1 m retrieved in various water depths yield
grey near homogeneous diatomaceous clay with limited visible stratigraphic horizons.

35
Figure 2-9. Sanjin Nuur bathymetric map and water column physical profile.
2.3.3.2 Mustei Nuur
Mustei Nuur (N 51°14.354, E099°00.354, 2353 m.a.m.s.l.; Figure 3-9) is located in a cirque
formation above local tree-line. The only hydrologic input is surface runoff from its highly
limited catchment. A maximum depth of 28.0 m was observed along the western shoreline
(Figure 3-11). The lake was thermally stratified with water temperatures varying from 14.0°C at
the surface waters to a bottom water value of 5.09° (Table 3-2). A clear thermocline was present
at 6.0-8.0 m. The lake is ultra-oligotrophic with an average specific conductivity value of 0.007
mS cm-1. The water was circumneutral (pH 7.08), extremely fresh (SpC 0.007 mS cm-1, TDS 7.0
mg L-1) and exceptionally transparent (Zsecchi = 11.2 m).
A 1.25 m sediment core (MUS-A-7-VIII-05) retrieved from 19.4 m water depth
(N51°14.354, E099°00.354) yielded diatomaceous clay with visible stratigraphic horizons.
Organics, silt and sand layers, bedding, and laminations are present throughout the sediment
core.
36
Figure 2-10. Mustei Nuur bathymetric map and water column physical profile.
2.3.3.3 Ganbold Nuur
Ganbold Nuur (N51°20.076, E098°52.532, 2102 m.a.m.s.l., Figure 3-9) is located at the
headwall of a valley with hydrologic inputs from several small basins located in the surrounding
cirque complexes. A maximum depth of 21.9 m was observed in along the southern shoreline
(Figure 3-12). The lake was thermally stratified with water temperatures varying from 12.7°C at
the surface waters to 3.67°C at the bottom waters with a thermocline occurring at 1.5-3.0 m
(Table 3-2). The dissolved oxygen values vary from a surface water value of 7.44 mg L–1 to a
bottom water value of 3.32 mg L-1 with a positive heterograde profile showing a metalimnic
oxygen maxima occurring at 3.5 m (8.38 mg L-1). The water was circumneutral (pH 7.01),
extremely fresh (SpC 0.027 mS cm-1, TDS 20 mg L-1), and highly transparent (Zsecchi = 5.6 m).
Two sediment cores (GAN-A-10-VIII-05, 93.0cm; GAN-B-10-VIII-05, 104.0cm) were retrieved
from Ganbold Nuur at depths of 21.9 m (N51°20.076, E098°52.532) and 18.5 m (N51°20.062,
E098°52.510). Both sediment cores exhibit clay with thick bedding and thin organic and silt
laminations.
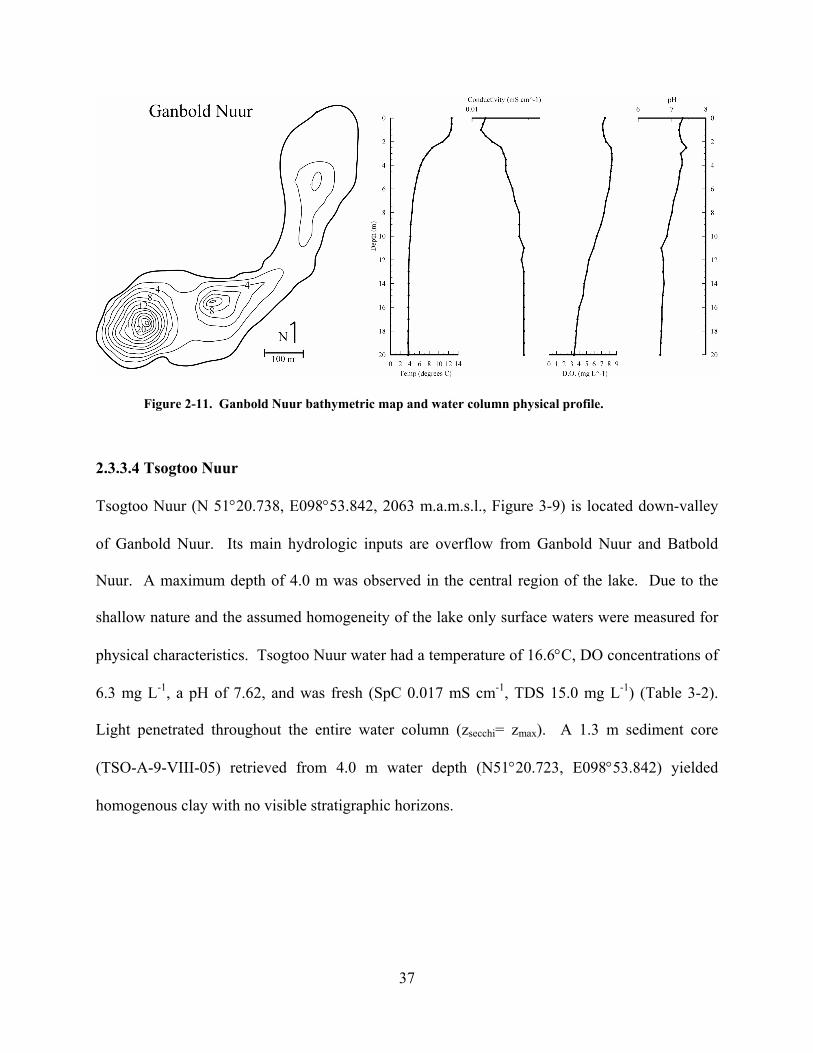
37
Figure 2-11. Ganbold Nuur bathymetric map and water column physical profile.
2.3.3.4 Tsogtoo Nuur
Tsogtoo Nuur (N 51°20.738, E098°53.842, 2063 m.a.m.s.l., Figure 3-9) is located down-valley
of Ganbold Nuur. Its main hydrologic inputs are overflow from Ganbold Nuur and Batbold
Nuur. A maximum depth of 4.0 m was observed in the central region of the lake. Due to the
shallow nature and the assumed homogeneity of the lake only surface waters were measured for
physical characteristics. Tsogtoo Nuur water had a temperature of 16.6°C, DO concentrations of
6.3 mg L-1, a pH of 7.62, and was fresh (SpC 0.017 mS cm-1, TDS 15.0 mg L-1) (Table 3-2).
Light penetrated throughout the entire water column (zsecchi= zmax). A 1.3 m sediment core
(TSO-A-9-VIII-05) retrieved from 4.0 m water depth (N51°20.723, E098°53.842) yielded
homogenous clay with no visible stratigraphic horizons.

38
2.3.3.5 Batbold Nuur
Batbold Nuur (N 51°20.856, E098°52.496, 2150 m.a.m.s.l., Figure 3-9) is present above tree line
in a cirque formation located directly west of Tsogtoo Nuur. Its only hydrologic input is surface
flow from its limited catchment. A maximum depth of 15.5 m was observed in the central
regions of the lake (Figure 3-13). The lake is thermally stratified with water temperatures
varying from surface water values of 15.8°C to bottom water values of 5.3°C, and has a
thermocline occurring from 5-7.0 m (Table 3-2). The D.O. profile exhibits an orthograde profile
with maximum values occurring at 7.5 m. The water had pH values varying from 8.4 – 6.6 with
a maximum value at 5.0 m and was fresh (SpC 0.017 mS cm-1, TDS 14.0 mg L-1). A 1.21 m
sediment core retrieved from 12.0 m water depth (N51°20.856, E098°52.496) exhibits clay with
diffuse massive transitions.
Figure 2-12. Batbold Nuur bathymetric map and water column physical profile.
2.3.3.6 Mandax Nuur
Mandax Nuur (N 51°22.323, E098°57.494, 1978 m.a.m.s.l) is the lowest and largest (surface
area = 1.35 km2) surveyed lake within the Baroon Taiga Mountains. A maximum depth of 6.0 m
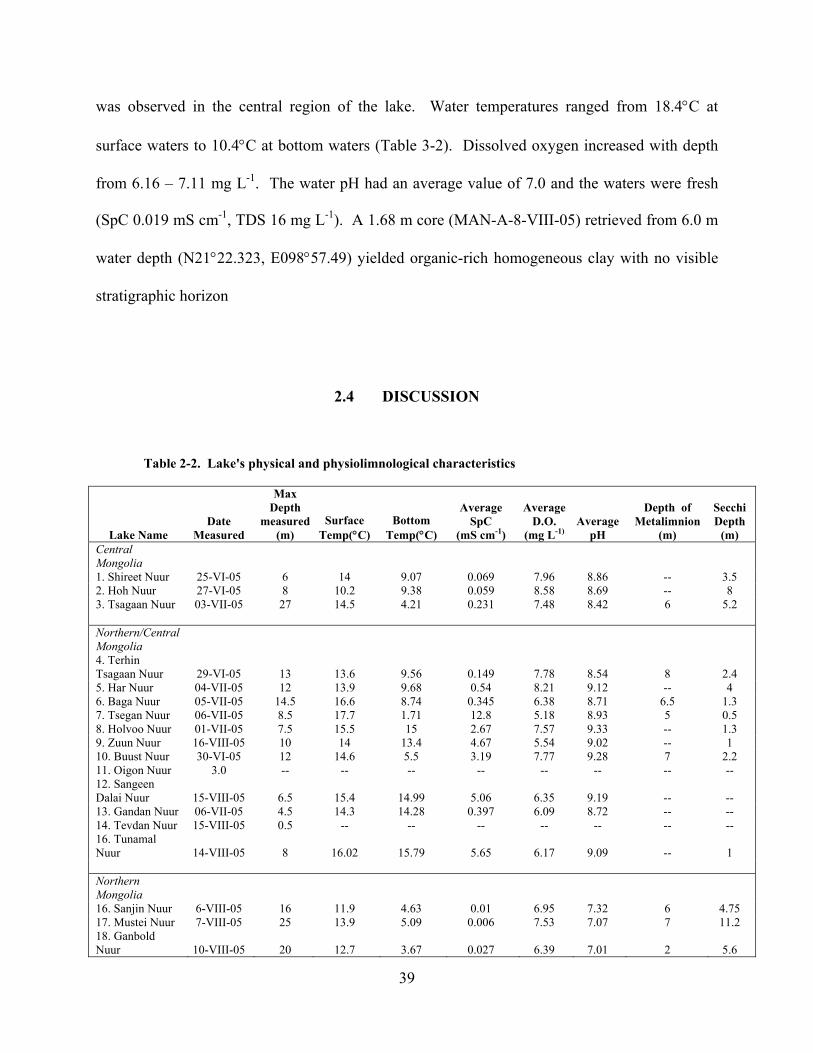
39
was observed in the central region of the lake. Water temperatures ranged from 18.4°C at
surface waters to 10.4°C at bottom waters (Table 3-2). Dissolved oxygen increased with depth
from 6.16 – 7.11 mg L-1. The water pH had an average value of 7.0 and the waters were fresh
(SpC 0.019 mS cm-1, TDS 16 mg L-1). A 1.68 m core (MAN-A-8-VIII-05) retrieved from 6.0 m
water depth (N21°22.323, E098°57.49) yielded organic-rich homogeneous clay with no visible
stratigraphic horizon
2.4 DISCUSSION
Table 2-2. Lake's physical and physiolimnological characteristics
Lake Name Date
Measured
Max Depth
measured (m)
Surface Temp(°C)
Bottom Temp(°C)
Average SpC
(mS cm-1)
Average D.O.
(mg L-1) Average
pH
Depth of Metalimnion
(m)
Secchi Depth
(m) Central Mongolia 1. Shireet Nuur 25-VI-05 6 14 9.07 0.069 7.96 8.86 -- 3.5 2. Hoh Nuur 27-VI-05 8 10.2 9.38 0.059 8.58 8.69 -- 8 3. Tsagaan Nuur 03-VII-05 27 14.5 4.21 0.231 7.48 8.42 6 5.2 Northern/Central Mongolia 4. Terhin Tsagaan Nuur 29-VI-05 13 13.6 9.56 0.149 7.78 8.54 8 2.4 5. Har Nuur 04-VII-05 12 13.9 9.68 0.54 8.21 9.12 -- 4 6. Baga Nuur 05-VII-05 14.5 16.6 8.74 0.345 6.38 8.71 6.5 1.3 7. Tsegan Nuur 06-VII-05 8.5 17.7 1.71 12.8 5.18 8.93 5 0.5 8. Holvoo Nuur 01-VII-05 7.5 15.5 15 2.67 7.57 9.33 -- 1.3 9. Zuun Nuur 16-VIII-05 10 14 13.4 4.67 5.54 9.02 -- 1 10. Buust Nuur 30-VI-05 12 14.6 5.5 3.19 7.77 9.28 7 2.2 11. Oigon Nuur 3.0 -- -- -- -- -- -- -- -- 12. Sangeen Dalai Nuur 15-VIII-05 6.5 15.4 14.99 5.06 6.35 9.19 -- -- 13. Gandan Nuur 06-VII-05 4.5 14.3 14.28 0.397 6.09 8.72 -- -- 14. Tevdan Nuur 15-VIII-05 0.5 -- -- -- -- -- -- -- 16. Tunamal Nuur 14-VIII-05 8 16.02 15.79 5.65 6.17 9.09 -- 1 Northern Mongolia 16. Sanjin Nuur 6-VIII-05 16 11.9 4.63 0.01 6.95 7.32 6 4.75 17. Mustei Nuur 7-VIII-05 25 13.9 5.09 0.006 7.53 7.07 7 11.2 18. Ganbold Nuur 10-VIII-05 20 12.7 3.67 0.027 6.39 7.01 2 5.6

40
19. Tsogtoo Nuur 9-VIII-05 1 16.6 -- 0.017 6.3 7.62 -- 3.8 20. Batbold Nuur 9-VIII-05 12 15.8 5.3 0.017 7.15 7.47 3.5 6 21. Mandax Nuur 8-VIII-05 6 18.2 10.4 0.019 6.58 7.49 4 5.8
The surveyed lakes located in the Baroon Taiga Mountains of northern Mongolian differ greatly
from those located in the central and north-central regions in geological setting,
physiolimnological and morphological characteristics, and origins. The survey data with respect
to the northern Mongolian lakes are thereby discussed separately from the central and north-
central lakes. Furthermore, because the area encompassing all the northern Mongolian lakes is
highly limited in comparison to the area encompassing the lakes of the central and north-central
regions (~180 km2 as compared to ~125,000 km2), the climate characteristics of the northern
region are considered uniform, thereby having no influence over inter-lake variation. However,
this assumption coupled with the smaller sizes of the northern lake systems allows for a more
concise discussion of the mechanisms driving any inter-lake variability. With respect to the
central and north-central lake systems, their overall large nature resulted in a lack of specific data
for some lakes (i.e. maximum depth, surface area). This lack of information coupled with the
significant spatial distribution of the lake systems limits any discussion of inter-lake variability
to general, large-scale influences (i.e. regional climate variations).
2.4.1 Factors controlling chemical enrichment of Mongolian lake water
Lakes sampled in the northern Mongolian region varied little in their physical and
physiolimnological characteristics, although a general negative correlation between elevation
(i.e. valley placement) and chemical enrichment exists (Figure 2-13a). Such a correlation is
expected, as a lower valley placement amplifies catchment size, increasing runoff and inflow
sources and thereby chemical solutes. Because these lakes are all open systems, elevation should

41
be the dominant influence on chemical enrichment. This inference is supported by the lack of
correlation between surface area and SpC concentrations (Figure 2-13b).
Figure 2-13. Specific conductivity values (mS cm-1) plotted against (a) elevation (m.a.m.s.l) and b) surface area (km2) for the six surveyed northern Mongolian lake systems.
Central and north-central lakes surveyed varied considerably in their surface area (1.45-
181.9 km2), elevation (1667-2625 m.a.m.s.l.), latitude (N46°31.490-N49°25.130), longitude
(E095°39.201-E101°50.051) and specific conductivity (0.059-12.8 mS cm-1). Based on the
level of chemical enrichment from TDS concentrations, the lakes can be characterized as either
fresh, oligosaline, or mesosaline As with the northern Mongolian lakes, elevation has a negative
correlation to chemical enrichment (Figure 2-14a) and no correlation to surface area (Figure 2-
14b), although in the central and north-central lake systems precipitation rates rather than
catchment placement are likely responsible for such enrichment. However, annual average
precipitation totals for surrounding WMO weather stations (table 2-3) show an increasing trend
in precipitation with decreased elevation (Figure 2-15a), suggesting that precipitation as a
function of elevation does not play a major role in chemical enrichment. A pattern of increased
specific conductivity with westward location is seen (Figure 2-14c) and is in agreement with

42
local precipitation patterns (Figure 2-15b). Yet, specific conductivity concentrations increase
with latitude (Figure 2-14d), opposite to the precipitation trends (Figure 2-15b).
Figure 2-14. Specific conductivity values (mS cm-1) plotted against (a) elevation (m.a.m.s.l.), (b) surface area (km2), (c) longitude (°E), and (d) latitude (°N) for all the surveyed central and north-central Mongolian lake systems. The black rectangle encompasses the lakes designated as oligosaline and the dotted rectangle encompasses the lakes designated as mesosaline, determined from TDS concentrations. Specific lakes may be omitted from the graphs dependent upon availability of data.
These collective findings suggest that while precipitation as a function of longitude may
influence Mongolian lakes’ physiochemical characteristics, actual specific conductivity
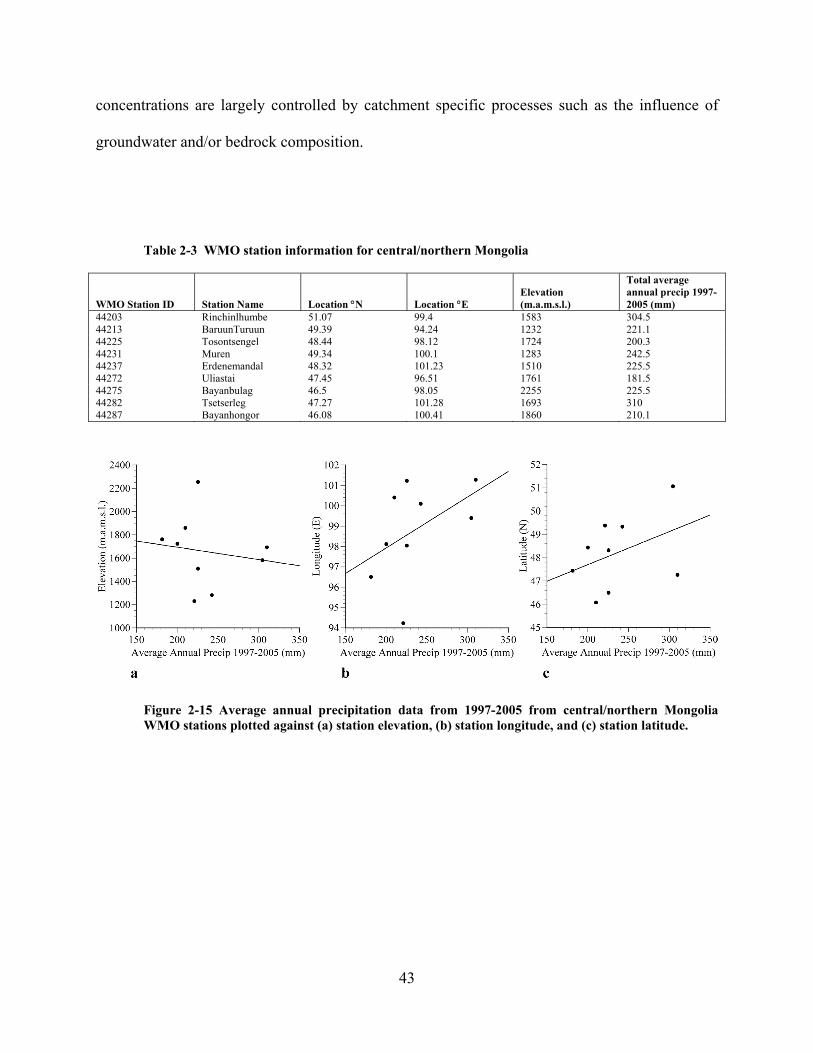
43
concentrations are largely controlled by catchment specific processes such as the influence of
groundwater and/or bedrock composition.
Table 2-3 WMO station information for central/northern Mongolia
WMO Station ID Station Name Location °N Location °E Elevation (m.a.m.s.l.)
Total average annual precip 1997-2005 (mm)
44203 Rinchinlhumbe 51.07 99.4 1583 304.5 44213 BaruunTuruun 49.39 94.24 1232 221.1 44225 Tosontsengel 48.44 98.12 1724 200.3 44231 Muren 49.34 100.1 1283 242.5 44237 Erdenemandal 48.32 101.23 1510 225.5 44272 Uliastai 47.45 96.51 1761 181.5 44275 Bayanbulag 46.5 98.05 2255 225.5 44282 Tsetserleg 47.27 101.28 1693 310 44287 Bayanhongor 46.08 100.41 1860 210.1
Figure 2-15 Average annual precipitation data from 1997-2005 from central/northern Mongolia WMO stations plotted against (a) station elevation, (b) station longitude, and (c) station latitude.

44
2.4.2 Factors controlling pH of Mongolian lake water
All lakes sampled in the northern Mongolian region had circum-neutral waters. Any variation in
pH between such lake systems is likely to be a function of biological activity. A negative
correlation between elevation and pH is found in these lake systems (Figure 2-16a). These lakes
Figure 2-16 Average water pH verse (a) elevation (m.a.m.s.l), b) surface area (km2), (c) maximum depth (m), and (d) Secchi dish depth (m) for the six surveyed northern Mongolian lake systems.
straddle the local tree-line elevation, with the higher elevation lakes located above and the lower
elevation lakes below. Therefore, the lower elevation lakes have soil development and
vegetation within their broader catchment areas, likely resulting in an enhanced delivery of
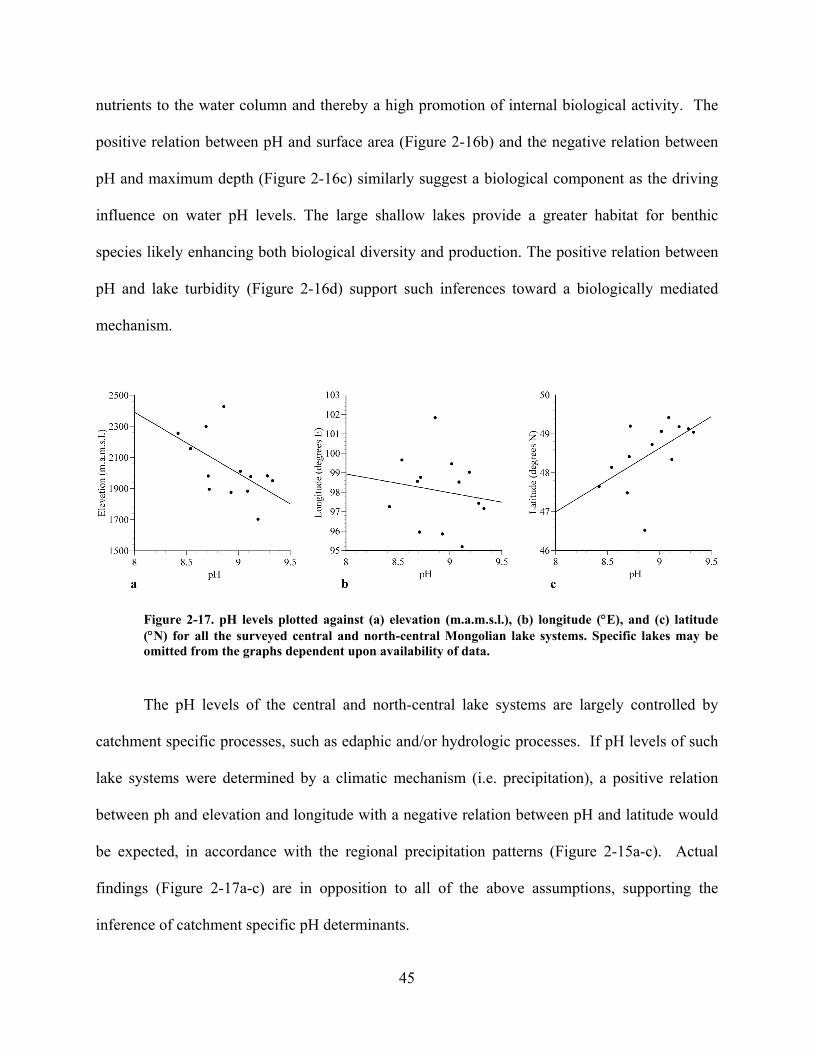
45
nutrients to the water column and thereby a high promotion of internal biological activity. The
positive relation between pH and surface area (Figure 2-16b) and the negative relation between
pH and maximum depth (Figure 2-16c) similarly suggest a biological component as the driving
influence on water pH levels. The large shallow lakes provide a greater habitat for benthic
species likely enhancing both biological diversity and production. The positive relation between
pH and lake turbidity (Figure 2-16d) support such inferences toward a biologically mediated
mechanism.
Figure 2-17. pH levels plotted against (a) elevation (m.a.m.s.l.), (b) longitude (°E), and (c) latitude (°N) for all the surveyed central and north-central Mongolian lake systems. Specific lakes may be omitted from the graphs dependent upon availability of data.
The pH levels of the central and north-central lake systems are largely controlled by
catchment specific processes, such as edaphic and/or hydrologic processes. If pH levels of such
lake systems were determined by a climatic mechanism (i.e. precipitation), a positive relation
between ph and elevation and longitude with a negative relation between pH and latitude would
be expected, in accordance with the regional precipitation patterns (Figure 2-15a-c). Actual
findings (Figure 2-17a-c) are in opposition to all of the above assumptions, supporting the
inference of catchment specific pH determinants.

46
2.5 CONCLUSIONS
This survey provides basic but valuable information for twenty-one lake systems throughout
central and northern Mongolia. The surveyed inflation depression lakes in central and north-
central Mongolia exhibit a wide range of physical variation in their basin morphology, waters,
and sediments, reflecting the complex geological, edaphic, and hydrologic conditions of the
survey area. Using the data collected in this study, the lakes can be classified into three groups
based upon chemical enrichment: fresh, oligosaline, and mesosaline. Evidence for a climatic
mechanism upon degree of chemical enrichment is limited, suggesting catchment specific
processes as determinates for inter-lake variability. The lakes located in the Baroon Taiga
Mountains of northern Mongolia exhibit less physical variability, with any inter-lake variability
likely attributed to valley placement (i.e. elevation).
Further investigation into the chemical make-up of each lake system is required before
any accurate characterization can be completed. Major ion concentrations from collected water
sampled should be measured in order to examine the internal nutrient and chemical dynamics of
each individual system. Furthermore, δ18O and δD ratios of water samples should be measured
to properly assign each lake system open or closed basin status. The lake sediment cores also
stand to provide a wealth of information about the lakes’ ages, biological communities,
chemistries, and the histories of regional climatology and ecology both within lakes and their

47
surrounding watershed. Therefore, with more intensive analysis of the materials collected as part
of this survey, the basic nature of each lake system as presented by this investigation may be
expanded to a complex and holistic study of the limnological and paleolimnological dynamics of
each lake system providing a more thorough understanding of the mechanisms determining inter-
lake variability on a both spatial and temporal scales.

48
3.0 SEDIMENTARY PIGMENT AND DIFFUSE REFLECTANCE SPECTROSCOPY
ANALYSES: INTRODUCTION, METHODOLOGIES, AND APPLICATIONS
3.1 SEDIMENTARY PIGMENT ANALYSES
3.1.1 Introduction to Pigment Analysis in Lake Sediments
Lake sediments contain a wide array of photosynthetic pigments including carotenoids,
chlorophylls, photoprotectant compounds, other lipid-soluble pigments, and various derivative
products (Leavitt and Hodgson 2001). Chlorophylls, chlorophyll degradation products (CDP),
and carotenoids have been shown to preserve in sediments well beyond the disappearance of
their source organisms (Brown 1969). Isolation and utilization of such pigments as biomarkers
for changes in past photosynthetic productivity in sediments has thereby been employed for
many decades (Vallentyne 1957; Fogg and Belcher 1961; Swain 1985).
Chlorophyll a (Chl a) and its degradation products are among the most extensively
utilized pigments in paleolimnological studies due to their universal presence in photosynthetic
organisms (Hendry et al. 1987). The sources of such pigments to lake sediments include
autochthonous primary production, littoral plant material, and allochthonous materials, although
terrestrially-sourced pigments generally have an extremely short degradation period and rarely
contribute to the overall pigment pool in lake systems (Sanger 1988; Leavitt 1993).
49
The isolation and quantification of Chl a and CDP (chlorophyll a’, pheophytin a,
pheophorbide a) as paleoproductivity indicators is controversial however, as the processes
leading to the degradation of Chl a in both the water column and sediments are poorly
constrained (Shuman and Lorenzen 1975; Carpenter et al. 1986; Leavitt and Carpenter 1990;
Hurley and Armstrong 1990; Hurley and Armstrong 1991; Leavitt 1993). For example, while
some studies have shown that total fossil pigments well represent algal abundance in the water
column (Gorham et al. 1974; Flanery et al. 1982), others report that extremely high percentages
of autochthonous pigments are degraded in the water column resulting in an underestimation of
algal abundance (Furlong and Carpenter 1988; Hurley and Armstrong 1990), and yet others
report an overestimation of algal populations due to pigment resuspensional processes (Carpenter
et al. 1986). The use of Chl a and CDP reconstructions as quantitative proxies for algal
abundance, thereby, requires a thorough evaluation of the Chl a degradation processes within the
lake system, or an independent record of algal abundance.
3.2 CHLOROPHYLL A DEGRADATION PROCESSES
Chlorophyll a is a tetrapyrrole pigment with a porphyrin head defined by a central Mg2+ atom
and having a molecular formula of C55H72O5N4Mg (mol. wt. 893.49) (Hendry et al. 1987; Sheer
1991). Two pathways of chlorophyll a degradation occur. The initial loss of the central Mg2+
atom yields pheophytin a. The phytol chain bound to the
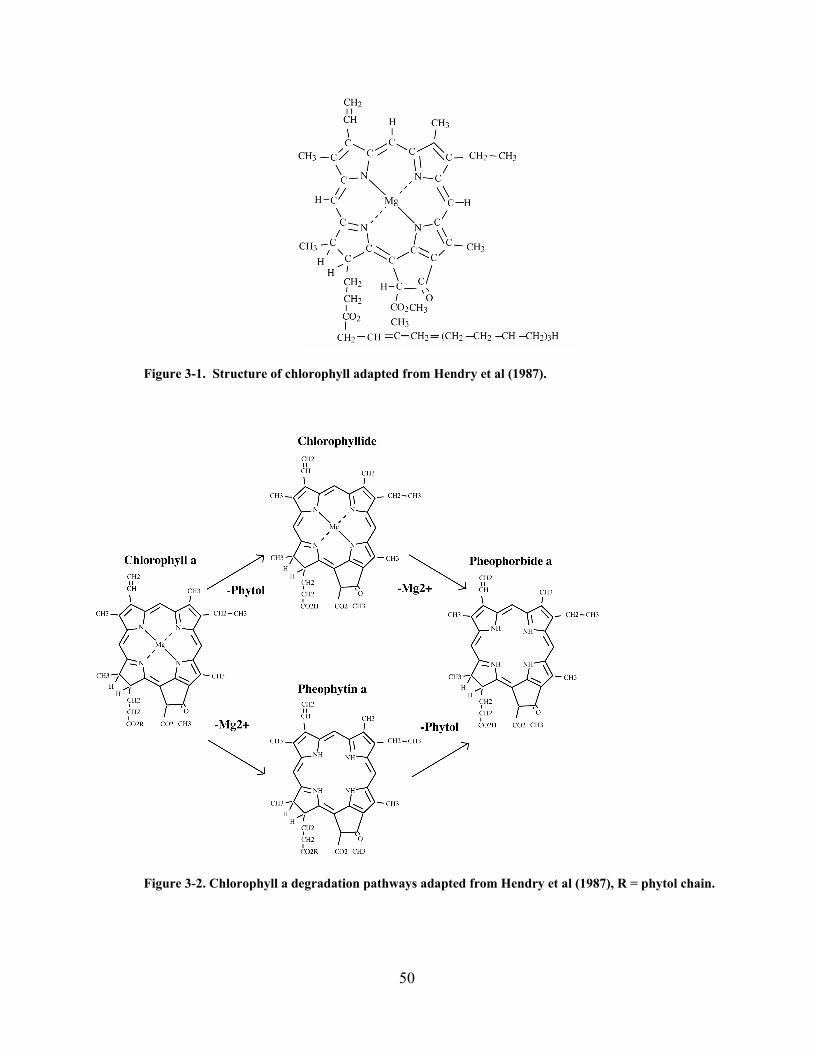
50
Figure 3-1. Structure of chlorophyll adapted from Hendry et al (1987).
Figure 3-2. Chlorophyll a degradation pathways adapted from Hendry et al (1987), R = phytol chain.
51
porphyrin head can similarly be removed through hydrolysis of the ester bond. In Chl a, this
removal yields chlorophyllide a, while in pheophytin a, pheophorbide a is formed. Further
removal of the Mg2+ atom from chlorophyllide a also results in pheophorbide a (Hendry et al.
1987).
Selective degradation of Chl a occurs in both the water column and sediments and is
largely a function of photic zone depth, dissolved oxygen concentrations, herbivory, and water
pH. Photodegradation is a main mechanism of Chl a breakdown in the photic zone, given the
presence of oxygen. Upon the interaction of moribound cell pigments with solar light, singlet
oxygen or hydroxy (HO) and peroxy radicals (HO2) are generated. The triplet excited Chl a is
then sensitive to redox reactions, resulting in both the removal of the Mg2+ atom and the phytol
chain (Rontani et al. 1995). The photo-oxidative half-life of Chl a has been shown to be as little
as 0.2 days (Leavitt 1993). Residence times for moribound algae can be on the order of 100
days depending upon photic zone depth (Leavitt 1993), thereby photodegradation can be
responsible for the degradation of a large percentage of pigment concentrations.
Similarly, zooplankton grazing is largely responsible for Chl a degradation as the phytol
chain is removed from the porphyryin chain when the pigment is passed through the gut
(Shuman and Lorenzen 1975; Leavitt et al. 1989; Mayzaud and Razouls 1992; Pandolfini et al.
2000). Previously, planktonic herbivores have been shown to convert Chl a to pheophorbide
with a 100% efficiency on a molar basis (Shuman and Lorenzen 1975), yet more recent studies
have demonstrated a loss of up to 70% of total Chl a and CDP to colorless undetectable products
(Daley and Brown 1973; Daley 1973). CDP are not metabolically assimilated by aquatic
invertebrates (Leavitt 1993). Total pigment conversion and loss depends upon species of algae
and herbivore, grazing rates, and nutritional histories of grazers. CDP resulting from herbivore
52
ingestion are reintroduced to the water column within fecal pellets. The rapid sinking rates of
fecal pellets decreases further degradation via photodegradation, often resulting in high
concentrations of pheophorbide a relative to other CDP in sediments from lakes with high
grazing populations (Carpenter et al. 1986).
The majority of pigment materials within the water column are degraded before being
incorporated into lake sediments (Carpenter et al. 1986). Up to 99% of Chl a can be degraded
as moribound photosynthetic organisms sink due to herbivore digestion, chemical oxidation, or
photo-oxidation. In the absence of light both at the sediment-water interface and within the
sediments, degradation continues (at reduced rates) due to chemical and herbivore digestions
(Hurley and Armstrong 1990). The extent of pigment degradation and preservation within the
sediments is highly lake and pigment-specific and will depend upon oxygen concentrations with
depth, herbivore populations, and sediment accumulation rates (Hurley and Armstrong 1991).
For example, the post-depositional half lives of pigments in oxic marine sediments has been
shown to be less than 50 days (Furlong and Carpenter 1988), while pigments have been found in
lake sediments with an age in excess of 20,000 years (Vallentyne 1957).
3.3 PIGMENT ANALYSIS TECHNIQUES
A wide variety of pigment identification and quantification techniques are employed including
spectrofluorometry, fluorometry, spectrophotometry, and high performance liquid
chromatography (HPLC), each with unique associated pigment extraction techniques (Hagerthey
et al. 2006). For the purposes of this study, only HPLC and spectrophotometry (and associated
extraction techniques) will be discussed in detail.

53
3.3.1 High performance liquid chromatography (HPLC)
A complete review of the theoretical aspects of high performance liquid chromatography is well
beyond the scope of this paper, however, a brief overview of the general concepts will be
presented. For a thorough overview of the theory and practice of HPLC, please refer to one of
the many textbooks available on the subject (Hamilton and Sewell 1982; Brown and Hartwick
1989). Briefly, HPLC separates components of a mixture through chemical and physical
interactions between such components and two phases: a mobile phase and a stationary phase. In
reverse-phase high performance liquid chromatography (RP-HPLC) a mixture is incorporated
into a mobile phase of known polarity and passed through a column containing a non-polar
stationary phase. The rate at which the components of the mixture diffuse through the column is
dependent upon the attractions between each unique component’s polarity with both the polar
mobile and non-polar stationary phase. Components with increased attraction to the stationary
phase will have a longer retention time within the column, allowing each component to exit, or
elute, after a unique time lapse. The continuous chromatographic measurement of the mobile
phase exiting the column quantifies each component individually. In this study, reverse-phase
high performance liquid chromatography is employed to separate and quantify various pigments
by differential attraction to a non-polar stationary phase and variably polar mobile phases as
described by Leavitt and Hodgson (2001).
3.3.1.1 Pigment extraction and HPLC analysis
Freeze-dried 0.1mg sample aliquots are added to a 10.0 ml degassed mixture of acetone:
methanol: water (80:15:5, by volume). Samples are flushed with N2 and stored in the dark at -
54
20ºC for 12 hours. Extracts are filtered through 0.2 μm pore chemically resistant membrane
filters, dried, and stored at –20°C under inert atmospheric conditions. Extracted pigments are
removed from the filters with an acetone: methanol solution. Solutions are completely
evaporated under N2 in a dark, room temperature environment, leaving a dried pigment residual.
Dried pigments are dissolved into a known volume of 70% acetone: 25% ion pairing reagent
(0.75 g tetrabutyl ammonium acetate and 7.7 g ammonium acetate in 100 mL HPLC-grade
water): 5% methanol solvent with 3.2 mg L-1 Sudan II (Sigma). Sudan II is an internal standard
with carotenoid-like absorption characteristics (λmax = 485, 442.5 nm in acetone) and runs at a
known position on the chromatogram (7.3 min) (Leavitt and Findlay 1994).
The stationary phase consists of ~5μm particles coated with a non-polar monomer or
polymer. The mobile phases are three separate solvent streams with decreasing gradients of
polarity composed of methanol, acetone, water, acetonitrile, and an ion-pairing reagent.
Solutions containing the dissolved extracted pigments are initially introduced to the stationary
phase within the column with the highest polarity mobile phase. The pigments are then
separated within the column dependent upon polarity. The least polar pigments are most
attracted to the non-polar stationary phase and are only resuspended in solution following the
addition of a mobile phase solvent of decreased polarity. The mobile phase solution is subject to
chromatographic analysis upon exiting the column.
Reversed-phase high performance liquid chromatography of pigment extracts is
quantified as a binary solvent system as outlined in Mantoura and Llewellyn (1983) and
modified by Leavitt and Hogdson (2001) using a Hewlett-Packard model 1050 system, a Rainin
Model 200 Microsorb C-18 column (5μm particle size; 10 cm length), an Hewlett-Packard
model 1050 scanning photodiode array spectrophotometer (435 nm detection wavelength), and

55
an Hewlett-Packard fluorescence detector (435 nm excitation wavelength, 667 nm detection
wavelength). Pigment separation is achieved by delivery of mobile phase A (10% ion-pairing
reagent in methanol) for 1.5 min, a linear succession to mobile phase B (27% acetone in
methanol) over 7 min, and a 100% mobile phase B delivery for 12.5 min. Samples are scanned
at 660 nm and 430 nm. Between all samples, the column is re-equilibrated by a linear succession
to 100% mobile phase A over 3 min. followed by an isocratic hold for 12.5 min. before sample
re-injection. Pigments are identified through comparison of spectrophotometric data to United
States Environmental Protection Agency standards and standards of known pigment
concentrations. Concentration of pigments in the original sediment sample is determined as
follows:
mp = (Ai × S j − I j ) × (Vt ×Vi−1) × ms
−1 × m j−1 × mso
where mp = mass of the pigment, Ai = peak area on sample chromatogram, Sj = slope of
regression of calibration curve relating area of peak vs. mass of pure pigment, Ij = intercept of
calibration curve, Vt = volume of final stream injected, ms = mass of sediment extracted, mj =
molecular weight of pigment, mso = mass of original sediment sample. For this study, HPLC
results are reported in nmol pigment *dry sed mass –1 and are ultimately converted to mg
pigment* g dry sediment mass-1.
3.3.2 Transmittance Spectrophotometry
Transmittance spectrophotmetric analysis is the quantitative determination of the fraction of light
transmitted through a solution (Poole and Kalnenieks 2000). In spectrophotometry, a source
emits light of a given wavelength range through a monochromator. A prescribed wavelength of
light exits the monochromator, is passed through a solution, and is measured with a photodiode
56
upon transmittance. In double beam spectrophotometry, a ratio of two light paths, one
transmitted through the solution and one unimpeded, is used to quantify the amount of an
absorbing species within the solution. In this study, double beam UV/VIS spectrophometric
analysis is employed to quantify the amount of Chl a and CDP using the methods outlined in
Swain (1985), Waters et al (2005), and Riedinger-Whitmore et al (2005).
3.3.2.1 Pigment extraction and spectrophotometric analysis
Pigments are extracted from 8-10 mg of wet sediment using two 40 ml and one 20 ml aliquots
(100 ml total) of 90% acetone. Each aliquot is added to the sediment in a 125 ml polypropylene
bottle and shaken for 15 min at room temperature. Following separation via centrifuge for 20
min, the acetone extracts are collected in pipettes and measured at 665 nm using a Hitachi U-
2000 spectrophotometer before and after acidification with HCl to convert undegraded Chl a to
CDP. Three measurements are completed and averaged for each sample. All measurements are
corrected for turbidity by an absorbance reading at 750 nm. For this study, spectrophotometric
results are reported in absorbance value *gram organic matter-1 and are ultimately presented as
total absorbance at 650 nm (before and after acidification) g-1 dry sediment mass.
3.4 VISIBLE AND NEAR-INFRARED DIFFUSE REFLECTANCE SPECTROSCOPY
3.4.1 Introduction to diffuse reflectance spectroscopy
Spectroscopy is the measurement and study of the interaction between light and matter over a
spectral range. Upon interaction with a medium, light energy (photons) is absorbed, reflected, or
57
transmitted dependent upon the molecular structure of the medium. The quantification of portion
of reflected, transmitted, or emitted light as a function of wavelength results in the generation of
a spectrum. Every medium has a unique molecular structure and, thereby, a unique associated
spectrum. The quantification of the reflectance of light by a substance over the 300-2500 nm
wavelength range is commonly referred to as visible and near-infrared diffuse reflectance
spectroscopy (VNIRS). A complete review of the mathematical and theoretical aspects of
reflectance theory is well beyond the scope of this paper, however, a thorough overview of the
major concepts and terms will be presented in the following pages. For a thorough overview of
the theory and practice of reflectance spectroscopy, please refer to Hapke (1993).
The reflection of incident light at a medium’s surface can be perfect (also known as
specular) reflection, wherein the angle of reflected light is equal to the angle of incident light.
More commonly however, the angle of reflected light deviates from the incident angle due to
imperfections in the medium’s physical and molecular surface structure. Such imperfect
reflection is known as Lambertian reflectance. Similarly, the incident light may penetrate the
surface of the medium and be reflected and refracted off of internal grain boundaries. This
process is known as scattering. Such scattered photons may ultimately be absorbed by specific
components of the medium (and eventually emitted often at different wavelengths) or will exit
the medium at random angles. Diffuse reflectance refers to both the portion of light energy that
is subject to Lambertian reflectance and reemergence as a result of internal scattering.
The absorption of photons within a substance depends upon the chemical structure,
orientation, and grain size of the medium and is wavelength specific (Hunt 1977; Clark 1999).
For these reasons, each substance will produce a unique absorption or reflection spectral pattern
allowing for the identification of specific components through analysis of such spectra.

58
Complications arise though in dealing with a substance composed of a heterogeneous mixture of
components. The interaction of photons with each unique component within the mixture will
result in a separate unique alteration of the spectra and the combination of all components will
result in a complicated end product. For these reasons in combination with the inherent enormity
of data generated by spectroscopic methods (often tens of thousands of data points),
mathematical and statistical transformations of the spectral data are often required in order to
resolve the target signal. Furthermore, the ability to detect a specific component within a
substance depends upon the spectral range over which the reflection or absorption of light is
measured. For example, only certain molecules including phosphates, sulfates, nitrates,
carbonates, hydroxides, and metal oxides can be detected in the VNIR range.
The overall amount of a specific measurable component will directly affect the spectral
signal resultant from that component. Varying quantities of a specific component over a series
of samples can be inferred through comparison of the relative strength of that components signal
in the resultant spectral curves (Clark 1999). However, if the proportion of that component is
below the detection limit or resolution of an instrument, the signal will not appear in the resultant
spectral curve even though that component is present in the sample.
Even with such complication in mind, the rapid, inexpensive, and nondestructive nature
of VNIRS make it an ideal method for the identification (and relative quantification) of specific
components within a substance. Furthermore, the above mentioned complications can often be
accounted for by simply targeting a component that is resolvable within a known spectral range
and having recognizable spectral signal, and by using an instrument with a low detection limit.
The proportion of light that is reflected at the surface or within the subsurface of a
medium depends upon the ability of the specific components of that medium to absorb the

59
incident or scattered photons. Therefore, in order to understand how reflectance spectra are
generated, the processes that lead to the absorption of photons must be discussed.
3.4.2 Absorption processes
The absorption of photons occurs according to Beers Law:
Iobserved = Ioe−kx
where Iobserved is the intensity of light observed, Io is the original light intensity, k is the
absorption coefficient (cm-1), and x is the distance traveled through the medium (cm). The
absorption coefficient is unique for each wavelength and measurable component. The larger the
absorption coefficient, the more likely a photon will be absorbed leading to a smaller intensity of
light observed (reflected). This absorption of photons is a result of electronic and vibrational
processes at the molecular level (Hunt 1977; Clark 1999).
3.4.2.1 Electronic processes
Electronic processes involve the transition of an atom or ion’s energy state as a result of
photon absorption or emission. All molecular species have a unique set of energy states. The
lowest state of energy of each electron is known as its ground state. If a photon having the exact
energy needed to allow for the transition of an electron from ground state to an excited state
interacts with the molecule, absorption occurs. The excited molecule rapidly returns to its ground
state emitting a photon, usually of a different wavelength. The absorption of a photon increases
the energy state, while the emission decreases the energy state.
Commonly, transition elements (such as Iron) within the medium are responsible for a
spectral signature resulting from electronic processes (Hunt 1977). Transition elements are those

60
with an incomplete d-orbital. Transition elements as isolated ions require the same amount of
energy for the transition of the electrons to higher energy levels. Within a crystal field, however,
the interaction of such ions with ligands (electron donators) results in unique energy needs for
each unique crystal. This is known as the crystal field effect. The incomplete d-orbital of a
transition element results in a positive charge and thereby attracts negatively charged ligands
when forming crystal structures. The repulsion resulting from the interaction of the ligand
electrons and the specifically aligned d-orbital electrons of the transition element produces an
energy misbalance in the d-orbital, effectively splitting the energy of that orbital. The energy
required for electrons to transition to the now separate d-orbitals is influenced by several factors
(i.e. valence state, coordination number, symmetry, type of ligand formed and its distance from
the metal, etc.), thereby, the absorption pattern for each unique crystal varies allowing for
specific mineral identification via spectroscopy. Absorption bands resulting from the crystal
field effect are typically found in the 900-1200 nm wavelength range (Hunt 1977; Clark 1999).
Absorption bands also result from charge transfers between ions. During charge transfers
the photon causes an electron in its excited state to transfer from one ion to another ion or ligand.
The absorption bands resulting from charge transfers are usually of much greater magnitude than
absorption bands resulting from crystal field effects, and can be found in the 1-550 nm
wavelength range (Hunt 1977; Clark 1999).
Although uncommon, some materials exhibit spectral features resulting from lattice
defects in their crystal structures. These imperfections, or “color centers”, result in the creation
of discrete energy levels in which electrons can transition via specific photon energy. The
absorption bands caused by such color centers are found in visible spectrum (400-700 nm
61
wavelength) and result in the coloring of certain materials (e.g. the yellow, purple, and blue
coloring of fluorite).
3.4.2.2 Vibrational processes
Absorption due to vibrational processes arises when molecules and crystal lattices vibrate upon
interaction with specific light frequencies. These vibrations result from the bending and
stretching of the molecules of the crystal. The frequency of vibration is dependent on the bond
strength and mass associated with each element in the molecule or crystal structure, thereby
resulting in unique vibrational absorption bands for each molecular or crystal species. For a
molecule with N atoms, there are 3N-6 normal modes of vibration, known as fundamentals.
Vibrations involving multiples of the fundamentals or combinations of the fundamentals are
known as overtones and combinations, respectfully. Frequencies of these vibrations (ν) can be
related to a normal mode (ν1), the overtones (2ν1, 3ν1, etc), and the combinations (ν1+ν2, ν3-ν3,
etc.). Each successive overtone or combination vibration is 30 – 100 times weaker than its
former, resulting in a pattern of decreasing but complex absorption spectra for each molecule or
crystal structure. Absorption spectra resulting from vibrational processes will only result from
molecules showing dipole moments and will only reside in the infrared spectrum. For instance,
water has three fundamental vibrations (N=3, 3N-3=6). The symmetric OH stretch (ν1) occurs at
2738 nm, the H-O-H bend (ν2) occurs at 6270 nm, and the asymmetric OH stretch (ν3) occurs at
2903 nm (Clark 1999). Mineral groups that display spectral features from vibrational processes
are silicates, carbonates, hydroxyls, phosphates, sulphates, and nitrates.
62
3.4.3 VNIRS analysis
Reflectance measurements over a range of 350-2500 nm are collected using an Analytical
Spectral Devices, Inc. (Boulder, Colorado) LabSpec® Pro spectroradiometer. The LabSpec Pro
combines three photodiode detectors (VNIR, SWIR, SWIR2), a polychromatic quartz tungsten
halogen light source (3000°K), and a fiber optic cable and probe to produce a continuous spectral
reading over the 350 – 2500 nm range. It has sampling intervals of 1.4 nm for the 350-1000 nm
range and 2 nm for the 1000 – 2500 nm range and a sample resolution (full-width-half-
maximum) of 3 nm for the 350 – 1000 nm range, and 10 nm for the 1000 – 2500 nm range.
A fiber-optic cable connects the polychromatic tungsten light source (quartz halogen,
3000°K) to the sampling probe mounted above an adjustable stage. Freeze-dried and
homogenized sediment samples in transparent whirlpak sampling bags are brought into full
contact with the sampling probe with the adjustable stage for each spectral measurement in order
to reduce vibrational and handling affects. The spectroradiometer averages 200 full spectral
measurements per sediment sample over an integrations time of ~20 seconds to increase the
signal-to-noise ratio. The spectroradiometer is calibrated through measurement of a white
reflectance panel between each successive sediment sample measurement. Reflectance spectra
results are presented as percent reflectance through a simple conversion
(%R = (Rsample − Rblank /Rreflec tan ce − Rblank ) ×100).
Spectral data post processing is completed in order to adjust for inherent spectral errors
resulting from the analytical procedure. Because the LabSpec® Pro spectroradiometer combines

63
Figure 3-3. Examples of detector offset corrections
three photodiode detectors (VNIR, SWIR, SWIR2) artificial reflectance peaks and slope offsets
are present at each detector boundary (986-987 nm, 1766-1767 nm) due to detector offsets. A
manual correction for these reflectance troughs and slope offset is accomplished by multiplying a
ratio value of each transition wavelength range (i.e. 986/987 nm) to the subsequent reflectance
values (Figure 3-3). Furthermore, artificial spectral features are created by the interaction of the
incident light upon the transparent whirlpak bags in which the sediments are contained. To
correct for these features, sediment samples from each lake core are measured five times in direct

64
contact with the probe and then five times within the whirlpak bag. Ratio of the packed to
unpacked sample spectra for each wavelength are then applied to each sediment sample in order
to resolve the true sediment-based spectra (Figure 3-3).
3.5 VNIR SPECTRAL PROPERTIES OF CHLOROPHYLL A AND
CHLOROPHYLL A DERIVATIVES
Chlorophyll a has a unique spectral pattern within the VNIR wavelength range with absorption
bands present at 430 and 662 nm (Mackinney 1941). These absorption patterns can be
differentiated from Chl b which absorbs light at 453 and 642 nm (Vincent 1997) (Figure 3-4a).
The removal of the cenral Mg2+ atom to form Pheophorbide a results in a slight shifting of the
main absorption bands peaks to 409 and 667 nm, having little to no effect on the overall
absorption pattern (Hendry et al. 1987)(Figure 3-4b). The further removal of the phytyl group
forming Pheophytin a and Chlorophyllide a similarly has little effect on the absorption spectra,
especially at the 662 nm location.

65
Figure 3-4. (a) Absorption patterns for Chl a and Chl b over the 400 – 700 nm range, (b) absorption patterns for Chl a and Pheophorbide a over the 400 – 700 nm range as modified from Hendry et al. (1987).
3.6 HISTORY OF THE USE OF SPECTROSCOPIC TECHNIQUES IN
SEDIMENTARY PIGMENT STUDIES
The use of reflectance spectroscopy as an interpretive tool in the study sediment sequences dates
back to the 1960’s when Chester and Elderfield (1966, 1968) employed infra-red reflectance
techniques to quantify the opal and carbonate content of marine sediments (Chester and
Elderfield 1966; Chester and Elderfield 1968). Since this onset of reflectance spectroscopy as a
sedimentary tool, studies have used the method for the determination of mineralogical

66
composition (Barranco et al. 1989; Deaton and Balsam 1991), carbonate content (Ortiz et al.
1999; Giosan et al. 2001; Ortiz et al. 2004), organic carbon content (Korsman et al. 1999; Rosen
2005), and pigment concentrations (Rein and Sirocko 2002; Stephens et al. 2003; Das et al.
2005; Wolfe et al. 2006) in sedimentary archives. Various instrumental designs have been
implemented with the goal of identifying the influence of specific sedimentary components on
the slope of the spectral curve. Unique absorption features have been diagnosed to a full suite of
sedimentary components including hematite, goethite, chlorite, illite, kaolite, organic matter, and
most recently chlorophyll a (Hunt 1977; Balsam and Deaton 1996; Das et al. 2005; Wolfe et al.
2006).
Das et al. (2005) and Wolfe et al. (2006) applied VNIRS to sediments from ultra-
oligotrphic, high altitude, cold climate lakes located in the mountains of Colorado and the plains
of Alberta. Das et al. (2005) applied VNIRS to 40 samples from five sediment cores from as
many lakes. Four of the lakes are located in Rocky Mountain National Park, with the fifth
targeted lake being located 80 km northwest of the park as a means to validate the observations
of the other four lakes. The cores were between .22 – .4 m long and were dated using 210Pb
methods. All sediment cores spanned the pre and post-1950 year A.D. time period. Sediment
samples ranging from 0.1-0.2 g dry mass were freeze-dried, homogenized, and sieved at 125 μm.
Reflectance spectra measurements over the 350-2500 nm range were completed using a
Analytical Spectral Devices, Inc. (Boulder, Colorado) FieldSpec® Pro spectroradiometer.
Reflectance measurements were standardized using a white reference panel between each
successive measurement and all values were converted to percent reflectance (R =
Rsample/Rreference*100). Sedimentary pigments were quantified on the 23 sediment samples from
67
the Rocky Mountain National Park lakes using an RP-HPLC technique summarized elsewhere
(Vinebrooke et al. 2002) and results were reported in mg pigment * g-1 OM.
Das et al. (2005) reported a ubiquitous reflectance trough feature in all derived spectra
centered at ~675 nm attributed to the presence of chlorophylls. As a validation of this
assumption, an organic extraction of Chl a and CDP was completed and VNIRS analysis was
reapplied to the sediment residual. The VNIRS results produced no definable trough feature in
the 675 nm range, validating it as a Chl a and CDP produced feature. Das et al. (2005) derived a
series of spectral indices to interpret the reflectance trough feature centered at ~675 nm. The
spectral indices include amplitude shifts between 645-675 and 675-750 nm, ratios of R between
those wavelengths (R645/R675, R675/R750), first derivatives of R at 675 nm, and the area of the
reflectance curve under a straight light between R600 and R760. A liner regression was performed
on each of the spectral indices and various HPLC-derived pigment concentration combinations
including Chl a + Chl a’, pheophytin a + pheophorbide a, and Chl a + Chl a’ + pheophytin a +
pheophorbide a (Chl a + CDP). Only the first derivatives of R at 675 nm and the amplitude
shifts between 645-675 nm failed to produce significant correlations (P < 0.05) and correlation
coefficients ranged from 0.63 – 0.94. The highest correlations were found between the HPLC-
derived concentration combinations and the reflectance trough area between 600-760 nm (Chl a
+ Chl a’, r2 =0.84; pheophytin a + pheophorbide a, r2=0.94; Chl a + CDP, r2=0.92).
Chl a + CDP was designated as the most inclusive combination of pigments, and VNIRS-
inferred Chl a + CDP concentrations were determined using a best fit line between the HPLC-
derived Chl a + CDP concentrations and the VNIRS-derived reflectance trough area between
600-760 nm (Chl a + CDP = 0.218* reflectance trough area between 600-760 nm – 0.003). A
linear regression between the HPLC-determined Chl a + CDP concentrations and the VNIRS-
68
inferred Chl a + CDP concentrations demonstrated a clustering of data around the 1:1 line at
pigment concentrations <0.3 mg g-1 OM . Furthermore, stratigraphic plots of the HPLC-
determined Chl a + CDP concentrations and the VNIRS-inferred Chl a + CDP concentrations
demonstrated an excellent reproduction by the VNIRS data of the downcore concentrations,
trends, and magnitudes of the actual pigment data for all four lakes.
The VNIRS-inferred Chl a + CDP method was then applied to the reflectance spectra of
the 17 samples from the fifth control lake outside Rocky Mountain National Park. The
paleolimnological record from the lake had been previously studied through diatom counts and
% organic C data. The reflectance-inferred Chl a + CDP concentrations correlated significantly
with other proxy data, and thereby accurately resolved the pre-determined paleoenvironmental
history of the lake, including a post-1950 yr A.D. spike in productivity. Das et al. (2005) thereby
confirmed the use of VNIRS as valid tool in paleoenvironmental reconstructions from Colorado
lakes’ sediments.
Wolfe et al. (2006) extended the work of Das et al. (2005) by measuring and quantifying
the Chl a and CDP concentrations using the VNIRS method to sediment samples pre-inoculated
with known quantities of algal material. Sediment samples from one of the Rocky Mountain
National Park lakes used by Das et al. (2005) were combined in known mass ratios (5:1, 10:1,
25:1, 50:1, 100:1, 250:1, 500:1, 750:1, and 1000:1) with a mixture of aquarium-reared algal
species of known concentration. VNIRS and RP-HPLC methods were applied to the sediment
samples, as described above. In the Wolfe et al. (2006) study however, HPLC- determined
pigment concentrations are reported in mg pigment * g-1 dry sediment mass. Furthermore, the
spectral indices chosen by Wolfe et al. (2006) to interpret the reflectance trough centered at 675
nm are modified from those employed by Das et al. (2005). Instead, Wolfe et al. (2006) chose

69
the following indices: the reflectance trough area between 650-700 and 650-750 nm, the first
derivative of R at 690 nm, the amplitude shifts between 650-675 and 675-750 nm, and the
650/675 and 700/675 nm R ratios.
The HPLC-determined total Chl a + CDP concentrations of the algal amended sediment
samples demonstrated a clear decrease in pigment concentrations with decreased algal
inoculation, as expected. VNIRS-determined spectra for such samples similarly registered an
increase in magnitude of the reflectance trough centered at ~675 nm with increased algal
inoculation mass.
A direct linear regression was employed between the spectral indices and the three
combinations of pigment concentrations (Chl a + Chl a’, pheophytin a + pheophorbide a, Chl a
+ CDP) in the algal amended sediments. Similar to Das et al. (2005), Wolfe et al. (2006) found
the high correlations between the reflectance trough area between 650-700 nm and both the
known mass of algal material added to samples (r2=0.96) and HPLC-determined Chl a + CDP
concentrations (r2=0.98). Based on these high correlations, a regression equation was applied to
the VNIRS data to infer Chl a + CDP concentrations (Chl a + CDP = 0.0034 * reflectance trough
area between 650-700 nm + 0.0321).
The VNIRS method and regression equation was then applied to 18 sediment samples
from a large, productive, prarie lake in east-central Alberta (Lac La Biche) in order to reconstruct
concentrations of Chl a+ CDP. The down-core concentrations of VNIRS-inferred Chl a + CDP
concentrations were compared to HPLC-derived Chl a + CDP concentrations and produced a
high correlation (r2=0.79, P <0.01). The VNIRS-inferred Chl a+ CDP concentrations, however,
consistently over-estimated the HPLC-derived Chl a + CDP concentrations. Wolfe et al. (2006)
suggests such over estimations may be attributed to trace interference of Chl b or Chl c in the

70
VNIRS results. Even so, the VNIRS-inferred Chl a + CDP concentrations accurately resolve the
HPLC-derived Chl a + CDP concentrations in both magnitude and direction of trends down-
core, further validating the use of the VNIRS method as a paleo Chl a + CDP concentration
indicator in lake sediments.
71
4.0 USE OF DIFFUSE REFLECTANCE SPECTROSCOPY AS A QUALITATIVE
INDICATOR OF PALEOPIGMENT CONCENTRATIONS IN THE LAKE SEDIMENTS
OF NORTHERN MONGOLIA
4.1 INTRODUCTION
The presence of chlorophyll a (Chl a), a Chl a isomer (Chl a), and Chl a degradation products
(pheophytin a, pheophorbide a), the latter two commonly referred to as CDP, in natural waters
produces a ubiquitous absorption feature in the visible-near infrared red portion of the
electromagnetic spectrum (660-720 nm), with variations in the concentrations of Chl a and CDP
having a proportional affect on the relative magnitude of the feature (Gitelson 1992; Schalles et
al. 1998; Gitelson et al. 1999). Recent studies have resolved and correlated this absorption
feature to analytically-derived CDP and Chl a concentrations in sediment profiles using visible
near infrared diffuse reflectance spectroscopy (VNIRS) (Das et al. 2005; Wolfe et al. 2006),
suggesting the potential of VNIRS as a rapid, inexpensive, and nondestructive method of total
CDP and Chl a determination in lake sediments.
In this study, we apply the techniques presented by Das et al (2005) and Wolfe et al
(2006) to sediment profiles from two lake sites located in the Baroon Taiga Mountains of
northern Mongolia. The first goal of this experiment is to test the utility of the VNIRS method to
determine CDP and Chl a concentrations in Baroon Taiga Mountain lake sediment. This test is
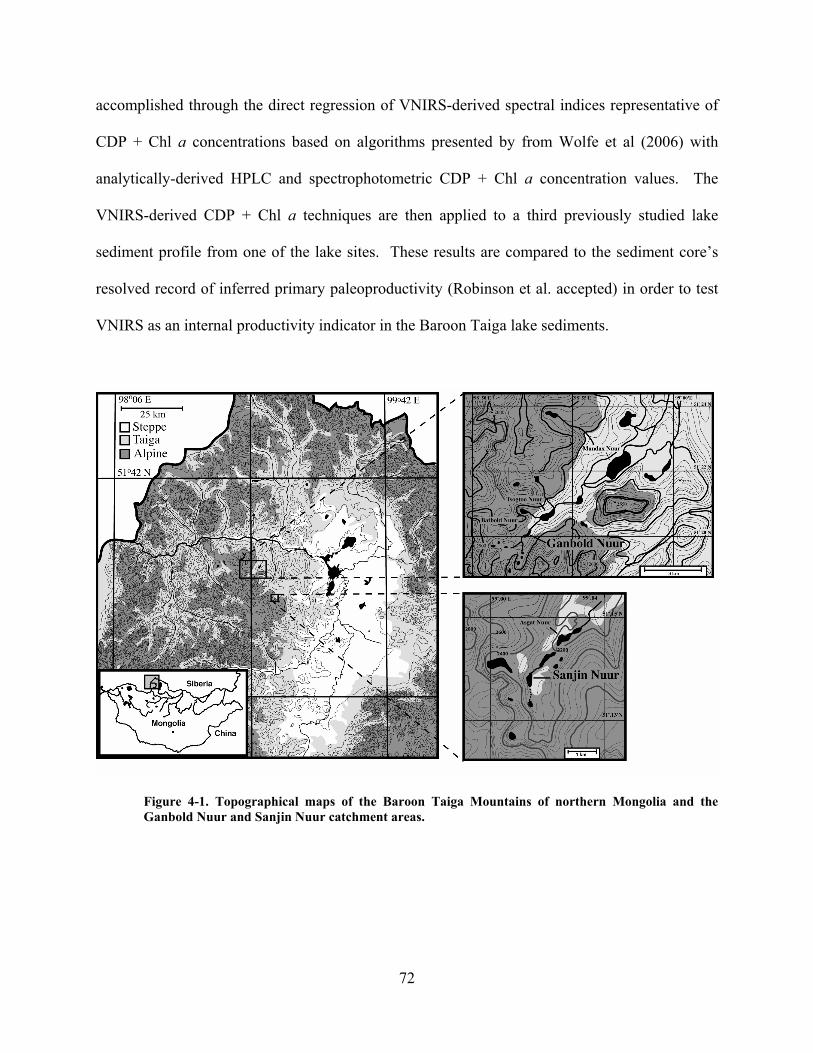
72
accomplished through the direct regression of VNIRS-derived spectral indices representative of
CDP + Chl a concentrations based on algorithms presented by from Wolfe et al (2006) with
analytically-derived HPLC and spectrophotometric CDP + Chl a concentration values. The
VNIRS-derived CDP + Chl a techniques are then applied to a third previously studied lake
sediment profile from one of the lake sites. These results are compared to the sediment core’s
resolved record of inferred primary paleoproductivity (Robinson et al. accepted) in order to test
VNIRS as an internal productivity indicator in the Baroon Taiga lake sediments.
Figure 4-1. Topographical maps of the Baroon Taiga Mountains of northern Mongolia and the Ganbold Nuur and Sanjin Nuur catchment areas.
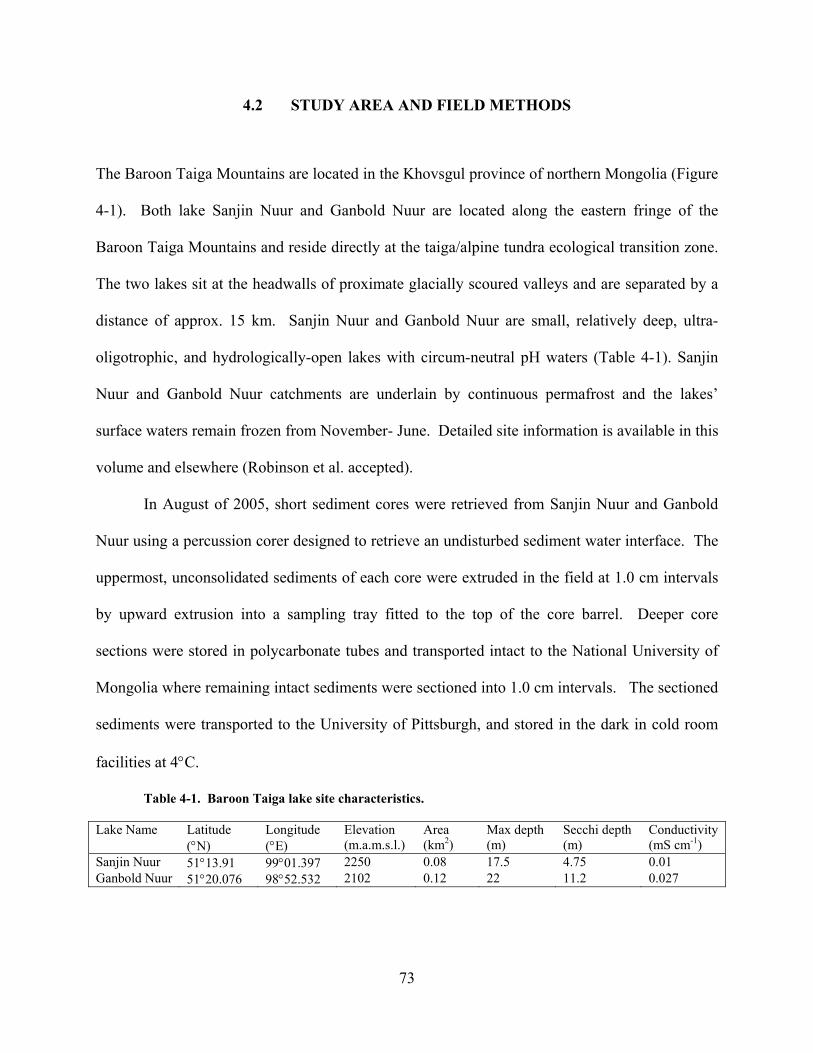
73
4.2 STUDY AREA AND FIELD METHODS
The Baroon Taiga Mountains are located in the Khovsgul province of northern Mongolia (Figure
4-1). Both lake Sanjin Nuur and Ganbold Nuur are located along the eastern fringe of the
Baroon Taiga Mountains and reside directly at the taiga/alpine tundra ecological transition zone.
The two lakes sit at the headwalls of proximate glacially scoured valleys and are separated by a
distance of approx. 15 km. Sanjin Nuur and Ganbold Nuur are small, relatively deep, ultra-
oligotrophic, and hydrologically-open lakes with circum-neutral pH waters (Table 4-1). Sanjin
Nuur and Ganbold Nuur catchments are underlain by continuous permafrost and the lakes’
surface waters remain frozen from November- June. Detailed site information is available in this
volume and elsewhere (Robinson et al. accepted).
In August of 2005, short sediment cores were retrieved from Sanjin Nuur and Ganbold
Nuur using a percussion corer designed to retrieve an undisturbed sediment water interface. The
uppermost, unconsolidated sediments of each core were extruded in the field at 1.0 cm intervals
by upward extrusion into a sampling tray fitted to the top of the core barrel. Deeper core
sections were stored in polycarbonate tubes and transported intact to the National University of
Mongolia where remaining intact sediments were sectioned into 1.0 cm intervals. The sectioned
sediments were transported to the University of Pittsburgh, and stored in the dark in cold room
facilities at 4°C.
Table 4-1. Baroon Taiga lake site characteristics.
Lake Name Latitude (°N)
Longitude (°E)
Elevation (m.a.m.s.l.)
Area (km2)
Max depth (m)
Secchi depth (m)
Conductivity (mS cm-1)
Sanjin Nuur 51°13.91 99°01.397 2250 0.08 17.5 4.75 0.01 Ganbold Nuur 51°20.076 98°52.532 2102 0.12 22 11.2 0.027
74
4.3 METHODS
Reflectance measurements over a range of 350-2500 nm were collected using an Analytical
Spectral Devices, Inc. (Boulder, Colorado) LabSpec® Pro spectroradiometer at Kent State
University. The 350-986 nm range was measured using a 512-channel Si photodiode array
detector at a sampling interval of 1.4 nm and a sampling resolution of 3 nm. A fiber-optic cable
connected the polychromatic tungsten light source (quartz halogen, 3000°K) to the sampling
probe mounted above an adjustable stage. Freeze-dried and homogenized sediment samples in
transparent whirlpak sampling bags were brought into full contact with the sampling probe with
the adjustable stage for each spectral measurement in order to reduce vibrational and handling
affects. Whirlpak correction values were determined per wavelength through a ratio of unpacked
to packed sample measurements. The spectroradiometer averaged 200 full spectral
measurements per sediment sample at a time of ~20 seconds to increase the signal-to-noise ratio.
The spectroradiometer was calibrated through measurement of a white reflectance panel between
each successive sediment sample measurement. Reflectance spectra results are presented as
percent reflectance through a simple conversion (%R = (Rsample − Rblank /Rreflec tan ce − Rblank ) ×100).
Percent reflectance values were then converted to indices of CDP + Chl a concentrations using
algorithms presented by Wolfe et al (2006).
Pigment quantifications were measured by high performance liquid chromatography was
completed at the University of Regina following methods described in detail elsewhere (Leavitt
et al. 1989; Vinebrooke and Leavitt 1999; Leavitt and Hodgson 2001). Briefly, following freeze-
drying (<0.1 Pa), ~0.1mg sample aliquots were added to a 10.0 ml degassed mixture of acetone:
methanol: water (80:15:5, by volume). Samples were flushed with N2 and stored in the dark at -

75
20ºC for 12 hours. Extracts were filtered through 0.2 μm pore chemically resistant membrane
filters, dried, and stored at –20°C under inert atmospheric conditions. Extracted pigments were
removed from the filters with an acetone: methanol solution. Solutions were completely
evaporated under N2 in a dark, room temperature environment, leaving a dried pigment residual.
Dried pigments were dissolved into a known volume of 70% acetone: 25% ion pairing reagent
(0.75 g tetrabutyl ammonium acetate and 7.7 g ammonium acetate in 100 ml HPLC-grade
water): 5% methanol solvent with 3.2 mg L-1 Sudan II (Sigma). Sudan II is an internal standard
with carotenoid-like absorption characteristics (λmax = 485, 442.5 nm in acetone) and runs at a
known position on the chromatogram (7.3 min) (Leavitt and Findlay 1994).
Reversed-phase high performance liquid chromatography of pigment extracts was
quantified as a binary solvent system as outlined in Mantoura and Llewellyn (1983) and
modified by Leavitt and Hogdson (2001) using a Hewlett-Packard model 1050 system, a Rainin
Model 200 Microsorb C-18 column (5μm particle size; 10 cm length), an Hewlett-Packard
model 1050 scanning photodiode array spectrophotometer (435 nm detection wavelength), and
an Hewlett-Packard fluorescence detector (435 nm excitation wavelength, 667 nm detection
wavelength). Pigment separation was achieved by delivery of mobile phase A (10% ion-pairing
reagent in methanol) for 1.5 min, a linear succession to mobile phase B (27% acetone in
methanol) over 7 min, with a 100% mobile phase B delivery for 12.5 min. Samples were
scanned at 660 nm and 430 nm. Between all samples, the column was re-equilibrated by a linear
succession to 100% mobile phase A over 3 min. followed by an isocratic hold for 12.5 min.
before sample re-injection. Pigments were identified through comparison of spectrophotometric
data to United States Environmental Protection Agency standards and standards of known
pigment concentrations. Pigments are expressed as mg g-1 dry sediment mass for optimal

76
comparison to spectral signals (Wolfe et al. 2006). Total Chl a, Chl a’, and pheophytin a
concentrations were combined to represent total CDP + Chl a concentrations.
Pigment quantifications were measured by spectrophotometry was completed at the
University if South Florida following the methods outlined elsewhere (Swain 1985; Riedinger-
Whitmore et al. 2005). Briefly, pigments were extracted from 8-10 mg of wet sediment using
two 40-ml and one 20-ml aliquots (100 ml total) of 90% acetone. Each aliquot was added to the
sediment in a 125 ml polypropylene bottle and shaken for 15 min at room temperature.
Following separation via centrifuge for 20 min, the acetone extracts were collected in pipettes
and measured at 665 nm using a Hitachi U-2000 spectrophotometer before and after acidification
with HCl to convert undegraded Chl a to CDP. Here, we report the average of three
measurements for each sample. All measurements were corrected for turbidity by an absorbance
reading at 750 nm. Spectrophotometry measurements are presented as total absorbance at 650
nm (before and after acidification) g-1 dry sediment mass. Organic matter concentrations were
determined at a 1.0 cm interval following standard LOI techniques (Dean 1974).
4.4 RESULTS
All resultant spectra for SAN-A-6-VIII-05 samples display reflection troughs centered at ~665
nm as dominant features within the 450-900 nm range (Figure 4-2a,b). The resultant spectra for
GAN-B-10-VIII-05 samples display less consistency in the magnitude of the reflectance troughs
centered at 665 nm, although the feature remains dominant in the 450-900 nm range in some
samples (Figure 4-2c,d). Application of the Wolfe et al (2006) algorithms to the

77
Figure 4-2. Visible near-infrared reflectance spectra for the sediments from core SAN-A-6-VIII-05 over the (a) 450-900 nm and (b) 600-750 nm spectral range, and from core GAN-B-10-VIII-05 over the (c) 450-900 nm and (d) 600-750 nm spectral range.
VNIRS data produced various results (table 4-2). The dimensionless trough area indices were
determined following the equation presented by Wolfe et al (2006):
Trough area = [{%Rλ1* (λ2 − λ1)}+ {[(%Rλ2
−%Rλ1) * (λ2 − λ1)]/2}]− %Rλ1−λ2
n=1
x
∑ .
HPLC analyses of SAN-A-6-VIII-05 and GAN-B-10-VIII-05 sediments provided
quantified concentrations of Chl a, Chl a’, and pheophytin a pigments, with the great majority
being pheophytin a. On average, pheophytin a represents 74% and 78% of the total measured
CDP and Chl a concentrations for SAN-A-6-VIII-05 and GAN-B-10-VIII-05, respectfully.
Actual Chl a concentrations represent on average only 16% and 14% for SAN-A-6- VIII-05

78
Table 4-2. Spectral index data for SAN-A-6-VIII-05 and GAN-B-10-VIII-05 sediments based on algorithms presented by Das et al (2005) and Wolfe et al (2006).
Core Depth (cm)
Amplitude of ΔR (650-675nm)
Amplitude of ΔR (675-750nm)
Ratio of R (650/675nm)
Trough area 650-700nm
Trough area 650-750nm
SAN-A-6-VIII-05 2 0.05 10.68 99.26 10.54 71.32 3 0.33 10.01 98.78 7.07 61.38 7 1.14 6.42 95.95 -18.69 -13.17 9 1.37 6.53 97.99 -2.05 33.73 13 0.33 8.98 99.02 6.66 62.56 16 0.51 8.54 98.53 1.80 46.96 24 0.38 8.90 98.73 2.53 50.89 26 0.44 8.47 99.03 5.20 60.93 34 0.16 9.01 99.36 10.44 76.32 36 0.27 9.10 99.36 8.36 69.08 38 0.26 9.07 99.36 7.61 69.53 44 0.32 8.65 99.01 4.97 62.80 47 0.34 8.51 98.80 -0.02 51.85 56 0.48 7.63 98.41 -1.73 46.73 57 0.55 8.10 98.62 -0.46 49.91 62 0.23 9.27 99.59 10.79 77.51 63 0.14 9.26 99.72 14.37 85.77 66 0.38 8.17 99.01 3.92 58.43 68 0.26 8.85 99.46 5.49 64.35 71 0.21 9.41 100.03 9.52 90.36 73 -0.08 9.23 100.06 9.10 95.69 78 0.08 9.45 99.72 2.57 77.25 81 0.19 8.89 99.33 2.10 69.45 86 0.20 9.05 99.21 1.01 71.36 91 0.25 9.13 99.66 5.56 93.47 93 0.15 9.38 99.46 6.53 85.07 101 0.35 8.81 99.16 7.43 73.76 102 0.28 9.23 99.11 6.07 68.67
GAN-B-10-VIII-05 1 1.13 8.74 97.07 -10.82 17.14 4 1.81 5.91 95.70 -37.48 -44.16 13 1.62 6.55 95.98 -29.85 -27.49 27 0.07 9.76 99.80 13.93 75.04 54 1.35 4.76 96.73 -36.84 -34.15 60 -0.34 10.36 100.96 22.76 91.65 66 1.26 5.79 96.52 -24.13 -17.75 78 0.08 11.79 99.78 23.74 86.97 87 0.92 8.85 97.49 -5.68 28.92
and GAN-B-10-VIII-05, respectfully, with the remaining percentage being the stereo isomer.
Total CDP and Chl a concentrations range from 0.54 – 0.10 mg g-1 dry sediment mass in the
SAN-A-6-VIII-05 sediments (mean = 0.39, SD = 0.1, n = 20; Table 4-3). Variability is much

79
higher in GAN-B-10-VIII-05 sediments, with total CDP and Chl a concentrations ranging from
0.66 – 0.04 mg g-1 dry sediment weight (mean = 0.26, SD = 0.24, n=10).
Table 4-3. Total determined CDP + Chl a concentrations for SAN-A-6-VIII-05 and GAN-B-10-VIII-05 sediments from HPLC and spectrophotometric analyses.
CDP + Chl a via HPLC CDP + Chl a via Spectrophotometry
Core Depth (cm) (mg g-1 dry sediment mass) (total ABS 665 nm g-1 dry sediment mass)
SAN-A-6-VIII-05 2 0.42 0.757 3 -- 0.774 7 0.10 0.226 9 0.28 13 0.38 0.768 16 0.24 0.714 24 0.36 0.654 26 -- 0.690 34 0.47 0.706 36 -- 0.717 38 0.47 44 -- 47 0.46 0.661 56 0.32 0.579 57 -- 62 0.40 0.760 63 0.54 0.778 66 0.37 0.672 68 0.42 71 0.42 0.752 73 0.49 0.789 78 0.40 81 -- 0.681 86 0.33 0.681 91 0.42 93 -- 0.818 101 -- 0.675 102 0.43
GAN-B-10-VIII-05 1 0.09 0.229 4 0.07 0.047 13 0.06 0.084 27 0.36 1.001 54 0.04 0.051 60 0.66 1.134 66 0.06 0.095 78 0.43 1.053 87 0.27 0.835

80
Undegraded CDP concentrations, as measured from spectrophotometry, constitute, on
average, 91% and 88% of total measured CDO and Chl a concentrations for SAN-A-6-VIII-05
and GAN-B-10-VIII-05, respectfully. Total spectrophotometric inferred- CDP + Chl a values
for SAN-A-6-VIII-05 ranged from 0.675 –0.757 ABS g-1 dry sediment weight (mean = 0.693,
SD = 0.124, n = 20; Table 4-3). As with the HPLC data, the variability of the total
spectrophotometric CDP and Chl a values in GAN-B-10-VIII-05 is greater, with values ranging
from 0.047 – 1.134 ABS g-1 dry sediment weight (mean = 0.503, SD = 0.486, n =9).
Correlation coefficients for linear regressions between reflectance-based indices of CDP
+ Chl a and corresponding HPLC and spectrophotometrically derived values of CDP + Chl a are
summarized in table 4-4. All six spectral indices produce highly significant correlations to the
HPLC and spectrophotometry-determined CDP + Chl a concentrations. Following the method
of Wolfe et al (2006), we focus on the spectral index measuring the area of the reflectance trough
between 650 – 700 nm as it provides the most consistently high correlation coefficients (Figure
4-3).
Table 4-4. Correlation coefficients (r2) from linear regressions between spectral indices and total determined CDP + Chl a concentrations for SAN-A-6-VIII-05 (n = 20) and GAN-B-10-VIII-05 sediments (n = 9) from HPLC and spectrophotometric analyses (*P<0.0001, **P<0.001, ***P<0.01).
CDP + Chl a via HPLC CDP + Chl a via Spectrophotometry
(mg g-1 dry sediment mass) Total ABS 665 nm g-1 dry sediment mass
Spectral Index SAN-A-6-VIII-05 GAN-B-10-VIII-05 SAN-A-6-VIII-05 GAN-B-10-VIII-05 Amplitude of ΔR (650-675nm) 0.77* 0.89** 0.82* 0.88** Amplitude of ΔR (675-750nm) 0.72* 0.70*** 0.82* 0.82** Ratio of R (650/675nm) 0.76* 0.91** 0.82* 0.87** Trough area 600-700nm 0.71* 0.81** 0.62* 0.91* Trough area 650-700nm 0.82* 0.85** 0.82* 0.91* Trough area 650-750nm 0.76* 0.85** 0.80* 0.92*
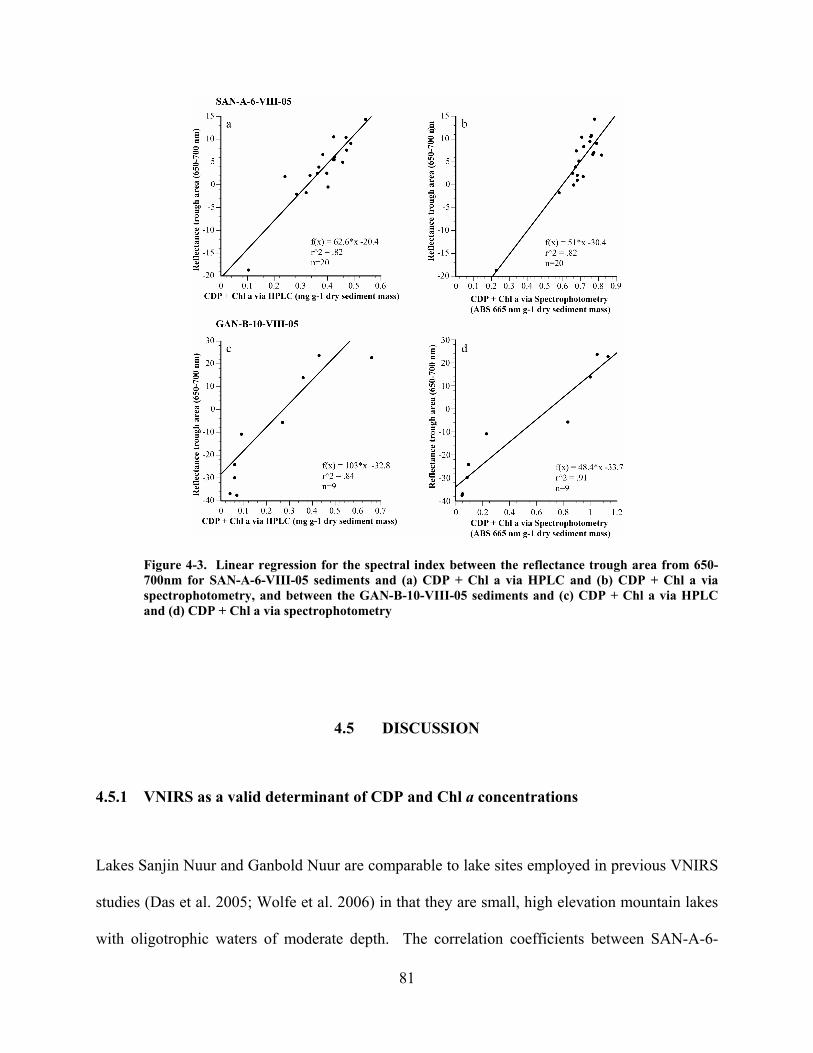
81
Figure 4-3. Linear regression for the spectral index between the reflectance trough area from 650-700nm for SAN-A-6-VIII-05 sediments and (a) CDP + Chl a via HPLC and (b) CDP + Chl a via spectrophotometry, and between the GAN-B-10-VIII-05 sediments and (c) CDP + Chl a via HPLC and (d) CDP + Chl a via spectrophotometry
4.5 DISCUSSION
4.5.1 VNIRS as a valid determinant of CDP and Chl a concentrations
Lakes Sanjin Nuur and Ganbold Nuur are comparable to lake sites employed in previous VNIRS
studies (Das et al. 2005; Wolfe et al. 2006) in that they are small, high elevation mountain lakes
with oligotrophic waters of moderate depth. The correlation coefficients between SAN-A-6-

82
VIII-05 and GAN-B-10-VIII-05 spectral indices and analytically-determined pigment
concentrations however, are notably lower than those reported in such previous studies (Wolfe et
al. 2006). These discrepancies are likely artifacts of the long-term (> 3 months) storage of the
sediment cores at room temperatures while in Mongolia due a lack of cold room facilities. It is
similarly noted that a linear regression between determined CDP + Chl a concentrations from
paired HPLC and spectrophotometric analyses provides a less significant correlation (r2 =0.79,
n=23, P<0.0001). This discrepancy may be sourced to the lack of measured pheophorbide a
concentrations in the HPLC results, while it is a likely component of the total measured CDP
concentrations from the spectrophotometric analyses. Given these inherent sources of error
however, the results of this study are highly acceptable. The VNIRS-inferred CDP + Chl a
indices accurately resolve the magnitude and direction of analytically determined CDP + Chl a
trends throughout the sediment profiles (Figure 4-4), demonstrating the utility of VNIRS as a
quantitative proxy for paleo- CDP + Chl a concentrations for the SAN-A-6-VIII-05 and GAN-B-
10-VII-05 sediments. Moreover, this study further validates the use of the VNIRS method as
means to determine CDP + Chl a concentrations in the sediment profiles of comparable lake
sites.

83
Figure 4-4. Downcore profiles of the reflectance trough area from 650-700nm spectral index and CDP + Chl a via HPLC and spectrophotometry for (a) SAN-A-6-VIII-05 and (b) GAN-B-10-VIII-05.
4.5.2 VNIRS as a valid indicator of paleoproductivity
A qualitative profile of CDP + Chl a concentrations was determined for a second previously
studied core (SN-B-03) from lake Sanjin Nuur through the application of the VNIRS method.
This VNIRS-inferred CDP + Chl a profile accurately resolves the previously determined
biogenic silica (BSi) and organic matter (OM)-inferred internal paleoproductivity profile for the
sediment core (Robinson et al. accepted)(Figure 4-5a). Discrepancies between the VNIR-
inferred CDP + Chl a profile and the BSi and OM profiles may be an artifact of slight intra-core

84
variability, as the analytical techniques were performed on separate samples from comparable
core depths. Significant pigment preservation issues with Sanjin Nuur can be ruled out, as such
degradation affects would independently influence BSi, OM, and CDP + Chl resulting in three
contrasting profiles. The agreement between the records demonstrates the validity of the
VNIRS-inferred CDP + Chl a method as qualitative indicator of down-core variations in internal
productivity within the sediments of Sanjin Nuur. This assertion is
Figure 4-5. (a) Comparison of the VNIRS-inferred CDP + Chl a profiles with inferred internal productivity profiles for cores (a) SN-B-03, (b) SAN-A-6-VIII-05, and (c) GAN-B-10-VIII-05.
further supported by the comparison of the VNIRS-inferred CDP + Chl a profile of core SAN-A-
6-VIII-05 to its % OM profile (Figure 4-5b). Although slight inconsistencies likely attributable

85
to intra-core variability similarly exist, a high correlation between the prominent trends and
features of the profiles persists.
The VNIRS method therefore provides an accurate inferred-paleoproductivity profile for
lake Sanjin Nuur. The comparison of the full VNIRS-inferred CDP + Chl a profile of the GAN-
B-10-VIII-05 sediment core to its % OM suggests similar conclusions (Figure 4-5c). Because
Ganbold Nuur is comparable to Sanjin Nuur in its physical characteristics and placement with
the catchment, it is assumed that the GAN-B-10-VIII-05 % OM profile is analogous to the Sanjin
Nuur OM profiles in that it is representative of internal productivity variations. Therefore, the
correlation between the core GAN-B-10-VIII-05 VNIRS-inferred CDP + Chl a and % OM
profiles demonstrates the potential of the VNIRS method as a paleoproductivity indicator in the
Ganbold Nuur lake system, and suggest its widespread usage throughout other Baroon Taiga
lakes.
4.6 CONCLUSIONS
The reflectance spectra of sediment samples from two lakes in the Baroon Taiga Mountains of
northern Mongolia display ubiquitous reflectance troughs of varying magnitude centered ~665
nm. The magnitude of this trough has been previously shown to correspond to sedimentary
concentrations of Chl a and CDP in comparable lake sites (Das et al. 2005; Wolfe et al. 2006).
Direct linear regression of spectral indices representative of the reflectance trough to
analytically-determined concentrations of CDP + Chl a from HPLC and spectrophotometric
analysis provides high and significant coefficients of correlation. Further comparison of the unit-
less spectral indices defining the reflectance trough area between 650 – 700 nm to the down-core

86
profiles of HPLC and spectrophotometric CDP + Chl a concentrations validates the VNIRS
method as a qualitative indicator of CDP + Chl a concentration throughout the sediment profiles.
Previous studies have resolved a BSi and OM-inferred paleoproductivity profile for
Sanjin Nuur sediment core SN-B-03 (Robinson et al. accepted). The application of the VNIRS
method to the SN-B-03 sediment samples provides a near-replicate profile, suggesting the utility
of the VNIRS method to qualitatively reconstruct Sanjin Nuur paleoproductivity profiles. This
assertion is supported by the agreement between the SAN-A-6-VIII-05 VNIRS- CDP + Chl a
profile and its % OM profile. A similar high correlation between the VNIRS-inferred CDP +
Chl a and the % OM profiles from a sediment profile from lake Ganbold Nuur enhances the
potential of the VNRIS method as a widespread qualitative paleoproductivity indicator in
sedimentary profiles from comparable sites, including surrounding Baroon Taiga lakes.

87
5.0 RECONSTRUCTION OF HOLOCENE LAKE PRODUCTIVITY AND
INFERRED CLIMATE HISTORIES FROM HIGH-ALTITUDE SITE IN THE BAROON
TAIGA MOUNTAINS, NORTHERN MONGOLIA, USING SPECTRAL
REFLECTANCE ANALYSES
5.1 INTRODUCTION
Climatic instability is highly relevant to modern Mongolia where a large percentage of the
population rely upon traditional agrarian practices. Recent warming trends and subsequent
reorganization of regional weather patterns have altered soil transpiration rates and precipitation
patterns (Miyazaki et al. 2004; Iwasaki 2006; Sato et al. 2007), resulting in increased pressure on
climate sensitive grazing areas (Gunin et al. 1999; Christensen et al. 2004). With global average
surface temperatures expected to increase by between 2 – 4.5°C over the next century (IPCC
2001), the fragile vegetation dynamics of the Mongolian steppe are likely to be further altered
having drastic impacts on the traditional lifestyles of the nomadic pastoralists and the overall
Mongolian economy (Bolortsetseg and Tuvaansuren 1996).
Despite evidence for high-sensitivity to recent warming in the Baroon Taiga Mountain
region of northern Mongolia (e.g. destabilization of regional permafrost, formation of
thermokarst lake systems) and expected degradation of continuous permafrost and large-scale
peat bog formation during the upcoming century (Bohner and Lehmkuhl 2005), any

88
understanding of the evolution of regional ecosystems in response to present and past climate
variations and the mechanisms that ultimately drive regional climate dynamics is highly limited.
Robinson et al. (accepted) asserted that rates of internal biological production in Baroon Taiga
Mountain lakes are mediated by light and nutrient availabilities as a function of external solar
forcing variations and growing-season temperature fluctuations. This hypothesis was supported
by linkages between a record of inferred lake productivity from diatom produced silica
concentrations, solar insolation (Lasker 1990), and regional temperature-sensitive tree-ring
indices (Jacoby et al. 1996; D'Arrigo et al. 2001) over the late-Holocene period. The existing
Baroon Taiga record, however, is limited to a single core from one lake and only extends to 2400
cal yr B.P., thereby any regional climatic inferences remain highly tenuous.
Recent studies in diffuse reflectance spectroscopy have provided high correlations
between concentrations of sedimentary chlorophyll a (Chl a), its degradation products (CDP),
and the magnitude of a ubiquitous sedimentary reflectance trough feature in the 650-700 nm
range (Das et al. 2005; Wolfe et al. 2006). Because Chl a deposition in lake sediments is largely
a product of autochthonous primary productivity (Sanger 1988; Leavitt 1993), the spectral index
defining the relative area of the reflectance trough from 650-700 nm (Rtrough) can be employed to
reconstruct a primary productivity history in a sediment profile, provided that selective
degradational affects are minimal throughout the sediment sequence. For example,
quantification of the relative variation in magnitude of this absorption feature has been
previously demonstrated to qualitatively resolve pre-existing inferred-productivity
reconstructions in Baroon Taiga lake sediment sequences (Robinson, chapter 4).
The objective of this of this study is to test the hypotheses of Robinson et al (accepted)
through the application of spectral reflectance methods outlined in Das et al (2005) and Wolfe et

89
al (2006) and standard LOI procedures (Dean 1974) to eight sediment cores retrieved from as
many lakes in the Baroon Taiga Mountains. The resultant intra-core records will be compared
through direct linear regression to assess the influence of selective preservation processes and,
thereby, the integrity of the inferred-productivity profiles. The sediment sequences with high
correlations between Rtrough and organic matter (OM) concentrations (i.e. reliable inferred-
productivity records) will be compared for the identification of inter-lake trends signifying
regional productivity variations. The records will then be compared to an orbital insolation
reconstruction (Lasker 1990), a Greenland ice core record (Stuiver et al. 1995; Stuvier et al.
1997), two regional temperature-inferred tree ring records (Jacoby et al. 1996; D'Arrigo et al.
2000; D'Arrigo et al. 2001), and a radionuclide production record (Reimer et al. 2004) to test the
assertion that orbital forcing and growing-season temperatures are driving internal productivity
rates in Baroon Taiga Mountain lakes.
5.2 STUDY AREA
All lakes presented in this study are located in two proximal valleys along the eastern fringe of
the Baroon Taiga Mountains, northern Mongolia (Figure 5-1). The lakes straddle the local tree-
line and the taiga/alpine tundra transition zone. The dominant vegetation of the region is
Siberian pine (Pinus sibirica), Siberian larch (Larix sibirica), shrub varieties within the
Betulaceae family, and several sedge and grass species. The soils are poorly developed with
frequently exposed rocky substrate (metamorphosed granite). Evidence for late Pleistocene
glaciation in the watersheds is provided by the presence of cirque and moraine complexes. The
region is underlain by continuous permafrost.
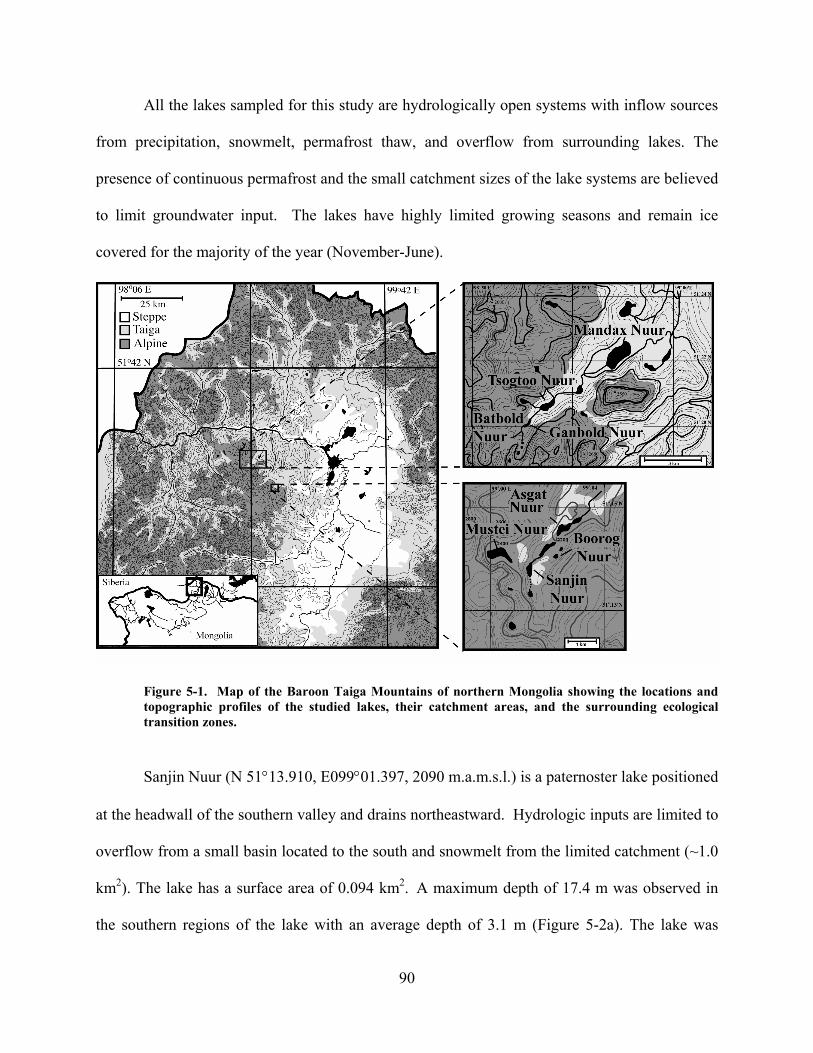
90
All the lakes sampled for this study are hydrologically open systems with inflow sources
from precipitation, snowmelt, permafrost thaw, and overflow from surrounding lakes. The
presence of continuous permafrost and the small catchment sizes of the lake systems are believed
to limit groundwater input. The lakes have highly limited growing seasons and remain ice
covered for the majority of the year (November-June).
Figure 5-1. Map of the Baroon Taiga Mountains of northern Mongolia showing the locations and topographic profiles of the studied lakes, their catchment areas, and the surrounding ecological transition zones.
Sanjin Nuur (N 51°13.910, E099°01.397, 2090 m.a.m.s.l.) is a paternoster lake positioned
at the headwall of the southern valley and drains northeastward. Hydrologic inputs are limited to
overflow from a small basin located to the south and snowmelt from the limited catchment (~1.0
km2). The lake has a surface area of 0.094 km2. A maximum depth of 17.4 m was observed in
the southern regions of the lake with an average depth of 3.1 m (Figure 5-2a). The lake was

91
thermally stratified with water temperatures varying from an air water interface value of 11.9°C
to a water-sediment interface value of 4.63°C. A clear thermocline was visible at 6.0-8.0 m
water depth. The dissolved oxygen profile displayed a slight positive heterograde profile with a
metalimnic oxygen maxima occurring at 6.5 m (7.99 mg L-1). The pH of the water was
circumneutral (7.75 – 6.87 pH) with a maximum value occurring at metalimnion. The lake water
was extremely fresh (SpC 0.01 mS cm-1, TDS 9 mg L-1) and transparent (Zsecchi = 4.75 m) (Table
5-1). Sanjin Nuur has been the focus of previous paleolimnological studies (Robinson et al.
accepted).
Mustei Nuur (N 51°14.354, E099°00.354, 2353 m.a.m.s.l.) is located to the west of
Sanjin Nuur in a cirque formation above local tree-line. The only hydrologic input is surface
runoff from its highly limited catchment. The lake has a surface area of 0.34 km2. A maximum
depth of 28.0 m was observed along the western shoreline (Figure 5-2b). The lake was thermally
stratified with water temperatures varying from 14.0°C at the surface waters to a bottom water
value of 5.09°. A clear thermocline was present at 6.0-8.0 m water depth. The water was
circumneutral (pH 7.08), extremely fresh (SpC 0.007 mS cm-1, TDS 7.0 mg L-1) and
exceptionally transparent (Zsecchi = 11.2 m) (Table 5-1).
Boorog Nuur (N51°14.263, E099°01.174, 2237 m.a.m.s.l.) is a small basin (surface area
= 0.01 km2) located northeast of Sanjin Nuur. The lake has no visible inputs and has a maximum
observed depth of 3.35 m. This lake was sampled in 2003, before hydrolab data collection had
begun.
Asgat Nuur (N51°14.755, E099°07.0053, 2200 m.a.m.s.l.) is located directly northeast of
Sanjin Nuur and is the terminal lake in the southern valley. Hydrologic inputs include direct
overflow from Sanjin Nuur and the lake drains to the north. Asgat Nuur has a surface area of
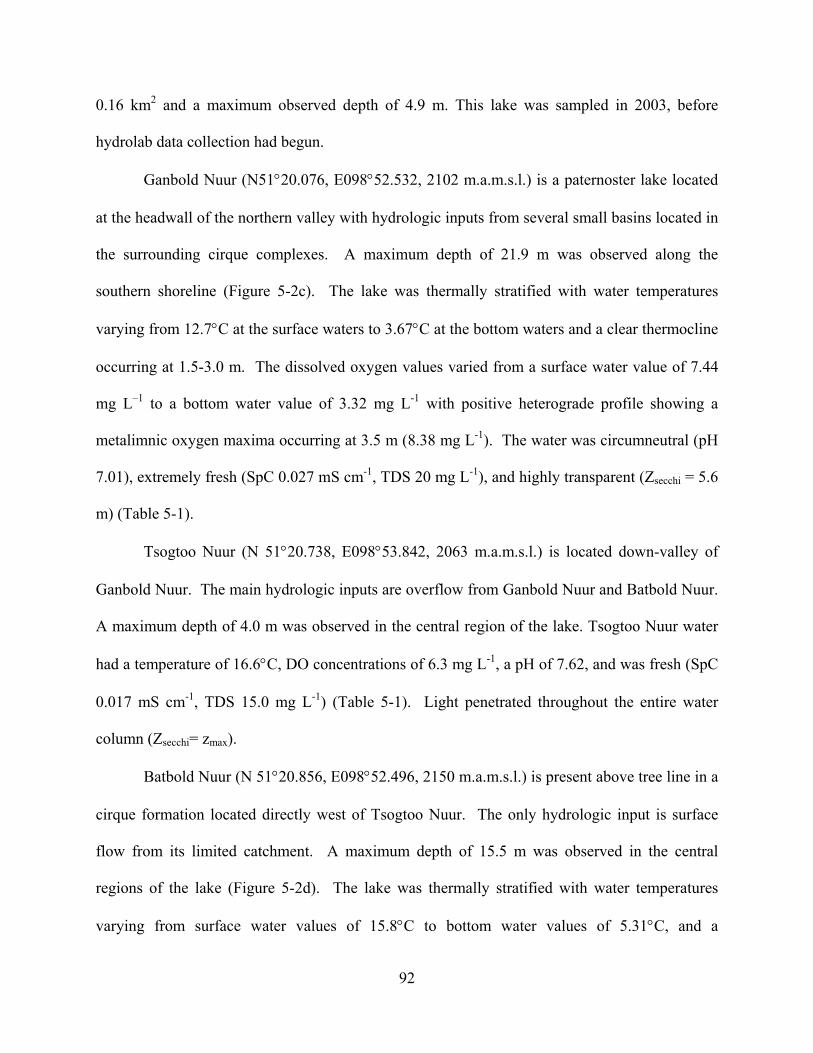
92
0.16 km2 and a maximum observed depth of 4.9 m. This lake was sampled in 2003, before
hydrolab data collection had begun.
Ganbold Nuur (N51°20.076, E098°52.532, 2102 m.a.m.s.l.) is a paternoster lake located
at the headwall of the northern valley with hydrologic inputs from several small basins located in
the surrounding cirque complexes. A maximum depth of 21.9 m was observed along the
southern shoreline (Figure 5-2c). The lake was thermally stratified with water temperatures
varying from 12.7°C at the surface waters to 3.67°C at the bottom waters and a clear thermocline
occurring at 1.5-3.0 m. The dissolved oxygen values varied from a surface water value of 7.44
mg L–1 to a bottom water value of 3.32 mg L-1 with positive heterograde profile showing a
metalimnic oxygen maxima occurring at 3.5 m (8.38 mg L-1). The water was circumneutral (pH
7.01), extremely fresh (SpC 0.027 mS cm-1, TDS 20 mg L-1), and highly transparent (Zsecchi = 5.6
m) (Table 5-1).
Tsogtoo Nuur (N 51°20.738, E098°53.842, 2063 m.a.m.s.l.) is located down-valley of
Ganbold Nuur. The main hydrologic inputs are overflow from Ganbold Nuur and Batbold Nuur.
A maximum depth of 4.0 m was observed in the central region of the lake. Tsogtoo Nuur water
had a temperature of 16.6°C, DO concentrations of 6.3 mg L-1, a pH of 7.62, and was fresh (SpC
0.017 mS cm-1, TDS 15.0 mg L-1) (Table 5-1). Light penetrated throughout the entire water
column (Zsecchi= zmax).
Batbold Nuur (N 51°20.856, E098°52.496, 2150 m.a.m.s.l.) is present above tree line in a
cirque formation located directly west of Tsogtoo Nuur. The only hydrologic input is surface
flow from its limited catchment. A maximum depth of 15.5 m was observed in the central
regions of the lake (Figure 5-2d). The lake was thermally stratified with water temperatures
varying from surface water values of 15.8°C to bottom water values of 5.31°C, and a

93
thermocline occurring from 5-7.0 m water depth. The D.O. profile exhibited an orthograde
profile with maximum values occurring at 7.5 m. The water had pH values varying from 8.4 –
6.6 with a maximum value at 5.0 m and was fresh (SpC 0.017 mS cm-1, TDS 14.0 mg L-1) (Table
5-1).
Mandax Nuur (N 51°22.323, E098°57.494, 1978 m.a.m.s.l) is the lowest and largest
(surface area = 1.35 km2) surveyed lake within the Baroon Taiga Mountains. A maximum depth
of 6.0 m was observed in the central region of the lake. Water temperatures ranged from 18.4°C
at surface waters to 10.4°C at bottom waters. Dissolved oxygen increased with depth from 6.16
– 7.11 mg L-1. The water had an average pH value of 7.0 and was fresh (SpC 0.019 mS cm-1,
TDS 16 mg L-1) (Table 5-1).
Table 5-1. General site characteristics for the studies lakes.
Lake Name
Latitude (°N)
Longitude (°E)
Elevation (m.a.m.s.l.)
Area (km2)
Max depth (m)
Secchi depth (m)
Conductivity (mS cm-1)
pH
Sanjin Nuur
51°13.91 99°01.397 2250 0.08 17.5 4.75 0.01 7.32
Mustei Nuur
51°14.354 99°00.354 2353 0.34 28.0 11.2 0.01 7.07
Boorog Nuur
51°14.263 99°02.174 2237 0.01 3.35 -- -- --
Asgat Nuur
51°14.755 99°02.162 2200 .16 4.9 -- -- --
Ganbold Nuur
51°20.076 98°52.532 2102 0.12 22.0 11.2 0.03 7.01
Batbold Nuur
51°20.856 98.57.496 2150 0.14 15.5 6.0 0.01 7.62
Tsogtoo Nuur
51°20.738 98°53.842 2063 1.35 4.0 4.0 0.02 7.47
Mandax Nuur
51°22.323 98°57.494 1977 0.38 6.0 6.0 0.02 7.49

94
5.3 FIELD METHODS
In June 2003 and August of 2005, eight short sediment cores of various lengths were collected
from the Baroon Taiga lakes (Table 5-2). Sediments were collected with a percussion corer
designed to retrieve an undisturbed sediment water interface. The uppermost, unconsolidated
sediments of each core were extruded in the field at 0.5 or 1.0 cm intervals by upward extrusion
into a sampling tray fitted to the top of the core barrel. Deeper core sections were stored in
polycarbonate tubes, and either transported intact to the University of Pittsburgh or to the
National University of Mongolia for sampling and ultimately stored in cold room facilities at
4°C. In 2005, Vertical profiles of temperature, dissolved oxygen, conductivity, and pH were
measured in August of 2005 with a Hydrolab Quanta G water quality sensor.
Table 5-2. Sediment core information.
Lake Core ID Latitude (°N) Longitude (°E) Water Depth (m)
Core length (cm)
Sanjin Nuur SAN-A-6-VIII-05 51°13.910 99°01.397 17.4 105.0 Mustei Nuur MUS-A-7-VIII-05 51°14.354 99°00.454 19.4 125.0 Boorog Nuur BN-A-03 51°14.263 99°02.174 3.35 91.0 Asgat Nuur AN-A-03 51°14.828 99°02.293 4.9 88.0 Ganbold Nuur GAN-B-10-VIII-05 51°20.062 98°52.510 18.5 112.0 Batbold Nuur BAT-A-9-VIII-05 51°20.856 98°52.496 12.0 121.0 Tsogtoo Nuur TSO-A-9-VIII-05 51°20.738 98°53.842 3.8 130.0 Mandax Nuur MAN-A-8-VIII-05 51°22.323 98°57.494 6.0 168.0

95
Figure 5-2. Bathymetric maps showing location of coring sites for (a) Sanjin Nuur, (b) Mustei Nuur, (c) Ganbold Nuur, and (d) Batbold Nuur. Bathymetric maps were not produced for the other studied lakes due to incomplete data sets.
5.4 LABORATORY METHODS
Radiocarbon ages for the Baroon Taiga sediment profiles were determined by accelerator mass
spectrometry (AMS) at the Lawrence Livermore National Laboratories Center for Accelerator
Mass Spectrometry (CAMS) and at the University of California - Irvine Keck Carbon Cycle
AMS Facility (UCI). All samples consisted of either aquatic plant macrofossils or charcoal and

96
were pretreated with standard acid-base-acid techniques (Abbott and Stafford 1996). Calibrated
ages were determined using the CALIB REV4.4.2 Radiocarbon Calibration Program (Stuiver
and Reimer 1993; Stuiver 2005) (Table 5-3) and presented in cal yr B.P. (1950).
Reflectance measurements over a range of 350-2500 nm were collected using an
Analytical Spectral Devices, Inc. (Boulder, Colorado) LabSpec® Pro spectroradiometer at Kent
State University. The 350-986 nm range was measured using a 512-channel Si photodiode array
detector at a sampling interval of 1.4 nm and a sampling resolution of 3 nm. A fiber-optic cable
connected the polychromatic tungsten light source (quartz halogen, 3000°K) to the sampling
probe mounted above an adjustable stage. Freeze-dried and homogenized sediment samples in
transparent whirlpak sampling bags were brought into full contact with the sampling probe with
the adjustable stage for each spectral measurement in order to reduce vibrational and handling
affects. Whirlpak correction values were determined per wavelength through a ratio of unpacked
to packed sample measurements. The spectroradiometer averaged 200 full spectral
measurements per sediment sample at a time of ~20 seconds to increase the signal-to-noise ratio.
The spectroradiometer was calibrated through measurement of a white reflectance panel between
each successive sediment sample measurement. Reflectance spectra results are presented as
percent reflectance through a simple conversion (%R = (Rsample − Rblank /Rreflec tan ce − Rblank ) ×100).
Percent reflectance values were then converted to a unitless spectral index representative of the
reflectance trough area under a curve between 650 and 700 nm (Rtrough) as demonstrated by
previous studies (Das et al. 2005; Wolfe et al. 2006). Organic matter concentrations (OM) were
determined at a 1.0 cm interval following standard LOI techniques (Dean 1974).

97
5.5 RESULTS
5.5.1 Ganbold Nuur
A 112.0cm sediment core (GAN-B-10-VIII-05) was retrieved from a water depth of 18.5 m
(Table 5-2) from the southwestern deep-water basin of Ganbold Nuur (Figure 5-2c). Three
AMS 14C dates were obtained for Ganbold Nuur core GAN-B-10-VIII-05 (Table 5-3). Age
depth values were fit by linear interpolation between the median probability calibrated age (cal
yr B.P.) for each dated horizon (Figure 5-3a). A basal age of 1485 cal yr B.P. was assigned to
110.0 cm depth by linear extrapolation beyond the last dated horizon (100.0 cm, 1337 cal yr
B.P.). Surface sediments were designated as representing modern age at the time of sampling (-
55 cal yr B.P.). This inference is supported by a previously-resolved 210Pb profile reflecting
modern age for the surface sediments of a Baroon Taiga lake core (Robinson et al. accepted).
From this age model, sediment accumulation rates for core GAN-B-10-VIII-05 ranges from 32.0
yr cm-1 for modern – 137 cal yr B.P., 10.9 cm yr-1 for 137 – 736 cal yr B.P., and 14.75 yr cm-1
for 736 – 1584 cal yr B.P.
Core GAN-B-10-VIII-05 sediments consist of diatomaceous clay with interspaced thin-
to-diffuse silt and organic-rich laminations. Upper sediments to an age of 250 cal yr B.P. were
extruded in the field (Figure 5-4a). Sediments spanning 250 – 500 cal yr B.P. consist of fine
clay with diffuse black organic laminations and thin grey silt layers. A sharp transition to light
grey fine-to-medium grained silt occurs at 500 cal yr B.P. and extends to 580 cal yr B.P. A
diffuse transition to clay with black organic laminations and thin grey silt layers occurs at 580 cal
yr B.P. and extends to 690 cal yr B.P., followed by a sharp transition to light grey fine-to-
medium grained silt. At 725 cal yr B.P. a diffuse transition to highly organic clay occurs. A

98
graded transition from organic clay to organic silt occurs from 800 – 900 cal yr B.P., wherein a
return to diatomaceous clay occurs. From 1150 – 1480 cal yr B.P. the diatomaceous clay is
interspersed with thin-to-fine light grey silt layers.
Table 5-3. AMS radiocarbon dates for samples from the Baroon Taiga Mountain lakes. *Dated horizons not included in age-models. **Dated horizons with ultimately altered sample depths.
Lab Number Core Depth (cm)
Sample Type δ13C‰
Radiocarbon Age (yr B.P.)
Error (+/- yr)
Median Probability Calibrated Age (yr B.P.)
1-Sigma Calibrated Age Range (yr B.P.)
2-Sigma Calibrated Age Range (yr B.P.)
UCI-32620 GAN-B-10-VIII-05 7.0 Aquatic macro -- 215 20 169 0-295 -1-303
UCI-32621 GAN-B-10-VIII-05 60.0 Aquatic macro -- 840 15 747 729-766 698-785
UCI-25165 GAN-B-10-VIII-05 100 Aquatic macro -19.7 1450 20 1337 1312-1350 1304-1376
UCI-32662 SAN-A-6-VIII-05 32.0 Aquatic macro -- 1115 20 1014 979-1055 969-1060
UCI-25172 SAN-A-6-VIII-05 103.0 Aquatic macro -15.4 2360 20 2354 2343-2359 2338-2456
*UCI-32655 AN-A-03 14.85 Aquatic macro -- 1610 60 1495 1413-1550 1367-1690
UCI-32656 AN-A-03 51.0 Aquatic macro --- 1425 25 1324 1303-1337 1293-1362
CAMS-100735 AN-A-03 82.0 Aquatic macro -- 3020 100 3204 3078-3347 2930-3444
UCI-32619 BN-A-03 23.0 Aquatic macro -- 895 20 819 768-900 738-906
UCI-32658 BN-A-03 52.0 Aquatic macro -- 1900 70 1841 1737-1922 1632-1997
CAMS-100733 BN-A-03 88.0 Aquatic macro -- 3870 40 4303 4241-4405 4157-4416
UCI-32671 BAT-A-9-VIII-05 63.0 Charcoal -- 3970 60 4434 4299-4524 4237-4781
UCI-32657 BAT-A-9-VIII-05 93.0 Aquatic macro -- 5400 50 6211 6129-6283 6007-6295
UCI-25164 BAT-A-9-VIII-05 119 Aquatic macro -17.6 7255 35 8085 8014-8156 8000-8167
UCI-32669 TSO-A-8-VIII-05 7.0 Aquatic macro -- 1635 50 1530 1418-1602 1406-1691
UCI-32670 TSO-A-8-VIII-05 39.0 Aquatic macro -- 5800 40 6600 6554-6661 6492-6717
UCI-25173 TSO-A-8-VIII-05 129.0 Aquatic macro -16.6 8710 40 9655 9560-9699 9547-9886
UCI-32661 MUS-A-7-VIII-05 27.0 Charcoal -- 2935 45 3098 3004-3197 2957-3242
UCI-32622 MUS-A-7-VIII-05 72.0 Aquatic macro -- 6705 20 7578 7525-7578 7516-7578
**UCI-25167 MUS-A-7-VIII-05 107.0 Aquatic macro -21.3 8380 90 9376 9293-9488 9136-9532
*UCI-32660 MAN-A-9-VIII-05 19.0 Aquatic macro -- 1745 20 1655 1620-1699 1572-1712
*UCI-32659 MAN-A-9-VIII-05 81.0 Aquatic macro -- 1375 25 1297 1285-1305 1274-1333
*UCI-25166 MAN-A-9-VIII-05 156.0 Aquatic macro -- 865 15 764 742-780 733-792

99
Figure 5-3. Age-depth models for cores (a) GAN-B-10-VIII-05, (b) SAN-A-6-VIII-05, (c) AN-A-03, (b) BN-A-03, (e) BAT-A-8-VIII-05, (f) TSO-A-9-VIII-05, (g) MUS-A-70VIII-05, and (h) MAN-A-9-VIII-05. Data points represent dated horizon locations with 2-sigma age error bars.
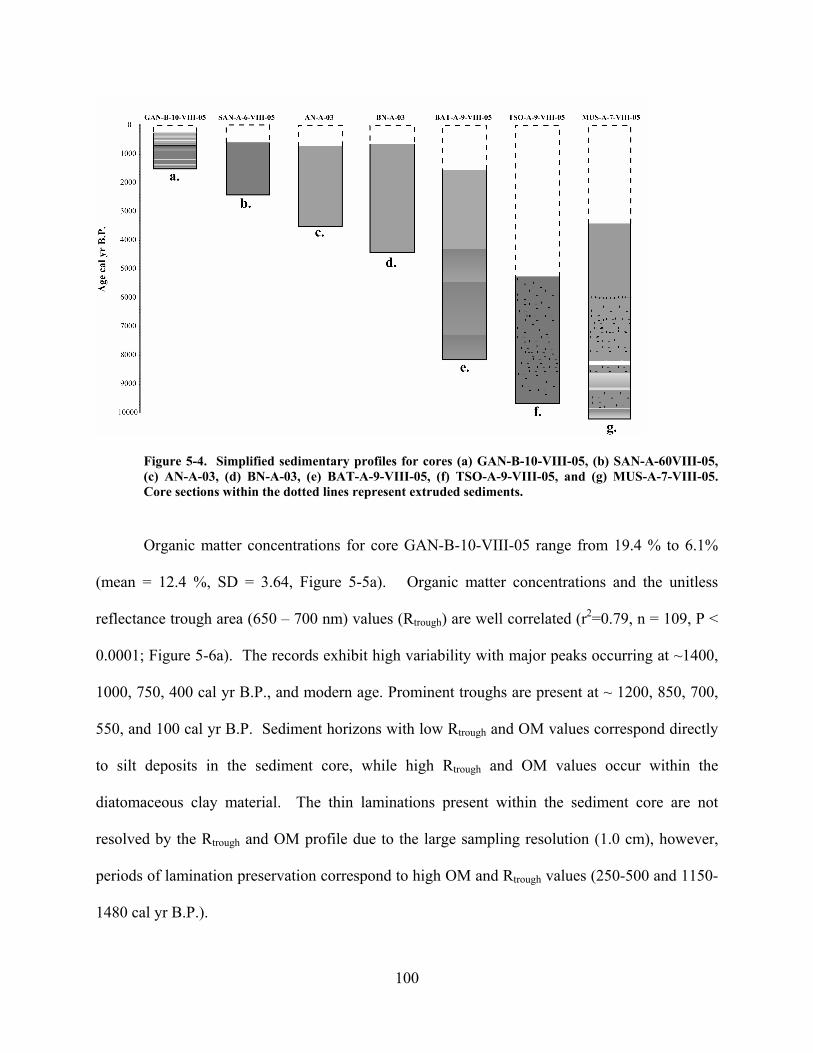
100
Figure 5-4. Simplified sedimentary profiles for cores (a) GAN-B-10-VIII-05, (b) SAN-A-60VIII-05, (c) AN-A-03, (d) BN-A-03, (e) BAT-A-9-VIII-05, (f) TSO-A-9-VIII-05, and (g) MUS-A-7-VIII-05. Core sections within the dotted lines represent extruded sediments.
Organic matter concentrations for core GAN-B-10-VIII-05 range from 19.4 % to 6.1%
(mean = 12.4 %, SD = 3.64, Figure 5-5a). Organic matter concentrations and the unitless
reflectance trough area (650 – 700 nm) values (Rtrough) are well correlated (r2=0.79, n = 109, P <
0.0001; Figure 5-6a). The records exhibit high variability with major peaks occurring at ~1400,
1000, 750, 400 cal yr B.P., and modern age. Prominent troughs are present at ~ 1200, 850, 700,
550, and 100 cal yr B.P. Sediment horizons with low Rtrough and OM values correspond directly
to silt deposits in the sediment core, while high Rtrough and OM values occur within the
diatomaceous clay material. The thin laminations present within the sediment core are not
resolved by the Rtrough and OM profile due to the large sampling resolution (1.0 cm), however,
periods of lamination preservation correspond to high OM and Rtrough values (250-500 and 1150-
1480 cal yr B.P.).
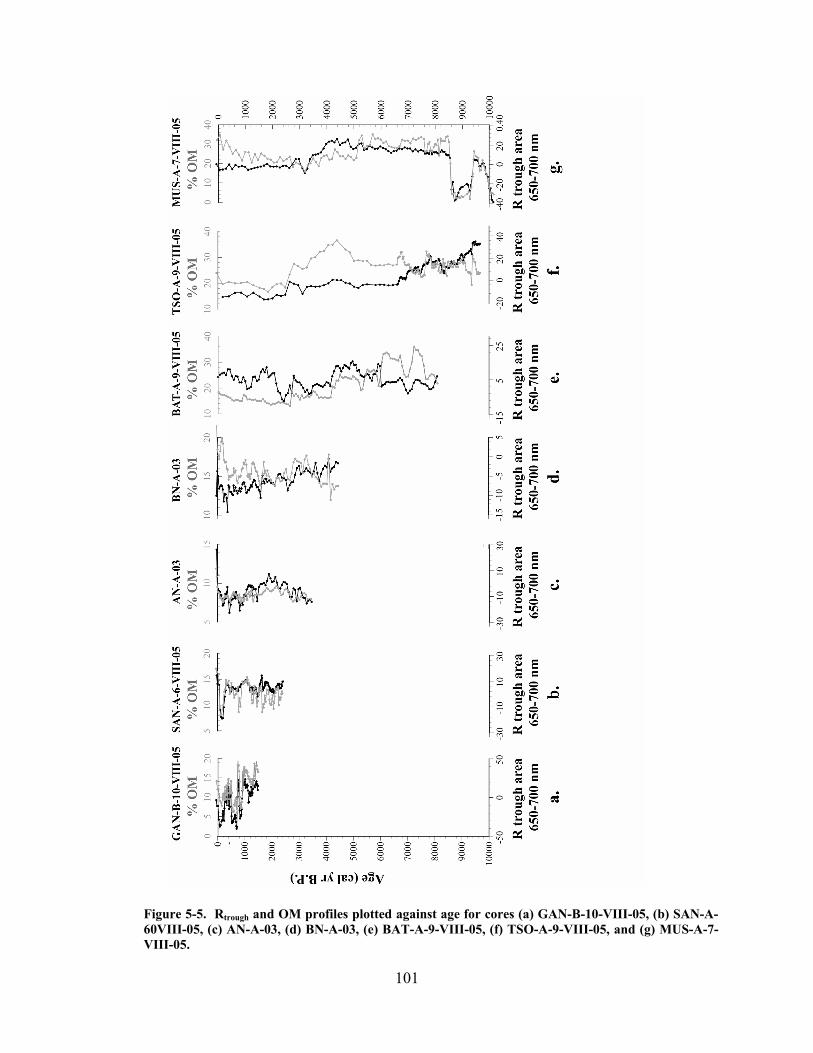
101
Figure 5-5. Rtrough and OM profiles plotted against age for cores (a) GAN-B-10-VIII-05, (b) SAN-A-60VIII-05, (c) AN-A-03, (d) BN-A-03, (e) BAT-A-9-VIII-05, (f) TSO-A-9-VIII-05, and (g) MUS-A-7-VIII-05.
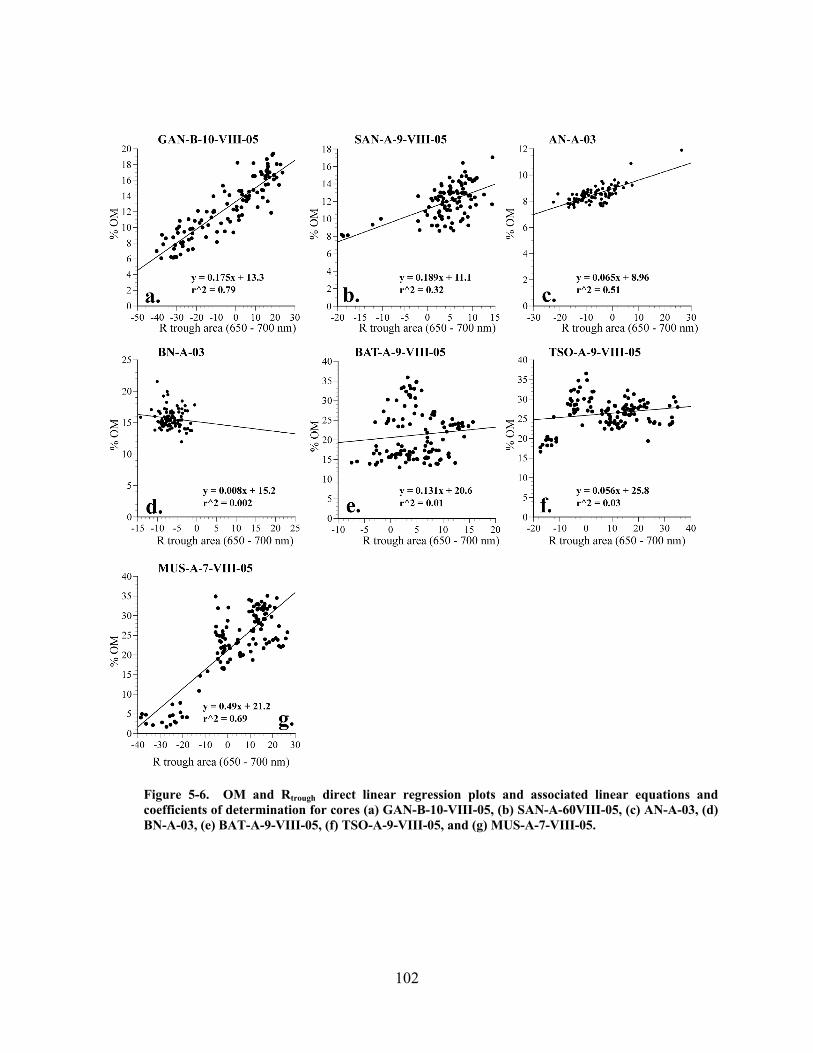
102
Figure 5-6. OM and Rtrough direct linear regression plots and associated linear equations and coefficients of determination for cores (a) GAN-B-10-VIII-05, (b) SAN-A-60VIII-05, (c) AN-A-03, (d) BN-A-03, (e) BAT-A-9-VIII-05, (f) TSO-A-9-VIII-05, and (g) MUS-A-7-VIII-05.

103
5.5.2 Sanjin Nuur
An 83.0 cm sediment core (SAN-A-6-VIII-05) was retrieved from a water depth of 16.75
m (Table 5-2) from the southern deep-water hole of Sanjin Nuur (Figure 5-2a). Two AMS 14C
dates were obtained for Sanjin Nuur core SAN-A-6-VIII-05 (Table 5-3). Age depth values were
fit by linear interpolation between the median probability calibrated age (cal yr B.P.) for each
dated horizon (Figure 5-3b). A basal age of 2390 cal yr B.P. was assigned to 104.0 cm depth by
linear extrapolation beyond the last dated horizon (103.0 cm, 2354 cal yr B.P.). Surface
sediments were designated as representing modern age at the time of sampling (-55 cal yr B.P.)
From this age model, sediment accumulation rates for core SAN-A-10-VIII-05 range from 33.5
yr cm-1 for modern-1014 cal yr B.P. and 19.4 yr cm-1 for 1014 – 2392 cal yr B.P.
Core SAN-A-6-VIII-05 sediments consist of homogenous diatomaceous clay with no
visible stratigraphic horizons (Figure 5-4b). Upper sediments to an age of 610 cal yr B.P. were
extruded in the field. Organic matter concentrations from LOI 550° for core SAN-A-6-VIII-05
range from 17.1 % to 8.13 % (mean = 12.3 %, SD = 1.84; Figure 5-5b). Organic matter
concentrations and Rtrough values are not well correlated for core SAN-A-6-VIII-05 (r2=0.32, n =
95, P < 0.0001; Figure 5-6b) as the OM record exhibits a higher variability then the Rtrough
record. The overall trend of the Rtrough record decreases from basal sediments to 150 cal yr B.P.
followed by an increase to modern, while the OM profile exhibits an overall increase throughout
the entire record. Even so, the main features of the records are coincident. Major peaks occur at
2200, 1800, 1600, 1000, and 400 cal yr B.P. with the highest peak occurring at modern age.
Coincident troughs occur at ~ 2000, 1700, 1500, 550, and 200 cal yr B.P, with the latter being
the most prominent in both profiles. The SAN-A-6-VIII-05 Rtrough and OM profiles exhibit
comparable trends and features to a record of biogenic silica (BSi) concentrations from a

104
previously studied Sanjin Nuur sediment core (Figure 5-7) (Robinson et al. accepted), although
variance in sample resolution prohibit any statistical correlation.
Figure 5-7. Comparison of Rtrough and OM profiles for core SAN-A-6-VIII-05 with a % BSi reconstruction from a previously studied Sanjin Nuur sediment core (SN-B-03) (Robinson et al, accepted). Date points represent location of 14C dated horizons and 2-sigma error ranges for core SAN-A-6-VIII-05.
5.5.3 Asgat Nuur
An 88.0 cm sediment core (AN-A-03) was retrieved from a water depth of 4.9 m (Table 5-2).
Three AMS 14C dates were obtained for Asgat Nuur core AN-A-03 (Table 5-3c). Age depth
values were fit by linear interpolation between the median probability calibrated age (cal yr B.P.)
for each dated horizon (Figure 5-3c). A basal age of 3445 cal yr B.P. was assigned to 85.0 cm
depth by linear extrapolation beyond the last dated horizon (82.0 cm, 3204 cal yr B.P.). An age
measurement of 1495 cal yr B.P. was obtained at 14.85 cm, but was disregarded as anomalously

105
old due to the presence of a younger age measurement at greater depths (Figure 5-3). The
chosen age model presents the most conservative interpretation of the limited age data. Surface
sediments were designated as representing modern age at the time of sampling (-53 cal yr B.P.).
From this age model, sediment accumulation rates for core AN-A-03 range from 27.5 yr cm-1 for
modern – 1324 cal yr B.P. and 60.64 yr cm-1 for 1324 – 3446 cal yr B.P.
Core AN-A-03 sediments consist of homogenous diatomaceous clay with no visible
stratigraphic horizons (Figure 5-4c). Upper sediments to an age of 690 cal yr B.P. were extruded
in the field. Organic matter concentrations range from 11.9 % to 7.54% (mean = 8.51 %, SD =
0.673; Figure 5-5c). Reflectance trough values exhibit a general increasing trend from basal
sediments (3445 cal yr B.P.) to 1900 cal yr B.P., thereafter the overall trend decreases to 800 cal
yr B.P., followed by an increase to modern. Organic matter concentrations and Rtrough values are
moderately correlated for core AN-A-03 (r2=0.51, n = 85, P < 0.0001; Figure 5-6c). The profiles
compare well between modern age - 1230 cal yr B.P. and 2000-2600 cal yr B.P. Major peaks in
both records occur at 2500, 2200, 1190, 600, and 300 cal yr B.P. with the highest peak occurring
at modern age. Trough agreement occurs at ~ 2350, 2050, 800, 400, and 200 cal yr B.P.

106
5.5.4 Boorog Nuur
A 0.91 cm sediment core (BN-A-03) was retrieved from a water depth of 3.35 m (Table 5-2).
Three AMS 14C dates were obtained for Boorog Nuur core BN-A-03 (Table 5-3). Age depth
values were fit by linear interpolation between the median probability calibrated age (cal yr B.P.)
for each dated horizon (Figure 5-3d). A basal age of 4400 cal yr B.P. was assigned to 90.0 cm
depth by linear extrapolation beyond the last dated horizon (88.0 cm, 4303 cal yr B.P.). Surface
sediments were designated as representing modern age at the time of sampling (-53 cal yr B.P.)
From this age model, sediment accumulation rates for core BN-A-03 range from 37.9 yr cm-1 for
modern – 818 cal yr B.P., 35.2 cm yr-1 for 818- 1841 cal yr B.P., and 68.4 yr cm-1 for 1841 –
4440 cal yr B.P.
Core BN-A-03 sediments consist of homogenous diatomaceous clay with no visible
stratigraphic horizons (Figure 5-4d). Upper sediments to an age of 630 cal yr B.P. were
extruding in the field. Organic matter concentrations range from 21.6 % to 11.9% (mean = 15.7
%, SD = 1.54; Figure 5-5d) and are highly variable. Reflectance trough values exhibit an overall
decreasing trend throughout the record with the exception of time interval between 400 cal yr
B.P. – modern age when an increasing trend occurs. The OM profile exhibits a general
increasing trend throughout the entire record. Although organic matter concentrations and Rtrough
values are uncorrelated for core BN-A-3 (r2=0.003, n = 93, P > 0.1; Figure 5-6d), comparable
features exist between the profiles. Coincident peaks occur at 4050, 3600, 2900, and 2300, 1350,
and 980 cal yr B.P. Coincident troughs occur at 4180, 3450, 2600, 2100, 1580, 1150, and 750
cal yr B.P.
107
5.5.5 Batbold Nuur
A 121.0 cm sediment core (BAT-A-9-VIII-05) was retrieved from a water depth of 12.0 m
(Table 5-2) from the western deep-water hole of Ganbold Nuur (Figure 5-2d). Three AMS 14C
dates were obtained for Batbold Nuur core BAT-A-9-VIII-05 (Table 5-3). Age depth values
were fit by linear interpolation between the median probability calibrated age (cal yr B.P.) for
each dated horizon (Figure 5-3e). A dated sample provided a basal age of 8084 cal yr B.P. at
119.0 cm. Surface sediments were designated as representing modern age at the time of
sampling (-55 cal yr B.P.). From this age model, sediment accumulation rates for core BAT-A-9-
VIII-05 range from 71.3 yr cm-1 for modern – 4434 cal yr B.P., 59.2 yr cm-1 for 4434 – 6210 cal
yr B.P., and 72.1 yr cm-1 for 6210-8084 cal yr B.P.
Core BAT-A-9-VIII-05 sediments consist of four distinct sections of graded
diatomaceous clay with diffuse transitions occurring at 4360, 5320, and 7590 cal yr B.P. (Figure
5-4e). Upper sediments to an age of 1300 cal yr B.P. were extruded in the field. Organic matter
concentrations range from 35.9 % to 13.03% (mean = 12.3 %, SD = 6.23; Figure 5-5e).
Reflectance trough values exhibit two separate overall increasing trends from basal sediments
(8084 cal yr B.P.) to 4440 cal yr B.P. and from 4200 cal yr B.P. to modern age. The OM profile
exhibits a general decreasing trend throughout the entire record. Organic matter concentrations
and Rtrough values are uncorrelated for core BAT-A-9-VIII-05 (r2=0.01, n = 119, P > 0.1; Figure
5-6e). However, periods of comparable features exist between the profiles (i.e. 7700-6050,
5300-2800 cal yr B.P.). Coincident peaks occur at 7300, 6400, 4800, and 2800 cal yr B.P. and
troughs occur at 7000 and 4000 cal yr B.P.
108
5.5.6 Tsogtoo Nuur
A 130.0 cm sediment core (TSO-A-9-VIII-05) was retrieved from a water depth of 3.8 m (Table
5-2) from the central area of Tsogtoo Nuur. Three AMS 14C dates were obtained for core TSO-
A-8-VIII-05 (Table 5-3). Age depth values were fit by linear interpolation between the median
probability calibrated age (cal yr B.P.) for each dated horizon (Figure 5-3). A dated sample
provided a basal age of 9655 cal yr B.P. at 129.0 cm. Surface sediments were designated as
representing modern age at the time of sampling (-55 cal yr B.P.). From this age model, sediment
accumulation rates for core TSO-A-9-VIII-05 range from 226.4 yr cm-1 for modern – 1303 cal yr
B.P., 158.4 cm yr –1 for 1303-6600 cal yr B.P., and 33.9 yr cm-1 for 6600 – 9654 cal yr B.P.
Core TSO-A-9-VIII-05 sediments consist of homogenous diatomaceous clay with high
concentrations of organic matter (Figure 5-4f). Upper sediments to an age of 5170 cal yr B.P.
were extruded in the field. Organic matter concentrations range from 36.6 % to 16.7% (mean =
26.3 %, SD = 3.73; Figure 5-5f) and are uncorrelated to Rtrough values (r2=0.03, n = 125, P < 0.1;
Figure 5-6f). The profiles, however, compare well between 9100-7100 cal yr B.P. and exhibit
several similar features throughout the record. Reflectance trough values display an overall
decreasing trend throughout the entire record, while OM values show a broad peak from 5000 –
3600 cal yr B.P.
5.5.7 Mustei Nuur
A 122.0 cm sediment core (MUS-A-7-VIII-05) was retrieved from a water depth of 19.4 m
(Table 5-2) from the central deep-water basin of Ganbold Nuur (Figure 5-2b). Three AMS 14C
dates were obtained for core MUS-A-7-VIII-05 (Table 5-3). Age depth values were fit by linear

109
interpolation between the median probability calibrated age (cal yr B.P.) for each dated horizon
(Figure 5-3). A basal age of 10149 cal yr B.P. was assigned to 122.0 cm depth by linear
extrapolation beyond the last dated horizon (107.0 cm, 9376 cal yr B.P.). Surface sediments
were designated as representing modern age at the time of sampling (-55 cal yr B.P.). From this
age model, sediment accumulation rates for core MUS-A-7-VIII-05 range from 116.8 yr cm-1 for
modern – 2981 cal yr B.P., 99.5 cm yr –1 for 2981 – 7578 cal yr B.P., and 51.4 yr cm-1 for 7578 -
10149 cal yr B.P.
Core MUS-A-7-VIII-05 sediments consist of diatomaceous clay with various
stratigraphic features including sand deposits, organic deposits, and diffuse laminations at
intermittent depths (Figure 5-4g). Upper sediments to an age of 3390 cal yr B.P. were extruded
in the field. Sediments spanning 3390 – 5980 cal yr B.P. display no visible stratigraphy. Black
organic matter deposits occur within homogenous clay at ages of 5980-6100, 6280-7680, and
7830 – 8606 cal yr B.P. A thin sand deposit within the organic rich diatomaceous clay occurs at
8150 cal yr B.P. A sharp transition to fine grey clay occurs at 8606 cal yr B.P. This fine clay
deposit transitions to fine-grained sand at 8660 cal yr B.P. and then back to fine clay at 8700 cal
yr B.P. extending to 8800 cal yr B.P. A massive grey silt and sand deposit exhibiting a fining
upwards sequence occurs from 8800 – 9380 cal yr B.P and is followed by organic rich clay until
9740 cal yr B.P. The basal sediments consist of fine dark and light clay deposits with no visible
stratigraphy.
Organic matter concentrations for core MUS-A-7-VIII-05 range from 35.1 % to 1.71%
(mean = 22.9 %, SD = 9.15; Figure 5-5g). Organic matter concentrations and Rtrough values are
well correlated (r2=0.69, n = 122, P < 0.0001; Figure 5-6g), although the OM profile exhibits
great high-frequency variability while the Rtrough values remain generally invariable.

110
Simultaneous high-frequency troughs and peaks between the OM and Rtrough profiles are
generally absent with the exception of the large and abrupt trough feature occurring from 9400-
8550 cal yr B.P. This trough feature is coincident with a stratigraphic fining-upwards sand to silt
deposit, characteristic of a slump or turbidite deposit (Figure 5-4g). The event(s) resulting in
such deposits is relatively instantaneous, allowing for the treatment of the entire trough feature as
a unique temporal moment. Removal of this deposit from the sediment core sequence and
subsequent adjustment of the overall age model results in a near linear age profile for core MUS-
A-7-VIII-05 (Figure 5-8a), and thereby extends the basal age of the sediment profile to 10800 cal
yr B.P. Removal of the OM and Rtrough values associated with the slump deposit and application
of the adjusted age-model extends the early Holocene OM and Rtrough data points and results in a
invariable transition to mid-Holocene values (Figure 5-8b,c). Both profiles exhibit an overall
increasing trend from basal sediments (10149 cal yr B.P.) to 5300 cal yr B.P., and an overall
decreasing trend from 8550 – 3200 cal yr B.P. Following 3200 cal yr B.P., the OM profile
increases to modern with high variability, while the Rtrough profile remains stable.
5.5.8 Mandax Nuur
A 168.0 cm sediment core (MAN-A-8-VIII-05) was retrieved from a water depth of 6.0 m (Table
5-2) from the central region of Mandax Nuur. Three AMS 14C dates were obtained for Mandax
Nuur core MAN-A-9-VIII-05 (Table 5-3). The median probability calibrated ages for the dated
horizons, however, display an overall sediment-age reversal for the record (Figure 5-3). Core
MAN-A-9-VIII-05 is thereby excluded in all subsequent sections and the overall discussion.
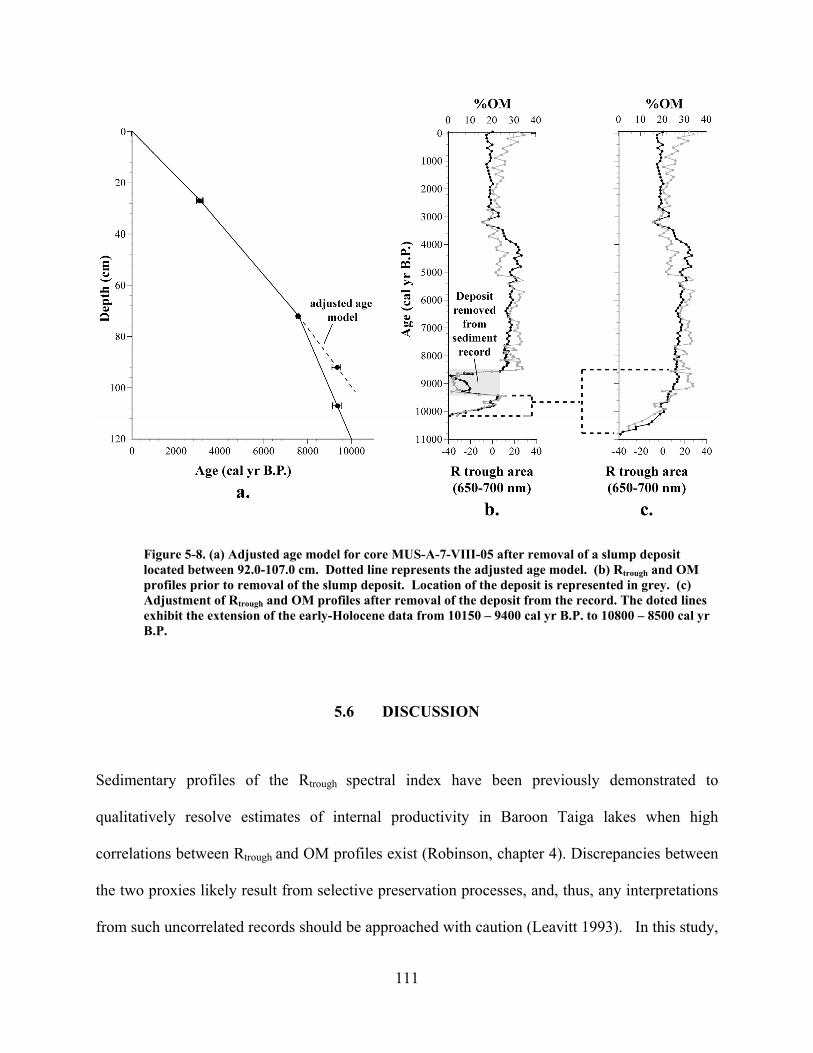
111
Figure 5-8. (a) Adjusted age model for core MUS-A-7-VIII-05 after removal of a slump deposit located between 92.0-107.0 cm. Dotted line represents the adjusted age model. (b) Rtrough and OM profiles prior to removal of the slump deposit. Location of the deposit is represented in grey. (c) Adjustment of Rtrough and OM profiles after removal of the deposit from the record. The doted lines exhibit the extension of the early-Holocene data from 10150 – 9400 cal yr B.P. to 10800 – 8500 cal yr B.P.
5.6 DISCUSSION
Sedimentary profiles of the Rtrough spectral index have been previously demonstrated to
qualitatively resolve estimates of internal productivity in Baroon Taiga lakes when high
correlations between Rtrough and OM profiles exist (Robinson, chapter 4). Discrepancies between
the two proxies likely result from selective preservation processes, and, thus, any interpretations
from such uncorrelated records should be approached with caution (Leavitt 1993). In this study,

112
three sediment profiles exhibit high coefficients of determination between Rtrough and OM values
(r2>0.5, Figure 5-6): GAN-B-10-VIII-05, AN-A-03, and MUS-A-7-VIII-05. Core SAN-A-6-
VIII-05 presents a lower correlation value (r2 = 0.32), but the high similarities between the Rtrough
and OM records and the pre-existing Sanjin Nuur core SN-B-03 BSi-inferred productivity record
(Robinson et al. accepted)(Figure 5-7) suggest their utility as paleoproductivity indicators.
The Rtrough profiles present a more reliable record of inferred-productivity in comparison
to the OM profiles because of the high measurement-to-sample ratio (200:1) of the spectral
reflectance method, the well demonstrated effectiveness of the spectral method as an accurate
indicator of CDP and Chl a (Das et al. 2005; Wolfe et al. 2006), and the inherent errors
associated with standard LOI techniques (Heire et al. 2001). The Rtrough records from cores
GAN-B-10-VIII-05, SAN-A-6-VIII-05, AN-A-03, and MUS-A-7-VIII-05, therefore, are
believed to be representative of the paleoproductivity histories of lake Ganbold Nuur, Sanjin
Nuur, Asgat Nuur, and Mustei Nuur.
Core MUS-A-7-VIII-05 yields a Rtrough-inferred productivity record for lake Mustei Nuur
since 10800 cal yr B.P. (Figure 5-9a). The low sediment accumulation rates of core MUS-A-7-
VIII-05 (~100 yr cm-1) prohibit any meaningful comparison to other reliable Baroon Taiga
records and limit the discussion to long-term inferred productivity trends. Inferred productivity
rates increased dramatically during the Pleistocene/Holocene transition period (10800 – 8800 cal
yr B.P.) Mid-Holocene values remain high and gradually increase to 4300 cal yr B.P. A
decrease occurs from 4300-3200 cal yr B.P. followed by relatively stable inferred production
rates to modern age.
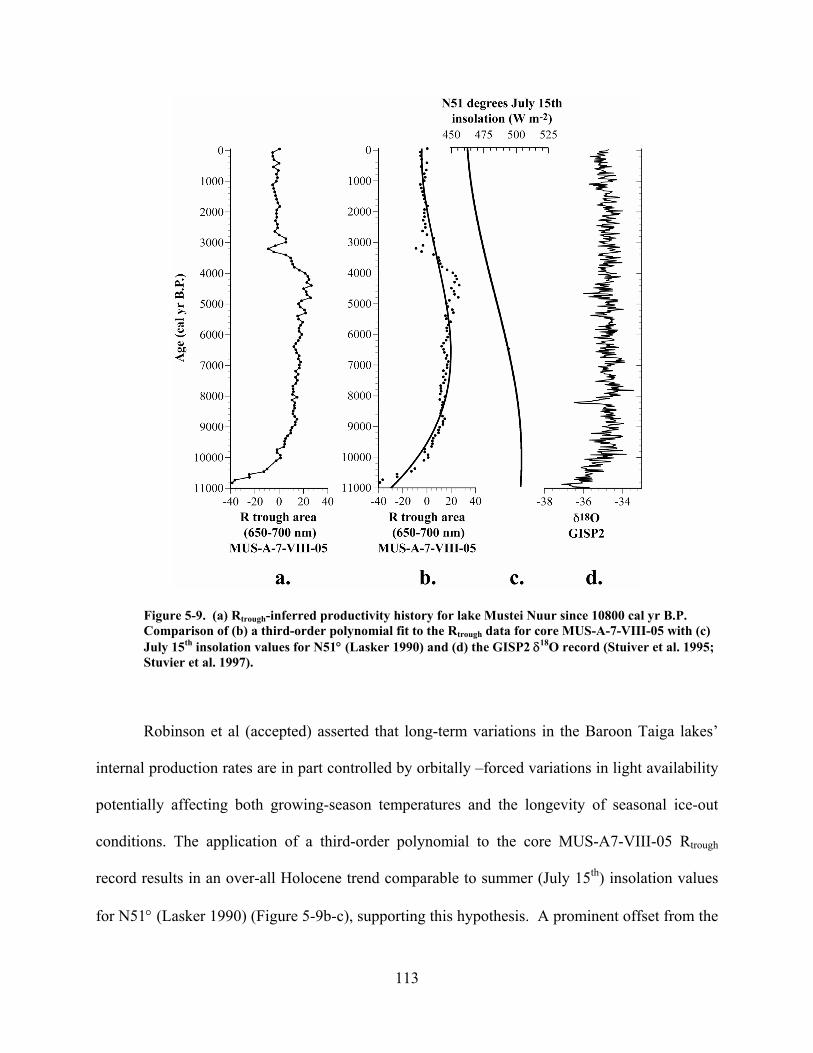
113
Figure 5-9. (a) Rtrough-inferred productivity history for lake Mustei Nuur since 10800 cal yr B.P. Comparison of (b) a third-order polynomial fit to the Rtrough data for core MUS-A-7-VIII-05 with (c) July 15th insolation values for N51° (Lasker 1990) and (d) the GISP2 δ18O record (Stuiver et al. 1995; Stuvier et al. 1997).
Robinson et al (accepted) asserted that long-term variations in the Baroon Taiga lakes’
internal production rates are in part controlled by orbitally –forced variations in light availability
potentially affecting both growing-season temperatures and the longevity of seasonal ice-out
conditions. The application of a third-order polynomial to the core MUS-A7-VIII-05 Rtrough
record results in an over-all Holocene trend comparable to summer (July 15th) insolation values
for N51° (Lasker 1990) (Figure 5-9b-c), supporting this hypothesis. A prominent offset from the

114
insolation curve occurs from the basal sediments (10800 cal yr B.P.) to 8000 cal yr B.P. This
period coincides with the onset of northern hemisphere warmth following the termination of the
Younger Dryas event, as demonstrated by the δ18O profile in Greenland ice (Stuiver et al. 1995;
Stuvier et al. 1997) (Figure 5-9d). Such warmth likely enhanced conditions for biological
production in the Baroon Taiga lakes through increased nutrient input from glacier and snow
melt-water and/or decreased seasonal ice-cover on the lakes. Evidence for lake level rise
associated increased regional melt-water during this period is present in the sediments of lake
Khovsgul (Fedotov et al. 2004).
Following the Pleistocene/Holocene transition period, northern hemisphere temperatures
remained comparatively stable (Figure 5-9d), allowing for changes in orbitally-forced insolation
to become the principle mechanism of long-term productivity variation in the Baroon Taiga
lakes. As insolation increases, summer temperatures increase promoting biological growth, as
mentioned above. Furthermore, the increased ocean-land temperature gradient associated with
enhanced summer insolation has been shown to strengthen monsoonal systems (Prell and
Kutzbach 1987; deMenocal and Rind 1993). During the mid-Holocene, a strengthening of the
Indian and Asian Monsoons may have forced the systems northward, effectively increasing
summer precipitation rates over the Mongolian region. The increased nutrients introduced to the
lake systems via associated surface runoff would promote biological production.
A second prominent feature in the core MUS-A-7-VIII-05 Rtrough record is the decreasing
trend from 4400 – 3200 cal yr B.P. Although offset by ~ 1000 years in the current age-model,
this production decrease may be a similar expression of the complex interactions between land,
ocean, and atmospheric mechanisms that gave rise to the abrupt termination of African Humid
Period and associated desiccation of northern Africa at ~5500 cal yr B.P. (deMenocal et al.
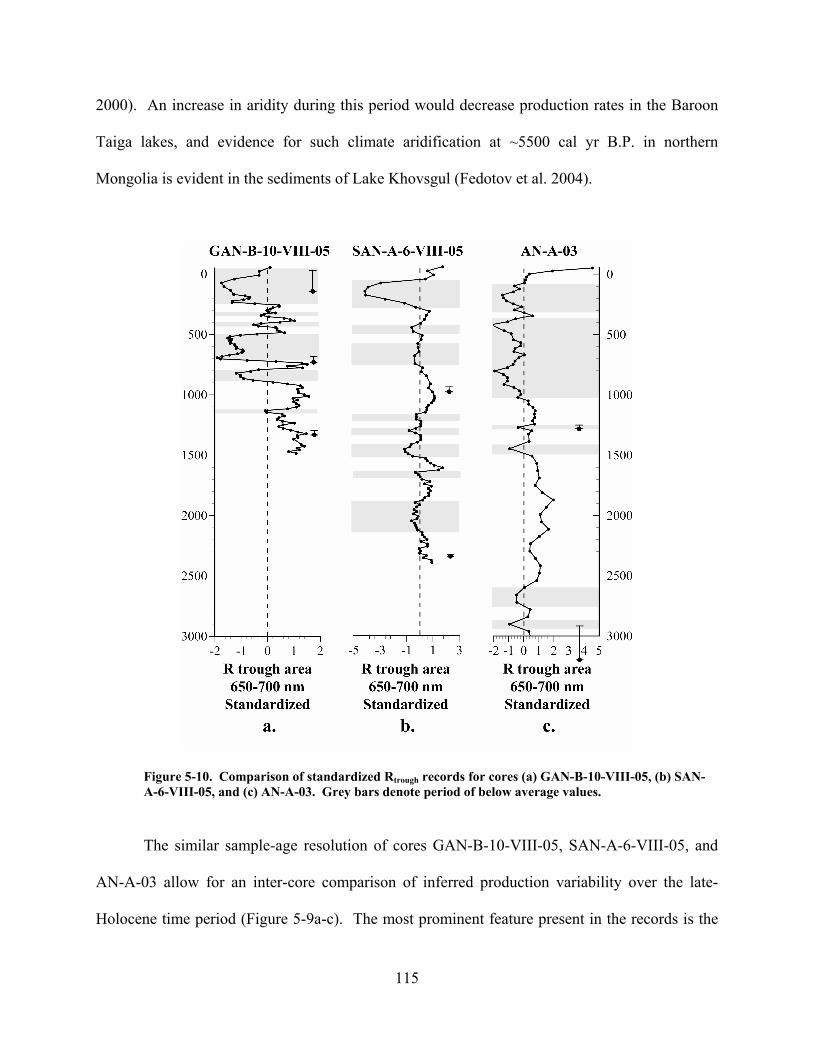
115
2000). An increase in aridity during this period would decrease production rates in the Baroon
Taiga lakes, and evidence for such climate aridification at ~5500 cal yr B.P. in northern
Mongolia is evident in the sediments of Lake Khovsgul (Fedotov et al. 2004).
Figure 5-10. Comparison of standardized Rtrough records for cores (a) GAN-B-10-VIII-05, (b) SAN-A-6-VIII-05, and (c) AN-A-03. Grey bars denote period of below average values.
The similar sample-age resolution of cores GAN-B-10-VIII-05, SAN-A-6-VIII-05, and
AN-A-03 allow for an inter-core comparison of inferred production variability over the late-
Holocene time period (Figure 5-9a-c). The most prominent feature present in the records is the
116
period of decreased inferred productivity from ~50-300 cal yr B.P. This period of diminished
productivity rates is coincident with the timing of the Little Ice Age in northern Mongolia
(Jacoby et al. 1996; D'Arrigo et al. 2000; D'Arrigo et al. 2001; Andreev et al. 2002; Robinson et
al. accepted). The largest increase in inferred-productivity occurs from ~50 cal yr B.P. to
modern age in both the SAN-A-6-VIII-05 and AN-A-03 records. A similar increase is present in
the core GAN-B-10-VIII-05 profile, although the rate and magnitude of the increase is less
unique in the context of the full record. This increasing trend is coincident with evidence for
20th century warming in other notable records (Mann et al. 1998; Mann et al. 1999; Crowley
2000; Mann and Jones 2003). Periods of regional enhanced inferred-productivity similarly occur
at ~300-400, 900-1100, 1250-1450, and 1500-1650 cal yr B.P.
Robinson et al (accepted) demonstrated similarities between a late-Holocene BSi-inferred
internal productivity record and a regional temperature-sensitive tree ring record from the
Solongotyin Davaa (Sol Dav) site in the Tarvagatay Mountains, central Mongolia (Jacoby et al.
1996; D'Arrigo et al. 2001) (Figure 5-11a-b). Here, a similar connection is demonstrated through
comparison of the core GAN-B-10-VIII-05 Rtrough-inferred productivity record with a separate
temperature-sensitive tree-ring record from the Khalzan Khamer site in the Altai Mountains,
northwestern Mongolia (D'Arrigo et al. 2000) (Figure 5-11c-d). Both the Tarvagatay and Altai
Mountain sites are similar to the Baroon Taiga Mountain sites in that they are located at local
tree-line and are in areas of continuous permafrost. The Altai Mountain site is located at a more
comparable latitude to the Baroon Taiga Sites (~49.5°N), and thereby may be a better analog
from which to base comparison. However, both records are resolved in the Baroon Taiga
inferred-productivity histories, thereby supporting the assertion of Robinson et al (accepted) that.

117
Figure 5-11. Comparison of (a) the previously resolved lake Sanjin Nuur core SN-B-3 standardized biological silica record (Robinson et al accepted) with (b) the Sol Dav tree-ring record (Jacoby et al. 1996; D'Arrigo et al. 2001). Comparison of (c) the standardized core Gan-B-10-VIII-05 Rtrough record with (d) the Khalzan Khamar tree-ring record (D'Arrigo et al. 2000) and (e) the IntCal04 radiocarbon production record (Reimer et al. 2004) . Grey bars denote period of below average values.
regional growing-season temperature variations are represented by short-term fluctuations in the
in the Baroon Taiga lakes’ productivity rates.
Robinson et al (accepted) also asserted that variation in direct solar output might
similarly influence production rates in Baroon Taiga lakes. Comparison of the core GAN-B-10-
VIII-05 Rtrough record to a cosmogenic nuclide production record (Reimer et al. 2004) (Figure 5-
11d) exhibits some temporal coherency. Therefore, although solar variability is likely to be an

118
influencing factor, other mechanisms are clearly driving late-Holocene short-term regional
temperature variations.
5.7 CONCLUSIONS
The sediments of four lakes in the Baroon Taiga Mountains, northern Mongolia, provide 14C-
dated records of inferred aquatic productivity from spectral reflectance measurements. The
inferred productivity record from lake Mustei Nuur extends to 10800 cal yr B.P. and
demonstrates connections between long-term trends in productivity rates, northern hemisphere
temperatures, and orbitally-forced insolation patterns throughout the Holocene. Lakes Ganbold
Nuur, Sanjin Nuur, and Asgat Nuur provide higher resolution late-Holocene inferred
productivity records. The Sanjin Nuur core SAN-A-6-VIII-05 Rtrough inferred production profile
compliments a pre-existing BSi-inferred production record from the same lake confirming that
the previously resolved record is not unique. The prominent features of the Sanjin Nuur records
are then resolved in the Ganbold and Asgat Nuur records, exemplifying inter-lake, and, thereby,
regional coherency. Coincident inter-lake features include a prominent Little Ice Age signal
and evidence for 20th century warming.
The records presented in this study help confirm the hypotheses of Robinson et al
(accepted) that rates of internal biological production in Baroon Taiga Mountain lakes are largely
controlled by light and nutrient availabilities as a function of external solar forcing variations and
growing-season temperature fluctuations. Furthermore, this study extends present knowledge of
the evolution of Baroon Taiga aquatic ecosystems in response to present and past climate
variations and the mechanisms that ultimately drive regional climate dynamics.
119
6.0 CONCLUSION
The work presented in this thesis represents a detailed investigation into the limnological and
paleolimnological properties of north-central Mongolia lakes. A limnological survey of modern
lake characteristics was first completed for twenty-one lake systems in order to gain a basic
understanding of the spatial characterization of north-central Mongolian lakes as a whole, as well
as the properties of each individual system. From this study, a series of lakes in two valleys
located in the Baroon Taiga Mountains of northern Mongolia were identified and targeted for
detailed paleolimnological analysis due to their potential for rendering sedimentary records from
multiple systems of similar location, morphology, ecology, chemistry, and physical
characteristics. An innovative method using spectral reflectance analysis as a qualitative
indicator of chlorophyll a and chlorophyll degradation product concentrations in the sediments of
two Baroon Taiga lakes was then tested and validated through an analytical and statistical
process. Furthermore, direct comparison of a sedimentary profile of spectrally-inferred pigment
concentrations with a previously resolved diatom produced silica-inferred productivity profile
from one Baroon Taiga lake demonstrated the potential of the spectral method to resolve
paleoproductivity histories in Baroon Taiga lakes, given limited selective preservation processes.
The then justified spectral method was applied to eight radiocarbon dated sediment sequences.
High correlations between organic matter concentrations and the spectrally-inferred pigment
concentrations in four such sediment sequences demonstrated a lack of selective preservation

120
affects throughout their records, allowing for the utilization of the spectrally-inferred pigment
records as inferred-productivity histories. One sediment sequence provided a record of full-
Holocene long-term paleoproductivity trends for Baroon Taiga region, while the other three
sequences provided high-resolution records of late-Holocene productivity variations.
The results of this study ultimately provide valuable information on previously unstudied
lake systems, further validate the use of a novel paleolimnological method, and present new
records of Holocene environmental change for northern Mongolia. Furthermore, the records
presented in this study test and support a previous hypothesis on the mechanisms driving
environmental change in the Baroon Taiga Mountains. However, a great deal of additional work
must be completed before finalizing this ongoing project.
6.1 FUTURE LIMNOLOGICAL ANALYSES
An effort to characterize the internal nutrient and chemical dynamics of each lake system
through the determination of major ion concentrations from ion chromatographic analysis should
be completed. Such data would provide a more in-depth insight into inter-lake variability and
the mechanisms driving spatial distributions in chemical properties (i.e. alkalinity as a function
of aridity, influence of bedrock chemistry). Also, a better understanding of the hydrology of
each lake system could be inferred from the degree of isotopic enrichment as compared to the
global and local meteoric water lines. The analysis of the δD and δ18O isotopic signature of the
lakes’ waters from stable isotope mass spectrometry would enhance any such an understanding.

121
6.2 FUTURE APPLICATIONS OF PIGMENT ANALYSES AND SPECTRAL
REFLECTANCE METHODOLOGIES
An effort must be made to further validate the qualitative resolution of pigment concentrations in
Baroon Taiga lake sediments through the use of the spectral reflectance method. Although the
method is well justified in the sediments of lakes Sanjin Nuur and Ganbold Nuur, each lake
system presents a unique environment for selective degradation processes. Pigment
concentrations in a statistically significant number of sediment samples from the unanalyzed
Baroon Taiga sediment cores should therefore be determined via HPLC or spectrophotometry
and compared to the spectrally-inferred values at various depths. Only when the spectrally-
inferred values are statistically shown to accurately represent actual pigment concentrations
throughout the sediment sequences can the full sediment profiles be used to represent
paleopigment concentrations, and thereby, paleoproductivity histories. Furthermore, the spectral
index used to infer pigment concentrations (area of the reflectance trough under a curve between
650-700 nm) may not be the most accurate measure of total sedimentary pigment concentrations.
Application of principal component analysis (PCA) to the spectra of all measured samples has
been shown to provide an accurate measure of the spectral features most representative of
pigment concentrations throughout all the samples. Furthermore, comparison of resultant PCA
factors to known pigment and mineralogical spectral libraries in similar lake systems has resulted
in a better understanding of both the specific organisms responsible for the deposition of various
pigments throughout the sediment record, as well as potential erosional histories from clay
mineralogy variations. Such an application of PCA to the Baroon Taiga lake sediment sprectra
should therefore be a priority in any future investigations.

122
6.3 FUTURE PALEOLIMNOLOGICAL ANALYSES
Improving the age-models of cores GAN-B-10-VIII-05, SAN-A-6-VIII-05, AN-A-03, and MUS-
A-7-VIII-05 through the acquirement of more radiocarbon dates is of utmost importance to any
future work. Once more accurate age models are prescribed to the sediment records it is likely
that the inter-core coincident and near-coincident features will become more standardized.
One main assumption of the current study is that the great majority of all organic matter
deposited within the sediment archives of the Baroon Taiga lakes is of aquatic origins. The
records of OM concentration, therefore, are believed to represent internal productivity rates, as
demonstrated in the sediments of lake Sanjin Nuur by Robinson et al (accepted). However, as
each individual system is located at a unique position within the catchment areas, the influx of
terrigenous organic material is likely to vary. An analysis of sedimentary C/N ratios should
therefore by completed for each sediment core to ensure aquatic origins of the OM.
Furthermore, because these lakes are open-basins systems that do not preserve carbonate, the
measurement of the hydrogen isotopic composition (δD) of organic compounds produced by
aquatic plants using compound-specific techniques may provide a tool by which to reconstruct
the past isotopic composition of lake water and the mechanisms that modify that isotopic
composition, namely precipitation, over the Holocene.
6.4 FUTURE FIELDWORK
The potential of sediments from lakes Sanjin Nuur, Ganbold Nuur and Asgat Nuur to provide
relatively high-resolution temperature-sensitive records for the entire Holocene supports the need

123
for a future intensive sediment core retrieval expedition to the Baroon Taiga Mountains Sites.
Furthermore, the retrieval of longer low-resolution records from lake Mustei Nuur stand to
provide the first glacial history of the area extending into the Pleistocene. Therefore, a return to
the Baroon Taiga Mountains sites should be the priority of any future fieldwork centered in
Mongolia.
124
BIBLIOGRAPHY
Abbott, M. B. and Stafford, T. W. 1996. Radiocarbon geochemistry of modern and ancient arctic lake systems, Baffin Island, Canada. Quat Res 45: 300-311.
Andreev, A. A., Siegert, C., Klimanov, V. A., Derevyagin, A. Y. and Shilova, G. N. 2002. Late Pleistocene and Holocene Vegetation and Climate on the Taymyr Lowland, Northern Siberia. Quat Res 57: 138-150.
Baillie, M. G. L. 1999. Exodus to Arthur. Catastrophic encouters with comets. Batsford, London. Balsam, W. l. and Deaton, B. C. 1996. Determining the composition of late Quaternary marine
sediments from NUV, VIS, and NIR diffuse reflectance spectra. Marine Geology 134: 31-55.
Barranco, F. T., Balsam, W. l. and Deaton, B. C. 1989. Quantitative reassessment of brick red lutites: evidence from reflectance spectrophotometry. Marine Geology 89: 299-314.
Berkey, C. P. and Morris, F. K. 1927. Geology of Mongolia. The American Museum of Natural History, New York.
Bohner, J. and Lehmkuhl, F. 2005. Environmental change modelling for Central and High Asia: Pleistocene, present, and future scenarios. Boreas 34: 220-231.
Bolortsetseg, B. and Tuvaansuren, G. 1996. The potential impacts of climate change on pasture and cattle production in Mongolia. Water, Air, and Soil Production 92: 95-105.
Brown, S. R. 1969. Paleolimnological evidence from fossil pigments. Mitt Int Ver Theor Angew Limnol 17: 95-103.
Carpenter, S. R., Elser, M. M. and Elser, J. J. 1986. Chlorophyll production, degradation and sedimentation: Implications for paleolimnology. Limnol Oceanogr 31: 112-124.
Chebykin, E. P., Edgington, D. N., Grachev, M., Zhelenznyakova, T., Vorobyova, S., Kulikova, N. S., Azarova, I. N., Khlystov, O. M. and Goldberg, E. 2002. Abrupt increase in precipitation and weathering of soils in East Siberia coincident with the end of the last glaciation (15 cal kyr BP). Earth and Planetary Science Letters 200: 167-175.
Chester, R. and Elderfield, H. 1966. The infra-red determination of total carbonate in marine carbonate sediments. Chemical Geology 1: 277-290.
Chester, R. and Elderfield, H. 1968. The infrared determination of opal in siliceous deep-sea sediments. Geochimica et Cosmoshimica Acta 32: 1128-1140.
Christensen, L., Coughenour, M. B., Ellis, J. E. and Chen, Z. Z. 2004. Vulnerability of the asian typical steppe to grazing and climate change. Climatic Change 63: 351-368.
Clark, R. N. 1999. Spectroscopy and Principles of Spectroscopy. In: Rencz, A. (eds). Manual of Remote Sensing. John Wilet and Sons,
Crowley, T. J. 2000. Causes of climate change over the past 1000 years. Science 289: 270-277. D'Arrigo, R., Jacoby, G. C., Frank, D. C., Pederson, N., Cook, E., Buckley, B., Nachin, B.,
Mijiddorj, R. and Dugarjav, C. 2001. 1738 Years of Mongolian Temperature Variability
125
Inferred from a Tree-Ring Width Chronology of Siberian Pine. Geophys Res Lett 28: 543-546.
D'Arrigo, R., Jacoby, G. C., Pederson, N., Frank, D. C., Buckley, B., Nachin, B., Mijiddorj, R. and Dugarjav, C. 2000. Mongolian tree-rings, temperature sensitivity and reconstructions of Northern Hemisphere temperature. Holocene 10: 669-672.
Daley, R. J. 1973. Experimental characterization of lacustrine chlorophyll diagenisis. II. Bacterial, viral, and herbivore grazing effects. Arch. Hyrobiol. 72: 409-439.
Daley, R. J. and Brown, S. R. 1973. Experimental characterization of lacustrine chlorophyll diagensis. 1. Physiological and environmental effects. Archiv. Hydrobiol. 72: 277-304.
Das, B., Vinebrooke, R. D., Sanchez-Azofeira, A., Rivard, B. and Wolfe, A. P. 2005. Inferring sedimentary chlorophyll concentrations with reflectance spectroscopy: a novel approach to reconstructing historical changes in the trophic status of mountain lakes. Canadian Jounal of Fisheries and Aquatic Sciences 62: 1067-1078.
Davi, N. K., Jacoby, G. C., Curtis, A. E. and Baatarbilig, N. 2006. Extension of drought records for Central Asia using tree rings: West-Central Mongolia. Journal of Climate 19: 288-298.
Dean, W. E. 1974. Determination of carbonate and organic matter in calcareous sediments and sedimentary rocks by loss on ignition: comparison with other methods. J Sediment Petrol 44: 242-248.
Deaton, B. C. and Balsam, W. l. 1991. Visible spectroscopy - a rapid method for determining hematite and goethite concentration in geological materials. Journal of Sedimentary Petrology 61: 628-632.
deMenocal, P., Ortiz, J., Guilderson, T. P., Adkins, J., Sarnthein, M., Baker, L. A. and Yarusinsky, M. 2000. Abrupt onset and termination of hte African Humid Period: rapid climate responses to gradual insolation forcing. Quat Sci Rev 2000: 347-361.
deMenocal, P. and Rind, D. 1993. Sensitivity of Asian and African climate to variations in seasonal insolation, glacial ice cover, sea-surface temperature, and Asian orography. J Geophys Res 7265-7287.
Ding, Z., Liu, T., Rutter, N. W., Yu, Z., Guo, Z. and Zhu, R. 1995. Ice-Volume Forcing of East Asian Winter Monsoon Variations in the Past 800,000 Years. Quaternary Research 44: 149-159.
Dulmaa, A. 1964. Hydrobiology of Darhat lake hollow. Ulaanbaatar. Fedotov, A., Kazansky, A., Tomurhuu, D., Matasova, G., Ziborova, G., Zhelenznyakova, T.,
Vorobyova, S., Phedorin, M., Goldberg, E., Oyunchimeg, T., Narantsetseg, T., Vologina, E., Yuldashev, A., Kalugin, I., Tomurtogoo, O. and Grachev, M. 2004. A 1-My record of paleoclimates from Lake Khubsugul, Mongolia. EOS 40: 387-390.
Fedotov, A. P., Chebykin, E. P., Semenov, M. Y., Vorobyova, S. S., Osipov, E. Y., Golobokova, L. P., Pogodaeva, T. V., Zhelenznyakova, T. O., Grachev, M. A., Tomurhuu, D., Oyunchimeg, T., Narantsetseg, T., Tomurtogoo, O., Dolgikh, P. T., Arsenyuk, M. I. and De Batist, M. 2004. Changes in the colume and salinity of Lake Khubsugul (Mongolia) in response to global climate changes in the upper Pleistocene and the Holocene. Palaeogeogr Palaeoclimatol Palaeoecol 209: 245-257.
Feng, Z. D. 2001. Gobi dynamics in the Northern Mongolian Plateau durng the past 20,000+ yr: Prelimninary results. Quat Int 76/77: 77-83.
Flanery, M. S., Snodgrass, R. D. and Whitmore, T. J. 1982. Deepwater sediments and trophic conditions in Florida lakes. Hydrobiologia 92: 597-602.

126
Fofonoff, N. P. 1985. Physical properties of seawater: A new salinity scale and equation of state for seawater. Journal of Geophysical Research 90: 3332-3342.
Fogg, G. E. and Belcher, J. H. 1961. Pigments from the bottom deposits of an English lake. New Phytol 60:
Fowell, S. J., Hansen, B. C. S., Peck, J. A., Khosbayar, P. and Ganbold, E. 2003. Mid to late Holocene climate evolution of the Lake Telmen Basin, North Central Mongolia, based on palynological data. Quat Res 59: 353-363.
Furlong, E. T. and Carpenter, S. R. 1988. Pigment preservation and remineralization in oxic coastal marine sediments. Geochim Cosmochim Acta 52: 87-99.
Giosan, L., Flood, R. D., Grutzner, J., Franz, S., Poli, M. and hagen, S. 2001. High-resolution carbonate content estimated from diffuse spectral reflectance for leg 172 sites. In: Keigwin, L. D., Rio, D., Acton, G. D. and Arnold, E. (eds). Proceedings of the Ocean Drilling Program. 1-12.
Gitelson, A. A. 1992. The peak near 700 nm on radiance spectra of algae and water: relationships of its magnitude and position with chlorophll concentration. International Journal of Remote Sensing 13: 3367-3373.
Gitelson, A. A., Schalles, J. F., Rundquist, D. C., Schiebe, F. R. and Yacobie, Y. Z. 1999. Comparative reflectance properties of algal cultures with manipulated densities. Journal of Applied Phycology 345-354.
Gorham, E., Lund, J. W. G., Sanger, J. E. and Dean, W. E. 1974. Some relationships between algal standing crop, water chemistry, and sediment chemistry in the English Lakes. Limnol Oceanogr 19: 601-617.
Grunert, J., Lehmkuhl, F. and Walther, M. 2000. Paleoclimatic evolution of the Uvs Nuur basin and adjacent areas (Western Mongolia). Quat Int 65/66: 171-192.
Gunin, P. D., Vostokova, E. A., Dorofeyuk, N., Tarasov, P. and Black, C. C. 1999. Vegetation Dynamics of Mongolia. Kluwer Academic Publishers, Dordrecht.
Hagerthey, S. E., Louda, J. W. and Mongkronsri, P. 2006. Evaluation of pigment extraction methods and a recommended protocol for periphyton chlorophyll a determination and chemotaxonomic assessment. J Phycol 42: 1125-1136.
Hamilton, R. J. and Sewell, P. A. 1982. Introduction to high performance liquid chromatography. Chapman and Hall, London.
Harrison, S. P., Yu, G. and Tarasov, P. 1996. Late Quaternary lake-level record from Northern Eurasia. Quat Res 45: 138-159.
Heire, O., Lotter, A. F. and Lemcke, G. 2001. Loss on ignition as a merhod for estimating organic and carbonate content in sediments: reproducibitiy and coparability of results. J Paleolimnol 25: 101-110.
Hendry, G. A. F., Houghton, J. D. and Brown, S. B. 1987. The degradation of chlorophyll-a biological enigma. New Phytol 107: 255-302.
Horiuchi, K., Minoura, K., Hoshino, K., Oda, T. and Nakamura, T. 2000. Paleoenvironmental history of Lake Baikal during the last 23000 years. Palaeogeogr Palaeoclimatol Palaeoecol 157: 95-108.
Hunt, G. R. 1977. Spectral signatures of particulate minerals in the visible and near infrared. Geophysics 42: 501-513.
Hurley, J. P. and Armstrong, D. E. 1990. Fluxes and transformations of aquatic pigments in Lake Mendota, Wisconsin. Limnol Oceanogr 35: 384-398.

127
Hurley, J. P. and Armstrong, D. E. 1991. Pigment preservation in lake sediments: a comparison of sedimentary environments in Trout Lake, Wisconsin. Can J Fish Aquat Sci 35: 384-398.
IPCC. 2001. Climate Change 2001: The Scientific Basis. Cambridge University Press, New York.
Iwasaki, H. 2006. Impact of interannual variability of meteorological parameters on vegetation activity over Mongolia. Journal of the Meteorological Society of Japan 84: 754-762.
Jacoby, G. C., D'Arrigo, R. and Davaajamts, T. 1996. Mongolian Tree Rings and 20th-Century Warming. Science 273: 771-773.
Jacoby, G. C., D'Arrigo, R., Pederson, N., Buckley, B., Dugarjav, C. and Mijiddorj, R. 1999. Temperature and precipitation in Mongolia based on dendroclimatic investigations. IAWA Journal 20: 399-350.
Jacoby, G. C., Pederson, N. and D'Arrigo, R. 2003. Temperature and precipitation in Mongolia based of dendroclimatic investigations. Chinese Science Bulletin 48: 1474-1479.
Komatsu, G., Brantingham, P. J., Olsen, J. W. and Baker, V. R. 2001. Paleoshoreline geomorphology of Boon Tsagaan Nuur, Tsagaan Nuur, and Orog Nuur: the Valley of the Lakes, Mongolia. Geomorphology 39: 83-98.
Kondratiev, S. A. 1929. Telmen-Nur and West of Hangai plateau. Journal of Economy of Mongolia 5: 11-16.
Korsman, T., Nilsson, M., Landgren, K. and Renberg, I. 1999. Spatial variability in surface sediment composition by near-infrared (NIR) reflectance spectroscopy. Journal of Paleolimnology 21: 61-71.
Kozhov, M. M. 1965. Lake Huvsgul and opportunities its fish supply utilization. In: (eds). Irkutsk. 198.
Kripalani, R. H. and Kulkarni, A. 1999. Climatology and variability of historical Soviet snow depth data: some new perspectives in snow-Indian monsoon teleconnection. Climate Dynamics 15: 475-489.
Kuznetsov, N. T. 1968. Waters of Central Asia. In: (eds). Nauka. Moscow, 272. Lamb, H. 1965. The early Medieval Warm Epoch and its sequel. Palaeogeogr Palaeoclimatol
Palaeoecol 1: 13-37. Lasker, J. 1990. The chaotic motion of the solar system: A numerical estimate of the size of the
chaotic zones. Icarus 88: 266-291. Leavitt, P. R. 1993. A review of factors that regulate carotenoid and chlorophyll deposition and
fossil pigment abundance. J Paleolimnol 9: 109-127. Leavitt, P. R. and Carpenter, S. R. 1990. Aphotic pigment degradation in the hypolimnion:
Implications for sedimentation studies in paleolimnology. Limnol Oceanogr 35: 520-524. Leavitt, P. R., Carpenter, S. R. and Kitchell, J. F. 1989. Whole-lake experiments: the annual
record of fossil pigments and zooplankton. Limnol Oceanogr 34: 700-717. Leavitt, P. R. and Findlay, D. L. 1994. Comparison of fossil pigments with 20 years of
phytoplankton data from eutropic Lake 227, Experimental Lakes Area, Ontario. Can J Fish Aquat Sci 51: 2286-2299.
Lehmkuhl, F. and Lang, A. 2001. Geomorphological investigations and luminescence dating in the southern part of the Khangay and the Valley of the Gobi Lakes (Central Mongolia). J Quat Sci 16: 69-87.
Lydolph, P. E. 1977. Climates of the Soviet Union. Mackinney, G. 1941. Abosrption of light by chlorophyll solutions. J Biol Chem 140: 315-322.

128
Mann, M., Bradley, R. S. and Hughes, M. K. 1998. Global-scale temperature patters and climate forcing over the past six centuries. Nature 392: 779-787.
Mann, M., Bradley, R. S. and Hughes, M. K. 1999. Northern Hemisphere Temperatures During the Past Millennium: Inferences, Uncertainties, and Limitations. Geophys Res Lett 26: 759.
Mann, M. E. and Jones, P. D. 2003. Global surface temperatures over the past two millennia. Geophys Res Lett 30: 10.1029/2003GL017814.
Martyn, D. 1992. Climates of the World, Developments in Atmospheric Science. Elsevier Press, Amsterdam.
Mayzaud, P. and Razouls, S. 1992. Degradation of gut pigment during feeding be a subantarctic copepod: importance of feeding history and digestive acclimation. Limnol Oceanogr 37: 393-404.
Miyazaki, S., Yasunari, T., Miyamoto, T., Kaihotsu, I., Davaa, G., Oyunbataar, D., Natsagdorj, L. and Oki, T. 2004. Agrometeorological conditions of grassland vegetation in central Mongolia and their impact for leaf growth. Journal of Geophysical Research 109: D22106, doi:22110.21029/22004JD005179.
Morinaga, Y., Tian, S. and Shinoda, M. 2003. Winter snow anomaly and atmospheric circulation in Mongolia. International Journal of Climatology 23: 1627-1636.
Ortiz, J., Mix, A., Harris, S. and O'Connell, S. 1999. Diffuse spectral reflectance as a proxy for percent carbonate content in North Atlantic sediments. Paleoceanography 14: 171-186.
Ortiz, J., O'Connell, S., DelViscio, J., Dean, W. E., Carriquiry, J. D., Marchitto, T., Zheng, Y. and van Green, A. 2004. Enhanced marine productivity off western North America during warm climate intervals of the past 52 k.y. Geology 32: 521-524.
Overpeck, J., Hughen, K. A., Hardy, D. R., Bradley, R. S., Case, R., Douglas, M. S. V., Finney, B., Gajewski, K., Jacoby, G. C., Jennings, A., Lamoureux, S., Lasca, A., MacDonald, G., Moore, J., Retelle, M., Smith, S., Wolfe, A. P. and Zielenski, G. 1997. Arctic environmental change of the last four centuries. Science 278: 1251-1256.
Owen, L. A., Richards, B., Rhodes, E. J., Cunningham, W. D., Windley, B. F., Badamgarav, J. and Dorjnamjaa, D. 1998. Relic permafrost structures in the Gobi of Mongolia: age and significance. Journal of Quaternary Science 13: 539-547.
Owen, L. A., Windley, B. F., Cunningham, W. D., Badamgarav, J. and Dorjnamjaa, D. 1997. Quaternary alluvial fans in the Gobi of southern Mongolia: evidence for neotectonics and climate change. Journal of Quaternary Science 12: 239-252.
Pachur, H. J., Wunnemann, B. and Hucai, Z. 1995. Lake evolution in the Tengger Desert, northwestern China, during the last 40,000 years. Quat Res 44: 171-180.
Pandolfini, E., Thys, I., Leporcq, B. and Descy, J. P. 2000. Grazing experiments with two freshwater zooplankters: fate of chlorophyll and carotenoid pigments. Journal of Plankton Research 22: 305-319.
Peck, J. A., Khosbayar, P., Fowell, S. J., Pearce, R. B., Ariunbileg, S., Hansen, B. C. S. and Soninkhishig, N. 2002. Mid to Late Holocene climate change in north central Mongolia as recorded in the sediments of Lake Telmen. Palaeogeogr Palaeoclimatol Palaeoecol 183: 135-153.
Pederson, N., Jacoby, G. C., D'Arrigo, R., Cook, E. and Buckley, B. 2001. Hydrometeorological Reconstructions for Northeastern Mongolia Derived from Tree Rings: 1651-1995. J Clim 14: 872-881.

129
Poberezhnaya, A. E., Fedotov, A. P., Sitnikova, T. Y., Semenov, M. Y., Ziborova, G. A., Otinova, E. L. and Khabuev, A. V. 2006. Paleoecological and paleoenvironmental records of the Lake Pleistocene record of Lake Khubsugul (Mongolia) based on ostracod remains. J Paleolimnol 36: 133-149.
Poole, R. K. and Kalnenieks, U. 2000. Introduction to light absorption: visible and ultraviolet spectra. In: Gore, M. G. (eds). Spectrophotometry and spectrofluorimetry. Oxford University Press, Oxford, 1-31.
Prell, W. L. and Kutzbach, J. E. 1987. Monsoon variability over the past 150,000 years. J Geophys Res 92: 8411-8425.
Reimer, P. J., Baillie, M. G. L., Bard, E., Bayliss, A., Beck, J. W., Bertrand, C. J. H., Blackwell, P. G., Buck, C. E., Burr, G. S., Cutler, K. B., Damon, P. E., Edwards, R. L., Fairbanks, R. G., Friedrich, M., Guilderson, T. P., Hogg, A. G., Hughen, K. A., Kromer, B., McCormac, G., Manning, S., Ramsey, C. B., Reimer, R. W., Remmele, S., Southon, J. R., Stuiver, M., Talamo, S., Taylor, F. W., van der Plicht, J. and Weyhenmeyer, C. E. 2004. INTCAL04 terrestrial readiocarbon age calibration, 0-26 cal kyr BP. Radiocarbon 46: 1029-1058.
Rein, B. and Sirocko, F. 2002. In-situ reflectance spectroscopy - analysing techniques for high-resolution pigment logging in sediment cores. International Journal of Earth Science 91: 950-954.
Rhodes, T. E., Gasse, F., Ruifen, L., Fontes, J. C., Wei, K., Bertrand, P., Gilbert, E., Melieres, F., Tucholka, P., Wang, Z. and Cheng, Z. Y. 1996. A late Pleistocene-Holocene lacustrine record from lake Manas, Zunggar (northern Xinjiang, western China). Palaeogeogr Palaeoclimatol Palaeoecol 120: 105-121.
Riedinger-Whitmore, M. A., Whitmore, T. J., Smoak, J. M., Brenner, M., Moore, A., Curtis, J. H. and Schelske, C. L. 2005. Cyanobacterial proliferation is a recent response to eutrophication in many Florida lakes: a paleolimnological assessment. Lake and Resevoir Management 21: 423-435.
Robinson, K. D., Abbott, M. B., Rosenmeier, M. F., Soninkhishig, N. and Fitzhugh, W. W. accepted. A 2400 year record of lacustrine productivity from a small lake in the Baroon Taiga Mountains, northern Mongolia. J Paleolimnol
Rontani, J. F., Beker, B., Raphel, D. and Baillet, G. 1995. Photodegradation of chlorophyll phytyl chain in dean phytoplanktonic cells. Journal of Photocehmistry and Photobiology 85: 137-142.
Rosen, P. 2005. Total organic carbon (TOC) of lake water during the Holocene inferred from lake sediments and near-infrared spectroscopy (NIRS) in eight lakes from northern Sweden. Biogeochemistry 76: 503-516.
Sanger, J. E. 1988. Fossil pigments in paleoecology and paleolimnology. Palaeogeogr Palaeoclimatol Palaeoecol 62: 343-359.
Sato, T., Kimura, F. and Kitoh, A. 2007. Projection of global warming onto regional precipitation over Mongolia using a regional climate model. Journal of Hydrology 333: 144-154.
Schalles, J. F., Gitelson, A. A., Yacobie, Y. Z. and Kroenke, A. E. 1998. Estimation of chlorophyll a from time series measurements of high spectral resolution reflectance in an eutrophic lake. Journal of Phycology 34: 383-390.

130
Schotterer, U., Frohlich, K., Gaggeler, H. W., Sandjordj, S. and Stichler, W. 1997. Isotope records from Mongolian and alpine ice cores as climate indicators. Clim Change 36: 519-530.
Severinghaus, J. P. and Brook, E. J. 1999. Abrupt climate change at the end of the last glacial period inferred from trapped air in polar ice. Science 286: 930-934.
Sheer, H. 1991. Structure and occurance of chlorophylls. In: Sheer, H. (eds). Chlorophylls. CRC Press, Boca Raton, 3-31.
Shuman, F. R. and Lorenzen, C. J. 1975. Quantitative degradation of chlorophyll by a marine herbivore. Limnol Oceanogr 20: 580-586.
Soninkhishig, N., Edlund, M. B. and Peck, J. A. 2003. Diatom-based paleoenvironmental reconstruction of Lake Telmen for the last 6230 years. Mongolian Journal of Biological Sciences 1: 55-68.
Stephens, F. C., Louchard, R. M., Reid, R. P. and Maffione, R. A. 2003. Effects of microalgal communities on reflectance spectra of carbonate sediments in subtidal optically shallow marine environments. Limnology and Oceanography 48: 535-546.
Stuiver, M., Grootes, P. M. and Braziunas, T. F. 1995. The GISP2 18O climate record of the past 16,500 years and the role of the sun, ocean, and volcanoes. Quat Res 44: 341-354.
Stuiver, M. and Reimer, P. J. 1993. Extended 14C database and revised CALIB radiocarbon cailbration program. Radiocarbon 35: 215-230.
Stuiver, M., Reimer, P. J., and Reimer, R. W. 2005. CALIB 5.0. [WWW program and documentation]
Stuvier, M., Braziunas, T. F., Grootes, P. M. and Zielinski, G. A. 1997. Is there evidence for solar forcing of climate in the GISP2 oxygen isotope record? Quat Res 48:
Swain, E. B. 1985. Measurement and interpretation of sedimentary pigments. Freshwater Biology 15: 23-75.
Tarasov, P., Dorofeyuk, N. and Metel'Tseva, E. 2000. Holocene vegetation and climate changes in the Hoton-Nur basin, northwest Mongolia. Boreas 29: 117-126.
Tarasov, P., Guiot, J., Cheddadi, R., Andreev, A. A., Bezusko, L. G., Blyakharchuk, T. A., Dorofeyuk, N., Filimonova, L. V., Volkova, V. S. and Zernitskaya, V. P. 1999. Climate in northern Eurasia 6000 years ago reconstructed from pollen data. Earth Planet Sc Lett 171: 635-645.
Tarasov, P., Webb, T., Andreev, A. A., Afanas'Eva, N. B., Berezina, N. A., Bezusko, L. G., Blyakharchuk, T. A., Bolikhovskaya, N. S., Cheddadi, R., Chernavskaya, M. M., Chernova, G. M., Dorofeyuk, N., Dirksen, V. G., Elina, G. A., Filimonova, L. V., Glebov, F. Z., Guiot, J., Gunova, V. S., Harrison, S. P., Jolly, D., Khomutova, V. I., Kvavadza, E. V., Osipova, I. M., Panova, N. K., Prentice, I. C., Saarse, L., Sevastyanov, D. V., Volkova, V. S. and Zernitskaya, V. P. 1998. Present-Day and Mid-Holocene Biomes Reconstructed from Pollen and Plant Macrofossil Data from the Former Soviet Union and Mongolia. Journal of Biogeography 25: 1029-1053.
Tsegmid, S. 1955. From the Past of Valley of Lakes in Mongolian Gobi. Natura 5: Tserensodnom, G. 1971. Lakes of Mongolia. Ulaanbaatar. Vallentyne, J. R. 1957. Carotenoids in 20,000-year old sediment from Searles Lake, California.
Arch. Biochem. Biophysics. 70: 29-34. Vincent, R. K. 1997. Fundamentals of Geologcial and Environmental Remote Sensing. Prentice
Hall, Upper Saddle River.
131
Vinebrooke, R. D., Dixit, S. S., Graham, M. D., Gunn, J. M., Chen, Y. W. and Belzile, N. 2002. Whole-lake algal responses to a century of acidic deposition on the Canadian Shield. Can J Fish Aquat Sci 59: 483-493.
Vinebrooke, R. D. and Leavitt, P. R. 1999. Phytobenthos and Phytoplankton as Potential Indicators of Climate Change in Mountain Lakes and Ponds: A HPLC-Based Pigment Approack. Journal of the North American Benthological Society 18: 15-33.
Wallen, C. C. 1970. Climate of Northern and Western Europe. Elsevier, London. Walther, M. 2002. Lake bottom sediments of Ugii Nuur. Scientific Journal Geographical
Problems 2: 21-44. Wolfe, A. P., Vinebrooke, R. D., Michelutti, N., Rivard, B. and Das, B. 2006. Experimental
calibration of lake-sediment spectral reflectance to chlorophyll a concentrations; methodology and paleolimnological validation. Journal of Paleolimnology 36: 91-100.