A High Heat Flux Flow Boiling Apparatus for the Study of ... · er heat flux. Analytical modeling...
78
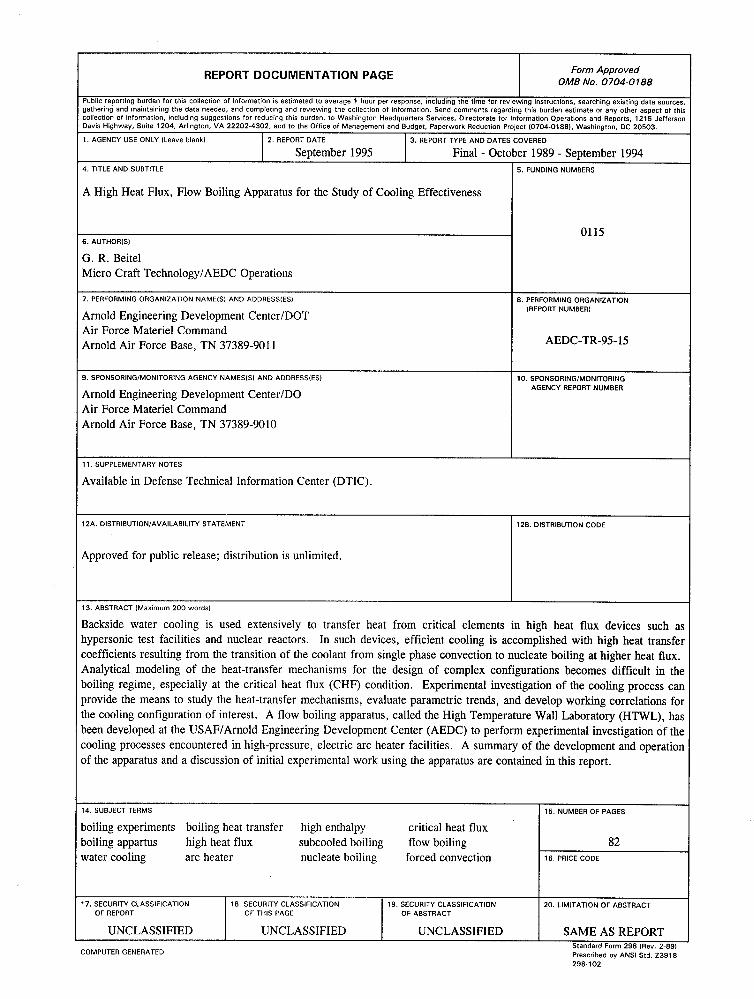
G. R. Beitel Micro Craft TechnologyIAEDC Operations September 1995 Final Report for Period October 1989 - September 1994 Approved for public release; distribution is unlimited.
Transcript of A High Heat Flux Flow Boiling Apparatus for the Study of ... · er heat flux. Analytical modeling...

G. R. Beitel Micro Craft TechnologyIAEDC Operations
September 1995
Final Report for Period October 1989 - September 1994
Approved for public release; distribution is unlimited.

NOTICES
When U. S. Government drawings, specifications, or other data are used for any purpose other than a definitely related Government procurement operation, the Government thereby incurs no responsibility nor any obligation whatsoever, and the fact that the Government may have formulated, furnished, or in any way supplied the said drawings, specifications, or other data, is not to be regarded by implication or otherwise, or in any manner licensing the holder or any other person or corporation, or conveying any rights or permission to manufacture, use, or sell any patented invention that may in any way be related thereto.
Qualified users may obtain copies of this report from the Defense Technical Information Center.
References to named commercial products in this report are not to be considered in any sense as an endorsement of the product by the United States Air Force or the Government.
This report has been reviewed by the Office of Public Affairs (PA) and is releasable to the National Technical Information Service (NTIS). At NTIS, it will be available to the general public, including foreign nations.
APPROVAL STATEMENT
This report has been reviewed and approved.
JERRY F. FAIRCHILD, Capt, USAF Flight Dynamics Technology Applied Technology Division Test Operations Directorate
Approved for publication:
FOR THE COMMANDER
ROBERT T. CROOK
Asst Chief, Applied Technology Division Test Operations Directorate

DISCLAIMER NOTICE
THIS DOCUMENT IS B E S T QUALITY AVAILABLE. THE COPY FURNISHED TO DTIC CONTAINED A SIGNIFICANT NUMBER OF PAGES WHICH DO NOT REPRODUCE LEGIBLY.
REPORT DOCUMENTATION PAGE Form Approved OMB No. 0704-0788
I Public reporting burden for this collection of information is estimated to average 1 hour per response, including the time for reviewing instructions, searching existing data sources, gathering and maintaining the data needed, and completing and reviewing the collection of information. Send comments regarding this burden estimate or any other aspect of this collection of information, including suggestions for reducing this burden, to Washington Headquarters Services, Directorate for Information Ooerations and Reoorts. 1215 Jefferson
I Davis Highway. Suite 1204. Arlington. VA 22202-4302. and to the Office of ~ana&ment and Budoet. Paoerwork Reduction Proiect 10704.01881. washinoton. DC 20503. I I 1 AGENCY USE ONLY (Leave blank) 1 2 REPORT DATE 1 3 REPORT TYPE AN0 DATES COVERED 1
6. AUTHORISI
G. R. Beitel Micro Craft TechnologyIAEDC Operations
September 1995 Final - October 1989 - September 1994
Air Force Materiel Command Arnold Air Force Base, TN 37389-901 1
7. PERFORMING ORGANIZATION NAMEISI AN0 ADDRESS(ES1
Arnold Engineering Development CenterIDOT
I
9. SPONSORING/MONITORING AGENCY NAMESISI AND ADDRESSIESI 1 10. SPONSORING/MONITORING 1
4. TITLE AND SUBTITLE
A High Heat Flux, Flow Boiling Apparatus for the Study of Cooling Effectiveness
8. PERFORMING ORGANIZATION IREPORT NUMBER1
I Arnold Engineering Development CenterlDO
5. FUNDING NUMBERS
Air Force Materiel Command Arnold Air Force Base, TN 37389-9010
I AGENCY REPORT NUMBER I
Available in Defense Technical Information Center (DTIC).
12A. OISTRIBUTION/AVAILABlLlTY STATEMENT
Approved for public release; distribution is unlimited.
128. DISTRIBUTION CODE
I 13. ABSTRACT IMaximum 200 words1
Backside water cooling is used extensively to transfer heat from critical elements in high heat flux devices such as hypersonic test facilities and nuclear reactors. In such devices, efficient cooling is accomplished with high heat transfer coefficients resulting from the transition of the coolant from single phase convection to nucleate boiling at higher heat flux. Analytical modeling of the heat-transfer mechanisms for the design of complex configurations becomes difficult in the boiling regime, especially at the critical heat flux (CHF) condition. Experimental investigation of the cooling process can provide the means to study the heat-transfer mechanisms, evaluate parametric trends, and develop working correlations for the cooling configuration of interest. A flow boiling apparatus, called the High Temperature Wall Laboratory (HTWL), has been developed at the USAFIArnold Engineering Development Center (AEDC) to perform experimental investigation of the cooling processes encountered in high-pressure, electric arc heater facilities. A summary of the development and operation of the apparatus and a discussion of initial experimental work using the apparatus are contained in this report.
boiling appartus high heat flux subcooled boiling flow boiling water cooling arc heater nucleate boiling forced convection 16. PRICE CODE 1 14. SUBJECT TERMS
boiling experiments boiling heat transfer high enthalpy critical heat flux
15. NUMBER OF PAGES
I UNCLASSIFIED I UNCLASSIFIED 1 UNCLASSIFIED I SAME AS REPORT I
I
I I I I I Standard Form 298 (Rev. 2-89]
COMPUTER GENERATED Prescribed by ANSI Std. 23918
17. SECURITY CLASSIFICATION OF REPORT
18. SECURITY CLASSIFICATION OF THIS PAGE
19. SECURITY CLASSIFICATION OF ABSTRACT
20. LIMITATION OF ABSTRACT

PREFACE
The work reported herein was performed by the Arnold Engineering Development Center (AEDC), Air Force Materiel Command (AFMC), under Program Element 65807F. The Air Force Program Managers were Capt. D. G. Burgess, Maj. H. Martin, and Capt. P. Zeman, DOT. The work was performed by Micro Craft Technology, support contractor for aerodynamic testing at AEDC, AFMC, Arnold Air Force Base, TN. The work was performed in the Aerospace Systems Facility (ASF) and the Technology and Development Facility (TDF) under AEDC Project Number DDOl (Job Number 01 15). The work was conducted during the period between 1 October 1989 and 30 September 1994. The manuscript was submitted for publication on August 10, 1995.
---- .--.. ---.-. Acct:;ion For
NT[3 T;R:,Pc! -. DTlC i A [ j
Ui I < ~ . ~ I ~ c > A .,::t:< CI jc-tlfii'9lion
- ---"- ..... .......

CONTENTS
............................................................ 1.0 INTRODUCTION 5 2.0 BACKGROUND ................................................................ 6
............................................... 3.0 EXPERIMENTAL APPARATUS 7 3.1 Power Requirements and Electrical System .................................. 7 3.2 Coolant Requirements and Demineralized Water System ...................... 9 3.3 Test Section Assembly . . . . . . . . . . . . . . . . . . . . . . . . . . . . . . . . . . . . . . . . . . . . . . . . 10 3.4 Instrumentation and Data Acquisition ..................................... 12 3.5 Data Reduction ......................................................... 14
4.0 TEST PROCEDURE ........................................................... 15 5.0 SYSTEM PERFORMANCE AND DATA UNCERTAINTY ....................... 16 6.0 SUMMARY ............................................................... 20
REFERENCES ................................................................. 20
Figure ILLUSTRATIONS
Pag.e
Arc Heater Nozzle Heating/Cooling ........................................... 25 HTWL System Schematic . . . . . . . . . . . . . . . . . . . . . . . . . . . . . . . . . . . . . . . . . . . . . . . . . . . 26
............ Power Supply Requirements for an Electrically Heated Stainless-Steel Tube 27 . . . . . . . . . . . . . . . . . Power Supply Requirements for an Electrically Heated Amzirc Tube 30
. . . . . . . . . . . . . . . . . . . . . . . . . . . . . . . . . . . . . . . . . . . . . . . . . . . . HTWL Equipment Layout 33 .............................. Ballast Resistor Bank and Water Flow System Details 34
..................................... HTL High-pressure Demineralized Water Pump 35 HTWL Test Section Assembly .................................................... 36
.............................................................. HTWL Test Section 38 ......................... Theoretical Temperature Distribution of HTWL Test Section 41
HTWLControlRoom .......................................................... 43 .................................. HTWL Data Acquisition and Monitoring Systems 44 .................................. HTWL Demineralized Water System Performance 45
.................................................. Rectifier Output Characteristics 47
.................................................. Ballast Resistor Characteristics 49 ...................... Magnetic Flux Density Measurements in HTWL Control Room 51
Typical HTWL Test Results .................................................... 52 Posttest HTWL Test Section .................................................. 56
................................................... Rectifier Ripple Characteristics 57

TABLES Table
. . . . . . . . . . . . . . . . . . . . . . . . . . . . . . . . . . . . . . . . . . . . . . . 1 . Basic Measurement Uncertainty 60 ................................................. 2 . Calculated Parameter Uncertainty 62
APPENDICES
. . . . . . . . . . . . . . . . . . . . . . . . . . . . . . . . . . . . . . . . . . . . . A . Test Section Material Properties 63 . . . . . . . . . . . . . . . . . . . . . . . . . . . . . . . . . . . . . . . . . . . . . . . . B . Power Computation Procedure 69
. . . . . . . . . . . . . . . . . . . . . . . . . . . . . . . . . . . . . . . . C . Data Reduction Computational Approach 70
............................................................. NOMENCLATURE 78

1.0 INTRODUCTION
The work reported herein was performed by the Arnold Engineering Development Center (AEDC), Air Force Materiel Command (AFMC), under Program Element 65807F. The Air Force Program Managers were Capt. D. G. Burgess, Maj. H. Martin, and Capt. P. Zeman, DOT. The work was performed by Micro Craft Technology, support contractor for aerodynamic testing at AEDC, AFMC, Arnold Air Force Base, TN. The work was performed in the Aerospace Systems Facility (ASF) and the Technology and Development Facility (TDF) under AEDC Project Number DDOl (Job Number 01 15). The work was conducted during the period between 1 October 1989 and 30 September 1994.
Electric arc heaters have been used at the AEDC for the simulation of reentry flight heating at pressures up to 150 atm and mass average enthalpy of 4.65 - 9.3 x loh J/kg (2000 - 4000 Btullbm) in air. Corresponding heat flux levels to the wall of the arc heater nozzles are as high as 9 x lo7 W/m2 (8,000 Btu/ft2 sec), and future test conditions will require nozzles to survive 200 atm (Ref. 1) at heat flux levels up to 1.25 x lo8 W/m2 (1 1,000 Btu/ft2 sec). Backside subcooled, forced convection cooling with high-pressure demineralized water is currently used to balance the heat load originating from the high-temperature gas flowing through the nozzle (Fig. I). In order to accommodate the higher heat loads, there is current interest in exploiting the backside water cooling concept to the limit of its capability. In addition to air-side heating prediction and favorable material characteristics, the thermostructural design of advanced nozzle concepts requires reasonable estimates of cooling heat- transfer coefficients and limitations (i.e., burnout limit or critical heat flux condition) of water cooling, as discussed in Ref. 2.
Efficient cooling of arc heater nozzles is accomplished with high heat-transfer coefficients resulting from the transition of the coolant from single-phase convection to nucleate boiling at high- er heat flux. Analytical modeling of the heat-transfer mechanisms for the design of complex configurations becomes difficult in the boiling regime, especially at the critical heat flux (CHF) condition. Experimental investigation of the cooling process can provide the means to study the heat-transfer mechanisms, evaluate parametric trends, and develop working correlations for the cooling configuration of interest. A flow boiling apparatus, called the High Temperature Wall Laboratory (HTWL), has been developed at the USAFIAEDC to perform experimental investigation of the cooling processes encountered in high-pressure, electric arc heater facilities. A summary of the development and operation of the apparatus and a discussion of initial experimental work using the apparatus are contained in this report.

2.0 BACKGROUND
Once a cooling process has transitioned into boiling, theoretical approaches for determining heat-transfer characteristics have limited application because of difficulties in obtaining interaction or interface properties of the two phases. Moreover, no theory has yet been created for forced convection, or flow, boiling burnout (Ref. 3). Many researchers have resorted to developing correlations based on microscopic bubble mechanisms, dimensional analysis, fairing of test data, or a combination of these. Reasonable confidence in predicting heat-transfer information in the partial nucleate boiling and fully developed nucleate boiling regimes has been shown by Bergles and Rohsenow, Ref. 4, and Rohsenow, Ref. 5, respectively (see also Guglielmini, et al, Ref. 6); however, considerable disagreement between the large number of CHF correlations exists. Gambill (Ref. 7) compared several CHF correlations for water flow in a tube and found that prediction of CHF at higher coolant velocity, using the correlations, varied by nearly a factor of four and by a factor of two at lower velocity. Factors of two or greater between correlation predictions at higher coolant mass velocity have also been noted by Zeigarnik, et a1 (Ref. 8) and Boyd (Ref. 9), and the disagreement tends to worsen as mass velocity increases. Empirical CHF correlations typically have been derived for a specific range of experimental conditions, and extrapolation of a correlation outside the specific range can lead to very large errors. In addition, a given analytical CHF correla- tion typically has enough "adjustable" constants in the predictive equations to permit an acceptable correlation of a specific data set; however, general application of the correlation to various config- urations or test conditions may result in significant errors (Ref. 10). As recommended in Ref. 11, among the more appropriate CHF correlations for subcooled, forced convection water flow are those proposed by Bernath (Ref. 12), Van Huff and Rousar (Ref. 13), Rousar (Ref. 14), Yagov and Puzin (Ref. IS), Levy (Ref. 16), and Labuntsov (Ref. 17).
Various flow boiling experiments performed in the past have provided insight to the boiling heat-transfer mechanisms and parametric trends which have aided in the development of working correlations. Resistance heating, or Joule heating, has been used by researchers (boiling heat transfer) for a number of years to produce the necessary heat flux from a surface to be cooled (Ref. 11). The heat flux level is more easily determined from a simple energy balance in a Joule heating configuration, where other heating techniques such as secondary fluid heating (e.g., steam) or cartridge heaters introduce more complex energy conversion. Though numerous external flow boil- ing experiments have been performed (Ref. 3), boiling heat transfer is sensitive to the coolant flow geometry and heated wall configuration; therefore, internal flow boiling data on configurations closely representing arc heater nozzle cooling passages are more appropriate for the analysis of cooling processes in an arc heater configuration. Internal flow boiling has been studied primarily with tubes and annuli, where significant differences in heat-transfer data have been noted between tubes and annuli of the same length and equivalent diameter (e.g., Refs. 18 and 19). In addition, more than 20 parameters have been identified that affect the CHF in flow boiling (Ref. 20). Further

flow boiling experimentation is required because of the sensitivity of boiling heat-transfer data to geometry and test conditions, and the large uncertainty resulting from the extrapolation of current boiling heat-transfer correlations to the arc heater cooling requirements.
3.0 EXPERIMENTAL APPARATUS
In order to verify the predictive approaches and, if necessary, develop a more appropriate CHF correlation for the arc heater nozzle cooling conditions, an experimental boiling apparatus, called the High Temperature Wall Laboratory (HTWL), was developed at the AEDC. The desired heat flux at the surface/coolant interface on the inner wall of an annulus is achieved by passing high current through a thin-walled tubular metallic test section, thereby producing Joule heating. The annular configuration was selected for the experimental studies since it represents the coolant flow geometry of the current arc heater nozzles. Heat flux levels as high as 2 x lo8 W/m2 (18,000 Btu/ft2 sec) are desired in the apparatus for the study of future nozzle concepts. This maximum heat flux level, coolant flow requirements anticipated in advanced nozzle concepts, instrumentation require- ments for the definition of operating conditions, and reasonable machining size limitations dictate the overall size and configuration of the test section and support systems. A schematic of the apparatus and support systems is shown in Fig. 2.
3.1 POWER REQUIREMENTS AND ELECTRICAL SYSTEM
The peak heat flux occurs near the throat of an arc heater nozzle where, for the baseline nozzle configuration under consideration, the inner diameter of the annular cooling channel is approximately 1 in. (Ref. 1). By selecting a low-cost, machinable, low electrical conductance metal such as 304 stainless steel (material properties given in Appendix A), and following the computation approach outlined in Appendix B, the power supply requirements necessary to achieve up to 2 x lo8 W/m2 (18,000 Btu/ft2 sec) in a 25.4-mm (I-in.), 19-mm (0.75-in.), and a 12.7-mm (0.5-in.) diam tube are approximated, as shown in Fig. 3'. As pointed out in Ref. 11, the heated wall material has been shown to have a possible effect on boiling heat transfer; therefore, consideration of the actual copper-zirconium (Amzirca) nozzle material should be included. Be- cause copper and its alloys have very high electrical conductivity, the materials require very high power in resistance heating to reach the heat flux levels identified above. Figure 4 illustrates the high power requirements for a 25.4-mm (1-in.), 19-mm (0.75-in,), and a 12.7-mm (0.5-in.) diam Amzirc tube.
'This analysis assumes a mean material temperature that is computed from the HTWL data reduction program discussed in Section 3.5, Data Reduction. The computation of the mean temperature requires an energy balance of the heated wall and cooling fluid, which is accounted for in the heat-transfer data reduction. This mean temperature is used here to determine reasonable values of the material resistivity. Note that the same mean temperature is used for the different materials, i.e., no material effects on the heat-transfer process are assumed.

Experimental results have shown that an a-c type of power source can adversely affect the boiling process (Ref. 11). Therefore, two 16,000-amp d-c rectifiers manufactured by Rapid Power Technologies were selected for the HTWL test section heating. The rectifiers, when operated in a parallel mode, would provide up to 32,000 amps at 100 volts (3.2 MW) for heating of the HTWL test section. Specifically, the high heat flux condition discussed previously could be achieved with a 25.4-mm (1.0-in.) diam 304 stainless-steel tube with a 0.76-mrn (0.030-in.) thick wall (Fig. 3a). Material effects would be evaluated with 12.7-mm (0.5-in.) diam, 0.25-mm (0.010-in.) thick tubes2 of various materials including Amzirc (Fig. 4c) and stainless steel (Fig. 3c). One disadvantage of the rectifiers is that peak performance is achieved when the rectifiers are operated at the peak volt- age output of 100 volts. The test section length to be heated, material type, and internal temperature drive the voltage drop in the system; therefore, an optimum test section length of 150 mm (6.0 in.) was selected, and an adjustable water-cooled ballast resistor bank was added to the electrical system to allow operation of the rectifiers at peak voltage output for improved power accuracy. When test sections with low voltage drop are used (e.g., Amzirc and copper), an additional voltage drop is set at the ballast resistor bank to operate the rectifiers near 100 volts. The actual uncertainty of the pow- er levels provided by the rectifiers is discussed in Section 5.0, Performance and Data Uncertainty. Current loss into the cooling water of the resistor bank was determined to be negligible (less than 1 mA with raw water cooling). The rectifiers are routinely operated up to 100 percent (1.6 MW) pow- er in the current control mode. Rectifier output from 1.6 MW to 3.2 MW requires operation in the voltage control mode with limited duration.
The mezzanine of the High Temperature Laboratory (HTL) was selected as the site for HTWL primarily because of the proximity of the 6900-V electrical feed required by the rectifiers and the high-pressure demineralized water system in the building. Figure 5 shows the layout of the HTWL equipment positioned on the HTL mezzanine. The 6900-V electrical feed provides power to the rectifiers through a pad-mounted switch. Power for the rectifier controls is supplied by the building 480-V system. The high current, low voltage power provided by the rectifiers is fed to the ballast resistor bank and test section assembly through eight 38-mm (1.5-in.) diam, 777.7 MCM insulated cables. The ballast resistor bank is made up of eight tubes (four for each rectifier) made of standard 19-mm (0.75-in.) diam Sch-40 304 stainless-steel pipe. The insulated power cables are attached to the tube elements with copper lugs. Copper jumper plates between pairs of the tubes allow the length to be varied from zero to 2.75 m (9 ft). Such an arrangement allows voltage drops in the elements from zero to 80 volts to be set. Each pipe is electrically isolated from ground by plexiglasm supports and high-pressure flexible hoses at the inlet and exit. The tube elements are cooled by low-pressure (7 bar or 100 psi) raw water through upstream and downstream manifolds. Details of the ballast resistor bank are shown in Fig. 6.
2Extremely thin tubes (less than 0.25-mm thick wall) are difficult to instrument, easily damaged, and have higher volt- age requirements than are capable with the selected rectifiers and are, therefore, not considered.

A ground fault protection system prevents the rectifiers from being started should a ground fault be present anywhere in the high energy electrical system. In addition, the ground fault system will phase back and shut down the rectifiers during operation if a ground fault occurs at any power setting. For example, during initial testing of a large diameter test section, which had a small coolant flow annulus, the test section failed at burnout and bent against the stainless-steel water jacket. Because the test section shell and the water jacket were grounded through the test stand (isolated later with Plexiglas spacers), a ground path for the high electrical energy occurred. The ground fault protection system detected the fault and shut down the rectifiers before significant damage to the hardware could occur. Because small current paths to ground typically exist in the HTWL circuit (e.g., conductance through the demineralized water adjacent to the energized test section) and the fact that the level changes with rectifier power setting, an adjustable trigger point for the ground fault system is provided.
3.2 COOLANT REQUIREMENTS AND DEMINERALIZED WATER SYSTEM
The existing closed-loop, high-pressure demineralized water system used by the AEDC arc facilities is capable of high volumetric flows (2500 liters per min or 650 gpm) at a pressure up to 100 bar (1500 psi). Coolant velocity at the throat of the baseline nozzle configuration is approximately 30.5 d s (100 fps) with a total mass flow rate of approximately 5 kglsec (1 1 l b d sec) or 300 liters per min (80 gpm). Future pumping requirements may necessitate higher pressure coolant flow; however, the high cost for such a system in a continuous flow facility will probably limit operation in the foreseeable future to coolant pressure below 100 bar. Therefore, the closed- loop, high-pressure demineralized water system is adequate for constant coolant inlet temperature studies in the HTWL.
The closed-loop circuit (Fig. 2) incorporates an existing Bingham high-pressure pump (Fig. 7) and heat exchanger located in the HTL, and connection to the high-pressure loop for HTWL supplylreturn is below the mezzanine near the H2 Arc Heater Facility. Because the existing closed- loop water system pumps approximately 2500 liters per min (650 gpm), a bypass loop in the HTWL system allows mass flow variation over a broad range with the velocity being set at the test section by the annular flow area. Strainers with 0.254-mm (0.01-in.) mesh are located upstream and down- stream of the test section to prevent contaminants from entering the test section or returning to the pump. Isolation valves in the HTWLM2 flow loops permit quick changeover between the two installations. The entire circuit is constructed of 304 stainless steel except for short sections of high- pressure flexible hose used to electrically isolate the HTWL test section. A 51-mm (2-in.) diam throttling valve (Annin Co. globe valve) and Grove pressure regulator upstream of the test section and a 51-mm (2-in.) diam flow control valve (Kent Introl Ltd. globe valve with pneumatic positioner) downstream are used to adjust flow conditions at the test section and maintain flow stability in the circuit (see discussion in Ref. 11 concerning flow loop instabilities). A 51-mm (2-

in.) diam Hoffer Flow Controls turbine flowmeter is installed upstream of the coolant pressure regulator and inlet manifold. High-pressure pump capabilities permit run times up to 30 min. The bulk coolant temperature is fixed at approximately room temperature, and the water conductivity is limited to approximately 100 pSlcm. The dissolved oxygen content is typically 4 ppm or 31.5 percent of saturation.
3.3 TEST SECTION ASSEMBLY
The HTWL test section assembly (Fig. 8) currently in use simulates the annular flow arrange- ment that is incorporated in the cooling passage of an arc heater nozzle. The actual arc heater nozzle and associated cooling passages are convergingldiverging by design (Fig. I), and, consequently, parameters such as the coolant mass velocity, static pressure, subcooling, acceleration, and heat flux distribution vary along the length of the nozzle. Because more than 20 parameters have been shown to influence flow boiling heat transfer and CHF (Refs. 11 and 20), the test section assembly in HTWL was designed such that individual parametric trends could be evaluated. Figure 8b shows a cutaway of the test section assembly, revealing the heated horizontal tubular test section and annular flow channel.
Electrical energy enters the assembly by way of eight large electrical cables clamped to four copper tabs on one end of the test section assembly. The energy passes through a copper flange and test section end piece to the test section which is electron beam welded to the copper end pieces. The electrical energy passes out of the assembly through a copper flange and cable attachments, similar to the way it enters. All electrical conducting components of the test section assembly, except the test section tube, are fabricated from electrolytic tough-pitch copper. The nonconducting portions of the assembly are fabricated from 304 stainless steel and are insulated from the conduct- ing components by ~ i c a r t a @ and C-11 glasslepoxy insulating materials. In addition, the entire test section assembly is insulated from the test stand/support structure by Plexiglas spacers. Cool-Amp Silver Plating Powder and Burndy Penetrox A Anti-Oxidation Coating are used where slip fit/ electrical contact assembly is required. As shown in Fig. 8b, the downstream test section end piece includes a piston assembly to allow for test section thermal expansion which, in some cases, can be as large as 2.5 mm (0.1 in.).
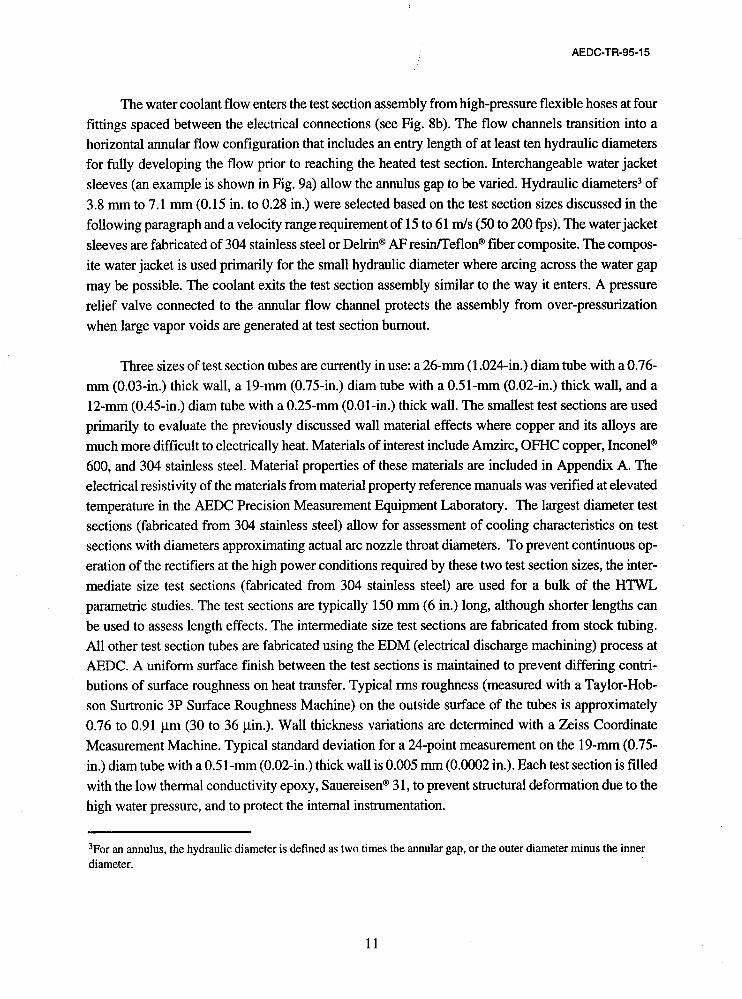
The water coolant flow enters the test section assembly from high-pressure flexible hoses at four fittings spaced between the electrical connections (see Fig. 8b). The flow channels transition into a horizontal annular flow configuration that includes an entry length of at least ten hydraulic diameters for fully developing the flow prior to reaching the heated test section. Interchangeable water jacket sleeves (an example is shown in Fig. 9a) allow the annulus gap to be varied. Hydraulic diameters3 of 3.8 mm to 7.1 mm (0.15 in. to 0.28 in.) were selected based on the test section sizes discussed in the following paragraph and a velocity range requirement of 15 to 61 m/s (50 to 200 fps). The water jacket sleeves are fabricated of 304 stainless steel or Delrina AF resin/Teflon@ fiber composite. The compos- ite water jacket is used primarily for the small hydraulic diameter where arcing across the water gap may be possible. The coolant exits the test section assembly similar to the way it enters. A pressure relief valve connected to the annular flow channel protects the assembly from over-pressurization when large vapor voids are generated at test section burnout.
Three sizes of test section tubes are currently in use: a 26-mm (1.024-in.) diam tube with a 0.76- mm (0.03-in.) thick wall, a 19-mm (0.75-in.) diam tube with a 0.51-mrn (0.02-in.) thick wall, and a 12-mm (0.45-in.) diam tube with a 0.25-mm (0.01-in.) thick wall. The smallest test sections are used primarily to evaluate the previously discussed wall material effects where copper and its alloys are much more difficult to electrically heat. Materials of interest include Amzirc, OFHC copper, Inconel@ 600, and 304 stainless steel. Material properties of these materials are included in Appendix A. The electrical resistivity of the materials from material property reference manuals was verified at elevated temperature in the AEDC Precision Measurement Equipment Laboratory. The largest diameter test sections (fabricated from 304 stainless steel) allow for assessment of cooling characteristics on test sections with diameters approximating actual arc nozzle throat diameters. To prevent continuous op- eration of the rectifiers at the high power conditions required by these two test section sizes, the inter- mediate size test sections (fabricated from 304 stainless steel) are used for a bulk of the HTWL parametric studies. The test sections are typically 150 mm (6 in.) long, although shorter lengths can be used to assess length effects. The intermediate size test sections are fabricated from stock tubing. All other test section tubes are fabricated using the EDM (electrical discharge machining) process at AEDC. A uniform surface finish between the test sections is maintained to prevent differing contri- butions of surface roughness on heat transfer. Typical rms roughness (measured with a Taylor-Hob- son Surtronic 3P Surface Roughness Machine) on the outside surface of the tubes is approximately 0.76 to 0.91 pm (30 to 36 pin.). Wall thickness variations are determined with a Zeiss Coordinate Measurement Machine. Typical standard deviation for a 24-point measurement on the 19-mm (0.75- in.) diam tube with a 0.51-mm (0.02-in.) thick wall is 0.005 mm (0.0002 in.). Each test section is filled with the low thermal conductivity epoxy, Sauereisena 31, to prevent structural deformation due to the high water pressure, and to protect the internal instrumentation.
3For an annulus, the hydraulic diameter is defined as two times the annular gap, or the outer diameter minus the inner diameter.

The tubular test sections are press fit onto the copper end pieces approximately 7.6 mm (0.3 in.). The initial method of using high-temperature silver solder to attach the test section tubes to the copper end pieces was found to be unsuccessful when damage to internal instrumentation and leaks from the joints were noted in early testing. Subsequent joints made with the AEDC electron beam welding technique yielded satisfactory results. A hydrostatic pressure test bottle is used to leak check the test section welds prior to installation in the HTWL apparatus. Figure 9a shows a 19-mm (0.75-in.) diam, stainless-steel test section welded to the electrolytic tough pitch copper end pieces, and a closeup of the electron beam weld is shown in Fig. 9b.
3.4 INSTRUMENTATION AND DATA ACQUISITION
Generally, the most important measurements to be made in a flow boiling apparatus are the coolant conditions, the energy dissipated at the test section, and the surface temperature of the test section. Instrumentation in the HTWL to monitor and record coolant temperature, pressure, and flow rate at various points in the flow circuit allows determination of the coolant conditions. This instrumentation includes absolute temperature (type T thermocouples) and pressure (0-2000 psi Viatran pressure transducers) measurements in the inlet and outlet coolant manifolds and differential temperature measurements between the manifolds. Coolant flow rate is determined from a 51-mm (2-in.) diam Hoffer Flow Controls turbine flowmeter installed upstream of the cool- ant pressure regulator and inlet manifold. In addition, the total flow rate and inletfoutlet pressures of the high-pressure demineralized water pump are monitored in the HTL main control room during an HTWL run. Absolute pressure of the coolant is measured with 0-2000 psi Teledyne Tabor pressure transducers at various axial locations (at the outside wall of the annulus) along the length of the test section. Coolant pressure drop (Statham Pressure Transducer) and a high-speed pressure measurement (Kulitem Pressure Transducer) are also recorded at the test section.
Several methods are used to determine the power or energy existing at the test section. A discussion of the actual approaches used in determining various energy balances is included in Section 3.5, Data Reduction. Instrumentation used to support the energy balance computations include d-c current (internal rectifier shunt) and voltage for each rectifier, the total power produced by each rectifier (measured with an Ohio Semitronics Model PC8 Watt Transducer), the true rms current and voltage for each rectifier (measured with an Ohio Semitronics Model VT8 Variable Frequency Voltage Transducer), and the test section d-c voltage drop. The test section rms voltage drop is proportional to the average rms voltage for the rectifiers.
Probably the most difficult measurement is the surface temperature of the test section. Ideally, a surface temperature at the heated wall and coolant interface is desired for heat-transfer analyses. In reality, an intrusive measurement would affect the wall heat transfer or disrupt the coolant flow pattern, and a non-intrusive measurement of surface temperature at the interface is very difficult, if

not impossible, to make. In the HTWL test sections, No. 30 (0.25-mm or 0.01-in. diam) type K thermocouples are attached to the inside wall of the test section at various stations along its length, permitting the coolant/wall interface temperature (on the opposite side of the wall) to be determined analytically. A discussion of the inferred coolant/wall interface temperature computations is included in the next section and Appendix C. The thermocouples are typically spot welded to the wall of the larger diameter test sections and glued with the high thermal conductivity epoxy, East- man P-10, in the smaller, thin-walled (0.25-rnm thick wall) test sections. In both installations, one leg of the thermocouple is attached directly to the surface, and the junction is made approximately 0.75 mm (0.03 in.) above the surface, as recommended by Hughes in Ref. 21. This arrangement prevents erroneous temperature indications from a voltage drop produced by the current flow in the test section. No separation of the thermocouple wires from the tube surface, caused by thermal expansion of the test section, has been noted in posttest inspections. Steady-state temperature response from epoxied and spot-welded thermocouples on a representative test section compared within l.l°C (2°F) in a laboratory oven up to 480°C (900°F). In addition, only a slight conduction effect, due to the presence of the thermocouples, was verified using the 2-D axisymmetric heat conduction program TRAX (Ref. 22). Teflon insulated thermocouples were used during initial test- ing; however, internal test section temperatures exceeded the vaporization temperature of the Teflon, and shorting of the thermocouple wires was experienced. The problem was alleviated by switching to braided glass insulated thermocouples, although, care had to be exercised when using the thermocouple wire in a damp environment. As mentioned previously, each test section is filled with the low thermal conductivity epoxy, Sauereisen 31, to provide additional protection to the internal thermocouple wires.
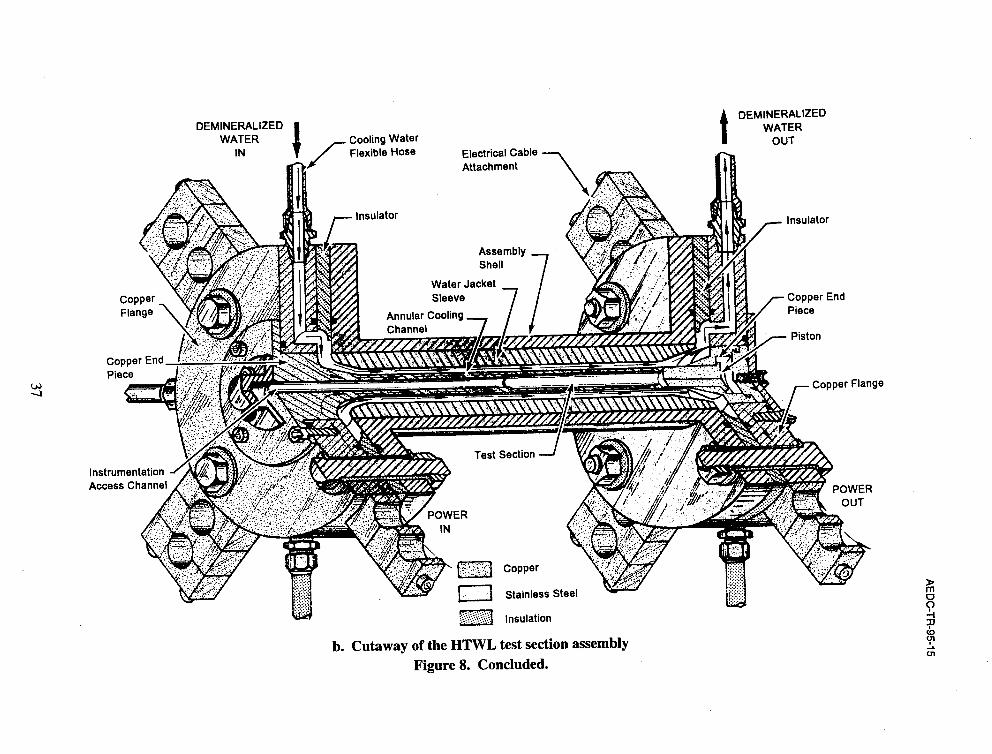
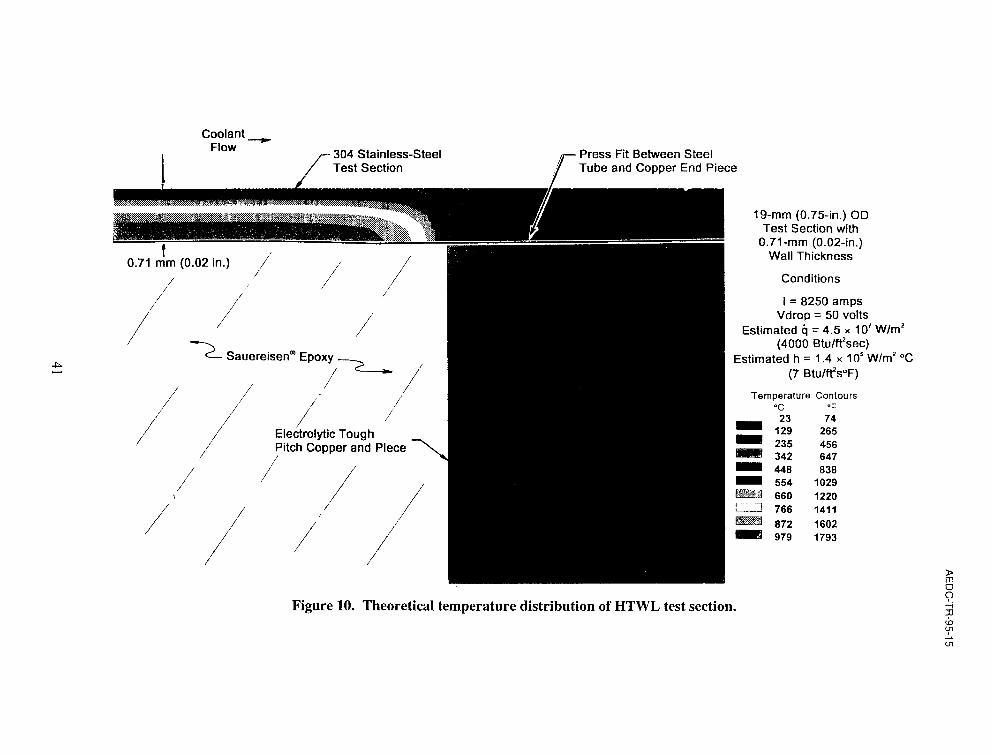
The critical heat flux in a flow boiling apparatus typically occurs at the most downstream location of the heated test piece, and surface temperature, therefore, is of primary interest at that location. Conduction heat-transfer effects in the tubular test sections, caused by the presence of the copper end pieces, necessitate analytical modeling of the configuration for the determination of the best placement of the thermocouples near the ends of the test section for accurate temperature measurement. The 3-D thermostructural computer code, ANSYSB, is used to model the conduction heat-transfer effects in the test sections of different size and material at various power levels. The code also allows for the inclusion of temperature sensitive material properties such as the thermal and electrical conductivities. Figure 10 shows a typical temperature distribution of an HTWL test section with the copper end pieces. It was found that placement of the thermocouples at least 10 mm (0.4 in.) from the ends of the heated portion of the test sections reduced the conduction effect to an acceptable level.
Additional instrumentation in the HTWL includes type T thermocouples on each ballast element. The thermocouples are electrically isolated from the current carrying ballast elements with thin mica sheets. Type T thermocouple probes in the raw water supply and return manifolds for the

ballast resistor bank provide cooling water temperature monitoring. Analog pressure gages located in the demineralized water and raw water manifolds allow for quick assessment of water pressure conditions. Because of the high water pressure and high electrical energy present in the apparatus, a modular control room was installed on the HTL mezzanine near the HTWL apparatus (Figs. 5 and 11) to protect the HTWL data acquisition system, ground fault protection system, and personnel. Remote control of the rectifiers and operation of the HTWL flow control devices are possible from the control room. The thermocouple harnesses are twisted (approximately three turns per inch) and shielded between the apparatus and the control room to reduce interference caused by the proximity of the high current flow in the test section and electrical feed cables. In order to further isolate the test section thermocouple measurements, each signal is fed through a Preston Amplifier prior to sampling by the data acquisition system. Monitoring of the rectifier performance (a-c ripple effects) is accomplished with a rack-mounted Tektronix 8300 XWB Oscilloscope (Fig. 11) and a portable Tektronix 2445 Trigger Oscilloscope.
Approximately 60 channels of data are recorded during each run with a NefP Instrument Corp. Model 470 data acquisition system (Fig. 11). Steady-state data are typically recorded at 20 samples per sec for a 5-sec burst at each power setting. Thermocouple ice point references and system calibration are provided by the Neff, although external ice point references are required by the test section thermocouples since the Preston amplifiers are used. The Neff 470 also permits real- time monitoring of pertinent measurements during a run. In addition, the Neff provides contact closures based on adjustable parameter limits for use as system interlocks. Currently, the Neff initiates rectifier shutdown if a low limit on demineralized water flow rate or a high limit on ballast resistor element temperatures is reached. A schematic of the data acquisition and monitoring systems is presented in Fig. 12.
3.5 DATA REDUCTION
Raw data from the Neff data acquisition system are averaged for each power setting and used as the primary input for the FORTRAN data reduction program. The data reduction program is used to compute various energy balances, demineralized water coolant conditions, total heat flux generated at the HTWL test section, and the steady-state internal temperature distribution in the test section.
Several methods are used to determine the power or energy introduced to the test section. One method involves an energy balance using the coolant mass flow and temperature rise measurements at the test section. Another method makes use of the current flow and the voltage drop across the test section. A slight variation of this method makes use of the test section material resistivity rather than the test section voltage drop. The actual power produced by each rectifier is measured with an Ohio Semitronics Model PC8 Watt Transducer for comparison with each of the energy computation

methods mentioned. The heat flux based on the energy dissipated is then computed using the test section geometry.
An accurate calculation of the temperature distribution in the HTWL test section is required to determine the surface temperature at the test section walVcoolant interface. Initial methods used to compute the steady-state temperature distribution included a simple integration of the steady- state 1-D planar and radial conduction heat-transfer equations with uniform volumetric heat generation. Because the methods assume constant material properties and little effect of the extreme convection boundary condition, a more appropriate 1-D axisymmetric finite difference approach was chosen to achieve higher accuracy. The approach allows for temperature-dependent material properties (thermal and electrical conductivity), and hence, nonuniform internal heat generation. In addition, the flow of current is allowed to redistribute within the wall thickness, depending on the local material resistance. An adiabatic wall is assumed on the inside surface of the test section where the low thermal conductance epoxy is present in the actual configuration. An initial estimate of the convective heat-transfer coefficient on the outside surface of the test section is obtained from boiling heat-transfer correlations such as those discussed in Ref. 11. Gauss-Seidel iteration with relaxation is used to reach a steady-state temperature solution. Once a temperature distribution solution meeting the selected error criteria is reached, the convective heat-transfer coefficient is adjusted until the computed inside surface temperature matches the experimentally measured wall temperature from the test section thermocouples. The coefficient adjustment procedure may be by- passed if the measured wall temperature is known to be in error.
Because of possible voltage losses in the actual HTWL hardware, the input test section voltage drop is adjusted such that the final calculated total current matches the measured current at a given power level from the HTWL experiment. An additional total heat flux value is computed from summation of the individual element heat fluxes in the finite difference temperature calculation.
A more complete discussion of the data reduction equations is provided in Appendix C.
4.0 TEST PROCEDURE
Installation and removal of the HTWL test section are relatively straightforward. The electrical contact surfaces of the test section copper end pieces (including the downstream piston assembly) are coated with Cool-Amp Silver Plating Powder and Burndy Penetrox A Anti-Oxidant to prevent arcing between the slip fit surfaces. The downstream end piece cap is then installed. Following the cleaning of the test section surface with denatured alcohol, the two halves of the water jacket are assembled around the test section. The assembly is then slipped into the test section assembly shell (Fig. 8b), assuring that the alignment pin hole in the water jacket is aligned with the alignment pin port on the shell. Once aligned, the alignment pin is installed with the appropriate o-

ring. The stainless-steel upstream cap and copper downstream cap are installed with the appropriate o-rings. Concentricity of the test section with the water jacket is verified by measuring the distance from selected instrumentation port faces to the test section with a depth gage. Hookup of the test section thermocouples to the permanent thermocouple patch panel completes the installation. Removal of the test section upon test completion is accomplished in the reverse order.
The HTWL demineralized water circuit is filled using a 57 liters per min (15 gpm) makeup pump (Union Pump Co. Model TD-50) and venting air out of the circuit through the vent valves on top of the HTWL test section and inlet and outlet manifolds. Once the circuit is filled (water discharge from vent lines), the vent valves are closed and the circuit is pressurized to 34.5 bar (500 psi), using the makeup pump for leak check purposes. The ballast resistor bank is adjusted to the desired length based on the voltage drop anticipated at the test section. Low-pressure raw water flow is established at the ballast resistor bank. The HTWL control room power, rectifier control power, data acquisition system, and computer are turned on, and instrumentation calibration is ini- tiated using the Neff data acquisition system.
A typical run sequence begins with the manual startup of the rectifier cooling fans. Water flow through the apparatus is established using the HTL high-pressure demineralized water pump. The coolant flow rate and pressure at the test section are then adjusted to the planned test condition. The ground fault panel is then reset prior to rectifier startup. Electrical power to the test section is initiated by closing the power feed circuit breaker, starting each rectifier at a low output level, and slowly increasing power to the first set point. Following stabilization of various measurements, approximately 5 sec of data are acquired with the Neff data acquisition system, after which the power is slowly increased to the next power set point. At least two power cycles are performed with each test section prior to burnout to assess aging effects or identify other data hysteresis. The estimated CHF (based on pretest predictions and data acquired previously at the same test conditions) is approached slowly with small increments in power until the test section fails at burn- out. Test section failure is accompanied by a change in power demand from the rectifiers which, in turn, phases back the rectifiers to a negligible power setting prior to shutdown. The use of a burnout detector to prevent test section destruction is not possible because of the speed and intensity of the transition from nucleate to film boiling (Ref. 11). Demineralized water conductivity and dissolved oxygen content levels are recorded prior to and after each run with an Omega Engineering Inc. Model PHH- 10 Conductivity/Temperature/PH Meter and a Cole Parmer Model 5946-70 Dissolved Oxygen Meter, respectively.
5.0 SYSTEM PERFORMANCE AND DATA UNCERTAINTY
Initial test results obtained after shakedown and checkout of the HTWL aided in the definition of the performance envelope and operating characteristics of various support systems. Figure 13

presents the flow performance envelope for the three test sections discussed in Section 3.3. The available volumetric flow rate at a given inlet manifold pressure measured just upstream of the HTWL test section is shown in Fig. 13a and at a given test section exit pressure (burnout location) in Fig. 13b. The water jackets selected for each test section provided for hydraulic diameters of 3.76 mm (0.148 in.) for the 26-mm (1.024-in.) diam tube, 5.08 mm (0.2 in.) for the 19-mm (0.75-in.) diam tube, and 7.06 mm (0.278 in.) for the 12-mm (0.45-in.) diam tube. The optimum setting for the demineralized water bypass valve, which resulted in the highest mass flow achievable, yet providing for safe starting and operation of the high-pressure pump, was found to be one-fifth open. Generally, the highest output pressures from the HTL high-pressure demineralized water pump are achieved with a makeup pump suction pressure of 48.3 bar (700 psi). Higher pressures are attain- able at the higher flow rates; however, the pump is limited to operation below 124 bar (1800 psi) at the pump discharge or approximately 114 bar (1650 psi) at the inlet manifold.
Rectifier performance is presented in Fig. 14. Each of the two rectifiers was operated in the current control mode up to 100-percent power output by installing a solid copper test section and using the maximum available ballast resistor length. Shown in Fig. 14a are the d-c current output and rms current output (the actual output of each rectifier made up of the d-c signal with an a-c com- ponent riding on the d-c waveform) for each rectifier. Also included in the figure are the combined d-c and rms current outputs of the two rectifiers since power requirements typically necessitated the parallel operation of the rectifiers. Figure 14b shows the power output of the rectifiers up to 100 percent. Voltage limitation of the ballast resistor bank prevented the output of the full 1.6 MW of power at 100 percent for the solid test section. As mentioned previously, the rectifiers may be op- erated up to 200 percent for limited run times.
The ballast resistor voltage and surface temperature characteristics as a function of rectifier rms current are presented in Fig. 15. As in the rectifier performance checks, a solid copper test section with a negligible voltage drop was used to obtain the ballast resistor characteristics. The maximum voltage drop that can be obtained across the ballast resistor elements is 80 volts (Fig. 15a). Surface temperatures on the elements remain below 140°C (300°F), as shown in Fig. 15b.
Electromagnetic fields generated by the high power electrical systems were of concern for personnel safety and control room equipment reliability, and were evaluated during initial testing in HTWL. Magnetic flux density (MFD) measurements were performed with an F. W. Bell Model- 9500 Gaussmeter in order to quantify the level of electromagnetic interference in the HTWL control room during rectifier operation. Figure 16 presents the a-c (unfiltered) and d-c MFD measurements as a function of total rectifier power. The a-c MFD did not change with rectifier operation or measurement location in the control room; however, d-c MFD measurements showed considerable effects of rectifier power level and location of the measurement within the control room. The maximum d-c MFD levels were recorded near the floor of the control room, and are shown in Fig.

16 along with the maximum values recorded at chest height throughout the room. No differences in the MFD levels were detected with the absence of 6900-V power fed to the HTL building and with 6900-V power to the rectifiers with zero output (i.e., no change in MFD levels with or without the presence of the 6900-V power feed).
Figure 17 presents typical data acquired in the HTWL for a 19-mm (0.75-in) diam, 304 stainless-steel test section at the noted test conditions. The curve presented in Fig. 17a is a pretest prediction of the boiling curve using Kays and Leung (Ref. 23) correlation for pure forced convection, Bergles and Rohsenow (Ref. 4) correlation for transition from pure convection to fully developed nucleate boiling, and the Rohsenow (Ref. 5) nucleate boiling correlation in the boiling regime. As can be seen in Fig. 17a, lower wall temperatures have been noted in the experiments than are predicted by the above correlations; however, good agreement is shown near burnout. A possible cause for the discrepancy may be the inaccuracy in the wall temperature measurement. As noted previously, care had to be exercised in preventing the braided glass insulation from becoming wet. The presence of a small amount of moisture on the thermocouple leads resulted in considerable noise in the temperature measurements. A possible correction for the moisture problem would be to incorporate metallic-sheathed thermocouple leads. The CHF predictions from the correlations of Bemath (Ref. 12), Van Huff and Rousar (Ref. 13), Rousar (Ref. 14), Yagov and Puzin (Ref. 15), Levy (Ref. 16), and Labuntsov (Ref. 17) are also shown in Fig. 17a. The CHF occurred at the most downstream station of the test section, and therefore, the data presented in the figure were measured at that particular station. The correlations of Labuntsov and Rousar best predicted the CI-IF in this particular test; however, neither correlation included data from annular configurations.
Figure 17b shows a comparison of the various heat flux calculations. The total heat flux (q TOT) from the hardware is determined from the rms current and voltage measured at the rectifiers and, therefore, has the largest value because of energy losses in the electrical cables, ballast resistor, and attachments. The test section measured heat flux (q ,) is determined similarly to the total heat flux, except that the rms voltage drop across the test section assembly is used instead of the rectifier voltage. The heat flux computed from the coolant temperature rise through the test section assembly (q ,,) and the heat flux calculated from a summation of the element internal heat generation in the finite difference routine (q ,,,) agree within 6 percent at all but the lowest power settings.
Typical dependance of the pressure drop across the test section assembly on heat flux is illustrated in Fig. 17c. As heat flux is initially increased, the pressure drop decreases because of decreasing friction factor (see Ref. 24). As boiling begins and becomes well established, the pressure drop increases. As shown in Fig. 17c, the pressure drop across the 150-mm (6-in.) long test section is small at the elevated pressure and velocity for the particular test.

The effects of boiling at elevated heat flux has not been detected in the form of pressure oscillations. Figure 17d presents typical high-speed pressure measurements for low power settings where no boiling could exist and higher settings where boiling was suspected. Only slight differences between the nonboiling and boiling results can be seen in the figure.
Burnout of the test sections typically occurred at the most downstream location of the heated tube as shown in Fig. 18. Because the bulk fluid temperature is highest and the thermal boundary layer is largest at this location, it follows that the cooling would be less efficient, thereby promoting burnout. However, during preliminary testing in the HTWL, a few burnouts occurred at the most upstream location on the test pieces. Typically, the upstream burnouts occurred at lower power settings indicating premature failure due to structural anomalies or an inadequate weld. Such problems would cause coolant leakage to the interior of the test piece, deterioration of the internal epoxy support, and eventual collapse and melting of the heated tube wall.
The rectifier ripple, or the a-c component that rides on the d-c output signal, contributes a significant amount to the uncertainty of the instantaneous power output of the rectifiers. The ripple for the two rectifiers was measured during the rectifier performance checks using the solid test section described previously. The measured ripple for each rectifier is shown in Fig. 19a, and the actual waveforms are presented in Fig. 19b. Because the rectifiers are operated near the maximum voltage output of 100 volts, the ripple accounts for approximately 5 to 7 percent uncertainty in the instantaneous power output. Use of rms values for rectifier current and voltage in the dissipated energy and heat flux equations minimizes the effects of ripple on the time-averaged data uncertainty. Uncertainty in the rms current and voltage is primarily measurement device and data system inaccuracies.
Additional factors which contribute to the uncertainty in the energy dissipated at the test section include variations in the test section wall thickness and material properties. The wall thickness variations are determined by the AEDC Precision Inspection Laboratory, as described in Section 3.3. The test section material density and electrical resistivity from literature were verified by personnel in the AEDC Precision Measurement Equipment Laboratory. Uncertainty of the test section wall thickness and material properties along with measurement uncertainty of other instrumentation used in the HTWL are included in Table la.
In general, instrumentation calibration and data uncertainty estimates were made using methods recognized by the National Institute of Standards and Technology (NIST). Measurement uncertainty is a combination of bias and precision errors defined as:

where U,,, is the root sum of squares uncertainty, B is the bias limit, S is the standard deviation about a mean value of the measurement process, "n" is the number of experiment periods from which the samples were used in determining the mean value (taken here to equal one), and the multiplier "2" assumes 10 or more samples associated with S and is used to ensure a 95-percent coverage for the uncertainty limits.
In addition to the uncertainty, the type and range of measuring device, the type of recording device, and the method of calibration for each measurement are provided in Table 1. Propagation of the bias and precision errors of measured data through the calculated data was made in accordance with Ref. 25, and the results are presented in Table 2.
6.0 SUMMARY
In conclusion, a new high heat flux, flow boiling apparatus for the study of cooling effectiveness has been developed at the AEDC. The current application of HTWL is for the evaluation of cooling processes encountered in high-pressure, electric arc heater facilities, particularly arc heater nozzles. The facility is capable of providing up to 3.2 MW of power to a metallic test section, simulating heat flux levels in excess of 2 x lo8 W/m2 (18,000 Btu/ft2 sec), with a water flow rate up to 9 kglsec (20 lbrn/sec) at pressure up to 100 bar (1500 psi). The current test section configuration allows for the determination of parametric effects in annular flow. Early heat-transfer data from HTWL show some disagreement with pretest predictions in the fully developed nucleate boiling regime and at CHF. Additional testing in the HTWL has been performed, and reduced data are available under separate cover from AEDC. Future analyses of the data are planned so that more accurate prediction of cooling requirements for actual arc heater nozzles may be accomplished.
REFERENCES
1. Shope, F. L. "Conceptual Thermal Design of a 200-atm, Water-Cooled Arc Heater Nozzle." AIAA-93-2879, presented at the AIAA 28th Thermophysics Conference in Orlando, FL, July 1993.
2. Shope, F. L. "Conjugate Conduction/Convection/Nucleate-Boiling Heat Transfer with a High-Speed Boundary Layer." Journal of Thermophysics and Heat Transfer, Vol. 8, No. 2, April-June 1994, pp. 275-281.
3. Lienhard, J. H. "Burnout on Cylinders." Journal of Heat Transfer, Vol. 110, November 1988, pp. 1271-1286.

4. Bergles, A. E. and Rohsenow, W. M. "The Determination of Forced-Convection Surface- Boiling Heat Transfer." Journal of Heat Transfer, Vol. 86, August 1964, pp. 365-372.
5. Rohsenow, W. M. "Heat Transfer with Evaporation." Heat Transfer ... A Symposium, Summer 1952, Chapter 4, Eng. Res. Inst., Univ. of Mich., Ann Arbor, published in 1953, pp. 101-149.
6. Guglielmini, G., Nannei, E., and Pisoni, C. "Survey of Heat Transfer Correlations in Forced Convection Boiling." Multiphase Transport - Fundamentals, Reactor Safety, Applications, edited by T. N. Veziroglu, Vol. 1, 1980, pp. 845-861.
7. Gambill, W.R. "Burnout in Boiling Heat Transfer - Part 11. Subcooled Forced-Convection Systems." Nuclear Safety, Vol. 9, No. 6, November-December 1968, pp. 467-480.
8. Zeigarnik, Yu. A., Privalov, N. P., and Klimov, A. I. "Critical Heat Flux with Boiling of Sub- cooled Water in Rectangular Channels with One-Sided Supply of Heat." Thermal Engineer- ing, Vol. 28, No. 1, 198 1, pp. 40-43.
9. Boyd, R. D. "Subcooled Flow Boiling Critical Heat Flux (CHF) and Its Application to Fusion Energy Components. Part 11. A Review of Microconvective, Experimental, and Correlational Aspects." Fusion Technology, Vol. 7, January 1985, pp. 31-52.
10. Bergles, A. E. "Burnout in Boiling Heat-Transfer. Part 11: Subcooled and Low-Quality Forced- Convection Systems." Nuclear Safety, Vol. 18, No. 2, March-April 1977, pp. 154-167.
11. Beitel, G. R. "Boiling Heat Transfer Processes and Their Application in the Cooling of High Heat Flux Devices." AEDC-TR-93-3 (ADA266086), May 1993.
12. Bernath, L. "A Theory of Local-Boiling Burnout and Its Application to Existing Data." Chemical Engineering Progr. Symp. Series, Vol. 56, No. 30, 1960, pp. 95-1 16.
13. Van Huff, N. E. and Rousar, D. C. "Ultimate Heat Flux Limits of Storable Propellants." 8th Liquid Propulsion Symposium, CPIA Report 121, Vol. 11,1966.
14. Rousar, D. C. "Correlation of Burnout Heat Flux for Fluids at High Velocity and High Sub- cooling Conditions." M.S. Thesis, Univ. of California Davis, 1966.

Yagov, V. V. and Puzin, V. A. "Burnout Under Conditions of Forced Flow of Subcooled Liquid." Thermal Engineering, Vol. 32, No. 10,1985, pp. 569-572.
Levy, S. "Prediction of the Critical Heat Flux in Forced Convection Flow." General Electric Report GEAP-3961, June 1962.
Labuntsov, D. A. "Critical Thermal Loads in Forced Motion of Water Which is Heated to a Temperature Below the Saturation Temperature." Soviet Atomic Energy, Vol. 10, No. 5, March 1962, pp. 516-518.
Becker, K. M. and Hernborg, G. "Measurement of Burnout Conditions for Flow of Boiling Water in a Vertical Annulus." Journal of Heat Tranfer, August 1964, pp. 393-407.
Zenkevich, B. A., Kirillov, P. L., Alekseev, G. V., Peskov, 0. L., and Sudnitsyn, 0. A. "Heat Transfer Burnout in Water Flow Through Round Tubes and Annuli." Proceedings of the 4th International Heat Transfer Conference, Vol. VI, Paper No. B6.13, 1970.
Boyd, R. D. "Subcooled Flow Boiling Critical Heat Flux (CHF) and Its Application to Fusion Energy Components. Part I. A Review of Fundamentals of CHF and Related Data Base." Fu- sion Technology, Vol. 7, January 1985, pp. 7-30.
Hughes, T. G. "Critical Heat Fluxes for Curved and Straight Surfaces During Subcooled Flow Boiling." PhD Thesis, Penn State Univ., TM-74-194 (ADIA-003 036), June 1974.
Rochelle, J. K. "TRAX - A Finite Element Computer Program for Transient Heat Conduction Analysis of Axisymmetric Bodies." MS Thesis, University of Tennessee, June 1973.
Kays, W. M. and Leung, E. Y. "Heat Transfer in Annular Passages -Hydrodynamically Developed Turbulent Flow with Arbitrarily Prescribed Heat Flux." International Journal of Heat Mass Transfer, Vol. 6, 1963, pp. 537-557.
Bergles, A. E. and Dormer, T., Jr. "Subcooled Boiling Pressure Drop with Water at Low Pressure." International Joumal of Heat Mass Transfer, Vol. 12, 1969, pp. 459-470.
Abernethy, R. B. and Thompson, J. W. "Handbook Uncertainty in Gas Turbine Measure- ments." AEDC-TR-73-5 (AD755356), February 1973.

26. Aerospace Structural Metals Handbook, Vol. 4, Baitelle - Columbus Lab., Purdue Publishing, 1993.
27. ASM Handbook, Vol. 2, Properties and Selection: Nonferrous Alloys and Special-Purpose Materials, ASM International, 1992.
28. Thermophysical Properties of Matter, Vol. 1, Thermal Conductivity-Metallic Elements and Alloys, Plenum Publishing, New York, 1970.
29. Thermophysical Properties of Matter, Vol. 4, Specific Heat-Metallic Elements and Alloys, Plenum Publishing, New York, 1970.

High Enthalpy Air Flow
Water Cooling Flow
-Zirconium Nozzle
\ \ \ \ \ \ \ \ \ \
Water _t Nucleate Boiling
d 0 . 0 o o '"0 .,..O
h i 5 1 1 1 1 Water Cooling Flow
Heat Flux
Figure 1. Arc heater nozzle heatinglcooling.

Inlet Test Outlet
Strainer
I I Isolation Valve Isolation Valve
---+I I
Bypass Valve
- r .c - .L - I / - - \ f
A
c A -
> Pump Heat Exchanger (400-1 000 psi)
High-Pressure Pump
(1000 psi) Figure 2. HTWL system schematic.
Leqend Demineralized Water
I---- Electrical Power -.-.- Raw Water

,.0 1 x sdw
e '~u
a~
~n
=)


Wall Thickness, mm
I I I I ' I I
Heat Flux Mean Mat'l Wlm2 Temp., K,
(Bturrtzsec) (OF)
2 x 10' 110s (18,m) (1534)
1 . 7 ~ 1 0 ' fog4
(15,OOo) (1509)
1.1 x 10' 1080 (1 0 , m ) (1 484)
0.57 x 10' 1066
(5,000) (1460)
a 1 I
Wall Thickness, in.
c. Outside diameter of 0.5 in. (12.7 mm) Figure 3. Concluded.

Wall Thickness, mm
Wall Thickness, in.
0 0.25 0.50 0.75 1 .OO 1.25 1.50
a. Outside diameter of 1 in. (25.4 mm)
140
130 -
120
110 m
X
= 100
Y,
90 m C
c 80 2 L 3 0 70
60
50
40
30
Figure 4. Power supply requirements for an electrically heated Amzirc tube.
1 I 1 I I
Heat Flux Mean Mat'l Wlmz Temp.. K,
(~tulft~sec) (OF)
2 x 10' 1108
(1 8,000) (1 534) 1 7 x 1 ~ ' 1094
' (1 5,000) (1 509)
-
0 1080
- (10,000) (1484)
-
'
0 5 7 = 1 0 8 1066 - (5,000) 11 460)
-
-
-
I
0 0.01 0.02 0.03 0.04 0.05 0.06


Wall Thickness, mm
0 0.25 0.50 0.75 1 .OO 1.25 2.50 70
60
3 50 0 r X
U) Q
I 1 I Heat Flux Mean Mat'l Wlm2 Temp., K,
(Btufflzsec) - (OF)
2 x 10' 1108 (1 8,000) ('534)
- 1 7 x 10' 1094
(1 5.000) (1 509)
- 1 1 x 10\080
(lo.000) (1484)
5 40 - u- C 2 0.57 x 10' 1066 L S (5,000) (1460) 0 30 -
20 -
10 I I I
0 0.01 0.02 0.03 0.04 0.05 0.06
Wall Thickness, in.
c. Outside diameter of 0.5 in. (12.7 mm) Figure 4. Concluded.


a. HTWL test section Figure 8. HTWL test section assembly.
DEMINERALIZED WATER Cooling Water
IN Flex~ble Hose Electrical Cable ---\
b. Cutaway of the HTWL test section assembly Figure 8. Concluded.
DEMINERALIZED WATER t OUT

a. 19-mm-diam stainless-steel test section and water jacket Figure 9. HTWL test section.

Coolant - Flow / 304 Stainless-Steel
Test Section Press Fit Between Steel r Tube and Copper End Piece
Figure 10. Theoretical temperature distribution of HTWL test section.


Rectifier DC Current
Rectifier DC Voltage
Rectifier RMS Current
Rectifier Power
Test Section Water Flow Rate
Test Section Pressures
Demineralized Water Manifold Pressures
Test Section High-Speed Pressure Response
Demineralized Water Manifold Temps & \T's
Raw Water Manifold Temps
Ballast Resistor Element Temps
Test Section Temps
Test SectionlBallast Resistor Total Voltage Drop
Rest~foer Control
TIC Wnre
TIC Wire
TIC Wore
Figure 12. HTWL data acquisition and monitoring systems.

lnlet Manifold Pressure, psia
0 200 400 600 800 1000 1200 1400 1600 600 I I I I I I I I
\\ '[I Bypass Valve Setting: 20% open 6 5 - 150
25_ TI . 500 - D, = 7.06 mm (0.278 in.)
C .- E D, = 5.08 mm (0.2 in.) &
400 - e Q) D, = 3.76 mm (0.148 in.) u .- - d C
300 - G 0 .- L .c1
Q) g 200 - - >O PSud,,, = 27.6 bar (400 psi)
100 -
0 I 0 20 40 60 80 100 120
lnlet Manifold Pressure, bar
a. Inlet manifold conditions Figure 13. HTWL demineralized water system performance.


Run C23, 3130193 Solid Test Section 100% Ballast Length
- 0 10 20 30 40 50 60 70 80 90 100
Input Control Power, percent
a. Current characteristics Figure 14. Rectifier output characteristics.


90 - Ballast Length,
percent Full Length
80 - Runs C24 - C27,2/9 - 14/94 Solid Test Section Single Rectifier Operation
70 -
60 - U) C, - 0 >
g 50 -
m u - 8
40 -
30 -
20 -
RMS Current, amps
a. Voltage drop Figure 15. Ballast resistor characteristics.


7
Run C28, 9/9/94 6 - Solid Test Section D-C Near Floor
Dual Rectifier
u, 5 - u,
A-C
8
D-C, Chest Height
n . a I a a I I
Total Rectifier Power, kW
Figure 16. Magnetic flux density measurements in HTWL control room.

a. Boiling curve at burnout location (test section exit) Figure 17. Typical HTWL test results.
10 100 1000 iil 0
90000
80000
70000
N
E 60000
I I I * I 1 t 1 a I ~ ~ s s v ~
CHF predictions Run 025 Bernath (Ref. 12) - Test Section: 304 Stainless Steel - -
19mm diam OD Yagov 8 Puzin - 17.6-mm diam ID (Ref. 15)
Annulus: 24mm diam OD Dh = 5.1 mm
. Coolant: Demineralized Water - G = 30,818 kglm2sec Levy (Ref. 16) ,
= 55.5 bar Van Huff 81 Rousar (Ref. 13) - - Tb(iniet) = 25°C
7 2 v' A
7000 m
6000
5 ATSub(inlet) = 247OC Labuntsov (Ref. 17) = - Experiment CHF Y Symbols: Test Data Rousar (Ref. 14) - 2
50000 - u Q Q) - I g 40000. u m - 3 0 - - z 30000 -
20000 - -
Pretest Prediction 10000 - of Boiling Curve -
0 1 10 100
5000 % V)
Nu t 3 z
4000 2 J G u Q Q)
3000 .cI Q) Q - s U -
2000
1000
1000 T w i l l - Tbu~k, OC

Calculated Wall Temperature, OF
0 50 100 150 200 250 300 Calculated Wall Temperature, OC
b. Comparison of heat flux computation methods Figure 17. Continued.

Calculated Heat Flux, ~tul f t~sec
3.94 0 1000 2000 3000 4000 5000 6000
I I I I I I
Run 025 57.0
3.92 - Test Section: 304 Stainless Steel 19-mm diam OD 17.6-mm diam ID
3-90 . Annulus: 24-mm diam OD Dh = 5.1 mm
Coolant: Demineralized Water 3.88 - G = 30,818 kglm2sec
P,,, = 55.5 bar Tb(inlet) = 2S°C
5 3.86 - ATsub(inlet) = 247OC P Symbols: Test Data
f 3.84 - n 5 3.82 - U) U) aJ
Calculated Heat Flux, kwlm2
c. Pressure drop across test section Figure 17. Continued.

Pres
sure
, bar
V
IV
IV
IV
IV
IV
IV
IV
IV
IV
IV
I
~U
IV
IV
IV
I~
VI
VI
VI
VI
en
w
oL
~L
Li
nb
4b
00
P
"
""
"'
VI
m
2.p
0
5
In
2.
VI
w 5
W K-
w
0.
0
w
0.
VI
W 2
g.
VI
Pres
sure
, psi
Pres
sure
, bar
w~
2g
gg
gg
2
%
0
0
h)
P
U8
.m
O
h)
Pres
sure
, psi
Pres
sure
, bar
U
I~
VI
VI
~V
IV
Il
VI
VI
VI
VI
r
rr
rr
PP
PP
PP
V
Ir
Jl
en
~0
~0
-.
NW
PV
I
g,-...--...1
3- Og
gz
zz
zz
e
nC
mO
h)
Pe
n0
Pres
sure
, psi
Pres
sure
, bar
U
IV
IU
lV
ItJ
lU
IV
IV
IV
IV
IV
I
rr
rr
r?
'zg
g$
g
$7"'"
" "..
. -
,
? ~
gg
zz
zz
z
mm
0h
)P
en
m
Pres
sure
, psi


1
1000 2000 3000 4000 5000 6000 7000 8000 9000 RMS Current, amps
a. Ripple as a function of rms current Figure 19. Rectifier ripple characteristics.

b. Rectifier ripple waveforms Figure 19. Continued.

b. Concluded Figure 19. Concluded.


Table 2. Calculated Parameter Uncertainty
Parameter
TOT, ETOT ~ S Y S , ESYS k1.4 k0.5 k1.49 ~ C A L C , ECALC k3.2 k0.71 k3.3 dl~s, E~~ k2 k0.71 k2.1 Coolant Velocity, Mass Velocity k1.3 k0.32 k1.34 Calculated Wall Temperature k3.2 k0.71 53.3 Test Section Voltage Drop-rms k2 k0.71 -12.1
Precision Limit, 2s % of Calculated Value
k2
Bias Limit, B % of Calculated Value
k0.71
Uncertainty, URSs % of Calculated Value
52.1

APPENDIX A TEST SECTION MATERIAL PROPERTIES


Temperature, OF
u- / Ref. 26, Non-Ferrous Alloys, p. 6 m OFHC Copper I
Amzirc 0.12 g .- 0 al P V)
0.10
OSo9 1 -* Room temp only; slope matched with OFHC Copper.
Temperature, OK
b. Specific heat Figure A-1. Continued.

Temperature, O F
c. Thermal conductivity Figure A-1. Continued.
0.07
0.06
!k 0.05 %
s a 0.04 '
C, >; .- > .- u 0
0.03 C 0 0 -
0.02 " E Q) r I-
0.01
0
5
4 .
Y
E- 0
5 - 3 . E .- > .- u 0 J w C
5 2 . - E L Q)
if 1 .
0
Temperature, OK
0 500 1000 1500 2000 I 1 I I I
Ref. 28. p. 68 -
a\/- - -
,f Ref. 28, p. 985
OFHC copper -
-
- Amzirc
-
- 304 Stainless Steel
Inconel" 600
- - 200 400 600 800 1000 1200 1400 1600


APPENDIX B POWER COMPUTATION PROCEDURE
Compute the surface area As and the cross-sectional area Acs based on selected tube diameter, length, and wall thickness:
I; d,, , L in m
A,, = 4 ~n ( d i - d : ) A,, in m2 d, di in m
Compute the energy required to reach the desired heat flux from:
Compute the resistance of the tubular test section:
p, in ohm-m L in m A,, in m2 R in ohm
Compute the current from:
Compute voltage from:
Ein W R in ohm 1 in amps
E in W I in amps V in volts

APPENDIX C DATA REDUCTION COMPUTATIONAL APPROACH
The primary calculations performed in the data reduction program include the energy balancetheat flux computations and the radial temperature distribution in the heated test section (for the walVcoolant interface temperature determination).
Enerwmeat Flux
The total rectifier energy is calculated from:
where I,,,, is the sum of the rms current output for the two rectifiers, and VRECdv, is the average voltage output of the rectifiers.
The corresponding heat flux is then:
where A, is the outside surface area of the test section.
A somewhat more accurate test section result may be obtained by using the measured voltage drop across the test section assembly rather than the rectifier voltage, thereby avoiding power cable, ballast resistor, and attachment losses:
The corresponding heat flux is:

The heat flux at the test section may also be determined by performing an energy balance on the coolant as it proceeds through the test section assembly. For an open system with no work and uniform, steady-state flow with negligible changes in kinetic and potential energy, the conserva- tion of energy equation reduces to:
where m is the mass flow of the coolant, and the enthalpy change for an incompressible substance
is given as:
1 ' e x i t - hinrer = ' o v g ( exit - Tinlet ) + ('exit - ' i n l e t )
where c,,, is the average specific heat of the coolant, p is the coolant density, and T and P are the temperature and pressure, respectively, at the inlet or exit of the test section. The contribu- tion of the pressure drop on the enthalpy change is small compared to that of the temperature change; therefore:
' e x i t - h i n ~ e r = ' o v g ( Tpxi t - ' l;.n~et )
and
The heat flux from the test section then follows from:
- Es YS Bus - - As
The fourth approach for determining heat flux at the test section requires the use of the test section voltage drop and the material electrical resistivity. Because the resistivity varies signifi- cantly with local temperature and the presence of a severe radial temperature gradient in the test section during heating, the heat flux based on electrical resistivity is determined as part of the test section temperature distribution computation presented in the following discussion.

Radial Temuerature Distribution
Because of the severe radial temperature gradient in the test section, the electrical resistivity will also vary in the radial direction, and the internal heat generation will be radially nonuniform on a per volume basis. Therefore, a reasonable temperature distribution is not only important in estimating the outside wall temperature, but is necessary in determining the internal heat generation which, in turn, affects the temperature distribution.
Using the energy balance method and assuming no transverse heat conduction, a finite difference equation for a node at the center of an internal element of the test section tube may be obtained:
where
q,, is the heat flux into (or out of) the element at the outer face,
A,,,,, is the surface area of the outer face,
q,,, is the heat flux into (or out of) the element at the inner face,
As,,,,,, is the surface area of the inner face,
q, is the internal heat generation, and
Vol is the element volume.
The cylindrical geometry of the test section yields:
As,,,,, = nL (2Ri + dr)
= nL (2Ri - dr)
Acs = 2nRi dr
Vol = 2nRi drL

where L is the length of the test section tube,
Ri is the radial distance to the node i,
dr is the radial thickness of the element, and
Acs is the element cross-sectional area.
Invoking Fourier's law of heat conduction, the heat fluxes can be expressed as:
where k,,, k,,, and ki are the material thermal conductivities at the inner face, outer face, and interior node, respectively. Similarly, T,,,, Ti.,, and Ti are the respective temperatures. Substituting these equations into Eq. (C-1) and rearranging, an equation for the temperature at the interior node, Ti, is obtained:
The energy balance for the inner wall element is treated in a similar fashion but allowing for an adiabatic wall at the inner face:
qi- lAs, outer + q i + lAs, inner + q,V01 = O - (C-3)
=o
where
As,outer = nL ( ~ R I + dr),
A, = nR1dl;
Vol = nRIdrL,

and R, is the test section inner diameter.
From Fourier's law:
Substituting into Eq. (C-3) and solving for the inner wall temperature, T,:
The energy balance on the outer wall element yields:
A q i - 1 outer + qi + I S, inner + qgV01 = 0
where
Ago,,, = 27tRJ7
As,,,,,, = nL(2R,, - dr),
A, = nR,,dl;
Vol = .nR,,drL,
and R, is the test section outer diameter. From Fourier's law the inner face heat flux is:
where T,, is the outer wall temperature. From Newton's law of cooling the outer wall heat flux is given as:
q i - 1 = h ( T b - T O )
where h is the assumed convective heat-transfer coefficient, and T, is the bulk coolant temperature.

Substituting into Eq. (C-5) and solving for the outer wall temperature, T,,:
The heat generation q, in Eqs. (C-2), (C-4), and (C-6) is given as:
However, the energy E can be written in the form of electrical measurements and geometry:
where E is the generated energy,
I is the current,
V is the voltage drop across the test section,
P e L R is the electrical resistance = - , and A c s
p, is the material electrical resistivity.
ACSV' Therefore, qg = - p e L V o l
or simplifying,

The radial temperature distribution can be solved with Gauss-Seidel iteration by using an initial estimate for the temperature distribution and heat-transfer coefficient, and solving Eqs. (C-2), (C-4), and (C-6) for a refined temperature distribution solution. Substitution of this refined solution into the equations continues until a stable solution is achieved (a small residual between successive temperature calculations). The number of iterative cycles can be reduced by using relaxation of the form:
where T,,,,,, is the temperature computed from Eqs. (C-2), (C-4), and (C-6);
Tprevious is the temperature previously calculated and used in the equations to compute T,,,,,
J3 is the relaxation factor ; for linear systems 1 < J3 < 2;
T,,, is the new temperature to be used in the next iterative cycle.
The heat rates from each elemental heat generation may be summed for all elements when temperature convergence is achieved, and the total heat flux from the test section, q,,,,, is calculated using the overall test section geometry. The corresponding calculated energy is
Since the inner wall temperature is measured at several stations along the test section length, a direct comparison between the measured value and the calculated inner wall temperature can be made. Some difference between the two temperatures is expected because the convective heat- transfer coefficient on the outer surface of the test section that is used in the computations is only an estimate. This heat-transfer coefficient can be adjusted within the data reduction program to provide a match between the measured and calculated values of the inner wall temperature.
In addition to the heat rates from each elemental heat generation, the current flow through each element may be summed to obtain the total current flow through the test section. Because the measured voltage drop across the test section has some uncertainty associated with a-c ripple and losses in slip fit joints within the test section assembly, the voltage drop used in the heat generation calculation, Eq. (C-7), may be adjusted within the program such that the calculated current and measured rms current match. Such voltage drop corrections are typically small.
The selection of the number of elements in the finite difference scheme is important such that continuity is maintained; i.e., the resistance to conduction within the test section is much less than the resistance to convection across the coolant boundary layer. The thickness, dr, of the elements is selected such that the Biot number, Bi, remains less than 0.1:

where h is the largest heat-transfer coefficient expected, and k is the lowest test section material thermal conductivity expected.
For comparison purposes, a simplistic solution of the integrated cylindrical 1-D heat-transfer equation can be used to compute a test section outer wall temperature. Assuming steady-state conditions, constant material properties, uniform heat generation, and no transverse heat conduction, the heat equation reduces to
For the HTWL test section the appropriate boundary conditions are:
1. T (R,) = T, measured with a thermocouple
R, = 0 assumed adiabatic inner wall d r
Integrating the above heat equation and invoking the boundary conditions, the temperature as a function of radial position, r, is
4, 2 qe 2 RI T(r) = TI + - (R, - r2;)- - RI In - 4 k 2k r
and solving for the outer wall temperature:
98 2 qg 2 R, To = T I + - 4 k (R , - R E ) - 2k -R, In R,
Because of the severe temperature gradients expected and, hence, the nonuniform material properties and heat generation per unit volume in the radial direction, Eq. (C-8) is expected to have a significant error.
CHF
HTL
HTWL
Pexit
NOMENCLATURE
Test section cross-sectional area, m2 or ft2
Test section outside surface area, m2 or ft2
Bias limit
Critical heat flux, W/m2 or Btu/ft2 sec
Hydraulic diameter, mm or in.
Degree of subcooling, OC or OF (T,,, - T,)
Energy, kW
Mass velocity, kg/m2 sec or lbrn/ft2 sec
Heat-transfer coefficient, W/m2 "C or Btu/ft2 sec O F
High Temperature Laboratory
High Temperature Wall Laboratory
Current, amps
d-c current, amps
rms current, amps
Test section length, m or ft
Test section exit pressure, bar or psi
Psuction Back pressure on the high-pressure demineralized water pump, bar or psi
Ci Heat flux, W/m2 or Btu/ft2 sec

4 SYS
4 TOT
Calculated heat flux from temperature distribution finite difference routine, W/m2 or Btu/ft2 sec
Heat flux computed from temperature rise of coolant, W/m2 or Btu/ft2 sec
Total heat flux computed from rectifier current and voltage, W/m2 or Btu/ft2 sec
Heat flux computed from rectifier current and test section voltage drop, W/m2 or Btu/ft2 sec
Resistance, ohms
Standard deviation
Bulk coolant temperature, OC or OF
Coolant saturation temperature, "C or OF
Test section outside wall temperature, OC or OF
Root sum of squares uncertainty
Voltage, volts
Test section voltage drop, volts
Electrical resistivity, ohm-m or ohm-ft