A Hedonic Analysis of Retail Milk and Oatmeal Attributes...
145
A Hedonic Analysis of Retail Milk and Oatmeal Attributes in Québec Jun Xiao Department of Agricultural Economics McGill University, Montreal March 2012 A thesis submitted to McGill University in partial fulfillment of the requirements of the degree of Master of Science © Jun Xiao, 2012
Transcript of A Hedonic Analysis of Retail Milk and Oatmeal Attributes...

A Hedonic Analysis of
Retail Milk and Oatmeal Attributes in Québec
Jun Xiao Department of Agricultural Economics
McGill University, Montreal March 2012
A thesis submitted to McGill University in partial fulfillment of the
requirements of the degree of Master of Science
© Jun Xiao, 2012

i
ABSTRACT
This study analyzes price differentials attributable to observable characteristics of
retail milk and oatmeal using the hedonic pricing methodology. Aggregated 2010
Nielsen retail scanner data were matched with 2011 primary data on front-of-
package product claims and Nutrition Facts table information in order to evaluate
the implicit prices of front-of-package labels, store characteristics and regional
characteristics associated with food products. Estimates indicate that retail prices
of milk and oatmeal were significantly influenced by product characteristics,
product labels and store characteristics. In particular, nutrient content claims that
can be verified with the Nutrition Facts table were associated with small
discounts, while labels containing non-verifiable information tended to be
associated with statistically significant price premiums. At the store level, there
were significant differences in the price premiums associated with product
attributes for all nine types of stores considered. Results also indicated that the
price of products was not significantly influenced by whether stores were located
in urban and rural areas. However, results revealed both price-regulated and non-
regulated milk were priced differently according to regions defined by the Régie
des marchés agricoles et alimentaires du Québec. The data also suggest that
consumers consider a brand‘s province of origin and the regionality of local brand
names when purchasing retail milk.

ii
RÉSUMÉ
Cette étude analyse les écarts de prix attribuables à des caractéristiques
observables de lait et de gruau vendu au détail par la méthodologie des prix
hédoniques. L‘évaluation des prix implicites des allégations sur le devant des
emballages, des caractéristiques de magasins et des caractéristiques régionales
associés aux produits alimentaires s‘est effectuée par le traitement de données.
Pour ce, deux sources de données ont été appariées, à savoir les données
scanographiques agrégées de Nielsen datant de 2010 et des données primaires sur
l‘étiquetage nutritionnel des produits préemballés, recueillies durant l‘automne
2011, comprenant les allégations nutritionnelles et les tableaux de valeur nutritive.
Les résultats indiquent que les prix de vente au détail de lait et de gruau sont
considérablement influencés par les caractéristiques des produits, les étiquettes
des emballages et les caractéristiques des magasins. En particulier, les allégations
nutritionnelles qui peuvent être vérifiées par les tableaux d‘étiquetage nutritionnel
ont été associées à des prix marginaux négatifs, tandis que les étiquettes contenant
des informations non-vérifiables ont tendance à avoir des effets positifs sur la
valeur du produit. À l‘échelle des magasins, des différences significatives ont été
associés aux prix implicites des composantes des produits pour les neuf types de
magasins d‘alimentation considérés. Selon les estimations des modèles
hédoniques, l‘emplacement d‘un magasin, soit dans une zone urbaine ou rurale,
n‘influence pas le prix des produits de manière significative. Par contre, les prix
du lait réglementé et non-réglementé diffèrent selon les régions définies par la
Régie des marchés agricoles et alimentaires du Québec. Les résultats de l‘analyse
suggèrent également que les consommateurs considèrent la province d‘origine
d'une marque ainsi que la régionalité des noms de marques locales lors de l'achat
du lait au détail.
iii
ACKNOWLEDGEMENTS
This thesis grew from a series of discussions with my supervisor, Dr. Paul
J. Thomassin, and I would like to underline my genuine appreciation for his
guidance which took the shape of freedom to pursue this research topic and room
to work my own way, balanced with concise advice and direction when obstacles
were met.
One of the lessons I learned throughout this endeavour is that data is not
passively gathered, but tracked and hunted down. The analysis of milk labels
would not have been possible without Québec dairies openly sharing their data
and answering my questions; many thanks to Zuzana Janacova and Shafia El-
Zammar of Saputo, Vicky Lapointe of Laiterie de la Baie, Sylvie Larouche of
Laiterie Chagnon, Judy MacDonald of Northumberland Dairy, Valérie Rousseau
of Laiterie Chalifoux, Sonia Tremblay of Nutrinor, and Anne Roy and her brother
of Laiterie Royala. I would also like to thank Dr. Laurette Dubé of the Desautels
Faculty of Management for access to the Nielsen data. Additionally, I am
indebted to Dr. Yu Ma for explaining the Nielsen data with kindness and patience,
and to Dr. John Henning for discussing data analysis and for his continued
guidance since my undergraduate years.
Equally, I would like to thank my classmates for their constructive
criticism, the administrative staff of the Department of Natural Resource Sciences
for their helpfulness, the Social Sciences and Humanities Research Council for
financial support, and my friends for offering encouragements and a shoulder to
lean on.
Most importantly, I wish to acknowledge my parents who have always
unhesitatingly offered emotional, moral and financial support. For their self-
sacrifices and dedication a mere expression of thanks does not suffice.

iv
TABLE OF CONTENTS
ABSTRACT ... . . . . . . . . . . . . . . . . . . . . . . . . . . . . . . . . . . . . . . . . . . . . . . . . . . . . . . . . . . . . . . . . . . . . . . . . . . . . . i
RÉSUMÉ ... . . . . . . . . . . . . . . . . . . . . . . . . . . . . . . . . . . . . . . . . . . . . . . . . . . . . . . . . . . . . . . . . . . . . . . . . . . . . . . . . i i ACKNOWLEDGEMENTS ... . . . . . . . . . . . . . . . . . . . . . . . . . . . . . . . . . . . . . . . . . . . . . . . . . . . . . . i ii TABLE OF CONTENTS ... . . . . . . . . . . . . . . . . . . . . . . . . . . . . . . . . . . . . . . . . . . . . . . . . . . . . . . . . . . iv LIST OF TABLES ... . . . . . . . . . . . . . . . . . . . . . . . . . . . . . . . . . . . . . . . . . . . . . . . . . . . . . . . . . . . . . . . . . . . vi LIST OF FIGURES ... . . . . . . . . . . . . . . . . . . . . . . . . . . . . . . . . . . . . . . . . . . . . . . . . . . . . . . . . . . . . . . . . . vi
CHAPTER I: INTRODUCTION ... . . . . . . . . . . . . . . . . . . . . . . . . . . . . . . . . . . . . . . . . . . . . . . 1
1.1 OVERVIEW AND PROBLEM STATEMENT..................................................... 1 1.2 OBJECTIVES ............................................................................................... 2
1.3 STRUCTURE OF THESIS .............................................................................. 3
CHAPTER II: LITERATURE REVIEW .... . . . . . . . . . . . . . . . . . . . . . . . . . . . . . . . . . 4
2.1 OVERVIEW ................................................................................................ 4 2.2 CANADIAN FOOD LABELLING POLICY ....................................................... 5 2.3 U.S. FOOD LABELLING POLICY ................................................................. 7
2.4 FOOD LABELLING HISTORY AND PREVALENCE ......................................... 8 2.5 FOOD LABELLING AND CONSUMER PURCHASING DECISIONS .................... 10
2.5.1 Experimental Studies ...................................................................... 11 2.5.2 Economics ....................................................................................... 13 2.5.3 Stated Preference Literature ............................................................ 13
2.5.4 Revealed Preference Literature: Hedonic Pricing Method ............. 15
2.6 CHOICE OF METHODOLOGY ..................................................................... 18
2.7 HEDONIC THEORY ................................................................................... 19 2.7.1 Three Central Considerations ......................................................... 22
2.7.2 Selection of the Good ...................................................................... 22 2.7.3 Selection of Attributes .................................................................... 23 2.7.4 Functional Form .............................................................................. 28
CHAPTER III: DATA AND MODEL SPECIFICATION ... . . . . . . . . 32
3.1 DATA....................................................................................................... 32 3.1.1 Product Characteristics ................................................................... 33 3.1.2 Store Characteristics ....................................................................... 33
3.2 DESCRIPTIVE STATISTICS ........................................................................ 34
3.2.1 Descriptive Statistics of Retail Milk Products ................................ 34
3.2.2 Descriptive Statistics of Retail Oatmeal Products .......................... 41 3.3 LARGE SAMPLE SIZE ............................................................................... 45 3.4 MODEL SPECIFICATION ........................................................................... 46
3.4.1 Hedonic Pricing Model for Milk ..................................................... 47 3.4.2 Hedonic Pricing Model for Oatmeal ............................................... 50

v
CHAPTER IV: RESULTS AND DISCUSSION ... . . . . . . . . . . . . . . . . . . . . . . . 53
4.1 RETAIL MILK RESULTS ........................................................................... 53 4.1.1 Product Characteristics ................................................................... 54 4.1.2 Product Labels ................................................................................ 55 4.1.3 Store Characteristics ....................................................................... 57 4.1.4 Discussion ....................................................................................... 60
4.2 RETAIL OATMEAL RESULTS .................................................................... 61 4.2.1 Product Characteristics ................................................................... 61 4.2.2 Product Labels ................................................................................ 63 4.2.3 Store Characteristics ....................................................................... 64
4.3 HYPOTHESIS TESTING ............................................................................. 67
4.3.1 Objective 1: Front-of-Package Labels ............................................ 67 4.3.2 Objective 2: Store-Level Differences ............................................. 71
4.3.3 Objective 3: Regional Market Differences ..................................... 84
CHAPTER V. SUMMARY AND CONCLUSIONS ... . . . . . . . . . . . . . . . . . . 97
5.1 RESULTS .................................................................................................. 98 5.2 DISCUSSION ............................................................................................. 99 5.3 LIMITATIONS ......................................................................................... 101
5.4 FUTURE RESEARCH ............................................................................... 102
BIBLIOGRAPHY ... . . . . . . . . . . . . . . . . . . . . . . . . . . . . . . . . . . . . . . . . . . . . . . . . . . . . . . . . . . . . . . . 104
APPENDIX I. Règlement sur les prix du lait de consommation .. 114
APPENDIX II. Region I Fluid Milk Retail Prices .. . . . . . . . . . . . . . . . . . . . . 115
APPENDIX III. Oatmeal Correlation Matrices .. . . . . . . . . . . . . . . . . . . . . . . . . 116
APPENDIX IV. Summary Statistics of Standardized Nutri tional
Information of Oatmeal Model by Flavour Category .. . . . . . . . . . . . . . . . . 117
APPENDIX V. Store-Level Regression Results for Milk ($/L) .. . 119
APPENDIX VI. Store-Level Regression Results for Milk ($/L) .. 120
APPENDIX VII. Store-Level Regression Results for Oatmeal
($/350g) .. . . . . . . . . . . . . . . . . . . . . . . . . . . . . . . . . . . . . . . . . . . . . . . . . . . . . . . . . . . . . . . . . . . . . . . . . . . . . . . . 126
APPENDIX VIII. Price per Litre of Milk by Volume ... . . . . . . . . . . . . . . 130
APPENDIX IX. OLS Estimates of Retail Milk Model for Québec
and Gatineau, with Brand Base ($/L) .. . . . . . . . . . . . . . . . . . . . . . . . . . . . . . . . . . . . . . . 132
APPENDIX X. OLS Estimates of Retail Milk Model by Price -
Regulated Markets, with RMAAQ-based Regions, Brand Base and
Local Brand Regions ($/L) .. . . . . . . . . . . . . . . . . . . . . . . . . . . . . . . . . . . . . . . . . . . . . . . . . . . . . 135

vi
LIST OF TABLES
Table 1. Descriptive Statistics of Retail Milk UPCs by Attributes ...................... 39
Table 2: Descriptive Statistics of Retail Oatmeal UPCs by Attributes ................ 43
Table 3. Definitions of Variables for the Hedonic Price Model for Milk ............ 48
Table 4. Definitions of Variables for the Hedonic Price Model for Oatmeal ...... 51
Table 5. OLS Estimates of the Linear Hedonic Model for Milk ($/L) ................ 58
Table 6. OLS Estimates of the Semi-log Hedonic Model for Oatmeal ($/350g) 65
Table 7. Store-Level Results for Milk ($/L) ........................................................ 76
Table 8. Store-Level Results for Oatmeal ($/350g) ............................................. 82
Table 9. OLS Estimates for Retail Milk by Price-Regulated Markets, with
RMAAQ-based Regions ($/L) .............................................................................. 87
Table 10. Predicted Values for Price-Regulated Milk ......................................... 90
Table 11. Classification of Local Brands According to Brand Name .................. 94
LIST OF FIGURES
Figure 1: Front-of-Package and Back-of-Package Food Labels (CFIA, 2010) ..... 7

1
CHAPTER I: INTRODUCTION
Overview and Problem Statement 1.1
Today‘s consumer, shopping in the average supermarket, faces a choice set
of over 38,000 items (FMI, 2010). In this competitive environment, one of the
ways firms distinguish and advertise their products is through front-of-package
labels. As with any decision, firms which maximize profits should ensure that the
marginal revenue from each additional label equals or exceeds its associated
marginal cost (Golan et al., 2010). These decisions are set within a policy and
socio-economic context which provides constraints and opportunities for firms.
For instance, the Canadian Food Inspection Agency regulates claims found on the
front of product packages as well as the elements contained within the Nutrition
Facts Table. On the other hand, consumer trends clearly influence firms‘ labelling
decisions. The U.S. sales in 2010 of products with health claims related to
production methods and nutrient content health attributes, such as ―organic,‖
―natural‖ and indications of the presence of fat and fibre, ranged from $56.6
million for foods with plant steroid claims to $46.6 billion for product with fat
claims (Nielsen, 2010). Front-of-package labels constitute an element driving
consumer purchasing decisions by providing information that is beyond tangible
product attributes such as package type and volume.
The hedonic pricing method can be used to quantify the level at which
front-of-package information influences consumer decisions. This method is
based on the consumer demand theory of Lancaster (1966) which argues that
consumer demand is for the attributes of a good rather than the physical good as a
whole. By dividing a commodity into its characteristics, a good‘s price can be
decomposed into the sum of the marginal yield of each attribute multiplied by its
marginal implicit price (Ladd and Suvannunt, 1976). Using this approach,
researchers have assessed the implicit value of food attributes including the value
of food safety claims (Li and Hooker, 2009), beef steak brands (Schulz et al.,
2010) and the organic attribute for baby food (Smith, et al. 2009).

2
Store type can also influence product price. Consumers can control their
choice set according to where they shop because different retail chains carry
different products. For example, box stores (supercenters) constitute the latest
advancement in food retailing (Stiegert and Hovhannisyan, 2009) by offering a
combination of food retailing, general merchandising and pharmacies.
Additionally, the development of private (store) labels has enabled retailers to
assume a more active role in the food marketing system (Berge‘s Sennou, 2006).
A cross-store analysis can provide insight into consumer preferences for store
type and front-of-package labels. Within-chain analysis of the location of retail
chains can also provide insights into differences in pricing strategy: as the
consumer base and level of competition differ between urban and rural stores,
retail chains may adjust product prices accordingly.
Given the prevalence of front-of-package labels in today‘s market
(LeGault et al., 2004), this study used the hedonic pricing method to estimate the
implicit values for food product attributes, focusing on characteristics identified
on product labels.
Objectives 1.2
Although several studies have examined the relationship between a particular
food attribute and product price, there is a gap in the literature regarding the
implications of different types of labelling claims, which advertise the presence or
absence of food attributes, on food choice. Beyond the Nutrition Facts table, food
manufacturers incorporate composition, quality, quantity, nutrient content and
health claims on the front of food packages (CFIA, 2010). This study uses Nielsen
MarketTrack data to examine whether there were implicit values attributed to
front-of-package labelling statements, and whether food attribute values vary
according to retail and regional markets. Regulations concerning the display and
content of front-of-package claims can also influence product price. The product,
fluid milk, was chosen to evaluate how regulations set by the Régie des marchés
agricoles et alimentaires du Québec impacted the hedonic price models. Product
attributes for a second relatively homogenous good, oatmeal, were also analyzed

3
to potentially uncover cross-product trends. Specifically, the objectives of the
study were:
1) To evaluate whether there are significant implicit prices for labelling
statements that advertise the presence, absence, or level of an attribute in
food products;
2) To estimate whether implicit prices for food product characteristics,
including labelling statements, differ by store type;
3) To estimate whether implicit prices for food product characteristics,
including labelling statements, differ by store location;
4) To determine the presence of cross-product trends by comparing results
for the previous objectives for two food products.
Structure of Thesis 1.3
The second chapter consists of a literature review which is separated into
two parts. First, an introduction to food labelling familiarises the reader with
Canadian labelling policy and reviews the literature of food labelling and its
impact on consumer purchasing decisions. The second half of Chapter II reviews
hedonic theory, the proposed methodology for analysing the implicit prices
associated with food product attributes.
Chapter III presents the Nielsen MarketTrack data by outlining the
descriptive statistics of milk and oatmeal. Also, the hedonic pricing models are
specified in preparation for hypotheses testing.
Chapter IV presents the regression results for the empirical models and
discusses the interpretation of their coefficients. A first step in the analysis was to
conclude whether there were significant implicit prices associated with product
labels, based on the model estimates. Next, retail chains were grouped together to
test whether implicit prices were identical at the store level. Subsequently,
regional differences were investigated in a similar manner.
The final chapter summarizes findings of this study. The initial objectives
are revisited and limitations to this research project are discussed. Suggestions for
further research are also made in this chapter.

4
2 CHAPTER II: LITERATURE REVIEW
Overview 2.1
The literature review is divided in two parts. Part I reviews food labelling
policy and previous literature on consumer purchasing decisions. An emphasis is
placed on how economists use stated and revealed preference methodologies to
determine consumers‘ willingness to pay (WTP) for food attributes by using
labelling claims as proxies for the presence or absence of these attributes.
Although claims such as ―pesticide-free,‖ ―organic‖ and ―lactose-free‖ only
appear on front-of-packages, consumers can verify several nutrient content claims
with the Nutrition Facts panel on the back of packages. If nutrient content claims
are accounted for, but information on the Nutrition Facts panel is omitted, the
values consumers place on labelling statements and information on the back of
food packages are implicitly aggregated. Thus, both nutrient content information
and claims were accounted for in this study to examine whether buyers
differentiate between front-of-package labels and information found on the
Nutrition Facts table, and whether different types of front-of-package labels elicit
different responses.
In Part II, the choice of methodology is identified and hedonic theory is
presented. Empirical estimations of hedonic models in the food labelling literature
demonstrate varying uses of functional form, choice of variables and data sources
amongst researchers. In addition to labelling statements, several attributes for
product brand, origin and retail store type are considered.

5
PART I: PREVIOUS LITERATURE
Canadian Food Labelling Policy 2.2
In Canada, the 2003 Guide to Food Labelling and Advertising (Guide)
establishes guidelines for food claims, including alcoholic beverages, in order to
meet with the requirements set by acts and regulations within the Canadian
legislative framework: the Food and Drugs Act, the Food and Drug Regulations,
the Consumer Packaging and Labelling Act and the Consumer Packaging and
Labelling Regulations. The Guide was developed to assist industry to comply
with legislation and protect consumers, and outlines the basic labelling
requirements, advertising requirements and the mandatory and voluntary elements
within the Nutrition Facts table (CFIA, 2010).
The Nutrition Facts table is a mandatory food label that is displayed on a
product package, along with its common name, net quantity, dealer name and
address, list of ingredients and durable life date. A Nutrition Facts table should
contain information regarding serving size, calories and 13 core nutrients. In
addition, there are conditions under which food manufacturers must declare
additional nutrients beyond ―core‖ information contained in the Nutrition Facts
table, and regulations surrounding how the table should be presented on the
product. For example the table must be positioned on a continuous surface, and
mustn‘t be placed in an area where it will be destroyed when consumers open the
food package (CFIA, 2008).
In terms of voluntary labelling statements, the Guide defines three types of
claims (CFIA, 2010):
(1) Composition, quality, quantity and origin claims include statements with
words such as ―fresh,‖ ―homemade,‖ ―true,‖ ―real,‖ ―organic,‖ and
―reconstituted.‖ The main requirements set for food manufacturers are to
refrain from misleading impressions, misleading descriptions and to
provide accurate information to consumers. Overall, the Guide does not
6
provide specific definitions in terms of the context in which terms
regarding food composition and quality are used, but approaches the issue
in a more pragmatic way by providing examples of good practices.
(2) Nutrition content claims are statements that describe the level of a
nutrient in a food product. Regulations concerning this type of claim aim
to provide consumers with consistent information in order to compare
foods easily. For example, the Guide establishes conditions that must be
met when making comparative claims involving similar foods. Unlike
labelling policies in the United States, Canadian policy prohibits implied
nutrition content claims made on their own, and they must immediately
precede or follow an expressed nutrient claim. For instance, an implied
statement such as ―semi-salted‖ must be accompanied by an approved
statement for foods defined as low in sodium or salt, such as ―low in
sodium‖, which is an indirect claim on the level of sodium in a food, or
―contains less than X mg salt per serving‖, which is a direct claim on the
level of sodium in a food (DoJ, B.01.501, 2010).
(3) Health claims state or imply a relationship between the consumption of
food, or an ingredient in the food, and health. The Guide classifies health
claims into three categories: disease risk reduction claims, function
claims and general health claims. Function claims describe how the
consumption of food, or component of a food, has an impact on the
normal functions or biological activities of the body, and should be
distinguished from the structure/function claims category in U.S.
labelling policy.
Since claims are usually displayed on the front of a product‘s package, while
the Nutrition Facts table is generally positioned on the back, the two elements are
sometimes referred to as front-of-package and back-of-package labels,
respectively (Figure 1).

7
Figure 1: Front-of-Package and Back-of-Package Food Labels (CFIA, 2010)
U.S. Food Labelling Policy 2.3
In the United States, two principal federal laws govern food products
under the Food and Drug Administration‘s (FDA) jurisdiction: the Federal Food,
Drug, and Cosmetic Act and the Fair Packaging and Labeling Act. Food claims
are separated into three broad categories (FDA, 2008):
(1) Nutrient content claims explicitly or implicitly characterize the level of a
nutrient found in a food product. An expressed nutrient content claim is
any direct statement about the level (or range) of a nutrient in the food,
e.g., ―low sodium‖ or ―contains 100 calories.‖
(2) Health claims on food labels may express or imply a relationship between
the consumption of a food or one of its components and a disease or
health-related condition. For example, implied health claims include
symbols, such as a heart symbol, that suggest a relationship between
consumption and health.
(3) Structure/Function claims are reserved for dietary supplements, and
describe the role of a nutrient or dietary ingredient in terms of how it
The Nutrition Facts table is
also referred to as ―back-of-
package‖ information
―Front-of-package‖ labels
must meet requirements set
by the CFIA

8
affects or maintains structure or functions in humans. The label statement
cannot bear a disease claim, in which case the marketed product will be
subject to regulation as a drug, unless it qualifies as an authorized health
claim.
The FDA does not govern all food labelling policies: foods that contain
organic labelling statements fall under the jurisdiction of the U.S. Department of
Agriculture (USDA). The National Organic Program (NOP) regulates the
standard to any producer who wants to sell an agricultural product as organically
produced. Also, certain labels remain unchecked by both agencies. Currently,
there are no restrictions surrounding the use of ecological- or sustainable-type
food labels, such as ―no drugs or growth hormones used,‖ ―free range,‖ or
―sustainably harvested‖ (USDA, 2008). Moreover, the FDA Food Labeling
Guidance and Regulations do not cover issues such as microbial food safety,
pesticide residues and the use of preservatives (FDA, 2008).
In general, Canadian laws and regulations concerning front-of-package
claims are more stringent than those in the United States. These standards are
sustained by ensuring that foreign foods displaying claims are evaluated by the
CFIA‘s Label and Recipe Registration Unit prior to being exported to Canada.
Typically, Canada does not permit imported meat and poultry products containing
claims such as ―natural‖, ―antibiotic free‖, ―hormone free‖ and ―chemically free‖
(CFIA, 2011).
Food Labelling History and Prevalence 2.4
Since the enactment of the Pure Food and Drug Act in 1906, food
labelling laws and regulations have evolved in the 20th
century to ensure the
provision of true and non-misleading claims to consumers. In 1990, the Nutrition
Labeling and Education Act (NLEA) was passed to: standardize the Nutrition
Facts panel and serving sizes, make its presence mandatory on processed goods,
and strictly regulate labelling statements (Geiger, 1998). Benefits of mandatory
labelling include product reformulation, product innovation and changed
consumer behaviour, and costs of labelling are mostly borne by consumers who
9
pay for government management and regulation (Drichoutis et al., 2006). Whether
mandatory labelling has led to net benefits or costs to society has been debated.
On one hand, Zarkin et al. (1993) estimated that the NLEA resulted in savings of
up to $100 billion in medicare costs in two decades, and the FDA (1993) affirmed
that the benefits of improved food labelling brought forth by the NLEA
outweighed the cost of implementation and compliance. On the other hand,
researchers have found that consumer preferences and purchasing patterns for
frozen meals (Mojduszka, 2001) and their search for nutritional information
(Balasubramanian and Cole, 2002) did not change significantly after the
implementation of the NLEA.
As of 1976, the FDA has studied the prevalence of labelling for processed
and packaged foods in the United States through the Food Label and Package
Survey (FLAPS). The agency‘s 12th
survey was conducted with 2000-2001 data
from Information Resources Inc. (IRI), and found that almost 100% of sampled
packaged products displayed a nutrition label. Survey results indicated that
approximately 5% of packaged food products in the United States displayed a
health claim and/or a structure/function claim, while one third of products sold
displayed nutrient content claims. The study also included information pertaining
to the prevalence of health claims by product group (such as hot cereals, seafood,
meat/poultry substitutes), and nutrient content claims by type of claim and by
product group. However, the average number of claims per product group isn‘t
specified (LeGault et al., 2004). Surprisingly, the survey showed that the
percentage of products with nutrient content claims for total fat, saturated fat,
cholesterol, dietary fibre and sugar decreased from 1997 to 2001. A subsequent
study found that 12% of products now contain nutrient content claims about the
level of trans fats (Brandt et al., 2009). The authors propose that changes in the
prevalence of front-of-package claims are due to industry responding to changes
in consumer tastes and preferences for low-fat and fat-free foods (LeGault et al.,
2004). However, the following sections indicate that current research suggests it
is still unclear whether consumers optimize their search for food attributes
through the use of labelling statements.

10
Food labelling and consumer purchasing decisions 2.5
Neoclassical economists traditionally justify government intervention in
order to correct market failures, which may be caused by imperfect market
competition, externalities and imperfect information. Since nutritional and health
claims cannot be verified during or after consumption, consumers can not search
for the bundle of attributes that maximizes their utility. Thus, food labelling
policies are a means for governments to provide consumers with information
pertaining to nutritional and health characteristics of foods to transform credence
attributes into search attributes, and help prevent ―lemons‖ in the market
(Drichoutis et al., 2006).
Both consumers and producers face trade-offs when using food labels:
consumers who engage in information search behaviours face a search/time trade-
off; consumers who read nutritional labels face a taste/nutrition trade-off
(Drichoutis et al., 2006). For instance, consumers may balance the immediate
gratification offered by a tasty chocolate with the long-run benefits of a nutritious
banana. For food manufacturers, the cost of displaying labels on food packages
has to be balanced against additional revenue; deciding what labels to display is a
complex decision given the number of potential attributes and differences in
consumer preferences (Golan et al., 2001).
The study of consumer‘s use of labelling statements is broad, and contains
detailed research on topics such as the profiles of consumers likely to use
nutritional information, and the relationship between label use and dietary change.
Articles can be found in marketing journals, food science journals as well as
economics journals. The following two sections reviews evidence of the impact of
food labelling on consumer purchasing decisions, and categorises results as either
experimental evidence or economics studies.

11
2.5.1 Experimental Studies
In experimental design settings, the study of the impact of labelling
statements on consumers may be divided into six categories: (1) consumer
knowledge and awareness of dietary issues; (2) sources of information and trust;
(3) consumer perception, attitudes and beliefs of claims; (4) communication
framing and context; (5) consumer reactions to disease-reduction or health
enhancement and; (6) consumer purchase decisions. Pothoulaki and
Chryssochoidis (2009) explain how the first five components ultimately influence
consumer purchase decisions: a consumer‘s purchase decision is a function of the
communication framing and context as well as the disease/risk prevention claims
that alter the impact of health claims. The weight consumers place on health
claims is a function of consumer knowledge and awareness of dietary issues,
sources of information and trust, and a consumer‘s perceptions, attitudes and
beliefs.
Alfieri and Byrd-Bredbenner (2000) conducted a study with 150 women
who were the principle food purchasers in their household to assess how labelling
statements impact purchasing decisions. Through 15-minute face-to-face
interviews, the researchers evaluated whether the participants could locate and
manipulate data on the Nutrition Facts table as well as assess nutrient content
claims and health claims. They found that over 60% of women regularly read
Nutrition Facts labels and that over 90% of surveyed women stated that the
Nutrition Facts table always or sometimes impacted their food purchasing
decisions. However, participants performed poorly in terms of their understanding
of health claims: they could not determine which of five health claims could
appear on a pasta mix with a Nutrition Facts label. The authors proposed that
consumers may find health claims hard to validate because there are no concrete
data available to verify the accuracy of health claims and that certain consumers
may be sceptical of health claims on product packages.
Alternatively, Lee et al. (2007) provided evidence for the taste-health or
taste-nutrition trade-off consumers experience when purchasing food (Drichoutis
12
et al., 2006). The authors conducted focus groups to study the impact of health
claims on the taste of breakfast cereals. They found that certain health and
nutrient content claims, specifically the promotion of soy as a healthy ingredient,
may be undermined by taste stigmas. The conclusions from these experiments
also indicated that health claims may play dual roles: first, indicating the presence
of a nutrient to consumers, and second, informing them about the potential health
impacts of consuming the nutrient or food product. This means that studies on
labelling statements need to be attentive to the role of both nutrient content claims
and health claims; ignoring health claims potentially biases observations.
Garretson and Burton (2000) collected data from 382 primary household
grocery shoppers through a mail survey to compare how consumers value two
different sources of information, in terms of two nutrients (fat and fibre), on mock
frozen dinner food package. In particular, the authors aimed to understand how
statements on the front (health and nutrient claims) and back (Nutrition Facts
table) of a product‘s package influenced consumers‘ attitudes and purchase
intentions, perceived disease-related risks and trust of information. Results from
their multivariate analyses of variance indicated that front-of-package claims
about fat and fibre, as well as Nutrition Facts table information concerning fibre
levels, did not positively affect brand attitude and purchase intent. However,
information on the Nutrition Facts table regarding fat affected consumers‘
decision-making. The study concluded that consumers tend to rely on Nutrition
Facts tables rather than nutrient claims and health claims. Also, when the
information on claims and Nutrition Facts tables diverge, consumers tend to trust
claim information less.
Teratanavat et al. (2004) used a marketing approach and also found that
consumers rely primarily on the Nutrition Facts table, rather than on health and
nutrition information on the front of food packages. In an experimental setting,
over three hundred undergraduate students were shown one of several versions of
front and back panels of a box of wheat crackers on a computer monitor, and were
subsequently asked a series of questions concerning the effect of the information
on their attitudes, understanding and buying intention. A univariate analysis of

13
variance was conducted, and results suggested, similar to Garretson and Burton
(2000), that the presence of claims on the front of food packages does not lead
consumers to evaluate product quality more carefully and that students are able to
distinguish healthy from unhealthy products whether claims are present or absent.
Although consumers tend to prefer products with claims than products
without claims (Teratanavat et al., 2004), the role of these claims on consumer
purchasing behaviour is unclear. Research indicates that consumers who use
labels tend to shop by comparing the Nutrition Facts table of similar types of
products and to focus on the components of fat, energy and carbohydrates within
the label (Higgingson et al., 2002a and 2002b). Worsley (1996) surveyed
supermarket shoppers in Australia and found that consumers were mostly
interested in information concerning additives, health impacts and fat.
2.5.2 Economics
In the economics literature, studies are undertaken to investigate the role
of information, either on front-of-package claims or Nutrition Facts tables, on
consumer choice. One method to estimate this impact is with the stated preference
approach, which relies on answers to carefully designed surveys to elicit
consumer choices and values. An alternative way to measure the values
consumers place on this information is through revealed preference methods,
which are based on actual market behaviour. The economics literature is rich on
research pertaining to consumer demand for food characteristics, but relatively
sparse in terms of consumer valuation of nutrient content labelling statements.
2.5.3 Stated Preference Literature
Hu et al. (2006) explain that when analyzing the utility consumers derive
from different bundles of goods, ―the random utility model assumes that
individuals make choices based on the attributes of the alternatives and that
overall utility is decomposed into systematic and random (or error) components‖

14
(p. 1034). The explainable components may be parameterised as attributes that
pertain to choice options, characteristics that pertain to individual s, interactions
of choice option attributes with the individual characteristics and interactions of
individual characteristics with choice option intercepts (Louviere, 2001).
For example, Teratanavat and Hooker (2006) found a positive demand for
health attributes for a novel functional food. Data were collected from over 1700
households in Ohio through a mail survey using a choice experiment design,
where subjects chose among 3 products (conventional tomato juice, tomato juice
plus, tomato juice plus with soy) and an opt-out option in each of four scenarios.
Products were described according to four attributes: health benefits (zero, single
or multiple), organic/conventional ingredients, natural or fortified nutrients, and
four price levels. The different levels of health benefits were presented in a format
similar to health claims found on fronts of packages, such as ―rich in nutrients
that may reduce the risk of prostate cancer,‖ rather than as a percentage increase
or decrease to human health, such as ―5% increase in the risk to your health‖ used
in the surveys of Yen (2009) and Roy (2009). The authors developed two random
utility models (a mixed and conditional logit model) to analyze their discrete
choice data. They discarded the conditional logit model as it incorrectly assumes
homogenous preferences across respondents, and determined that consumers, on
average, prefer a single health benefit to multiple health benefits, and natural to
fortified nutrients.
While some researchers argue that labelling regulation transforms
credence attributes into search attributes (Drichoutis et al., 2006), there is
evidence that certain claims are regarded as credence attributes to consumers. A
choice experiment study by Olynk et al. (2010) showed that consumers were
willing to pay a premium for verification of livestock production process
attributes, such as animal rearing, handling and housing practices. Consumers‘
WTP varied across attributes verified, but also according to verifying entity. For
example, the WTP for pasture access was highest for verification by the USDA,
followed by verification by the producer, consumer groups and private third

15
parties. This is a clear example of how sources of information and trust
(Pothoulaki and Chryssochoidis, 2009) affect consumer valuation of food labels.
Many researchers who use stated preference methods consistent with
random utility theory implicitly assume that all differences in consumers‘ choices
are due to the explainable components listed above. However, research suggests
other factors besides unobserved taste heterogeneity, such as context effects,
reference point effects, availability effects and superstition effects, influence
consumer purchasing decisions (Hu et al., 2006). For instance, Hu et al. (2006)
studied how context effects and consumers‘ reference points on product price and
genetically modified ingredients influence purchasing behaviour in the case of
packaged, sliced bread. The authors surveyed 437 consumers by distributing three
different surveys with different labelling contexts (mandatory labelling, voluntary
labelling, and no specific labelling requirement) and asked them to choose
between two products (plus an opt-out option) characterized by four attributes
(brand name, type of bread, ingredients, price). Their results indicate that both
context effects and reference dependence are factors, besides taste heterogeneity,
that influence consumer decision-making. This is in line with findings outside
economics that suggest that communication framing and context influence
consumer purchase decisions (Pothoulaki and Chryssochoidis, 2009).
2.5.4 Revealed Preference Literature: Hedonic Pricing Method
The use of labelling statements in hedonic pricing models is used
primarily as a proxy for the presence, absence or level of an attribute in food
products, in order for researchers to determine the implicit price of selected food
attributes. When front-of-package statements can not be cross-examined with
information on the Nutrition Facts panel, then the implicit price consumers place
on the food attribute and on the labelling statement coincide.
For example, Li and Hooker (2009) analyzed food safety claims and their
influence on supply-side (agribusiness) price. They examined cross-category
valuation of claims for two product categories (spoonable yogurts, meat and

16
poultry products) using parametric and non-parametric hedonic models. Unlike
most researchers who assume a perfect competition market structure, the authors
included a product innovation level variable to proxy for product differentiation
and uniqueness. For spoonable yogurts, preservative free and organic claims were
associated with significant price premiums, while Kosher-certified and pesticide
free claims were not. For meat and poultry products, the authors tested the
significance of E. Coli free, natural and antibiotic free claims, and found that only
the latter two were statistically significant. Since none of these claims can be
verified with the Nutrition Facts panel, purchasers must rely on front-of-package
statements that indicate attribute presence or absence. For the statistically
insignificant Kosher-certified claim, the authors suggest that, while the claim had
no impact on product price, it may have marketing advantages. Li and Hooker
also propose that the incidence at which claims are found on products relates to its
statistical significance: the pesticide free and E. Coli free claims were featured on
a limited number of yogurts and meats, respectively, and firms may have had a
limited ability to monitor them.
Alternatively, Chang et al. (2010) estimated the marginal implicit prices
consumer placed on the production methods of retail eggs. Using retail scanner
data of quarterly egg sales across the entire U.S., and of weekly sales from two
regional markets, the authors‘ semi-log hedonic price model estimated that
production attributes such as cage-free, free-range and organic command a
significant price premium. Although Chang et al.‘s (2010) model controlled for
egg color, size, packaging, brand label and time, results from a Chow test
indicated strong regional differences in price premiums for production attributes.
While several studies on consumer preferences focus on relatively
unprocessed foods such as retail beef (e.g. Ward et al. 2008; Parcell and
Schroeder, 2007; Schulz et al., 2010), Ahmand and Anders (2011) studied
Canadians‘ preferences of highly processed chicken and seafood products. Retail
price ($/lb) per item per store was explained according to four categories of
dummy variables: brand, package size, meat cut (for chicken) or species (for fish),
and process form (such as barbecue and souvlaki). In discussing their results,

17
Ahmand and Anders suggested two additional variables that may account for
differences in relative pricing across processed seafood products: store-level
characteristics and front-of-package labels.
When front-of-package claims can be verified with back-of-package
information, it is important to distinguish between both effects. An example
where consumer valuation of labelling statements and valuation of nutrients are
not differentiated is Muth et al.‘s (2009) study of breakfast foods and cereals. The
authors used Nielsen Scantrack data and built a semi-log hedonic price regression
model to determine whether labelling statements were associated with increases in
consumer WTP. The explanatory variables used in the regression analysis
included: package size, store brand, product brand and labelling statements. By
omitting to control for differences in the nutrient composition of foods, Muth et
al.‘s conclusions do not pertain solely to consumers‘ preferences for front-of-
package information, since labelling statements may reflect characteristics of the
Nutrition Facts table. For example, the authors‘ regression results suggested that
consumers positively value carb-conscious labelling statements. Without
controlling for differences in the nutrient composition of breakfast foods and
cereals, their results may suggest that consumers value certain foods that are low
in carbohydrates and fat, rather than labelling statements about carbohydrates and
fat.
In contrast, Gulseven and Wohlgenant (2010) built a hedonic metric model
to estimate the values of product attributes for fluid milk. They matched Nielsen
Homescan Data with information about food attributes using the USDA Nutrient
Database to construct a dataset of front-of-package claims and nutrient
information (back-of-package information) for each product. Among the authors‘
findings are that lactose-free, cholesterol-free, organic and soy attributes are
highly influential on product price.
For products with relatively homogenous nutrition characteristics, it may
not be necessary to control for nutrient information. While Gulseven and
Wohlgenant (2010) used continuous variables to represent elements found on the
Nutrition Facts table, Ward et al. (2008) analysed the implicit value of ground

18
beef by categorizing packages according to levels of fat (lean percentage), and
categorize steak products by USDA quality grade, thus assuming away other
nutritional differences. The price per pound of retail beef was modeled using both
linear and semi-log functional forms, and front-of-package explanatory variables
included: ―no antibiotics added,‖ ―no hormones added,‖ ―all natural,‖ ―source
verified‖ and ―guaranteed quality.‖ Label results were inconsistent across the two
product groups considered (ground beef and roast/steak products) and functional
form. Additionally, the sign on certain significant variables was counterintuitive:
a statistically significant negative price premium was associated with the ―no
hormones added‖ and ―all natural‖ claims. Ward et al. (2008) suggest the discount
associated with these claims may have been attributable to the fact that the model
already controlled for brand name, and the combined consideration of both
variables would lead to nonexistent price premiums for products displaying those
labels.
Choice of Methodology 2.6
The survey of evidence from experimental studies in the food science and
marketing arena, as well as from economics research using the stated preference
approach, shows considerable variation in the way consumers react to food labels,
and suggests consumers may not positively value information claims. Cowburn
and Stockley (2004) conducted a literature review of consumer understanding of
nutrition labelling, and concluded that most of the evidence is based on
experiments that take place in non-realistic settings and employ subjective
measures. In their search for information, the authors considered only 9 out of 103
studies to be of high or medium-high quality, and stated that there exists a lack of
evidence to ―build up a picture that accurately reflects consumers‘ habitual use of
nutrition labelling‖ (p.26). Consequently, one way to study consumers‘ value of
front-of-package labelling statements is through the revealed preference approach,
which studies actual consumer choices rather than their answers to survey
questions or their actions in experimental settings. The approach also circumvents
framing effects of surveys, as described in Hu et al. (2006).

19
In terms of methodology, the review of previous work suggests discrete
choice models are generally used to determine consumers‘ stated preference for
food attributes, while the hedonic pricing methodology is preferred in the revealed
preference literature. Each model is based on a different set of assumptions;
central to hedonic models is the concept of a continuous function relating the
price of a good to its attributes. Conversely, the discrete choice approach suggests
individuals maximize their utility given a set of products and their attributes
(Mason and Quigley, 1990). Cropper et al. (1988) conducted a comparison of both
approaches by simulating equilibia in housing markets, and found both models‘
performance similar in estimating the marginal value of an attribute. However,
their multinominal logit model was better suited to estimate non-marginal changes
in attribute levels.
The hedonic pricing method was chosen as it better responds to the
objectives of evaluating the existence of positive implicit prices for front-of-
package labels, and determining whether these implicit prices differ by store and
region. The appropriateness of the hedonic price model as the chosen
methodology is supplemented in the following section, where hedonic theory is
presented along with three general issues related to its use: selection of the good,
selection of its attributes and choice of functional form.
Part II: Hedonic Theory
Hedonic Theory 2.7
Lancaster‘s (1966) new theory of consumer demand, in which he
postulates that consumers derive utility not from goods themselves but their
characteristics, responds to limitations within neoclassical utility theory: it
explains why consumers derive utility from commodities, and provides a way of
predicting demand for new commodities (Smith et al., 2009). The use of the
hedonic method in economics can be divided into two general fields: the first
group analyzes and adjusts observed prices for changes in product quality, while
20
the second group analyzes the relationship between individual attributes and their
implicit prices (Hulten, 2003).
Building on Lancaster‘s theory, Rosen (1974) developed the hedonic
model in the case of a perfect competition market structure with a continuum of
products. In his seminal paper, he considers a good Z, such as an individual food
product, composed of n attributes represented by the vector .
Bundled together, the characteristics are priced at the unit price of the product:
( ) ( ) . Rosen shows that the marginal implicit price for an
attribute zi, represented by ( ) ( )
, characterises optimal consumer and
producer behaviour.
On one side, consumers maximize their utility through the purchase of a
unit of the food product and a composite good x, subject to a budget constraint
(where y represents income):
( ) ( ) ( )
By normalizing the price of the composite good and assuming a perfectly
competitive market, the first-order condition of the utility maximization problem
is:
This means that the marginal rate of substitution between an attribute of the food
product and the composite good is equal to the marginal price of the attribute.
Hence, given their income level, consumers reveal through their purchase of the
good Z that their marginal willingness to pay for an attribute is equal to its
marginal price.
On the other hand, producers maximize their profit by producing an
amount M of the product Z. Their total revenue assuming perfect competition is
( ), and costs of production are represented by ( ) where β represents
the firm‘s variables in the cost-minimizing problem, such as factor prices. Firms
maximize their profits by choosing the amount M to produce:

21
( ) ( )
A condition derived from the cost-minimization problem is that the
marginal cost of producing an attribute is equal to its marginal price:
Thus, from the condition where the market clearing price paid for a
product is a function of its associated attributes and the marginal implicit price
paid per attribute, Rosen (1974) demonstrates that the marginal implicit price
represents optimal behaviour by both sides of the market, where the relative value
of the attributes to consumers is equal to the marginal cost of production of that
attribute:
In this equilibrium condition between optimal producer and consumer
decisions, the amount of attributes demanded by the consumer is met by the
amount supplied by the producer. From this point, the demand and supply
schedules for different attributes may be derived, which is generally referred to as
second stage analysis. The papers reviewed and the discussions below pertain to
the estimation of consumer attribute values rather than deriving Rosen‘s second
stage structural supply and demand equations.
Hulten (2003) notes the distinction between Rosen‘s interpretation of
marginal implicit prices with the utility-based interpretation associated with
Lancaster‘s (1966) new theory of consumer demand. Rosen (1974) considers the
price of a good to be an envelope linking equilibriums between consumers and
producers - tangencies between consumers‘ demands for, and firms‘ supplies of,
product characteristics. Lancaster‘s consumer-based view maintains that implicit
prices relate to consumers‘ WTP for attributes and overlooks producer behaviour.

22
2.7.1 Three Central Considerations
There are three general issues related to the use of the hedonic regression
model (Hulten, 2003). The first and second topic deal with the selection of the
good and the selection of its attributes, while the third issue relates to the choice
of functional form.
2.7.2 Selection of the Good
Product differentiation models are subject to the problem of distinguishing
goods as products in their own right, in contrast to goods as a subclass of a given
product category. For instance, does one treat a particular brand of ice cream as a
good and consider the different flavours offered as characteristics, or does one
include near-substitutes and treat ice cream as a good regardless of the brand? Is
it reasonable to also include further substitutes such as popsicles and frozen
desserts? Theory indicates that a common hedonic function should apply for all
items in the class of goods considered, which is reasonable when the range of
items is small. However, this benchmark is violated whenever dummy variables
are included (Hulten, 2003). Overall, the choice of food product depends on the
range available in the data as well as other constraints that may be imposed, such
as the selection of a homogeneous good, the selection of a functional food, or the
selection of a packaged product with several close substitutes.
The two retail commodities chosen to study cross-product preferences in
front-of-package labelling were milk and oatmeal because they are relatively
homogenous products in terms of nutrient composition. This minimizes the
number of explanatory variables employed for back-of-package information and
directs attention towards the information found on font-of-package food labels. In
addition, fluid milk and oatmeal have few direct substitutes and can be reasonably
defined as goods in their own right.

23
2.7.3 Selection of Attributes
Drawing on the definition of implicit marginal price provided by Rosen
(1974), attributes selected should influence both consumer and producer
behaviour. Although labelling statements that pertain to elements in the Nutrition
Facts panel can be considered to be elements of consumer and producer decision-
making, other labelling statements such as disease-reduction health claims are less
obvious (Hulten, 2003). This is perhaps why a large branch of applied
econometrics ignores the interaction between producers and consumers and
restricts analysis to the price faced by consumers, and consumer welfare (Diewert,
2003).
Assuming consumers are not identical, the implicit prices obtained from
hedonic regression are not fixed parameters but a weighted average that may
change over time due to changing preferences and changing mix of consumers.
The implicit prices may also change over time because of non-separability: if
attributes defining good A cannot be dissociated with attributes defining good B,
which are outside the hedonic function, the implicit marginal price may change
due to changes in the relation between goods A and B. Missing attributes within
the hedonic function create a similar problem (Hulten, 2003). For these reasons,
econometric models are most successful when applied to goods that have additive
and non-conflicting attributes (Drichoutis et al., 2006).
While there are conventional characteristics used in hedonic pricing
models for houses, where variables such as lot size, living area, number of
bathrooms and neighbourhood attributes are recurrent from study to study, food
products are heterogeneous goods with differing attributes. Thus, there is no
combination of attributes that applies to all food products. Researchers using
scanner data deal with large databases with thousands of observations and hence
thousands of degrees of freedom, and thus have a tendency to use a relatively
large number of variables in hedonic pricing models. Hidano (2002) suggests
three categories of explanatory characteristics to estimate a hedonic price function
for housing markets: (1) characteristics of the commodity itself; (2) attributes that

24
affect the quality of the commodity from the outside and (3) the general
environment. Similarly, attributes of retail food products can be categorized as
product characteristics, store characteristics and those concerning the general
environment.
2.7.3.1 Product Characteristics:
While product characteristics are commodity-dependent, recurring attributes are
described below:
Package size/Servings per package: A continuous variable may be used when
the differentiated products come in different sized packages.
Bulk: Muth et al. (2009) used a dummy variable to capture price discounts
associated with multi-packaging for granola and yogurt bars, and found a
significant negative implicit price.
Package Type: Consumer may distinguish food products according to the way
they are packaged; for example, eggs are sold in cardboard, plastic or
Styrofoam packages (Chang et al., 2010).
Nutritional Attributes: Nutritional attributes such as labelling statements are
best represented as dummy variables. Otherwise, nutritional information on
Nutrition Facts panels such as protein, carbohydrate and fat content, as well as
percentage daily recommended intake of cholesterol, sodium and vitamins and
minerals may be captured by continuous or binary variables.
Child Product Attribute: Li and Hooker (2009) included a binary variable to
capture the implicit price of spoonable yogurts which are positioned towards
children. However, the attribute was found to be statistically insignificant.
Production Method Attributes: Several credence attributes can be attributed to
this category, which include organic ingredient claims, pesticide-free claims,
antibiotic-free claims, as well as claims pertaining to production methods
according to particular religious frameworks, such as kosher foods.
Region of Origin: Steiner (2004) performed a hedonic pricing analysis on
Australian Wines and included explanatory variables for the different regions

25
of origin. Region of production can also be a production method attribute, and
several studies, reviewed in Hu et al., (2011) support that foods with region of
origin labels, such as ―locally produced,‖ command a price premium over
products without such claims.
Brand: Diewert (2003) developed arguments for and against using brand
dummy variables as independent variables. Those who argue against including
brand dummy variables believe that if all the important attributes of the food
product are included in the regression, the brand variable is superfluous and
increases multicollinearity. Conversely, proponents deem that brand dummies
capture attributes that are hard to specify, such as reliability, degree of
consumer knowledge about the product through advertising, and availability.
Recent research on pork and beef prices suggests brand premiums exist
(Parcell and Schroeder, 2007; Schulz et al., 2010). Schulz et al. (2010)
categorized beef brands according to three dimensions: longevity, prominence
and positioning. Brand longevity captures consumer recognition, while brand
prominence signals whether the product is distributed locally, regionally or
nationally. The authors used four categories for brand positioning: special
brands, program brands, store brands and other. Brand prominence captured
price premiums associated with local claims, while brand positioning captured
the implicit price of special production practices.
Additionally, brands may implicitly signal the presence of nutrients, as
shown by Huffman and Jensen‘s (2004) study on margarines. In valuing the
implicit price of nutritional enhancements in margarine, the authors employed
a dummy variable for a specific brand of margarine to signal for the presence
of plant stenol esters and unsaturated sterols.
Brand-specific effects can also be regrouped by using a dummy variable
per brand. For instance, Maguire et al. (2004) restricted their data to
observations of four prominent brand-name baby foods, with a dummy
variable to represent each. This decreases multicollinearity in contrast to
Schulz et al.‘s (2010) approach. Another method is to regroup brands in
simpler categories, such as store brand and major brand (Chang et al., 2010).

26
This alternative captures the price premiums and discounts associated with
private labels and well-known brands, and allows variables that account for
explicit label claims to capture price premiums associated with labelling
information.
2.7.3.2 Store Characteristics
Akin to including neighbourhood characteristics when determining
housing prices, hedonic pricing models for retail food products can incorporate
store attributes. As stated by Ward et al. (2008), this implies that store
characteristics are associated with a consumer‘s overall shopping experience.
Food products are sold in different store types. Categories include grocery
stores, discount stores, specialty shops, ethnic shops, convenience stores, co-ops
and markets. Each store type may be represented with its own dummy variable, or
a single dummy variable may be used to separate purchases from grocery stores
from all other types of specialty shops. Studies have shown that store
characteristics capture a portion of a product‘s price. For instance, Maguire et al.
(2004) used both a continuous variable for square footage of grocery stores and
dummy variables for other types of food outlets to estimate the price premium for
organic baby food. Parcell and Schroeder (2007) found that different store types
explain the price of different pork cuts: for example, supercenters have a
significant impact on the price of steak while warehouses command a positive
price premium for pork chops, ribs and roast. In general, one can expect, as per
Ward et al.‘s (2008) results, that products are priced lower in discount stores and
warehouse club stores than in grocery supermarkets and specialty shops.
The product itself may give an indication as to which types of outlets are
significant explanatory variables. For example, convenience stores sell baby food
at a higher price than other store types, and thus convenience stores are a
significant variable in Maguire et al.‘s (2004) study. On the other hand,
convenience stores do not often sell meat, and that store type was not a significant
variable for Parcel and Schroeder‘s (2007) hedonic model for retail pork cuts.

27
2.7.3.3 Other attributes:
Region: There may be regional differences to the general environment in
which products are bought and sold. For instance, Ward et al. (2008) gathered
data from three metropolitan areas to study the implicit value of beef product
attributes and assigned dummy variables for each city to account for cost-of-
living differences. An alternative way to analyze retail differences is to run
regressions per region of interest. Chang et al. (2010) ran two regressions of
their hedonic model per metropolitan area and conducted a Chow test to reject
the hypothesis that the implicit prices of retail egg attributes were equal across
locations.
Price Index/Time of Year: Hidano (2002) argues that the hedonic approach
must be based upon cross-sectional data according to the theory of
capitalization hypothesis: if a good‘s price is a function of its attributes, that
price can differ over time, such as in the stock market, or over space, such as
in the housing market. Hedonic theory is based on price differentials of a good
at one time in the market, and, as such, is based upon cross-sectional
capitalization rather than time-series capitalization. In practice, there may not
be sufficient data for one time period to perform a hedonic analysis and
therefore, time adjustments should be performed.
If the product studied may be subject to seasonal pricing patterns, monthly
or seasonal dummy variables may be used to capture these variations.
Alternatively, a market price indicator can be used to adjust for changing price
levels over time. For instance, Schulz et al. (2010) used data that spanned over
a 5-year period to study retail steak price. To account for changing prices over
time, the authors calculated weekly weighed average steak prices based on
their scanner data. Temporal variables are mostly used in the case of fresh
produce and meats, whose prices are known to vary. Packaged food prices, on
the other hand, don‘t tend to change during the study period.

28
2.7.4 Functional Form
Theory provides little guidance regarding the functional form to choose
when performing hedonic regressions (Steiner, 2004; Malpezzi, 2002). In general,
the functional form for a hedonic pricing model is not known a priori and
consequently, some researchers argue that the choice of functional form for the
hedonic price function should remain an empirical matter.
In light of the growing number of researchers who chose the functional
form of hedonic models using goodness of fit criterion, Cropper et al. (1988)
designed a study to provide some a priori indication of the functional form that
would most accurately estimate marginal attribute prices. The authors aimed to
identify the optimal choice of functional form for hedonic price functions in the
housing market context. Six forms of the hedonic price function were tested:
linear, semi-log, log-log, quadratic, linear and quadratic functions of Box-Cox
transformed variables. These results were compared with known utility function
bids for houses with given attributes. Cropper et al.‘s conclusions are divided into
two contexts: when all attributes are observed, linear and quadratic Box-Cox
forms perform best. However, in the case where product attributes in the
statistical analysis were incomplete or proxy measures for the quality of the
product were used, the linear, semi-log, log-log and linear Box-Cox functions
performed better than quadratic and quadratic Box-Cox functions. Lastly, the
authors suggested, based on the results of their simulations, that the linear Box-
Cox and linear forms were best suited for hedonic pricing analysis.
With respect to the analysis of food attributes, the choice of functional
form for hedonic pricing models is predominantly linear or semi-log. Since
dummy variables are often used to identify the presence or absence of attributes,
the log-log form is an unsuitable option. Semi-log and linear functional forms
each have strengths and weaknesses and the Box-Cox transformation model can
help steer the selection of either functional form.

29
2.7.4.1 Linear model
The linear model links a good with its attributes by representing price as a
function of its characteristics plus a random error term:
The linear model is considered by some to be unrealistic because it implies
that an attribute‘s implicit price is independent of other characteristics and
displays zero variance across sample observations (Rosen, 1974). Also, when
dealing with empirical issues, a non-linear form is preferred when potentially
dealing with heteroskedasticity (Steiner, 2004). However, linear specifications are
easy to interpret, as a unit increase in an attribute causes the price to rise by the
amount equal to the attribute‘s coefficient.
An example where a linear regression model is used (and justified) is
Schulz et al.‘s (2010) hedonic analysis of the value of beef steak branding using
retail scanner data. The authors considered that the attributes of steak are
separable and additive, estimated the implicit prices of retail steak characteristics
using a linear and log-linear model, and obtained quantitatively similar results.
Likewise, Maguire et al. (2004) estimated the price premium for organic
baby food using a linear hedonic model by arguing that the characteristics of baby
foods, such as stage, type and flavour, can be found and purchased in any
combination of attribute bundles. In proposing that the attributes of baby foods
vary independently from each other, the authors utilized a linear model to perform
their analysis. Their choice of functional form also insinuates that the assumption
of constant implicit marginal price is applicable for the food attributes in their
study and that consumers are unlikely to experience diminishing marginal utility
through the use of the food product or over the total quantity of baby food
consumed. In contrast, Steiner (2004) chose the semi-log functional form to
perform a hedonic price analysis of Australian wines because it was considered
that the marginal implicit prices were non-linear and bundling constraints were
present for wine attributes.

30
2.7.4.2 Semi-log model
The semi-log model is represented by the log of the price of a good as a
function of its defining attributes and a random error term:
One property of the semi-log form in the food labelling context is that the
coefficient measures the percent change in the price of food as a result of a unit
change in a continuous variable attribute (Steiner, 2004). However, where
attributes such as labelling statements are dummy variables, its coefficient can not
be interpreted as the percentage change on the dependent variable. Instead, the
percentage difference associated with a dummy variable, compared with the base
group, may be obtained through the expression [ ( ) ] where c is the
dummy‘s coefficient (Halvorsen and Palmquist, 1980). Alternative approaches to
estimate these percentage effects were reviewed by Steiner (2004).
In addition to the ease of interpretation of its coefficients and its capacity
to include dummy variables, Malpezzi (2002) outlines two other advantages of the
semi-log model. First, the semi-log form may mitigate heteroskedasticity; Diewert
(2003) argues that error terms are relatively more heteroskedastic in linear than
log-linear models. Secondly, the functional form allows the implicit price to vary
proportionally with other explanatory variables. In contrast, the value added of an
attribute is constant with the linear model, regardless of the level of other
attributes. In terms of disadvantages, semi-log models may overstate the marginal
implicit price of attributes when used in an imperfectly competitive market
context where firms can set prices above marginal costs (Feenstra, 1995).
2.7.4.3 Box Cox model
To support theoretical arguments in choosing linear or semi-log
specifications, Box-Cox transformations create rank-preserving transformation of
data using power functions (Spitzer, 1982):

31
( ) {
Using the Box-Cox maximum likelihood analysis is estimated. The
analysis requires all observations to be strictly positive; hence, when dummy
explanatory variables are considered, the transformation is restricted to the
dependent variable. In addition to suggesting the optimal which minimizes the
residual sum of squares of the modified variables, STATA also tests whether
are appropriate transformations. Given that the null hypothesis H0:
can not be rejected at the given confidence level,
if , a linear model should be used;
if , a semi-log functional form is appropriate;
if , the Box-Cox test suggests an inverse specification.
Examples of researchers who have used the Box-Cox maximum likelihood
method to estimate the optimal are Li and Hooker (2009) and Loureiro and
McCluskey (2000). Li and Hooker (2009) found that the semi-log form was most
appropriate to investigate food safety claims on product prices. A linear
specification was chosen by Loureiro and McCluskey (2000) to assess consumer
response to Protected Geographical Identification logos.

32
3 CHAPTER III: DATA AND MODEL SPECIFICATION
Data 3.1
Two types of scanner data can be gathered to evaluate consumer purchase
behaviour: point-of-sale or store scanner data and household-based scanner data
(Zhen et al., 2009). Store scanner data are collected at cash registers and identify
the products, quantities sold and prices paid. Household-based scanner data come
from a panel of households who record their grocery purchases and scan the
Universal Product Codes (UPCs) of purchased products after each shopping trip.
In comparison to store scanner data, household-based scanner data includes
additional information on household demographic characteristics. Since
household data are self-recorded, questions have been raised concerning its
accuracy (Einav et al., 2008), but this type of data is better suited for deriving
demand functions once implicit prices are estimated. .
For the purposes of this study, Nielsen MarketTrack data provided
aggregated weekly sales information from 2008-2010 per UPC from a
representative sample of stores in Québec. The dataset, which contained store-
specific and UPC-specific information, did not contain front-of-package labels or
nutrient composition data. To address this deficiency, information was gathered
from September to October 2011 to complete the Nielsen data with front- and
back-of-package information, through (1) pictures of in-store products from
various retail stores in Montreal; (2) pictures of products sent by milk processing
companies and (3) Internet-based research.
Since this study was based on weekly store-level data comprised of
aggregated individual consumer purchases, an important limitation is that the
conclusions provide insights at the retail level rather than at the individual
consumer level (Ahmad and Anders, 2011). A second data-based source of error
came from the time-lag between the sales data and the front-of-package data
gathered in 2011. Additionally, product packaging may have changed within the
2008-2010 sales period and 2011 labels may be less representative of actual

33
product packages in earlier years. This project analysis was based on the 2010
MarketTrack data only.
3.1.1 Product Characteristics
In addition to UPC-code and product description, the Nielsen MarketTrack
data contained product-level information such as price, product weight, package
type, milk type (e.g. cow‘s milk, goat milk, buttermilk), brand and function (e.g.
micro-filtered, calcium-fortified, lactose-free, organic). This was supplemented
with front-of-package information gathered in September and October 2011, and
labels were categorized based on product-specific groups of characteristics. While
the CFIA‘s categories of (1) composition, quality, quantity and origin claims, (2)
nutrient content claims and (3) health claims were originally considered, most
labels considered were part of the nutrition content claims category because of
collinearity with other variables. For instance, a preservative-free composition
claim is present on all Grand Pré milks, a brand of ultra-high temperature (UHT)
milk, and the implicit price of that front-of-package label couldn‘t be
distinguished from the brand effect. Also, certain labels were present on all
products, and were excluded from analysis. For example, milk products have
either front-of-package statements that indicate they are fortified with vitamin A
and D (skim, 1% and 2% milk), or vitamin D (homogenized milk).
3.1.2 Store Characteristics
Sampled stores were originally placed in one of two categories: (1) gas
stations and convenience stores; (2) groceries, drugstores and ―mass‖ stores
(Walmart and Zellers). The second category of stores was further disaggregated
using Google Maps and the first three digits of the alphanumeric postal code of
the store location (known as the Forward Sortation Areas or FSAs). Individual
supermarket chains identified were: Maxi, Super C, Loblaws, Provigo, Metro and
IGA. A portion of these grocery stores are known to follow Everyday Low Price
34
(EDLP) pricing strategies, while the remaining chains follow Hi-Lo promotion-
based pricing strategies. Supermarket chains were considered separately to test
differences in preferences for labelling statements and attributes per food
category, while ―mass‖ stores were grouped together. Remaining stores in the
second category could not be identified individually, and were grouped as other
stores.
Additionally, the first three digits of each store‘s postal code were
matched with Canada Post FSA maps to characterize the general environment
surrounding a store. In accordance with Statistics Canada‘s (2007) definition of
urban areas, stores in areas with a population of at least 1,000 people and no fewer
than 400 persons per square kilometre were classified as urban, while stores
located in regions that did not match the aforementioned criterion were classified
as rural.
Descriptive Statistics 3.2
Tables 1 and 2 provide per-variable summary statistics for milk and oatmeal
products, respectively. These statistics are conveyed in terms of (1) the percentage
of UPCs possessing various attributes considered in the analysis; (2) the
percentage of observations possessing these characteristics; and (3) the percentage
of total sales according to attributes observed. Comparing the first (% Total UPC)
and second column (% Obs.) reflects the availability of UPCs possessing various
attributes, while the third column (% Sales) reflects the quantity sold of each UPC
per week, weighed by product price.
3.2.1 Descriptive Statistics of Retail Milk Products
Table 1 reports the breakdown of 796,443 observations of 509 milk
products, in the form of summary statistics associated with continuous and binary
variables for milk. The average price per litre of milk excludes January 2010 data
due to RMAAQ price revisions. Binary variables are separated into product-level
and store-level categories.

35
Product-level attributes. The first binary product-level attribute captures
price regulations of retail milk in Québec. While there are no regulations in
Ontario regarding the retail price of milk (Dairy Farmers of Ontario, 2012), the
Régie des marchés agricoles et alimentaires du Québec (RMAAQ) sets minimum
and maximum prices for ―regular‖ or ―base‖ milk, which is milk of 1 to 4-litre
formats sold in cartons and plastic bags. The Loi sur la mise en marché des
produits agricoles, alimentaires et de la pêche (L.R.Q., c. M-35.1) does not apply
to milk sold in smaller formats, in plastic jugs, flavoured milk, Kosher milk,
organic milk and other value-added milk (RMAAQ, 2011). Table 1 reports that
approximately 75% of UPCs are part of the price-unregulated milk category, and
represent over 80% of sales. Weighed by quantities sold and product prices,
regulated and unregulated milks each accounted for approximately half of total
milk sales in 2010. This is due in large part to the sale of price-regulated 4-litre
milk, whose large format leads to a higher sales price.
Regulated milk prices are usually revised on an annual basis by the
RMAAQ on February 1st, according to a fluid milk price indexing formula based
on three weighed indices: (1) 30% from the Canadian Consumer Price Index, (2)
30% from Quebec‘s disposable personal income and (3) 40% from Canadian
dairy producers‘ Industrial Production Index (Fédération des producteurs de lait
du Québec, 2011). The index yields the price ceiling, and the price floor is priced
0.15$/litre below. Regulated prices are set for four volume formats and three
regions; the RMAAQ‘s delineation for each region is described Appendix I.
Compared to Region I prices, fluid milk sold in Region II commands a 0.06$,
0.12$ and 0.20$ price premium for 1-litre, 2-litre and 4-litre formats, respectively.
Similarly, a price premium of 0.27$, 0.53$ and 1.04$ is observed for 1-litre, 2-
litre and 4-litre milks sold in Region III, compared to Region I.
Between 2008-2010, the RMAAQ revised regular milk price minimums
and maximums four times; the latest one dated February 1st, 2010 (Appendix II).
To this effect, while descriptive statistics represent all data for the year 2010,
regressions were run excluding the month of January to avoid the addition of a

36
dummy variable to control for time adjustments; this decreases the total number
of observations to 706,208.
In order to test for the significance of front-of-package labels, product
characteristics were controlled for using milk type, fat, flavour, process, function
and brand categories. The labels in these categories are assumed to be search
attributes rather than credence attributes. The function category groups milk that
provides ―health benefits beyond what regular milk provides‖ (Parmalat South
Africa, no date), such as milk enriched with calcium and DHA, lactose-free milk,
organic milk and reduced-sugar milk. While Nielsen (2007) reports that one in
three North Americans regularly purchases milk with added vitamins and
minerals, this does not seem to be reflect in the dataset, as the market share of
functional milk was found to represent less than 7% of total sales in Québec in
2010. The impact of brand names on milk products was accounted for by
separating private from local and national brands. While local brands account for
one third of UPCs, they represent only 3% of the total observations. In contrast,
national brands represent 67% of total UPCs and 96% of the observations.
Several categories of front-of-package labels were considered. Region of
production labels and pasteurized milk labels are categorized by the CFIA as
composition, quality, quantity and origin claims, while the remaining front-of-
package labels are classified as nutrient content claims. Two labels identifying
region of production were also included: symbols representing 100% Canadian
milk and labels identifying milk produced and processed in the province of
Québec. The two labels in the latter category are that of ―Aliments du Québec‖
and Natrel‘s ―Québec Proud, Local farmer owned‖ symbols. Foods displaying the
first symbol are considered by the Aliments du Québec organization as being
―product[s] entirely made from ingredients sourced in Québec or composed of a
minimum of 85% of main ingredients from Québec. All the processing and
packaging activities [are] done in Québec‖ (Aliments du Québec, 2011). The label
is specific to one brand of locally-produced milk. Thus, the set of UPCs which
display region of Québec labels is only represented by two brands, and the impact
of brand effect on region of production labels should be kept in mind. The Natrel

37
label is self-reported and suggests their milk comes from local Québec farms. The
second part of the statement (Local farmer owned) is slightly ambiguous, and may
imply the company is farmer-owned, or that Québec farmers are owners of their
dairy farms. Table 1 shows that approximately two thirds of UPCs are not
associated with region of production labels, 30% display product of Canada label,
and 8% show a product of Québec label.
Five other dummy variables accounted for nutrient content claims about
the presence of cholesterol, fat, calcium and protein. Any label pertaining to the
level of cholesterol was grouped together, while two separate categories
accounted for statements pertaining to fat content. Low fat labels are found on
certain chocolate flavoured and non-flavoured milks. As these labels generally
indicate that the product has 1% milk fat, the correlation between 1% milk and the
low fat label is 22.87%. In the dataset, fat free labels were only associated with
skim milk products and consequently represent an interaction term, Fat
Free*Skim Milk. Another nutrient considered was calcium: any front-of-package
label advertising calcium presence or the daily value of calcium per serving of
milk was grouped together, excluding calcium-content labels for calcium-added
milk, which are accounted for in the function category. Similarly, front-of-
package claims pertaining to protein presence, generally associated with flavoured
milk, are regrouped together. Overall, these five dummy variables advertise
information that is verifiable by consumers, as the nutrients are all included
contained on the Nutrition Facts table. The most predominant label found on
fluid milk products is the calcium label (14.14%) followed by protein (4.13%),
low fat (3.54%), fat free (2.95%) and cholesterol (2.36%).
In contrast, the last product label considered in this study is not verifiable
through the Nutrition Facts table. Although the Food and Drug Regulations
prohibit the sale of raw (unpasteurized) milk in Canada (Health Canada, 2005),
11.98% of the fluid milk products display a pasteurized milk claim. Since only
local processors advertise on the front of packages that their milk products are
pasteurized, these labels are characterized by the interaction of two variables:
Pasteurized Milk*Local Brand.

38
Store-level attributes. Individual supermarket chains are referred to as
Retail1–Retail6 for confidentiality purposes. Descriptive statistics for Walmart
and Zellers were grouped into the Box category, while information pertaining to
gas stations and convenience stores were aggregated into the Gas category.
Unidentified drugstores and specialty stores were grouped into the Other store
category. Table 1 shows the average number of products offered per store is
lowest in gas stations and convenience stores, and highest in grocery stores. Also,
the high standard deviation in the number of products offered per store in the
Other store category reflects the fact that it includes different types of retail shops.
In terms of store regions, summary statistics do not suggest a noteworthy
difference in average number of products offered between urban and rural stores.
Given that 80% of the total population of Québec lived in urban areas in 2006
(Statistics Canada, 2009), it is not surprising that the breakdown of the number of
observations and percentage of total sales is largely skewed towards urban areas.
Also, RMAAQ regions for price-regulated milks were not originally included as
variables because FSAs are not a perfect match for the Régie‘s defined territories
(Appendix I). Regional-level market differences are tested for in Chapter IV.

39
Table 1. Descriptive Statistics of Retail Milk UPCs by Attributes
Product-level attributes (continuous)
Mean
Standard
deviation Min Max
Price per Litre ($/L)1: 2.36 0.90 0.5 19.95
Volume (Litres): 1.82 1.17 .15 4
Product-level attributes (binary)
% Total
UPC
% Obs % Sales
Price Regulation:
Regulated 25.74 18.11 56.48
Unregulated 74.26 81.89 43.52
Type:
Cow milk 98.23 98.43 99.68
Buttermilk 0.98 0.63 0.17
Goat Milk 0.79 0.94 0.15
Fat:
Skim 13.75 12.57 6.80
1% 35.36 37.97 24.52
2% 33.79 31.30 50.54
Homogenized 17.09 18.16 18.14
Flavour:
Chocolate 17.09 15.38 4.94
Strawberry 1.57 1.85 0.13
Other 1.18 0.90 0.07
No Flavour 80.15 81.86 94.86
Process:
Micro-filtered 14.73 35.84 28.08
UHT Milk 3.14 3.07 0.41
No Special Process 82.13 61.09 71.52
Function:
Calcium Added 2.36 3.17 0.88
DHA (docosahexaenoic acid) Added 1.38 1.04 0.13
Lactose-Free 4.32 5.81 2.66
Organic 6.68 3.94 1.00
Omega-3 Enriched 2.16 3.52 1.16
Prebiotic/ Probiotic Enriched 2.36 1.04 0.12
Reduced-Sugar 1.38 2.17 0.32
No special function 79.36 79.31 93.73
Brand Label:
Local 31.24 2.82 3.83
Private 1.57 0.76 0.37
National 67.19 96.42 95.80
1 February 2010-December 2010
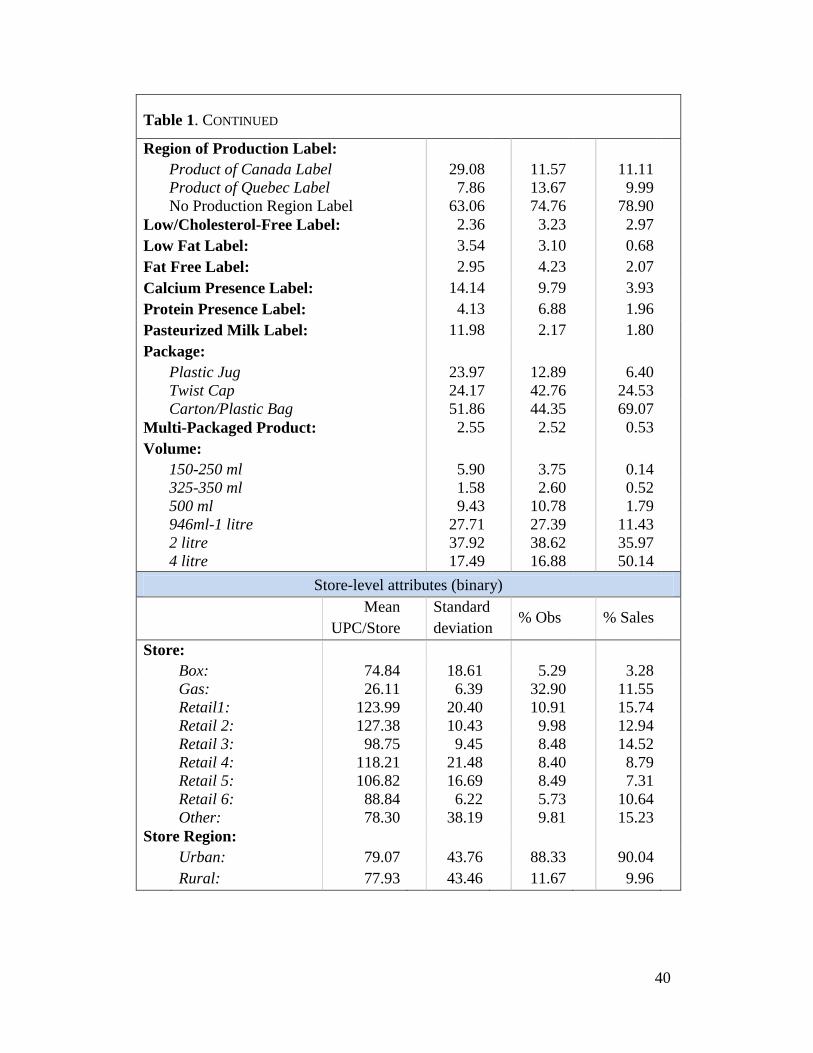
40
Table 1. CONTINUED
Region of Production Label:
Product of Canada Label 29.08 11.57 11.11
Product of Quebec Label 7.86 13.67 9.99
No Production Region Label 63.06 74.76 78.90
Low/Cholesterol-Free Label: 2.36 3.23 2.97
Low Fat Label: 3.54 3.10 0.68
Fat Free Label: 2.95 4.23 2.07
Calcium Presence Label: 14.14 9.79 3.93
Protein Presence Label: 4.13 6.88 1.96
Pasteurized Milk Label: 11.98 2.17 1.80
Package:
Plastic Jug 23.97 12.89 6.40
Twist Cap 24.17 42.76 24.53
Carton/Plastic Bag 51.86 44.35 69.07
Multi-Packaged Product: 2.55 2.52 0.53
Volume:
150-250 ml 5.90 3.75 0.14
325-350 ml 1.58 2.60 0.52
500 ml 9.43 10.78 1.79
946ml-1 litre 27.71 27.39 11.43
2 litre 37.92 38.62 35.97
4 litre 17.49 16.88 50.14
Store-level attributes (binary)
Mean
UPC/Store
Standard
deviation % Obs % Sales
Store:
Box: 74.84 18.61 5.29 3.28
Gas: 26.11 6.39 32.90 11.55
Retail1: 123.99 20.40 10.91 15.74
Retail 2: 127.38 10.43 9.98 12.94
Retail 3: 98.75 9.45 8.48 14.52
Retail 4: 118.21 21.48 8.40 8.79
Retail 5: 106.82 16.69 8.49 7.31
Retail 6: 88.84 6.22 5.73 10.64
Other: 78.30 38.19 9.81 15.23
Store Region:
Urban: 79.07 43.76 88.33 90.04
Rural: 77.93 43.46 11.67 9.96

41
3.2.2 Descriptive Statistics of Retail Oatmeal Products
Table 2 describes weekly scanner data for 105 oatmeal products across
143,527 observations. Unlike milk, where nutrient characteristics were controlled
for through the fat percentage attribute category, continuous variables
representing the main nutrients found on the Nutrition Facts table were employed
as explanatory variables for oatmeal. This is mainly due to the large variation in
nutrient composition for flavoured oatmeal. Binary attributes were separated into
product-level and store-level categories.
Product-level attributes. The percentage daily values (% DV) of calories,
fat, sodium, carbohydrates and fibre, as well as sugar and protein content (grams),
were adjusted for differences in serving size and considered on a 40g serving
denominator. Different product-level characteristics include oatmeal type, cooking
time, package, flavour, function and brand. Two brand-specific functional
oatmeal products were included for analysis, Quaker® Reduced Sugar Instant
Oatmeal and Quaker® Weight Control Instant Oatmeal2. The former represents
flavoured oatmeal products with reduced sugar content, while the latter offers
traditional flavours ―designed to help you with your weight management plan
without sacrificing any of the great flavour you've come to expect from the
Quaker brand‖ (PepsiCo Canada ULC, no date). In general, the nutritional
characteristics of Reduced Sugar and Weight Control products can not be directly
compared to Quaker regular instant oatmeal due to differences in the types of
flavour offered. However, Quaker offers apple cinnamon flavoured oatmeal in
both Reduced Sugar and regular formats, and maple & brown sugar flavoured
oatmeal in both Weight Control and regular formats. The Reduced Sugar oatmeal
contains the same level of fat and protein as regular apple cinnamon oatmeal, but
has lower levels of carbohydrates, sodium and fibre. The Weight Control product
contains the same level of fat as regular maple & brown sugar oatmeal, lower
levels of carbohydrates and sugars, and higher levels of sodium, fibre and protein
2 Referred to hereafter as Quaker Reduced Sugar and Quaker Weight Control oatmeal,
respectively.
42
per serving. The purpose of including these variables was to test for price
premiums associated with new combinations of nutrients that consumers may
perceive as providing health benefits. In terms of brand, Quaker was considered
separately from other national brands because of its dominance and availability in
the oatmeal industry. Quaker captured over 80% of total sales in 2010, while it
represented less than 30% of product UPCs.
Four front-of-package labels are considered in Table 2. The category
artificial flavour contains any statement that includes the term ―artificial,‖ such as
―natural and artificial flavours‖, while the category natural flavour controls for
oatmeal products with natural flavours only. In addition, two claims about fibre
content and whole grain composition were considered. These front-of-package
labels are relatively prevalent on oatmeal products; statements about fibre content
can be found on 39% of UPCs, while statements about whole grain oatmeal are
observed on over one fifth of oatmeal products. The frequent use of these labels
suggests they are important search attributes, reflecting a recent Nielsen study that
one in two North Americans buy whole grain, high fibre products (Nielsen, 2007).
Store-level attributes. As with milk, individual supermarket chains are
referred to as Retail1–Retail6 for confidentiality purposes. It should be noted that
stores in the category Gas, which groups gas stations and convenience stores,
offered only one oatmeal product for consumers to purchase. This limited product
selection does not violate Rosen‘s (1974) assumption of a continuum of products
available for consumer selection, as hedonic theory refers to the total choice set
available to consumers rather than the number of UPCs per store. While one may
hypothesize that product selection may vary according to store region and that
consumers living in urban areas have a larger choice set in comparison to those
living in rural areas, the descriptive statistics in the store region category only
suggests a slight difference in the average number of product per store.

43
Table 2: Descriptive Statistics of Retail Oatmeal UPCs by Attributes
Product-Level Attributes (continuous)
Mean
Standard
Deviation Min Max
Price per Serving ($/350g):
2.57
1.27
.39
6.90
Volume (g): 613.03 417.26 228 2250
Mean
Standard
Deviation
Nutritional Information (serving = 40g):
Calories 148.62 27.62
Fat % 3.75 1.17
Sodium % .10 .11
Carbohydrate % 9.08 1.78
Fibre % 15.04 5.42
Sugar (g) 4.26 5.09
Protein (g) 5.18 2.32
Product-Level Attributes (binary)
% Total
UPC % Obs % Sales
Type:
Regular 81.90 93.68 97.26
Oat Bran 6.67 0.02 0.01
Steel cut/Scottish 8.57 6.04 2.62
Other: Muesli, Gluten-Free 2.86 0.26 0.11
Cooking Time:
Instant 49.52 64.40 65.98
Minute 15.24 17.74 20.34
>Minute 35.24 17.85 13.68
Package:
Regular 94.29 98.68 99.42
Special (Bowls) 5.71 1.32 0.58
Flavour:
Apple Cinnamon Flavour 5.71 8.63 6.91
Berry Flavour 5.71 4.64 2.81
Cream Flavour 4.76 8.02 4.93
Kid Flavour 1.90 7.22 7.81
Maple Flavour 10.48 13.46 21.60

44
3 % flavoured oatmeal
Table 2. CONTINUED
Flavour:
Raisin Flavour 2.86 2.78 1.80
Other Flavour 5.71 5.69 3.11
Variety of Flavours 9.52 8.63 9.66
(All Flavours) (46.67) (58.56) (58.64)
No Flavour 53.33 41.44 41.36
Function:
Organic 13.33 5.12 1.67
Quaker Reduced Sugar 2.86 9.52 6.14
Quaker Weight Control 1.90 5.18 4.01
No Special Function 81.91 80.19 88.18
Brand Label:
Local Brand 13.33 2.51 0.84
National Brand 30.48 10.37 6.73
Private Brand 28.57 18.09 10.98
Quaker Brand 27.62 69.03 81.46
Flavour Label3:
Natural Flavour (Only) 28.57 34.91 53.31
Artificial Flavour Presence 28.57 42.58 36.40
No Flavour Type Label 42.86 22.51 10.29
Fibre Content Label: 39.05 62.37 66.54
Whole Grain label: 20.95 16.96 19.26
Store-level attributes (binary)
Mean
UPC/Store
Standard
Deviation % Obs % Sales
Store:
Box 30.54 8.08 8.50 6.97
Gas 1.00 0.00 0.03 0.01
Retail1 42.64 3.64 18.29 15.13
Retail2 58.24 3.44 17.48 16.65
Retail3 33.83 4.12 14.57 16.34
Retail4 42.04 2.72 9.68 7.55
Retail5 44.60 7.84 12.56 7.10
Retail6 26.80 1.69 7.70 13.00
Other 42.44 8.47 11.19 17.26
Store Region:
Urban 42.85 10.70 87.76 91.69
Rural 39.12 8.90 12.24 8.31

45
Large Sample Size 3.3
One characteristic of the scanner data is its large sample size, with nearly
800,000 observations for weekly milk sales and approximately 150,000
observations for oatmeal. An important implication of using a very large dataset is
that the null hypotheses are characteristically rejected with large sample sizes and
hence almost any parameter may be found statistically different from zero (Bakan,
1966). Kennedy (2008) explains that most explanatory variables will have some
influence on a dependent variable. Consequently, as the variances and covariances
of least squares estimators are inversely proportional to sample size, increasing
the number of observations will reduce variance. Given a significance test where
the null hypothesis H0: , the small variance leads to its rejection:
( )
( ) ( )
where ( ) √ ( ) [
∑ ( ̅)
]
Bakan (1966) lists the five factors influencing the probability of rejecting a
null hypothesis: (1) the choice of conducting a one- or two-tailed test; (2) the
chosen level of significance; (3) the standard deviation; (4) the amount of
deviation from the null hypothesis, which is unknown; and (5) the number of
observations. While some of the factors may not be controlled by statisticians, one
of Kennedy‘s (2008) suggestions given a too-large sample-size problem is to
adjust the significance level downward.
An alternative solution to distinguish economically significant variables
from statistically significant ones is to report beta coefficient estimates (Kennedy,
2008). Similar to calculating a standard score, standardized coefficients are
obtained by subtracting the mean of a variable from each of its values and
subsequently dividing that result by the variables‘ standard deviation. In this
manner, the variances of standardized coefficients are equal to 1. Standardized
coefficients measure the impact, in standard deviations, of one standard deviation
change in the explanatory variable on the dependent variable. This enables a

46
comparison of the magnitudes of influence of independent variables on the
dependent variable.
Model Specification 3.4
A linear hedonic pricing model was chosen to estimate the value of retail
milk attributes (Equation 1). The choice of a linear functional form was based on
theoretical considerations that milk products can be purchased in any combination
of attribute bundles; in other words, their attributes were hypothesized to be
separable and additive. Results from a Box-Cox specification test were
inconclusive in helping select either a linear or semi-log functional form. For
oatmeal, a semi-log functional form was chosen to better capture how
characteristics tend to be bundled together, according to whether oatmeal is
flavoured or non-flavoured (Equation 2). The Box-Cox test rejected both
and at a 95% confidence level, but the optimal suggests a log-
transformed dependent variable.
(1)
∑
∑
(2) ( ) ∑
∑
Equations 1 and 2 outline the relationship between different categories of
explanatory variables and the dependent variable , the price for the ith product
package in the tth store. Attributes were separated into product-level (A) and
store-level (C) categories: is the level of the jth product attribute associated
with the ith package, is the level of the kth store attribute in store t. The
implicit prices are the coefficients to be estimated, represented by and for
product and store attributes, respectively. Also, denotes the intercept and
represents the stochastic error term. Variable definitions for milk can be found in
Table 3, and the dependent and independent variables chosen for oatmeal are
detailed in Table 4.

47
3.4.1 Hedonic Pricing Model for Milk
The specific hedonic pricing model for milk is:
( ) ∑
∑
∑
∑
∑
∑
∑
∑
∑
∑
∑
∑
Table 3 offers details concerning the 20 explanatory variables in the
hedonic model. In addition, ex-ante expectations of each coefficient‘s sign are
tabulated in the second column, titled E(sign). For milk, price per litre was
expected to decrease at a non-linear rate as the total volume of the product
increases; this meant including the variables volume and (volume)2. Compared to
price-regulated milk, the non-regulated variable was expected to carry a positive
implicit price. All other dummy variables were projected to have positive
coefficients in relation to the base-group, except in the brand category, where
local brands were predicted to carry a positive implicit price and private brands
were presumed to carry a negative implicit price. In the other labels attribute
category, front-of-package labels were expected to carry positive coefficients, to
reflect the hypothesis that information is positively valued. It was also suggested
that the size of label coefficients would be smaller than those for other variables,
such as flavour, milk type and package type, since product attributes likely carry
more weight in purchasing decisions. In terms of store-level variables, box stores
were predicted to sell milk at a lower price than other retail stores. Lastly, it was
unclear whether the coefficient for the variable urban would carry a positive or
negative sign, compared to the base group rural. The cost of living in urban areas

48
may drive prices up (Ward et al., 2008) but the higher competition between stores
may drive prices down.
It should be noted that the five labels denoting nutrient content claims and
the pasteurized milk label do not form a mutually exclusive category and that
individual UPCs may display one or several of each label. Regrouping the claims
would have involved considering the different combinations of labels by
including several interaction terms, which was avoided in order to respond to the
primary objective of establishing whether these labels were significant in the first
place.
Table 3. Definitions of Variables for the Hedonic Price Model for Milk
Dependent Variable
Pricei: Price per litre ($) of UPC i in store t
Product-Level Attributes
Variable E(Sign) Description
Volumei: (–) Volume of the ith product (litres)
(Volume2)i: (+) Squared volume of the ith product (litres
2)
Regj: (+) Dummy variable for price-regulated milk: j=1-2;
Base=regulated, 2=non-regulated
Fat_Pctj: (+) Dummy variable for milk fat percentage: j=1-4;
Base=skim, 2=1%, 3=2%, 4=homogenized
Bulkj: (+) Dummy variable for product bulk type: j=1-3;
Base=none, 2=single serve (500ml and less),
3=multi-packaged product
PkgTypej: (+) Dummy variable for milk package type: j=1-3;
Base=carton/plastic bag, 2=twist cap,
3=plastic
MilkTypej: (+) Dummy variable for milk type: j=1-3;
Base=cow milk, 2=buttermilk, 3=goat milk
Processj: (+) Dummy variable for milk processing: j=1-3;
Base=pasteurized, 2=UHT, 3=micro-filtered

49
Table 3. CONTINUED
Variable E(Sign) Description
Functionj: (+) Dummy variable for special functions: j=1-8;
Base=no function, 2=calcium-added,
3=DHA; 4=lactose-free, 5=omega3,
6=organic, 7=prebiotic/probiotic, 8=reduced
sugar
Flavj: (+) Dummy variable for milk flavour: j=1-4;
Base=no flavour, 2=chocolate milk,
3=strawberry milk, 4=other flavours
Brandj: (+/–) Dummy variable for brand type: j=1-3;
Base=national brand, 2=local brand,
3=private (store) brand
Reg_Prodj: (+) Dummy variable for region of production labels:
j=1-3;
Base=no region of production label;
2=product of Canada; 3=product of Québec
Other Labels:
Chol_Lbli: (+) Dummy variable for low-cholesterol label
Fat1_Lbli: (+) Dummy variable for low-fat label
Fat2*Skim_Lbli: (+) Dummy variable for fat-free milk label
Calc_Lbli: (+) Dummy variable for calcium presence label
Prot_Lbli: (+) Dummy variable for protein presence label
Past*Local_Lbli: (+) Dummy variable for pasteurized milk label
Store-Level Attributes
Storej: (+) Dummy variable for retail chain: j=1-9;
Base=box stores (Walmart and Zellers), 2=
Gas, 3= Store1, 4=Store2, 5= Store3, 6=
Store4, 7= Store5, 8= Store6, 9=Other stores
Regionj: (?) Dummy variable for store region: j=1-2;
Base=rural, 2=urban

50
3.4.2 Hedonic Pricing Model for Oatmeal
The specific hedonic pricing model for oatmeal is:
( ) ( )
∑
∑
∑
∑
∑
∑ ∑
∑
∑
As with the hedonic model for milk, ex-ante expectations for coefficient
signs are outlined in Table 4. The nutritional information category refers to
nutrient content information found on the Nutrition Facts table. The percentage
daily values (% DV) and grams per serving were adjusted for differences in
serving size and are considered on a 40g serving denominator. Serving size or
calories per serving were two potential variables that were omitted because they
are highly correlated with the daily value of carbohydrates (Appendix III).
In terms of projected coefficient signs, it was expected that a one percent
increase in the daily allowance of calories, fat, sodium, carbohydrates and sugar
would be associated with a negative implicit price, while positive coefficients are
attached to fibre and protein content variables. For cooking time, it was projected
that instant oatmeal would be preferred to oatmeal products associated with longer
cooking times. For brands, it was suggested that local brands would be priced
higher than the base group, but that the Quaker brand would be more expensive
than national brands and private brands. With respect to front-of-package labels,
the natural flavours label was posited to be associated with a positive coefficient,
while flavoured oatmeal advertised as containing artificial flavours were posited
to be associated with negative coefficients. As for milk, it was hypothesized that

51
nutrient content labels are positively regarded and that the coefficients for the
fibre label and whole grain dummies would be positive.
Table 4. Definitions of Variables for the Hedonic Price Model for Oatmeal
Dependent Variable:
Pricei: Price per box ($/350g) of UPC i in store t
Product Attributes (A):
Variable E(Sign) Description
Weight:
(–)
Weight of the ith product (kg)
(Weight2): (+) Squared weight of the ith product (kg
2)
Nutritional Information:
Fat_Pcti (–) Fat content (% per 40g serving) of the ith
product
Sod_Pcti: (–) Sodium content (% per 40g serving) of the ith
product
Carb_Pcti: (–) Carbohydrate content (% per 40g serving) of the
ith product
Fibre_Pcti: (+) Fibre content (% per 40g serving) of the ith
product
Sug_Gri: (–) Sugar content (grams per 40g serving) of the ith
product
Protein_Gri: (+) Protein content (grams per 40g serving) of the
ith product
Typej: (+) Dummy variable for oatmeal type: j=1-4;
Base=regular, 2=oat bran, 3=steel
cut/Scottish oatmeal, 4=other
Timej: (–) Dummy variable for cooking time type: j=1-3;
Base=instant, 2=minute; 3=(>minute)
Pkg_Typej: (+) Dummy variable for package type: j=1-2;
Base=regular, 2= pre-packaged bowls
Flavourj: (+) Dummy variable for flavoured oatmeal: j=1-9;
Base=no flavour, 2=apple cinnamon,
3=berry, 4=cream, 5=kid, 6=maple, 7=raisin,
8=other, 9=variety
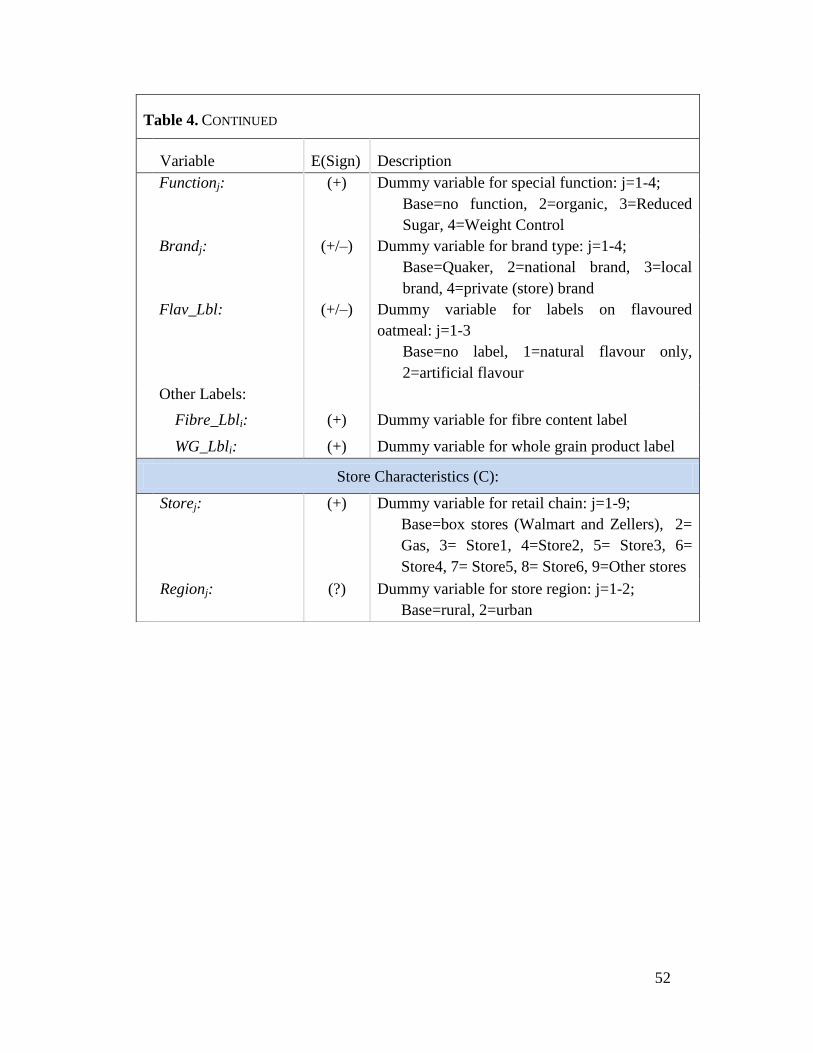
52
Table 4. CONTINUED
Variable E(Sign) Description
Functionj: (+) Dummy variable for special function: j=1-4;
Base=no function, 2=organic, 3=Reduced
Sugar, 4=Weight Control
Brandj: (+/–) Dummy variable for brand type: j=1-4;
Base=Quaker, 2=national brand, 3=local
brand, 4=private (store) brand
Flav_Lbl: (+/–) Dummy variable for labels on flavoured
oatmeal: j=1-3
Base=no label, 1=natural flavour only,
2=artificial flavour
Other Labels:
Fibre_Lbli: (+) Dummy variable for fibre content label
WG_Lbli: (+) Dummy variable for whole grain product label
Store Characteristics (C):
Storej: (+) Dummy variable for retail chain: j=1-9;
Base=box stores (Walmart and Zellers), 2=
Gas, 3= Store1, 4=Store2, 5= Store3, 6=
Store4, 7= Store5, 8= Store6, 9=Other stores
Regionj: (?) Dummy variable for store region: j=1-2;
Base=rural, 2=urban

53
4 CHAPTER IV: RESULTS AND DISCUSSION
Estimates of the hedonic price model for milk are shown in Table 5 and
the regression results for the semi-log model for oatmeal are presented in Table 6.
Test results suggested the presence of heteroskedasticity in both models; hence
White‘s heteroskedasticity-consistent standard errors are reported.
Retail Milk Results 4.1
As expected given the large sample size, the coefficients for the
independent variables were all statistically significant at 0.01 levels. The signs of
the coefficients largely followed ex-ante predictions: most coefficients were
positive, which means that the price per litre of milk increased given quality and
functional attributes. The beta coefficients, listed in the rightward column of
Table 5, help distinguish economically significant variables from statistically
significant ones. Explanatory variables with larger beta coefficients have a larger
influence on the dependent variable. Table 5 also lists t-statistics in order to
illustrate how a high t-statistic correlates with larger beta coefficients. In other
words, strongly rejecting the null hypothesis that a coefficient is equal to zero
increases the confidence that its associated explanatory variable is significant and
suggests it has a noticeable impact on the dependent variable. Apart from the
intercept, the coefficient associated with milk attributes were divided into three
general categories: product characteristics, product labels and store characteristics.
Generally, beta coefficients were largest for attributes representing product
characteristics, smallest for variables characterizing product labels, and those for
store characteristics were somewhere in between. This suggested that attributes
relating to product characteristics were most economically significant, while label
attributes represented factors of lesser significance in explaining the price per litre
of milk.

54
4.1.1 Product Characteristics
Volume. The sign of the coefficients for volume and (volume)2 suggest
that, on average, the price per litre of milk decreased as volume increased, at a
decreasing rate.
Regulation. As expected, milk that was not price-regulated by the
RMAAQ was associated with a premium of $0.10/L, compared to price-regulated
milk.
Milk Type. Buttermilk was priced $1.12/L higher than regular milk, while
goat milk commanded a higher price premium of $1.72/L.
Fat percentage. The positive coefficients for 1%, 2% and homogenized
milk suggests price per litre increases with milk fat content. However, the price
premiums were relatively low. Estimates show 1% milk and homogenized milk
were priced $0.01/L and $0.08/L more than skim milk, respectively. The beta
coefficient for 1% milk was also very small, suggesting the variable has a minor
impact on price per litre.
Package Type. Twist-cap carton packages and milk packaged in plastic
jugs were priced $0.18/L and $0.41/L more, respectively, than regular packaging.
The price premium may reflect consumer preferences for packaging that preserve
freshness and ensures longer shelf life. Another plausible explanation is that
consumers are willing to pay for convenience; for milk in four-litre formats, the
only choice of packaging is milk sold in plastic bags (regular packaging) or plastic
jugs.
Bulk Type. Results reveal that products with special size-related attributes
were associated with significant price premiums. Milks in formats of 500ml and
less held a price premium of $0.75/L. The variable multi-package associates
products with several units per UPC, such as lunch-ready milk boxes sold in
packs of 3 or more, with a premium of $0.56/L over the base group.
Process. Milk which had been through ultra-high temperature (UHT)
processing was, on average, $1.09/L more expensive than regular milk. In contrast
to pasteurized milk, micro-filtered milk is passed through a membrane that rejects

55
too-large bacteria prior to pasteurization. This additional step removes more
bacteria than through pasteurization alone, extends shelf life (Grand Pré, 2011)
and was associated with a $0.08/L premium.
Flavour. Consistent with a priori expectations, price premiums were
associated with flavoured milk. Chocolate milk was priced higher ($0.57/L) than
strawberry milk ($0.43/L) and other flavoured milks, which groups vanilla-,
banana-, orange-, café latte-, hazelnut- and raspberry-flavoured milks ($0.46/L).
Function. Compared to regular milk, lactose-free milk had the highest
price premium ($1.05/L). Organic milk also commanded a significant price
premium of approximately one dollar per litre, while the other types of enriched
milks were associated with price premiums of less than fifty cents per litre. The
function with the lowest price premium was reduced-sugar flavoured milk
(0.10$/L).
Brand. The signs associated with coefficients for the brand category
followed ex-ante expectations. Table 5 shows a positive price-premium allocated
to local brands and a negative price premium for store brands, relative to the base
category national brands. The t-statistic and beta coefficient for local brands,
however, suggests the attribute is nearly insignificant. While several studies
(reviewed in Hu et al., 2011) support that consumers place positive price
premiums for locally produced food products, this store-level analysis suggests
local milks are not priced differently than national brands.
4.1.2 Product Labels
Region of Production Label. Contrary to expectations, labels symbolizing
products of Canada were associated with a small negative price premium of
$0.04/L. In contrast, labels identifying milks produced in Québec had a $0.06/L
positive price premium.
Low Cholesterol Label. While this attribute was posited to be associated
with a positive price premium, regression results suggest that fluid milk products
displaying claims such as ―low cholesterol‖ on the front of their packages are

56
slightly discounted. The low cholesterol label was found on skim milks, and the
fact that consumers can verify this claim through the Nutrition Facts panel may
explain the minor discount.
Low Fat Label. The only positive price premium associated with front-of-
package milk labels was the low fat label ($0.14/L). This statement was found on
the front-of-packages of both flavoured and non-flavoured milks.
Fat-Free Label. Certain companies decide to label their 0% milk as fat-
free rather than skim; others display a ―fat-free‖ label on their skim milk
packages. Results in Table 5 show a negative price premium of $0.06/L assigned
to fat free claims, similar in magnitude to the low cholesterol label.
Calcium Content Label. A small discount of $0.03/L was associated with
front-of-package claims such as ―source of calcium‖. As suggested earlier, one
reason why these information-bearing labels were coupled with negative
coefficients is that the front-of-package claims can be verified with the Nutrition
Facts table. It is possible that the small discount reflects consumers‘ distrust
stemming from the redundancy of information, as per Pothoulaki and
Chryssochoidis‘ (2009) explanation that the source of information impacts
consumer perception of front-of-package claims.
Protein Presence Label. Regression results show products that bear labels
such as ―source of protein‖ were discounted at $0.13/L. The products in this
category cover certain flavoured milks as well as calcium-added milks.
One reason the protein presence label bore such a large markdown is that
these products are sold by brands that specialize in price-regulated milk. The
brand effect of being associated with lower priced milk may have biased the
regression. While brands were partially controlled for with the private, local and
national brand variables, brand name was not included in the hedonic model. To
investigate whether accounting for economy brands would change the sign of the
coefficient for protein presence labels, a regression was run substituting the
existing brand variables with individual brand-name dummies. The high number
of individual brands lead to collinearity between variables, so similar brands were
grouped together. While the protein presence label became positive, other

57
variables became problematic, in particular those in the function category. For
example DHA-enriched and calcium-enriched milks were now associated with
negative coefficients, which is highly counter-intuitive. As it seemed
unreasonable to use these regression results to make conjectures on product
labels, it remains unclear whether the price discount for the protein presence label
may be attributed to a spillover brand effect.
Pasteurized Milk Label. As with previous labels, the coefficient for this
label was also posited to show a positive price premium. Results suggest that
products displaying this label were actually priced $0.20/L lower than milk
without the front-of-package label, holding constant other milk characteristics.
Two conjectures are proposed to explain the sizeable price discount: first, as the
CFIA considers ―consumers recognize that all fluid milk is pasteurized‖ (CFIA,
2010, §4.5.1), the redundancy of this information may lead consumers and stores
to discount the information along with the product. A second, more likely
proposition is that the Pasteurized Milk*Local Brand variable bears a price
discount because local milk products displaying the claim were sold at a lower
price per litre than all other local milk products.
4.1.3 Store Characteristics
Retail Chain. Regression results for the retail chain category follow ex-
ante predictions. Milk products sold in Walmart and Zellers (grouped together as
Box) were priced lowest, and gas stations and convenience stores (grouped as
Gas), charged on average a premium of $0.33/L on milk. Results for individual
grocery chains reflect common knowledge, where supermarket chains that have
adopted an everyday low price (EDLP) pricing strategy were associated with
lower price premiums than those that follow a Hi-Lo promotion-oriented pricing
strategy.
Store Region. Prior to running the regression, it was posited that the sign
for the coefficient of the urban variable could either be positive, due to higher
costs of living, or negative, due to higher competition between stores. Results

58
suggest the latter argument could explain the small discount associated with urban
stores ($0.02/L); beta coefficients imply the variable is not significant.
Table 5. OLS Estimates of the Linear Hedonic Model for Milk ($/L)
Coefficient
Standard
Error Beta
Intercept 2.323 0.004 586.60 ---
Product Characteristics
Volume – 0.803 0.003 292.54 – 1.021
(Volume)2 0.134 0.001 246.29 0.798
Regulation:
Regulated Base
Unregulated 0.103 0.004 26.10 0.044
Milk type:
Cow milk Base
Buttermilk 1.115 0.005 235.52 0.097
Goat milk 1.720 0.005 324.62 0.183
Fat percentage:
Skim Base
1% 0.007 0.001 4.62 0.004
2% 0.030 0.001 20.40 0.015
Homogenized 0.077 0.001 51.86 0.316
Package type:
Carton/Bag Base
Twist Cap 0.179 0.002 86.68 0.154
Plastic 0.415 0.004 98.46 0.098
Bulk type:
None Base
Single-serve 0.754 0.003 254.53 0.316
Multi-package 0.560 0.007 82.81 0.103
Process:
Pasteurized Base
UHT 1.088 0.008 144.04 0.207
Micro-filtered 0.080 0.004 21.30 0.043
Flavour:
No Flavour Base
Chocolate 0.573 0.004 141.65 0.230
Strawberry 0.425 0.008 56.08 0.064
Other Flavour 0.456 0.012 37.36 0.048
Function:
No special function Base
Calcium + 0.469 0.004 123.64 0.090
DHA + 0.297 0.005 65.10 0.033

59
Table 5. CONTINUED
Coefficient Standard
Error Beta
Function:
Lactose-Free 1.046 0.004 271.97 0.270
Omega-3 + 0.375 0.004 96.62 0.076
Organic 0.977 0.003 361.55 0.210
Pre/Probiotic 0.295 0.007 43.96 0.032
Reduced-Sugar 0.099 0.007 14.81 0.016
Brand:
National Base
Local 0.013 0.003 4.80 0.002
Private – 0.431 0.004 106.63 – 0.042
Product Labels
Region of Production:
No Label Base
Canada – 0.040 0.002 19.22 – 0.014
Québec 0.056 0.001 55.74 0.021
Other Labels:
Low cholesterol: – 0.069 0.002 35.42 – 0.013
Low fat label: 0.137 0.008 17.78 0.027
Fat-free label: – 0.063 0.020 31.20 – 0.014
Calcium label: – 0.026 0.004 7.09 – 0.009
Protein label: – 0.127 0.005 25.76 – 0.036
Pasteurized label: – 0.206 0.004 53.19 – 0.033
Store Characteristics
Retail Chain:
Box Base
Gas 0.333 0.003 130.92 0.174
Retail1 0.100 0.003 38.53 0.034
Retail2 0.197 0.003 77.05 0.065
Retail3 0.097 0.003 37.07 0.030
Retail4 0.192 0.002 78.26 0.060
Retail5 0.238 0.003 91.75 0.073
Retail6 0.139 0.003 53.48 0.035
Other 0.063 0.003 24.40 0.021
Store Region:
Rural Base
Urban – 0.017 0.001 11.70 – 0.006
R2: 0.812
No. of Observations: 706208
Notes: All coefficients are statistically significant at the 1% level. White‘s heteroskedastic-
consistent standard errors reported.

60
4.1.4 Discussion
Regression results in Table 5 show the price premiums distinguishing
skim milk from milk with higher fat content were nearly insignificant. This was
inconsistent with a priori expectations because it was hypothesized that fat
percentage would be a more significant attribute in the price-regulated market.
Two additional regressions were run for price-regulated and non-regulated
milks, respectively (Appendix IV). Since the RMAAQ classifies price-regulated
milk as non-flavoured cow milk without any nutrient enhancements, several
categorical variables dropped out for the hedonic price model of price-regulated
milk. The private brand and protein presence variables were specific to
unregulated milk and do not appear in the price-regulated model. There were no
modifications to the non-regulated milk model.
Results showed that fat percentage is a relatively more important attribute
in the price-regulated model than the non-regulated model. While there was no
price premium attributed to 1% milk in both models, a $0.07/L and $0.14/L
premium was associated with 2% and homogenized milk in the price-regulated
model, respectively. For non-regulated milk, the premium for 2% milk was
$0.02/L, and the premium for whole milk was $0.06/L. Given that the RMAAQ
sets milk prices by fat percentage, volume and sales region, the impact of omitting
region-based variables is examined in Section 4.3.3. Results also indicated that
the price premium per retail chain was, on average, higher for non-regulated milk
than for regulated milk. This suggests retailers have more flexibility in pricing
non-regulated milk, which is logically consistent.
The non-regulated model revealed that the price per litre of milk in the
non-regulated market was highly dependent on volume and other functional
attributes, rather than fat percentage. The results were similar to those outlined in
Table 5, apart from the micro-filtered variable, which became statistically
insignificant. As further regressions are run based on price-regulated subsamples,
results are presented alongside regional analyses in Section 4.3.3.

61
Retail Oatmeal Results 4.2
In the case of the semi-log model for oatmeal, not all variables were
considered statistically significant at the 0.01 level; those significant at lower
confidence levels are denoted with an asterisk. In general, the model fitted the
data well, explaining 86.7% of oatmeal price variations in Québec. Due to the
semi-log functional form, the marginal impact of a dummy variable on the
dependent variable, in percentage form, is obtained through the expression:
[ ( ) ] where c is the dummy‘s coefficient (Halvorsen and
Palmquist, 1980). These results are presented in the third column of Table 6; for
continuous variables, differences between the reported coefficient and percentage
effect may differ due to rounding. Beta coefficients were also included to reveal
the magnitude of the impact of independent variables on the dependent variable.
4.2.1 Product Characteristics
Weight. As with milk, hedonic model estimates indicated that the price per
gram of oatmeal decreased as volume increased, at a decreasing rate. This
suggests discounts for bulkier package sizes.
Nutritional Information. Although it was hypothesized that nutrients
regarded as unhealthy by consumers, such as fat and sodium, would be associated
with negative marginal coefficients, results indicate that a percentage increase in
fat, sodium, and fibre content increased average prices. Notably, a percentage
increase in sodium content per 40 gram serving increased average price by 78%.
This large premium is explained by the low average content of sodium per serving
(Table 2). In retrospect, it is logical that the coefficients associated with nutrients
were positive, given that added inputs, whether fat or fibre, should increase a
product‘s price.
In terms carbohydrates, results show that a percentage increase in the
daily value of carbohydrates was associated with a small negative price premium,
but the variable is not significant in the model. The coefficients for sugar and

62
protein also displayed negative coefficients. In order to tentatively explain these
regression results, descriptive statistics of the nutrient information of flavoured
and non-flavoured oatmeal are presented in Appendix V. Looking at the average
content of protein, Appendix V suggests why the addition of one gram of protein
per gram of oatmeal would lead to a decrease in price: on average, non-flavoured
oatmeal is higher in protein content and lower in price. For sugar, the combined
consideration of the near-zero content of sugar in non-flavoured oatmeal and the
high content of sugar in flavoured oatmeal hints that the negative coefficient
attached to the sugar variable is caused by variations in flavoured oatmeal. It was
hypothesized that sugar may be an inexpensive substitute for other nutrients, but
the correlation matrix did not point to any straightforward conclusions (Appendix
III).
Oatmeal Type. The largest premiums associated with any categorical
variable were those within the oatmeal type category. In contrast to regular
oatmeal, oat bran, steel cut/Scottish oatmeal and other oatmeal products
commanded price premiums of 19.45%, 41.63% and 141.09%, respectively. The
other category is largely represented by muesli, a cereal mix product.
Cooking Time. Regression results were consistent with ex-ante predictions
that instant oatmeal would be priced higher than quick (minute) oatmeal and
cooking oatmeal (>minute). The discount associated with minute oatmeal was
slightly larger than that of cooking oatmeal; the reason behind this observation
may be that minute oatmeal is not related to any specific function or use. In
contrast, instant oatmeal is associated with swift preparation for consumption, and
oatmeal requiring longer cooking time is associated with baking purposes.
Package Type. As originally posited, oatmeal sold in pre-packaged bowls
carried a 2.31% positive price premium, holding other characteristics constant.
However, the beta coefficients suggest the impact of package price on the
explained variable is near-insignificant.
Flavour. All flavours apart from the other category showed a positive
price premium ranging between 14-29%. Also, there was a sizable premium for
products that contained a variety of flavours (33.27%), suggesting consumers

63
were willing to pay for diversification. These results imply that while consumers
prefer a variety of traditional flavours, novel flavours such as hemp and cinnamon
roll are discounted (-6.37%).
Function. As with milk, there was a considerable premium for organic
oatmeal (52.05%). The other two variables refer to Quaker‘s lines of Reduced
Sugar Instant Oatmeal and Weight Control Instant Oatmeal and different
combinations of nutrients are associated with each of these products. Even
controlling for nutrition information, a price discount of approximately 16% was
associated with Quaker Reduced Sugar oatmeal, which conflicts with ex-ante
expectations. These results may be attributed to taste stigmas. For instance,
research has demonstrated the existence of taste stigmas associated with breakfast
cereals containing soy (Lee et al., 2007). Even when food products don‘t actually
contain soy, labels falsely advertising the presence of soy negatively impact
consumer perception of taste (Wansink, 2003). Studies show consumers do not
expect food with ―healthy‖ labels to taste as good as ―unhealthy‖ foods
(Raghunathan et al., 2006) concordantly, a negative price premium for Quaker
Reduced Sugar oatmeal may be attributable to consumer-level taste stigmas. In
turn, Weight Control oatmeal, which doesn‘t require consumers to trade taste for
health, or ―sacrifice great flavour‖ (PepsiCo Canada ULC, no date), was
associated with a price premium of nearly 12%.
Brand. Before running the regression, it was expected that local brands of
oatmeal were priced higher than Quaker oatmeal. Instead, local brands were, on
average, associated with a discount larger than that for store-brand oatmeal. Other
national brands showed a small discount of approximately 4% in comparison to
Quaker oatmeal.
4.2.2 Product Labels
Flavour Label. Four front-of-package labels were tested for significance in
the hedonic price model for oatmeal. Two flavour-related variables were artificial
flavour, grouping statements such as ―artificial flavour‖ and ―naturally and

64
artificially flavoured‖ and the variable natural flavour, which controlled for
naturally flavoured oatmeal products only. It was posited that there would be a
positive coefficient associated with ―natural flavour‖ claims and a negative
coefficient with ―artificial flavour‖ claims. Naturally flavoured oatmeal was
associated with a 15.54% price premium, while the artificial flavour variable only
marginally influenced product price (0.60% premium).
Fibre Label. While it was originally posited that information is positively
valued, front-of-package statements about fibre content were linked with a price
discount of 4.95%. As per the regression results for milk, one plausible
explanation for the negative coefficient is that consumers can verify this claim
with the Nutrition Facts table. In addition, oatmeal products are generally viewed
as foods that contain high levels of protein. Given two oatmeal products with the
same nutritional characteristics, the redundancy of information may lead
consumers to choose the product without the fibre content claim.
Whole Grain Label. In contrast to the previous label, consumers can not
verify the whole grain statement with the Nutrition Facts table; rather, it is
categorized as a composition, quality, quantity or origin of product claim (CFIA,
2010). On average, this label showed a 4.08% price premium.
4.2.3 Store Characteristics
Retail Chain. Unlike milk, lowest-priced oatmeal products were not found
in box stores but rather supermarket chains associated with EDLP pricing
strategies, although the discount is small. Beta coefficients also imply that the
difference between prices between box stores, Retail3 and Retail4 is small.
Highest-priced oatmeal was found at gas stations and convenience stores
(46.80%), and Retail5 was once again the supermarket chain that sells the product
at the highest mark-up (18.32%).
Store Region. Similar to the results for milk, there was a small discount of
approximately 1% associated with stores located in urban settings. The small beta
coefficient suggests the variable is barely significant.

65
Table 6. OLS Estimates of the Semi-log Hedonic Model for Oatmeal ($/350g)
Coefficient Standard
Error
Beta
Intercept 1.274 0.015 --- ---
Product Characteristics
Weight: – 0.157 0.001 15.72 – 1.240
(Weight)2: 0.004 0.000 0.43 0.751
Nutritional Information:
Fat 0.025 0.001 2.51 0.050
Sodium 0.787 0.019 78.74 0.172
Carbohydrates – 0.001 † 0.002 0.08 – 0.002
Fibre 0.013 0.000 1.34 0.128
Sugar – 0.030 0.001 –2.30 – 0.261
Protein – 0.019 0.001 –1.89 – 0.060
Type:
Regular Base
Oat Bran 0.178 0.009 19.45 0.065
Steel Cut/Scottish 0.348 0.008 41.63 0.079
Other 0.880 0.015 141.09 0.079
Cooking Time:
Instant Base
Minute – 0.321 0.005 –27.42 – 0.218
>Minute – 0.314 0.005 –26.93 – 0.214
Package Type:
Regular Base
Pre-Packaged 0.023** 0.010 2.31 0.005
Flavour:
No Flavour Base
Apple Cinnamon 0.196 0.007 21.66 0.095
Berry 0.254 0.007 28.96 0.095
Cream 0.243 0.007 27.56 0.118
Kid 0.209 0.008 23.21 0.096
Maple 0.134 0.006 14.34 0.081
Raisin 0.237 0.010 26.73 0.069
Other – 0.066 0.007 –6.37 – 0.027
Variety 0.287 0.006 33.27 0.144

66
Table 6. CONTINUED
Coefficient Standard
Error
Beta
Function:
No Function Base
Organic 0.419 0.004 52.05 0.165
Reduced Sugar – 0.174 0.004 –15.98 – 0.091
Weight Control 0.112 0.007 11.87 0.044
Brand:
Quaker Base
National – 0.040 0.005 –3.95 – 0.022
Local – 0.237 0.006 –21.06 – 0.066
Private – 0.201 0.003 –18.22 – 0.138
Labels
Flavour Label:
No Label Base
Natural Flavour 0.144 0.004 15.54 0.104
Artificial Flavour 0.006* 0.003 0.60 – 0.005
Other Labels
Fibre Label – 0.042 0.003 –4.95 – 0.036
Whole Grain Label 0.048 0.004 4.08 0.032
Store Characteristics
Retail Chain:
Box Base
Gas 0.384 0.022 46.80 0.013
Retail1 0.066 0.002 6.79 0.045
Retail2 0.144 0.002 15.44 0.097
Retail3 – 0.019 0.002 –1.92 – 0.012
Retail4 0.119 0.003 12.62 0.063
Retail5 0.168 0.002 18.32 0.099
Retail6 – 0.030 0.003 –2.94 – 0.014
Other 0.041 0.002 4.21 0.023
Store Region:
Rural Base
Urban – 0.010 0.002 –1.02 – 0.006
R2 0.867
Observations 143527
Notes: † Not statistically significant the 0.10 level; * Statistically significant at the 0.10 level; **
Statistically significant at the 0.05 level; All other variables are statistically significant at the 0.01
level. White‘s heteroskedastic-consistent standard errors reported.

67
Hypothesis Testing 4.3
Given the results presented in Table 5 and Table 6, the subsequent sub-
sections are comprised of analyses based on the hedonic pricing models for milk
and oatmeal. First, regression results with respect to the product labels category
are summarized and discussed with the purpose of determining whether front-of-
package claims significantly impact milk and oatmeal prices. Secondly,
subsamples are defined to study retail-level market differences. Lastly, regional-
level market differences for milk and oatmeal are examined.
4.3.1 Objective 1: Front-of-Package Labels
The primary objective of this study was to assess consumer preferences for
front-of-package claims, such as location of production, and the presence, absence
or level of nutrients. To respond to this objective, hedonic pricing models for
milk and oatmeal were estimated, controlling for product- and store-level
characteristics.
4.3.1.1 Milk
In order to determine the existence of price premiums associated with
region of production labels, milk brands were controlled for through three
categories: national brands, local brands and private brands. It was originally
posited that locally produced milk would yield a positive price premium, but
results show that, at the retail level, local milk was not priced much higher than
national brands of milk. A recent survey by Maynard and Thompson (2010) about
Kentucky consumers‘ willingness to pay for locally produced milk and cheese
showed that the majority of consumers prefer store-brand milk and are highly
aware of prices. Out of 1,052 survey respondents, 23% agreed that an acceptable
premium for locally produced milk was ―1 to 10 cents extra,‖ while 27% chose
―11 to 50 cents extra‖ per gallon of milk. In Europe, Burchardi et al. (2005) found
that consumers were willing to pay €0.12/L for ecological milk, defined as milk

68
produced from the respondent‘s own region. The authors noted that while the
attribute is positively viewed, demand is price-elastic. Whereas these studies
suggest consumers are willing to pay a modest premium for local milk, this was
not found in the Québec data.
In contrast with Maynard and Thompson‘s (2010) survey that found that
local labeling was valued about as much as other attributes (such as calcium
enrichment, pasture-based systems, and consistency in flavour), the results for this
study show that functional attributes are valued higher than local labels. In terms
of brand type, results were line with Chang et al.‘s study (2010) where a price
discount was associated with store-brand eggs, compared to national brands.
Consumers could, on average, expect a price discount of $0.43/L when buying
store-brand rather than national-brand milk.
With respect to region of production labels, products with the 100%
Canadian milk ―blue cow‖ logo, symbolizing milk produced in Canada, were
associated with a small discount of 0.04$/L. The discount was present even when
separating price-regulated from non-regulated milk (Appendix IV). Otherwise, a
positive price premium of approximately $0.06/L was associated with milk
produced in Québec, holding other characteristics constant. This suggests local
milk processors may capture a small price premium by indicating that their milk
originates from Québec. While the discount associated with Canadian milk is
logically inconsistent, this study‘s results are similar to those found by Roy‘s
(2009) choice modeling analysis. In studying the implicit prices Montrealers
assigned to fluid milk with differing price levels, health attributes, environment
impact characteristics and location of production, Roy obtained a negative
implicit price of 0.39$/L for milk produced in Canada.
Results in Table 5 report that front-of-package labels associated with
nutrition content claims tend to be slightly discounted. Also, there was a
significant price discount of approximately $0.20/L for local milk products which
display a pasteurized milk label, compared to those that do not. The only label
variable paired with a positive price premium of $0.14/L is the low fat label.

69
4.3.1.2 Oatmeal
Table 6 shows that front-of-package statements for fibre content claims
and whole grain claims are linked to small, but statistically significant implicit
prices. In terms of brand labels, hedonic estimates show local brands are priced at
a small discount in comparison to national brands. While Quaker holds over 80%
of total annual sales in 2010, Quaker products were not found to be priced much
differently than other national brands.
Contrary to expectations, results also show that flavoured oatmeal
displaying ―artificial flavour‖ claims were not associated with price discounts. A
statistically significant price premium of 15% was associated to naturally
flavoured oatmeal; this may be due to higher input-based production costs, or
consumers‘ preference for natural ingredients.
4.3.1.3 Discussion
On the whole, brand effects were observed for both milk and oatmeal,
confirming expectations of price discounts for store brands. The stated preference
literature suggests consumers are willing to pay for locally produced food
products, such as milk (Burchardi et al., 2005), processed food (Hu et al. 2011),
meat and fresh produce (Arnoult et al. 2007). Contrary to previous findings,
locally produced milk and oatmeal were not associated with positive price
premiums. For milk, the combined consideration of the positive premium for milk
processed in Québec coupled with the negligible premium for the local brand
variable suggests that consumers are willing to pay a premium for local milk, but
that the brand effect in itself may not be a strong enough signal to elicit a
response.
Two counter-intuitive results were the negative price premium associated
with the ―100% Canadian milk‖ label and the insignificant premium associated
with local milk. One straightforward explanation is that the presence of
unobserved factors may lead to these results, and Section 4.3.3 investigates the
impact of including additional explanatory variables for brand base and brand

70
name. An alternative explanation is discussed in Hu et al.‘s (2011) literature
review for consumer preferences for locally produced foods. The authors explain
that the amount consumers are willing to pay for local foods ―may differ
depending on products and the definition of what geographic range may still be
considered local‖ (p.3). Usually, researchers define local products refer to within-
state production in the United States. Accordingly, consumers may associate local
milk with a province-wide geographical range, which may explain (1) the
discount associated with milk labelled as produced in Canada, (2) the minimal
premium associated with milk produced by regional processors and (3) the
premium associated with labels identifying milk produced and processed in
Québec.
With respect to oatmeal, the hedonic pricing model suggest that local
brands were priced similarly to store brands, a result also found by Hu et al.
(2011) in their analysis of blackberry jam. The authors hypothesize that the
negative premium relative to national brands may be based on consumer‘s lack of
knowledge of regional brands. This is a plausible explanation for oatmeal, given
that certain stores place local brands of oatmeal in different isles than national-
and store-brand oatmeal products.
With respect to nutrient content claims, regression results for milk and
oatmeal suggest that these front-of-package statements are associated with small
price premiums or price discounts. When the nutrient content claim can be
verified with the Nutrition Facts table, there tended to be a small discount
associated with the front-of-package labels. Examples are the low cholesterol, fat-
free, calcium and protein labels for milk, and the fibre label for oatmeal. The
exception was the low fat label for milk, which was mostly displayed on 1%
chocolate milk products and certain non-favoured 1% milks. This suggests
consumers are willing to pay a price premium for reduced-fat flavoured milk.
Labels that contain non-verifiable information (credence attributes) may
significantly influence product price. The categories of variables falling under this
group are: region of production (milk which is processed in Québec), flavour
labels (naturally flavoured oatmeal), composition labels (whole grain oatmeal)

71
and process/function labels (pasteurized milk). The positive price premiums
associated with the majority of these variables suggests consumers distinguish
milk and oatmeal products according to these front-of-package labels and are
willing to pay a premium for the advertised attributes. However, pasteurized milk
was associated with a price discount rather than a price premium. While it is
possible that consumers discriminate fluid milk advertising redundant
information, it is more likely that the Pasteurized Milk*Local Brand variable
carried a negative coefficient because local brands displaying the label tended to
be sold at a lower price at the retail level. As no private or national brands
exhibited ―pasteurized milk‖ labels in the data, the attribute could not be
evaluated on its own.
4.3.2 Objective 2: Store-Level Differences
A second objective of this study was to determine whether there are store-
level differences in the price of fluid milk and oatmeal. To test for retail chain
differences in implicit prices, a Chow test was conducted to determine if the price
premiums allocated to different product characteristics, product labels and store
region varied significantly at the retail level. In other words, the nine different
retail groups were pooled together and parameters were constrained to equality.
By considering store-level subsamples, the hedonic price model was based
on the UPCs sold for a given group of retail chains. This is not a typical
assumption and the economics literature usually investigates regional market
differences rather than market differences by store. There is evidence that the set
of consumer preferences for product characteristics varies by retail chain, given
that the latter differ from one another according to a ―retail mix‖ (Leszczyc et al.,
2000) of attributes such as product selection, store environment and service, as
well as retail pricing format (Leszczyc et al., 2004). In the original hedonic price
model, unobserved retail-specific differences were bundled and controlled for
through the set of retail chain variables. Running the hedonic pricing model per
retail chain regroups unobserved store attributes into the error term for each

72
model, and enables the investigation of cross-store pricing differences for milk
and oatmeal. For instance, one could compare the coefficients in the function and
brand categories to examine differences in the implicit prices between
supermarket chains adopting everyday low price (EDLP) and promotion-oriented
pricing strategies.
4.3.2.1 Store-Level Analysis for Retail Milk
According to Chow tests, the hypotheses that coefficients, both including
and excluding intercepts, were equal in the nine retail-level subsamples were
strongly rejected at p 0.0001. Subsequent Chow tests also rejected equality
between pairs of subsamples. To this effect, model estimates are presented for all
stores. Table 7 lays out regression results for three retail chains, and the remaining
store-level estimations are displayed in Table A and Table B of Appendix VI. A
regression was also conducted using the complete dataset, excluding retail chain
dummies, for comparison purposes; these results are presented in the first column
of Table 7. While test results reject equality between coefficients for all
combinations of supermarket chains, Table B of Appendix VI shows results for
two pooled models: grocery store chains following everyday low price (EDLP)
pricing strategies (Retail3 and Retail6), and grocery store chains adopting Hi-Lo
pricing strategies (Retail1, Retail2, Retail4 and Retail5) for comparison purposes.
Box stores, Retail3 and Retail5 were chosen to conduct cross-store
analysis because they represented the store category with the lowest implicit
price, the grocery chain with the lowest implicit price, and the grocery chain with
the highest implicit price according to the hedonic pricing model with retail chain
dummy variables, respectively (Table 5). The presence of heteroskedasticity was
detected for all store-level models and consequently White‘s heteroskedasticity-
consistent standard errors are reported.
Several differences were observed between the implicit prices for different
attributes of fluid milk sold in box stores (Walmart and Zellers), a supermarket
following EDLP pricing strategy (Retail3), and a grocery chain which has adopted
a Hi-Lo promotion-oriented pricing strategy (Retail5). The first observation was

73
that the base price for a litre of price-regulated skim milk is lowest in the Box
Stores model ($1.64) and highest in the Retail5 model ($1.82); this is logically
consistent given the different pricing strategies for each retail chain. Secondly,
product availability was relatively restricted in the Box Stores model, given that
buttermilk, goat milk and DHA-added milks were not for sale. Furthermore, box
stores don‘t offer store-brand fluid milk products, and are only located in urban
areas. This shows that consumers shopping in rural areas were constrained in
terms of store choice. Despite being restricted to stopping at grocery stores, gas
stations or convenience stores, the urban variable supports that the price of fluid
milk was not significantly different between urban and rural stores.
Product Characteristics. Looking at the regulation variable across retail
chains, Table 7 shows that the differences between price-regulated and
unregulated milk are most evident in Hi-Lo grocery stores. While consumers can
expect a base premium of approximately $0.20/L when purchasing price-
unregulated milk at Hi-Lo grocery stores, this difference is less significant for box
stores and EDLP stores. In fact, a negative price premium was associated with the
regulation variable for the Box Stores model, suggesting unregulated milk was
priced, on average, $0.04/L less than regulated milk. While this is logically
inconsistent, the combined consideration of all milk attributes such as package
type, bulk type, process, flavour and function keep the overall price of
unregulated milk above that of regulated milk. For EDLP stores, there is no base
difference between unregulated and regulated milk and price differences can be
attributed to other product attributes.
In contrast to the results for the unregulated variable, the price premiums
for several attributes are higher for box stores and EDLP stores and lower for Hi-
Lo stores. Appendix VI shows that the buttermilk, goat milk, UHT milk, micro-
filtered, calcium-added, DHA-added, lactose-free, omega3-added and pre/pro-
biotic variables all follow this trend. On the whole, however, the total price of
functional milk remained lowest in Box stores, followed by Retail3 and Retail5
grocery chains. For example, the predicted price for 1 litre of national brand
calcium-added skim milk is $2.09, $2.21 and $2.42, respectively, while the

74
models predict organic skim milk to be sold at $2.20, $2.56 and $3.06 for Box
stores, Retail3 and Retail5 stores, respectively.
Looking at variables in the fat percentage category, the models show that
1% milk sold in Box stores was $0.04/L more expensive than skim milk and that
homogenized milk will cost a premium of $0.19/L. The milk fat premiums were
lower in Retail3 stores and the hedonic price model for Retail5 suggests no
pricing differences based on milk fat. Overall, milk fat seems to be a larger
determinant of product price in EDLP stores, other stores, gas stations and
convenience stores, but not for grocery stores in the Hi-Lo category.
Regression results also reveal differences in the price premiums allocated
for flavoured milks. While the price premium for chocolate milk, compared to
non-flavoured milk, was higher than the price premium for strawberry- and other-
flavoured milks for box stores and EDLP stores, the opposite trend was observed
for Hi-Lo stores. For Retail5, chocolate milk commanded a $0.41/L premium over
regular milk, while strawberry milk cost $0.56/L more than non-flavoured milk.
In contrast, the price premium for strawberry milk was $0.20/L lower than that for
chocolate milk according to the Retail3 model. These outcomes imply that
consumers who shop at Hi-Lo stores are willing to pay a premium for banana,
hazelnut and orange-flavoured milk, while consumers who shop at EDLP stores
prefer traditional, chocolate-flavoured milk.
In terms of milk brand, Table 7 and Appendix VI suggest chain-specific
pricing methods for local milk, while private brands are consistently cheaper than
national brands across all retail-level subsamples. The exception is the premium
associated to local brands of milk in the Gas model, but the model shows evidence
of collinearity between the local brand variable and the Pasteurized Milk*Local
Brand variable. This can be seen with by the large negative coefficient associated
with the former variable and the coefficient of similar magnitude, and opposite
sign, associated with the latter. This is because gas stations and convenience
stores only carried an average of 26.11 products per store, making it difficult to
separate the effect of individual variables (Hill et al., 2001).

75
Product Labels. In reference to region of production labels, the $0.06/L
premium for Québec-processed milk products observed in the original hedonic
price model (Table 5) was only observed in two models: Other Stores and Retail4.
Otherwise, price discounts and negligible price premiums were associated with
region of Québec front-of-package labelling. Similarly, premiums for ―product of
Canada‖ milks were not consistently found for all subsamples; Retail5 boasted a
$0.18/L premium while the same variable was associated with a $0.11/L discount
for Retail4. It is worth noting that the hedonic price model for Retail4 showed the
highest price discount for Canadian milk and the highest price premium for milk
labelled Québec-processed. Also, the large discount associated with milk labelled
as produced in Canada in box stores was due to the category being largely
represented by a specific brand of UHT milk. The model was prone to
multicollinearity because Box stores tend to offer a relatively low number of
product selection compared to grocery stores.
In terms of other front-of-package labels, Appendix V reveals certain
differences between EDLP and Hi-Lo stores: low fat and fat-free labels were
positively regarded in EDLP stores, while they were associated with negative
price premiums in Hi-Lo stores. The coefficients associated with low cholesterol,
protein and pasteurized milk labels were negative for both pools, but these results
are not consistent when disaggregated at the store-level.
Store Region. Across store models, the sign of the coefficient associated
with the urban variable was inconsistent, but its size only varies between [-0.031,
0.015]. Altogether, milk sold in urban stores is priced relatively lower than milk
sold in rural stores, although the difference is negligible.

76
Table 7. Store-Level Results for Milk ($/L)
All Data Box Retail3 Retail5
Intercept 2.509*** 1.954*** 2.397*** 2.634***
(0.004) (0.01) (0.010) (0.010)
Product Characteristics
Volume – 0.804*** – 0.367*** – 0.764*** – 0.990***
(0.027) (0.006) (0.008) (0.008)
(Volume)2 0.134*** 0.056*** 0.131*** 0.175***
(0.001) (0.001) (0.002) (0.002)
Regulation:
Regulated Base
Unregulated 0.077*** – 0.038** 0.015 0.199***
(0.004) (0.013) (0.012) (0.01)
Milk type:
Cow milk Base
Buttermilk 1.099*** N/A 1.235*** 1.002***
(0.005) (0.013) (0.015)
Goat milk 1.699*** N/A 1.827*** 1.721***
(0.005) (0.016) (0.015)
Fat percentage:
Skim Base
1% 0.018*** 0.042*** 0.041*** – 0.004
(0.001) (0.003) (0.003) (0.005)
2% 0.054*** 0.110*** 0.042*** – 0.011**
(0.001) (0.003) (0.003) (0.005)
Homogenized 0.102*** 0.186*** 0.080*** – 0.005
(0.001) (0.003) (0.003) (0.005)
Package Type:
Carton/Bag Base
Plastic 0.397*** 0.362*** 0.424*** 0.443***
(0.004) (0.013) (0.014) (0.013)
Twist Cap 0.181*** 0.260*** 0.289*** 0.314***
(0.002) (0.007) (0.006) (0.007)
Bulk Type:
None Base
Single-serve 0.792*** 0.789*** 0.746*** 0.594***
(0.003) (0.015) (0.015) (0.012)
Multi-Package 0.580*** 0.637*** 0.415*** 0.674***
(0.007) (0.033) (0.024) (0.021)

77
Table 7. CONTINUED
All Data Box Retail3 Retail5
Process:
Pasteurized Base
UHT 1.017*** 1.701*** 1.229*** 1.019***
(0.008) (0.065) (0.021) (0.021)
Micro-Filtered 0.159 0.288*** 0.202*** 0.002
(0.004) (0.013) (0.012) (0.011)
Flavour:
No Flavour
Chocolate 0.589*** 0.504*** 0.372*** 0.411***
(0.004) (0.01) (0.011) (0.014)
Strawberry 0.401** 0.195*** 0.172*** 0.559***
(0.008) (0.023) (0.028) (0.029)
Other Flavour 0.394*** 0.214*** – 0.048 0.557***
(0.013) (0.021) (0.038) (0.040)
Function:
None Base
Calcium
Added
0.444*** 0.486*** 0.432*** 0.404***
(0.004) (0.014) (0.012) (0.012)
DHA 0.271** N/A 0.322*** 0.266***
(0.005) (0.013) (0.013)
Lactose-Free 1.022*** 1.109*** 0.934*** 1.006***
(0.004) (0.013) (0.012) (0.013)
Omega-3 0.362*** 0.465*** 0.351*** 0.317***
(0.004) (0.012) (0.013) (0.013)
Organic 0.932*** 0.600*** 0.785*** 1.042***
(0.003) (0.003) (0.005) (0.008)
Pre/Probiotic 0.263*** – 0.436*** 0.293*** 0.243***
(0.007) (0.062) (0.017) (0.015)
Reduced-Sugar 0.104*** – 0.127** 0.060** 0.185***
Brand:
National Base
Local 0.034*** 0.013** 0.009 – 0.198***
(0.033) (0.005) (0.009) (0.012)
Private – 0.388*** N/A – 0.326*** – 0.376***
(0.004) (0.01) (0.012)
(0.007) (0.052) (0.022) (0.02)

78
Table 7. CONTINUED
Product Labels
All Data Box Retail3 Retail5
Region of Production:
No Label Base
Canada 0.009*** – 0.680*** – 0.192*** 0.184***
(0.002) (0.064) (0.015) (0.015)
Québec – 0.001 – 0.056*** – 0.022*** – 0.005**
(0.001) (0.005) (0.002) (0.002)
Other Labels
Low cholesterol: – 0.084*** – 0.026*** – 0.075*** – 0.121***
(0.002) (0.004) (0.004) (0.006)
Low fat label: 0.250*** 1.294*** 0.295*** – 0.490***
(0.008) (0.065) (0.025) (0.046)
Fat-free label: – 0.056*** – 0.079*** 0.089*** – 0.028***
(0.002) (0.006) (0.004) (0.006)
Calcium label: – 0.088*** – 0.324*** 0.098*** 0.224***
(0.004) (0.01) (0.014) (0.017)
Protein label: – 0.071*** 0.566*** – 0.209*** – 0.114***
(0.005) (0.015) (0.015) (0.014)
Pasteurized label: – 0.247*** 0.008*** – 0.137*** 0.134***
(0.001) (0.011) (0.012) (0.014)
Store Characteristics
Store Region
Rural
Urban – 0.022*** N/A – 0.013** 0.011**
(0.001) (0.005) (0.004)
R2 0.801 0.896 0.806 0.855
No. of obs. 706208 37741 58577 59357
Notes: Single, double, and triple asterisks denote statistical significance at the 10%, 5%, and 1%
levels, respectively. Numbers in parentheses are White‘s heteroskedastic-consistent standard
errors.

79
4.3.2.2 Store-Level Analysis for Retail Oatmeal
In order to pursue the investigation of differences in the implicit prices of
oatmeal at the retail level, several groups of characteristics were collapsed
together to allow cross-store comparison between stores with relatively high
product selection and chains with less UPCs per store. Oatmeal type was
characterized as either regular or other (includes oat bran, steel cut/Scottish
oatmeal, muesli); flavour as either no flavour, regular flavour (groups apple
cinnamon, berry, cream, kid-oriented, maple and raisin flavours), other flavour or
variety.
As with milk, Chow tests strongly rejected the hypotheses that
coefficients, both including and excluding intercepts, were equal in the nine retail-
level subsamples at p 0.0001. Subsequent Chow tests investigating equality
between pairs of subsamples were equally rejected, but EDLP and Hi-Lo grocery
stores were pooled together to analyze common trends. For comparison purposes,
Table 8 presents regression results for the same three retail chains as those chosen
for milk (Box Stores, Retail3 and Retail5), and the remaining store-level
estimations are displayed in Appendix VII. Gas and convenience stores
(regrouped as Gas) were not considered; the limited product availability of 1 UPC
per store prevented the estimation of a hedonic pricing model. Hence, the
regression conducted using the complete dataset both excluded retail chain
dummies and sales data from gas stations and convenience stores (fist column of
Table 8). White‘s heteroskedasticity-consistent standard errors are reported due to
the presence of heteroskedasticity in all store-level models.
Similar to milk, the results in Table 8 show that box stores offered less
product variety. For example, organic oatmeal was not for sale in Walmart and
Zellers stores in 2010. Consistent with regression results in Table 6, the intercept
was lowest for Retail3, followed by box stores and Retail5.
Product Characteristics. In general, the coefficients for oatmeal nutrients
followed results from the original hedonic pricing model. Despite minimizing the
number of variables, it was evident that the composition of product selection had
a considerable impact on the implicit prices for each attribute. Given that the

80
selection of oatmeal averages 41 products per grocery store, the premiums
associated with different variables were found to be dependent on each store‘s
product mix, which limited cross-store comparisons. For example, fat, sodium and
fibre were associated with negative price premiums, and that instant oatmeal was
priced lower than oatmeal products with longer cooking times (minute and
minute), contrary to general trends (Appendix VII). Upon closer inspection,
local brands of non-flavoured oatmeal represent a substantially larger portion of
products sold in Retail1 than other grocery stores. Without accounting for
differences in selection, the implicit prices couldn‘t readily be compared with
each other.
The small choice set for oatmeal per store also lead to multicollinearity.
For example, Retail6 offered, on average, 26.80 items per store. The model
associates particularly large price premiums to certain variables, such as 710%
and 702% for fibre content labels and the organic attribute, respectively. Also,
local brand and private brands were associated with price premiums over the base
group, Quaker brand oatmeal, contrary to the general trend. This is because the
fibre label variable is associated only with Quaker oatmeal (Fibre Label*Quaker
Brand) for Retail6 products, leading the model to associate the Quaker brand
premium to another variable. Hence, multicollinearity made it difficult to isolate
the separate effects of individual explanatory variables. As such, cross-store
analyses of implicit prices for oatmeal are generally focused on the EDLP and Hi-
Lo models, which contain more UPCs and variations in attribute level.
As with milk, the size of certain coefficients for variables such as regular
flavour and organic was larger in magnitude for the EDLP grocery store Retail3,
than the Hi-Lo grocery store Retail5. All attributes considered, the average
predicted price remained higher for Hi-Lo grocery stores than EDLP groceries.
For example, the Retail3 model predicts 350g of non-flavoured organic oatmeal
bearing a local brand would be sold at $2.51, while the same product can be found
at Retail5 for $2.90. In contrast, 350g of non-flavoured, store brand instant
oatmeal yields a predicted price of $2.34 for Retail3 and $3.83 for Retail5.

81
While the general hedonic price model in Table 6 reports that Quaker
brand oatmeal was, ceteris paribus, only slightly more costly than other national
brands of oatmeal, store-level models suggest that this may not be the case when
shopping in one grocery store. For example, Retail3 reports that Quaker is 19%
more expensive than other large brands. This difference is less substantial, on
average, in Hi-Lo grocery stores where national brands were sold 4% less than
Quaker brand oatmeal. For all subsamples, regression results show that local
brands and private brands were less expensive than Quaker oatmeal
Product Labels. Oatmeal labelled as naturally flavoured was consistently
associated with a positive price premium. Looking at the fibre content and whole
grain composition labels, the former were generally associated with negative
coefficients, and the latter with positive ones.
Store Region. While the coefficient associated with the urban variable for
retail stores were mostly negligible in magnitude, the model Other Stores carried
a price discount of 10%. Conjectures regarding the cause of the discount could not
be made because the breakdown of stores within the category was not disclosed
by the data provider.

82
Table 8. Store-Level Results for Oatmeal ($/350g)
All Data Box Retail3 Retail5
Intercept 1.467*** 1.708*** 1.020*** 1.998***
(0.013) (0.061) (0.049) (0.037)
Product Characteristics
Weight: -0.176*** -0.221*** -0.059*** -0.141***
(0.001) (0.014) (0.003) (0.005)
(Weight)2: 0.005*** 0.006*** 0.001*** 0.004***
(0.00004) (0.001) (0.0001) (0.0002)
Nutritional Information:
Fat 0.033*** 0.016*** 0.069*** 0.043***
(0.001) (0.003) (0.003) (0.003)
Sodium 0.940*** 0.768*** 1.025*** 1.098***
(0.018) (0.073) (0.095) (0.065)
Carbohydrates -0.012*** -0.021** -0.063*** -0.088***
(0.002) (0.007) (0.008) (0.006)
Fibre 0.013*** 0.008*** 0.034*** 0.031***
(0.0004) (0.001) (0.002) (0.002)
Sugar -0.022*** -0.028*** -0.031*** -0.006**
(0.001) (0.003) (0.002) (0.002)
Protein -0.018*** -0.026*** -0.013* -0.013**
(0.001) (0.006) (0.007) (0.005)
Oatmeal Type:
Regular Base
Other 0.233*** 0.167*** 0.124*** 0.085***
(0.005) (0.020) (0.022) (0.017)
Cooking Time:
Instant Base
Minute -0.302*** -0.027*** -0.658*** -0.591***
(0.006) (0.005) (0.019) (0.025)
>Minute -0.276*** -0.025*** -0.655*** -0.574***
(0.006) (0.007) (0.020) (0.026)
Package Type:
Regular Base
Pre-Packaged 0.196*** -1.140*** 0.441*** 0.572***
(0.009) (0.100) (0.034) (0.032)
Flavour:
No Flavour Base
Regular
Flavour
0.160*** 0.245*** 0.300*** 0.029
(0.006) (0.032) (0.023) (0.019)
Other Flavour -0.095*** -0.010 0.002 -0.005
(0.006) (0.020) (0.036) (0.023)
Variety 0.263*** 0.276*** 0.398*** 0.116***
(0.006) (0.033) (0.017) (0.017)

83
Table 8. CONTINUED
All Data Box Retail3 Retail5
Function:
No Function Base
Organic 0.339*** N/A 0.777*** 0.194***
(0.004) (0.044) (0.014)
Reduced Sugar -0.161*** -0.178*** -0.205*** -0.151***
(0.005) (0.018) (0.015) (0.015)
Brand:
Quaker Base
National 0.077*** 0.552*** -0.216*** 0.033***
(0.004) (0.018) (0.035) (0.010)
Local -0.179*** 0.038 -0.324*** -0.239***
(0.005) (0.047) (0.019) (0.024)
Private -0.211*** -0.125*** -0.272*** -0.345***
(0.003) (0.016) (0.014) (0.015)
Weight
Control
0.074*** 0.040** -0.198*** -0.109***
(0.006) (0.019) (0.024) (0.021)
Product Labels
Flavour Label:
No Label Base
Natural
Flavour
0.106*** 0.037*** 0.165*** 0.182***
(0.003) (0.007) (0.011) (0.011)
Artificial
Flavour
-0.017*** -0.036*** 0.035*** 0.057***
(0.003) (0.007) (0.009) (0.009)
Other Labels:
Fibre Label -0.046*** 0.102*** -0.107*** -0.236***
(0.003) (0.013) (0.018) (0.016)
Whole Grain Label 0.107*** 0.092*** 0.086*** 0.176***
(0.004) (0.015) (0.019) (0.012)
Store Characteristics
Store Region:
Rural Base
Urban -0.027*** N/A -0.009* -0.007
(0.002) (0.005) (0.006)
R2 0.848 0.925 0.847 0.869
No. of Obs. 143478 12196 20906 18034
Notes: Single, double, and triple asterisks denote statistical significance at the 10%, 5%,
and 1% levels, respectively. Numbers in parentheses are White‘s heteroskedastic-
consistent standard errors.
84
4.3.2.1 Discussion
Overall, the sign of coefficients associated with milk product labels tended
to vary across stores, while those associated with product characteristics were
more consistent. Due to the magnitude of price premiums for product
characteristics, differences in milk prices were largely explained by that set of
variables. While Chow tests reject any store-level pooling, EDLP and Hi-Lo
groups allowed some level of generalization between grocery stores. For oatmeal,
the lower number of UPCs per store manifests itself through store-level variations
in the sign and magnitude of attributes and multicollinearity in certain models.
This limited cross-store analyses as coefficient estimates were weighed by
differences in the composition of product selection per store, and encumbered the
interpretation of implicit prices for each variable. Similar to results for milk,
product price estimations for EDLP and Hi-Lo oatmeal models (Appendix VII)
show that, on average, prices are higher in grocery stores following Hi-Lo pricing
strategies. Also, no evidence of regional differences in store prices was found in
either milk or oatmeal store-level models.
4.3.3 Objective 3: Regional Market Differences
The final objective of this study was to determine whether there were
regional variances in the price of fluid milk and oatmeal. Following Statistic
Canada‘s (2007) definition of urban areas, the hedonic pricing models using the
whole dataset, as well as store-level analyses, did not suggest the urban variable
had a meaningful impact on prices for either milk or oatmeal.
While oatmeal couldn‘t be further characterized according to regional
attributes, three additional region-based differences were tested for fluid milk. In
the first place, the RMAAQ‘s regional pricing strategy was partially replicated to
determine whether the price of regulated and unregulated milk varied according to
region of sale. Subsequently, milk brands were categorized according to
provincial headquarters to determine whether Ontario-based brands are priced
differently than Québec-based brands and whether they are valued differently in
85
border towns. Lastly, local brands were divided into two categories to investigate
the impact of implicitly including region of origin in brand names.
4.3.3.1 RMAAQ-based Regional Differences
The analysis of regional differences based on RMAAQ-defined regions
began with assigning each store to either Region I, II or III based on its partial
postal code. Appendix I describes how territories are assigned to each region
according to the Règlement sur les prix du lait de consommation (c. M-35.1, r.
206). Given that FSAs are larger than certain cities or territories defined by the
RMAAQ, there was some uncertainty in classifying stores as belonging either to
Region I or Region II (none of the stores were located in Region III). As a rule of
thumb, only stores that unquestionably belonged to Region II were assigned to
that region, while the remaining stores were categorized as belonging to Region I
by default. While imperfectly sorted, it was expected that a premium would be
associated to regulated milk sold in Region II stores.
Table 9 reports the regression estimates for all fluid milk, price-regulated
milk and unregulated milk, along with White‘s heteroskedasticity-consistent
standard errors. For the variable of interest, Region II, results show a positive
price premium for both price-regulated and unregulated milk of $0.05/L and
$0.02/L, respectively. The statistically significant price premium associated with
unregulated milk suggests the price-difference between unregulated and regulated
milk was similar in Region I and Region II. This is logically consistent, as one
would expect the average ratio between the prices of regulated and unregulated to
be the comparable throughout the province. Altogether, milk sold in the
RMAAQ‘s Region II was predicted to be $0.02/L more expensive than Region I
milk.
For all three models in Table 9, F-tests rejected the null hypothesis that the
added variable was equal to zero at p 0.0001. Seeing that the coefficient for the
variable urban was similar in magnitude, but opposite in sign, to that of Region II,
regressions were run without accounting for store region; the variable Region II
retained its significance. In addition, since the RMAAQ sets milk prices in

86
Region II based on a premium per milk format (Appendix II), the interaction
terms RegionII*1_litre, RegionII*2_litre and Region II*4_litre were also defined
for price-regulated milk. However, the null hypothesis that the premium for 2-litre
and 4-litre regulated milk was equal to that of 1-litre milk could not be rejected at
p=0.1227 and these variables were omitted from the model.
With respect to the remaining variables, it is important to note that the
Québec region of production labels for regulated milk is brand-specific. In the
data, the ―Aliments du Quebec‖ and ―Québec Proud, Local farmer owned‖ claims
were associated with the Laiterie de l‘Outaouais and Natrel brands, respectively.
The former dairy sells both price-regulated and unregulated milk, while the latter
statement was only found on unregulated milk. Separating price regulated from
unregulated milk thus means that it is not possible to distinguish the brand effect
from the label affect for the $0.02/L discount for the product of Québec variable
in the unregulated milk model.
To assess how the hedonic price models perform, predicted values for
price-regulated milk are outlined in Table 10 alongside RMAAQ price floors and
price ceilings. The 95% confidence intervals for these expected prices were
calculated and the columns labelled ―CI‖ indicate whether the RMAAQ prices fall
within that range. The predicted prices are for national brands of fluid milk sold in
box stores, omitting all front-of-package labels. Results show that the general
model tends to overestimate the price of 1-litre milk and underestimate the price
of 1.5- 2- and 4-litre milk, while the price-regulated model tends to underestimate
the price of milk sold in 4-litre formats. This is clearly seen when graphing the
volume and (volume)2
variables according to different milk formats. Appendix
VIII illustrates that in the general model, price per litre decreases as volume
increases, but reaches a minimum price per litre at x=3 litres. In contrast, the
price-regulated model exhibits price per litre decreasing at an increasing rate.
Overall, the price-regulated hedonic price model outperforms the general
model, suggesting that price per litre of regulated milk decreases as volume
increases, at an increasing rate. The different shape of the unregulated graph
(Appendix VIII) implies the basic relationship between price per litre and product

87
volume differs according to whether milk is price-regulated by the RMAAQ.
Since price-regulated milk only accounts for one-fifth of total observations (Table
1), the relationship between price and volume in the general model bears a closer
resemblance to that of the unregulated model.
Table 9. OLS Estimates for Retail Milk by Price-Regulated Markets, with
RMAAQ-based Regions ($/L)
All Data Regulated Unregulated
Intercept 2.424*** 1.552*** 2.570***
(0.005) (0.006) (0.006)
Product Characteristics
Volume -0.803*** 0.037*** -1.037***
(0.003) (0.001) (0.004)
(Volume)2 0.134*** -0.021*** 0.185***
(0.001) (0.000) (0.001)
Milk type:
Cow milk Base
Buttermilk 1.115*** -- 1.094***
(0.005) (0.005)
Goat milk 1.720*** 1.724***
(0.005) (0.006)
Regulation:
Regulated Base
Unregulated 0.103*** -- --
(0.004)
Fat percentage:
Skim
1% 0.007*** 0.009 0.002
(0.001) (0.006) (0.002)
2% 0.030*** 0.069*** 0.023***
(0.001) (0.006) (0.002)
Homogenized 0.077*** 0.139*** 0.061***
(0.001) (0.006) (0.002)
Package type:
Carton/Bag Base
Twist Cap 0.179*** -- 0.270***
(0.002) (0.004)
Plastic 0.415*** 0.472***
(0.004) (0.004) Notes: Single, double, and triple asterisks denote statistical significance at the 10%, 5%, and 1%
levels, respectively. Numbers in parentheses are White‘s heteroskedastic-consistent standard
errors.

88
Table 9. CONTINUED
All Data Regulated Unregulated
Process:
Pasteurized Base
UHT 1.088*** 1.082***
(0.008) (0.010)
Micro-filtered 0.080*** -0.006
(0.004) (0.004)
Flavour:
No Flavour Base
Chocolate 0.573*** -- 0.553***
(0.004) (0.004)
Strawberry 0.425*** 0.409***
(0.008) (0.008)
Other Flavour 0.456*** 0.424***
(0.012) (0.012)
Function:
None Base
Calcium + 0.469*** -- 0.416***
(0.004) (0.005)
DHA + 0.297*** 0.275***
(0.005) (0.005)
Lactose-Free 1.046*** 0.989***
(0.004) (0.004)
Omega-3+ 0.977*** 0.330***
(0.004) (0.004)
Organic 0.375*** 0.994***
(0.003) (0.003)
Pre/Probiotic 0.295*** 0.278***
(0.007) (0.007)
Brand:
National Base
Local 0.014*** 0.023*** 0.017***
(0.003) (0.002) (0.004)
Private -0.431*** N/A -0.431***
(0.004) (0.004)
Reduced-Sugar 0.099*** 0.105
Product Labels
Region of Production:
No Label
Canada -0.040*** -0.018*** -0.056***
(0.002) (0.001) (0.006)
Québec 0.056*** -0.025*** 0.069***
(0.001) (0.004) (0.001)

89
Table 9. CONTINUED
All Data Regulated Unregulated
Other Labels:
Low cholesterol: -0.069*** -0.060*** -0.044***
(0.002) (0.006) (0.003)
Low fat label: 0.137*** 0.014*** 0.147***
(0.008) (0.002) (0.011)
Fat-free label: -0.063 -0.047*** -0.076***
(0.002) (0.006) (0.002)
Calcium label: -0.026*** -0.034*** -0.024***
(0.004) (0.001) (0.004)
Protein label: -0.127*** N/A -0.113***
(0.005) (0.005)
Pasteurized label: -0.206*** 0.022*** -0.310***
(0.004) (0.003) (0.005)
Store Characteristics
Retail Chain:
Box Base
Gas 0.334*** 0.039*** 0.430***
(0.003) (0.001) (0.003)
Retail1 0.101*** 0.009*** 0.158***
(0.003) (0.001) (0.003)
Retail2 0.197*** 0.008*** 0.265***
(0.003) (0.001) (0.003)
Retail3 0.098*** 0.004*** 0.153***
(0.003) (0.001) (0.003)
Retail4 0.194*** 0.013*** 0.267***
(0.002) (0.001) (0.003)
Retail5 0.239*** 0.004*** 0.321***
(0.003) (0.001) (0.003)
Retail6 0.140*** -0.001* 0.209***
(0.003) (0.001) (0.003)
Other 0.064*** 0.021*** 0.108***
(0.003) (0.001) (0.003)
Store Region:
Rural Base
Urban -0.017*** -0.002*** -0.020***
(0.001) (0.001) (0.002)
Regional Characteristics
Region:
Region I Base
Region II 0.023*** 0.046*** 0.019***
(0.004) (0.001) (0.004)
R2: 0.812 0.769 0.782
No. of Observations: 706208 128184 578024

90
Table 10. Predicted Values for Price-Regulated Milk
Milk Type RMAAQ
(Feb 2011) General model
Price-Regulated
Model
Milk Fat Format Min Max $ CI $ CI
Region I
3.25 %
1 L 1.65 1.80 1.83 1.71 Y
1.5 L 2.47 2.70 2.40 2.55 Y
2 L 3.25 3.55 2.86 3.36 Y
4 L 6.24 6.84 5.72 6.01
2.00 %
1 L 1.58 1.73 1.78 1.64 Y
1.5 L 2.37 2.60 2.33 2.44 Y
2 L 3.12 3.42 2.77 3.22 Y
4 L 5.98 6.58 5.53 5.73
1.00 %
1 L 1.51 1.66 1.76 1.58 Y
1.5 L 2.26 2.49 2.29 Y 2.35 Y
2 L 2.98 3.28 2.72 3.10 Y
4 L 5.72 6.32 5.44 5.49
0.00 %
1 L 1.45 1.60 1.75 1.57 Y
1.5 L 2.18 2.41 2.28 Y 2.34 Y
2 L 2.87 3.17 2.71 3.08 Y
4 L 5.49 6.09 5.41 Y 5.45 Y
Region II
3.25 %
1 L 1.71 1.86 1.86 Y 1.75 Y
1.5 L 2.56 2.79 2.42 2.60 Y
2 L 3.37 3.67 2.88 3.41 Y
4 L 6.44 7.04 5.75 6.06
2.00 %
1 L 1.64 1.79 1.81 Y 1.68 Y
1.5 L 2.46 2.69 2.35 2.49 Y
2 L 3.24 3.54 2.79 3.27 Y
4 L 6.18 6.78 5.56 5.77
1.00 %
1 L 1.57 1.72 1.78 1.62 Y
1.5 L 2.35 2.58 2.31 Y 2.40 Y
2 L 3.10 3.40 2.74 3.15 Y
4 L 5.92 6.52 5.46 5.54
0.00 %
1 L 1.51 1.66 1.78 1.61 Y
1.5 L 2.27 2.50 2.30 Y 2.39 Y
2 L 2.99 3.29 2.73 3.13 Y
4 L 5.69 6.29 5.44 Y 5.50 Y

91
4.3.3.2 Province of Origin Based Differences
The second regional analysis was centered on provincial differences. This
further investigates the implicit prices characterizing brand labels and region of
production labels discussed in Section 4.3.1. As the province of Québec shares a
border with Ontario, it was hypothesized that the Ontario-based brands would be
valued higher in border towns. Specifically, while certain products from national
brands such as Beatrice, Nielsen and Sealtest may be available for sale throughout
Québec, their main market is the province of Ontario (Agropur Division Natrel,
2008; Parmalat Canada Inc., no date; S. El-Zammar, personal communication).
For instance, the data shows that Beatrice base milk (price-regulated milk) was
available for sale throughout the province of Québec, but its line of non-regulated
milk was only available in stores in the National Capital Region. Similarly,
Sealtest flavoured milk was available in several regions of Québec, but
unflavoured milk was only sold in the Gatineau area. Given that these products
have a geographically limited market, the examination of price differences
between Ontario-brands (Beatrice, Nielsen, Sealtest, Hewitt‘s Dairy and Gay Lea)
and Québec-based brands (all other) was conducted for the National Capital
Region. The area refers to the regions comprising the cities of Ottawa, Ontario
and Gatineau, Québec. Both cities form the only Census Metropolitan Area that
falls within two provinces (Statistics Canada, 2008).
After separating a subsample for stores located in Gatineau using store-
level FSAs, an F-test was conducted to determine whether accounting for these
stores in the general hedonic pricing model would significantly improve the
model. The null hypothesis that an additional variable does not provide a
significantly better fit of the residual sum of squares could not be rejected at
p=0.01, implying that stores in Gatineau did not sell milk at a higher average price
than stores elsewhere in Québec.
Next, a Chow test was run to determine whether milk was priced in the
same manner throughout the province of Québec as it was in Gatineau. The null
hypothesis that the implicit prices for milk attributes are the same for the general
model and its subsample was rejected at conventional levels of significance. In

92
this manner, the impact of a brand‘s provincial origins was tested on two models.
For the general model, two new variables were added: (1) to determine whether
brand base is a significant explanatory variable for the price per litre of fluid milk
(Ontario Brand Base) and (2) to test whether Ontarian brands sold in the Gatineau
area are priced differently than through the rest of Québec (Gatineau*Ontario
Brand). The Gatineau hedonic price model only includes the first variable, given
that the sample is already restricted. Results are outlined in Appendix IX along
with robust standard errors, given the presence of heteroskedasticity.
Overall, the coefficients for the general hedonic pricing model and the
Gatineau model are of comparable magnitude. The only variable bearing a
logically inconsistent sign is that associated with 1% milk in the Gatineau, which
shows a price discount of $0.03/L because of collinearity with the low fat
variable. There is also evidence of multicollinearity within the subsample between
the local brand variable and the region of Québec label. First, there is only one
local processor in the Gatineau area, rendering the $0.11/L discount brand-
specific. Second, only two brands displayed the region of Québec front-of-
package labels, including the local dairy, which may explain the $0.01/L discount
associated with that particular variable.
With respect to regional differences, regression estimates show that,
controlling for all other characteristics, brands based on Ontario were sold at a
$0.22/L discount compared to brands based in the province of Québec. In
addition, the interaction term Gatineau*Ontario Brand suggests that the price
discount was reduced by $0.13/L when these same brands were sold in the
Gatineau area. Looking at the hedonic pricing model for the Gatineau region, the
discount for Ontarian brands was $0.08/L, which is very similar to the general
model‘s predicted discount of $0.09/L (subtracting $0.126/L from the $0.216/L
discount for Ontarian brands). In other words, while Ontarian brands were
generally sold at a lower price, compared to Québec brands, the difference is less
visible when shopping in Gatineau.
Also, including the regional brand base had an impact on the coefficient
associated with milk produced or processed in Canada, which was originally

93
associated with a negative discount of $0.04/L. After accounting for brand base,
the front-of-package label carried a premium of approximately $0.07/L, which
suggests that Québec consumers react positively to the ―blue cow‖ logo.
Lastly, equality between the discounts associated with local brands and
Ontarian brands sold in Gatineau was tested. The null hypothesis that the $0.11/L
discount associated with the local Québec dairy and the $0.08/L discount
associated with Ontarian brands could not be rejected at p=0.01 and both variables
could be grouped together.
4.3.3.3 Differences in Local Brand Names
The final region-based analysis focused on the impact of the choice of
brand name on consumer behaviour. After finding that consumers were not
willing to pay more for store brands than local brands of blackberry jam, Hu et al.
(2011) suggested that consumers may not have been aware that those brands were
regionally produced. Accordingly, it was hypothesized that the low price premium
found for local brands in the hedonic pricing model for milk (Table 5) may have
resulted from the aggregation of positive premiums associated with local-
sounding brand names and negative or null premiums associated with brands
name that did not implicitly advertise region of production.
Table 11 shows the categorization of local brands, along with the city or
region of local dairies‘ regional headquarters. Determining whether a brand name
bears a regional connotation is based on some level of subjectivity, but Table 11
shows how brand names classified as region-based explicitly (Laiterie de la Baie
and de l‘Outaouais) or implicitly (Trois Vallées) state where the local dairy is
located, or exhibit some acoustic resemblance (Chalifoux). The Trois Vallées
brand translates to ―Three Valleys‖ in English, which refers to three watersheds
located near the Mont Laurier dairy: Vallée de la rivière du Lièvre, Vallée de la
rivière Gatineau, Vallée de la rivière Rouge (Trois Vallées, 2012).

94
Table 11. Classification of Local Brands According to Brand Name
Region-Based Brand Names Regular Local Brand Names
Chalifoux (Charlevoix) Chagnon (Waterloo)
Laiterie de la Baie (La Baie) Lamothe (Drummondville)
Laiterie de l'Outaouais (Outaouais)
Trois Vallées (Mont Laurier)
Nutrinor (Alma)
Royala (Beauce)
To test whether the implicit prices differ according to local brand names,
the variable Local_Brand in the hedonic pricing model was substituted for the
variables Local_Region and Local_NoRegion, which captured region-based brand
names and regular local brand names, respectively. The significance for both
variables was tested for three models (price-regulated milk, non-regulated milk
and all milk) that included the three new region-based variables (RegionII,
Ontario Brand Base and Gatineau*Ontario Brand). Additionally, the Pasteurized
Milk*Local Brand variable was omitted in order to minimize collinearity.
Regression results are tabulated in Appendix X along with robust standard errors.
In general, the OLS estimates of retail milk prices in Appendix X were
similar to those shown in Table 9, with the exception of the $0.08/L premium
associated with 100% Canadian milk region of production label. As discussed in
the previous section, the inclusion of the Ontario Brand Base variable generated a
positive premium for the Canadian region of production label. However,
premiums were not observed in both the regulated and unregulated models.
For the price-regulated model, regression results suggest that there is a
$0.04/L price premium associated with milk processed by local dairies with
region-based names and a $0.02/L premium for milk processed by local dairies
without region-based names, compared to national brands. Also, the negative
price premium associated with the Canadian region of production label implies
that local dairies shouldn‘t place a ―100% Canadian milk‖ symbol on their
products. As discussed previously, the discount associated with the Québec region
of production label is brand-specific; combining the Local_Region premium of

95
$0.04/L with the $0.05/L discount suggests that the Laiterie de l‘Outaouais sells
their milk at the same price as national brands.
For the unregulated milk model, results indicated that, ceteris paribus,
local brands were priced somewhere in between private and national brands.
Surprisingly, the premium associated with local brands bearing regional names
was lower than brands not bearing region names. This seems to suggest that
consumers prefer local brands that sound like national brands, when choosing
unregulated milk. The premiums for the Québec and Canada region of production
label imply that consumers buying unregulated milk positively respond to region
of production labels, regardless of whether they are provincial or national. In fact,
the higher premium for the ―blue cow‖ logo alludes to a preference for Canadian
milk.
In terms of the brand base variables, the Ontario Brand Base and
Gatineau*Ontario Brand variables show brand base was not a factor
distinguishing price-regulated milk, neither province-wide or in Gatineau. While
the null hypotheses that either or both variables were equal to zero were rejected
at conventional levels of significance, Appendix X shows that their impact on the
dependent variable is less than $0.01/L. For unregulated milk, there seems to be a
clear preference for Québec-based milk brands province-wide, although that
difference is partially mitigated in the National Capital Region.

96
4.3.3.4 Discussion
The investigation of regional market differences for fluid milk yielded
three general results. First, partially classifying stores as being located in Region I
or Region II showed that both regulated and non-regulated milk products were
priced at a premium in Region II, compared to Region I. Second, results indicated
that Ontarian brands sold in Québec were priced at a discount, but the mark-down
is less noticeable in border towns. Lastly, consumers buying base milk seem to
prefer local milk with brand names exhibiting region-based attributes, while
consumers purchasing unregulated milk prefer national brands, followed by local
brands whose names do not implicitly suggest regionality.
These overall findings can be compared with results from Hu et al.‘s
(2011) choice experimental analysis for consumer preference for locally produced
jam. The authors considered three geographical ranges associated with local-
based attributes: sub-state level, state-level and multi-state level, and found that
consumers were willing to pay a higher premium for jam produced in a specific
region of Ohio, than jam labelled ―Ohio Proud‖. In contrast, results from this
study suggest Québec consumers‘ preference for local milk depends on whether
they are purchasing base milk or price-unregulated milk. Overall, local milk is
priced below milk sold by national processors, but above store-brand milk.

97
5 CHAPTER V. SUMMARY AND CONCLUSIONS
This study sought to examine the relationship between food product and
price by accounting for attributes other than physical characteristics. Using the
hedonic price method, the following four objectives were investigated for retail
milk and oatmeal products:
1) To evaluate whether there were significant implicit prices for labelling
statements that advertise the presence, absence, or level of an attribute in
food products;
2) To estimate whether implicit prices for food product characteristics,
including labelling statements, differed by store type;
3) To estimate whether implicit prices for food product characteristics,
including labelling statements, differed by store location;
4) To determine the presence of cross-product trends by comparing results
for the previous objectives for two food products.
To address these objectives, aggregated 2010 Nielsen retail scanner data
were matched with 2011 primary data on front-of-package product claims and
Nutrition Facts table information. General hedonic models were estimated for
milk and oatmeal, respectively. They each included three categories of attributes:
product characteristics, product labels and store characteristics. In particular, the
first category included variables controlling for volume, package type, function,
flavour and brand type. For milk, the product label category accounted for front-
of-package claims about region of production, cholesterol level, fat level, calcium
content, protein presence and the pasteurization process. The oatmeal model
included front-of-package labels regarding fibre and whole grain content as well
as flavour type (natural vs. artificial). Store characteristics were composed of
dummy variables for different retail chains and store region. Store-level
differences were investigated by estimating independent models for each retail
chain. Regional pricing differences were studied by categorizing stores as either
urban or rural based on partial postal codes for milk and oatmeal, followed by the
addition of three region-based variations for fluid milk.

98
Results 5.1
The main objective of this study was to evaluate the implicit prices of
front-of-package labels, store characteristics and regional characteristics
associated with food products in order to complement recent studies that focused
primarily on physical product characteristics. For both milk and oatmeal, results
for the general hedonic price model showed that the largest premiums tended to
be associated to product-level characteristics, followed by store-level
characteristics and product labels. Estimated values suggested that front-of-
package labels that contain non-verifiable information (credence attributes) may
significantly influence product price. The categories of variables falling under this
group were: region of production (milk that is processed in Canada or Québec),
flavour labels (naturally flavoured oatmeal) and composition labels (whole grain
oatmeal). In turn, nutrient content claims, which are statements that consumers
can verify with a product‘s Nutrition Facts table, were associated with small price
premiums or price discounts. Together, these two results may imply that
consumers discriminate relevant from redundant information.
In terms of store-level differences, nine models were estimated for each
store category, which was comprised of six individual supermarket chains, gas
stations with convenience stores, box stores and other stores. The hypotheses that
coefficients were equal in the nine retail-level subsamples were strongly rejected
for both milk and oatmeal based on Chow test results. Store-level differences
included the average premiums associated with different attributes as well as
product availability. Subsequent Chow tests also rejected equality between pairs
of subsamples. Everyday low price (EDLP) and supermarket chains following Hi-
Lo promotion-based pricing strategies were pooled together to analyze common
trends. For both milk and oatmeal, the intercept was on average lower for EDLP
chains than the Hi-Lo group. Taken as a whole, these differences suggest that
stores target their consumers differently as the premiums associated with different
product attributes are significantly different at the retail level.
For regional market analysis, no evidence of regional differences in prices,
for either product, resulted from the initial categorization of stores in accordance

99
with Statistics Canada‘s definition of urban and rural areas. Subsequently, three
additional region-based variations were tested for fluid milk. First, the Régie des
marchés agricoles et alimentaires du Québec‘s (RMAAQ) pricing strategy was
partially replicated by classifying stores as being located in Region I or Region II.
Though the RMAAQ only regulates base milk, results showed that both price-
regulated and non-regulated milk were priced at a premium in Region II,
compared to Region I. Second, milk brands were categorized according to
provincial headquarters. Adding this distinction in the hedonic price model
indicated that Ontarian brands sold in Québec were priced at a discount, but the
mark-down is less noticeable in Gatineau, a Québec city part of the National
Capital Region. Third, local brands were divided into two categories: brand name
bearing a regional connotation and brand names that did not implicitly suggest
regionality. Model estimates suggested that consumers purchasing unregulated
milk prefer national brands, followed by local brands whose names do not
implicitly suggest regionality, local brands bearing regional names and private
(store) brands. In contrast, the premiums for price-regulated milk were reversed,
indicating that consumers buying base milk prefer local brands bearing regional
connotations, followed by local brands whose names do not suggest regionality
and national brands.
Discussion 5.2
This study examined the impact of front-of-package claims on product
price using the hedonic price method. Recent research has estimated the direct and
indirect cost of obesity in Canada to be $4.3 billion in 2005 Canadian dollars
(PHAC, 2009a), while in the U.S. the cost was estimated to be $147 billion in
2008 (Finkelstein et al., 2009). The economic implications of obesity have led
some policy-makers and researchers in the U.S. to propose and design fiscal
interventions, such as ―sin‖ taxes and ―thin‖ subsidies, to improve American diets.
Cash and Lacanilao (2007) discuss how the economic evidence of the impact of
fat taxes and thin subsidies vary widely. Powell and Chaloupka (2009) analyzed
nine studies that examined the relationship between food prices or taxes and

100
weight outcomes, and concluded, based on the limited empirical evidence, that
taxes and subsidies on certain foods generally do not produce significant changes
in body mass index (BMI). While research is required to better understand how
price changes affect the demand for various foods, another approach is to study
consumer preferences for different food product attributes.
In this manner, certain implications can be derived from the analysis of
front-of-package results. First, consumers tend to discard claims that are
redundant with information found on the Nutrition Facts table. Policies focusing
on improving public health should focus on the latter. Recent programs by Health
Canada aiming at a better understanding of the Nutrition Facts table constitute one
way to apply these results. Second, firms facing difficulties in choosing which
attributes to display (Golan et al., 2010) on their front-of package should focus on
credence attributes rather than displaying nutrient content claims, with the
exception of the ―low fat‖ label.
The majority of the results were in line with research based on stated
preference research; however, certain outcomes remain counter-intuitive. In
terms of front-of-package labels, regression results originally showed that a small
discount was associated with the 100% Canadian milk ―blue cow‖ logo,
symbolizing milk produced in Canada. Distinguishing between Québec and
Ontarian brands resolved the counter-intuitive negative premium, implying that
brand base is a more important distinguishing factor for consumers than region of
production labels. Also, the price premiums associated with local brands for both
milk and oatmeal conflicted with ex-ante predictions, where it was hypothesized
that locally produced products would yield a premium in comparison to national
brands. Instead results showed, ceteris paribus, that a negligible premium was
associated with local brands of milk and that local brands of oatmeal were heavily
discounted. Regional analyses suggested that consumers associate different
premiums for price-regulated and non-regulated milk, and these results partially
accounted for the low premiums for local milk brands. However, it remains
unclear why negative premiums were associated with local brands of oatmeal,

101
which is a result contrary to almost all stated preference studies for locally grown
products (Hu et al., 2011).
Limitations 5.3
In terms of store-level analyses, one limitation was the small choice set of
oatmeal, which hindered cross-store examinations. The presence of
multicollinearity in certain instances also made it difficult to isolate the separate
effects of individual explanatory variables.
With regards to the regional analysis, results were based on the
categorization of stores in rural or urban areas based on their partial postal codes
(Forward Sortation Areas or FSAs). This may have led to classification errors in
less populated regions where an FSA can designate a large geographical region
within which an urban town is located, as opposed to more densely populated
areas where each city is assigned its own FSA.
The hedonic model specifications also impacted the results of this study.
One alternative would be to use non-parametric models as alternatives to linear or
log-linear parametric models. In contrast to parametric models, these models do
not make assumptions about the distribution of data and do not dictate the shape
of the regression functions beyond some degree of smoothness, and are ―truly
empirical in spirit‖ (Yatchew, 1988, p.715). Parametric and non-parametric
models can be used concurrently to cross-verify model estimations. For instance,
non-parametric models were used by Li and Hooker (2009) to verify the
estimation of their semi-log model in addition to applying a Box-Cox maximum
likelihood method to choose between a linear and log-linear model.
Lastly, certain limitations are associated with using the hedonic pricing
methodology and store-level scanner data. These aggregated data do not provide
insights on the preferences of individual consumers, but rather individual stores,
or the average consumer who shopped in those stores. Consumer purchases were
likely to be influenced by several other external characteristics that are not
captured by the hedonic price models, which are instead based on actual retail
prices and product availability from which revealed preferences are inferred.

102
Future Research 5.4
Based on the results of this study, several considerations could be extended
to future research. First, the negative premiums associated with local brands of
oatmeal and Canadian region of production labels deserve further investigation.
The dichotomy between the results obtained from this revealed preference study
and those from stated preference methodologies could be addressed by designing
an alternative model based on the same data or by applying hedonic pricing
analysis to another location. For local oatmeal, an expanded choice set would
enable the analysis of the local attribute without the presence of multicollinearity
in order to determine whether consumers discount locally packaged oatmeal or
whether local producers discount their product to be competitive with
multinational companies. Otherwise, given that a previous Québec choice
modelling study has also identified a price discount associated with Canadian
milk when compared to Québec-produced milk (Roy, 2009), a cross-provincial
study could help determine whether Québec consumers value the ―blue cow‖ label
milk differently than the rest of Canada.
Another cross-provincial analysis that could be undertaken involves
comparing hedonic models estimates for the same product in the same retail chain
across different regions. With store-level scanner data, within-province results
suggest that stores do not discriminate between rural and urban consumers.
Further analysis could determine whether stores distinguish between-province
consumers, as the Gatineau region results suggest.
Given that the front-of-package labels considered for milk and oatmeal in
this study were different, it was not possible to compare premiums associated with
claims across products. Based on study results, it was generalized that consumers
tend to prefer non-verifiable information and discount front-of-package
statements that can be found on the Nutrition Facts table. Another area of research
would be to pursue cross-product analysis to determine whether this conclusion
can be applied to different food products. At the retail level, comparing premiums
between products can help determine whether EDLP and Hi-Lo retail chains
attribute the same pricing strategy for all food categories within a same store type.

103
Lastly, this study proposed that consumers who purchase price-regulated
milk have a different set of preferences regarding local brands than those who
purchase unregulated milk. While Hu et al. (2011) conclude that consumers‘
willingness to pay for local foods differ according to the geographic range they
consider local, this study extends their results by suggesting that consumers
discriminate between sub-categories of a same product when purchasing local
foods as well. In this manner, interaction terms between the local and price-
regulated variables may address this hypothesis. Otherwise, household-based
scanner data represent an alternative approach to store-level scanner data from
which individual-level conclusions could not be asserted. Household-level data
could address whether consumer preferences for local milk are related to
purchases of functional milk, in addition to identifying determinants of purchasing
behaviour, such as income or household size.

104
BIBLIOGRAPHY
Agropur Division Natrel. 2008. Sealtest Milk. http://www.quebon.ca/english/
ourbrands/sealtest_milk.html (accessed December 18, 2011).
Ahmad, W., and S. Anders. 2011. ―The Value of Brand and Convenience
Attributes in Highly Processed Food Products.‖ Canadian Journal of
Agricultural Economics 00:1-21.
Alfieri, L., and C. Byrd-Bredbenner. 2000. ―Assessing the Performance of
Women on Labeling Tasks.‖ American Journal of Health Studies 16(3):113-
123.
Aliments du Québec. 2011. Who we are. http://www.alimentsduquebec.com/
who-we-are.html (accessed January 2, 2012).
Arnoult, M., A. Lobb, and R. Tiffin. 2007. ―The UK Consumer‘s Attitudes to, and
Willingness to Pay for, imported food.‖ Paper presented at the 105th
EAEE
Seminar ‗International Marketing and International Trade of Quality Food
Products‘, Bologna, Italy, March 8-10.
Bakan, D. 1966 ―The test of significance in psychological research.‖
Psychological Bulletin 66(6):423-437.
Balasubramanian, S.K., and C.A. Cole. 2002. ―Consumers' search and use of
nutrition information: The challenge and promise of the Nutrition Labeling
and Education Act.‖ Journal of Marketing 66,112-127.
Banterle, A., L. Baldi, and S. Stranieri. 2008 ―Do Nutritional Claims Matter to
Consumers? An Empirical Analysis Considering European Requirements.‖
Paper presented at the 8th
International Conference on Management in
AgriFood Chains and Networks, Ede-Wageningen, May 28-30.
Berge‘s-Sennou, F. 2006. ―Store Loyalty, Bargaining Power and the Private Label
Production Issue.‖ European Review of Agricultural Economics 33(3): 315-
335.

105
Brandt, M., J. Moss, and M. Ferguson. 2009. ―The 2006-2007 Food Label and
Package Survey (FLAPS): Nutrition Labeling, Trans Fat Labeling.‖
Journal of Food Composition and Analysis 22S:S74-77.
Burchardi, H., C. Shröder, and H.D. Thiele. 2005. ―Willingness-To-Pay for Food
of the Own Region: Empirical Estimates from Hypothetical and Incentive
Compatible Settings.‖ Paper presented at the AAEA Annual Meeting,
Providence, Rhode Island, July 24-27.
Canadian Food Inspection Agency (CFIA). 2010. Guide to Food Labelling and
Advertising.http://www.inspection.gc.ca/english/fssa/labeti/guide/
ch1e.shtml (accessed February 23, 2012).
—. 2011. Meat Hygiene Manual of Procedures. http://www.inspection.gc.ca/
english/fssa/meavia/man/ch1/table1e.shtml (accessed February 23, 2012).
—. 2008. Nutrition Labelling Toolkit. http://www.inspection.gc.ca/english/fssa/
labeti/nutrikit/nutrikite.shtml (accessed February 23, 2012).
Cash, S.B., and R.D. Lacanilao. 2007. ―Taxing Food to Improve Health:
Economic Evidence and Arguments.‖ Agricultural and Resource Economics
Review 36(2):174-182.
Chang, J.B., J.L Lusk, and F.B. Norwood. 2010. ―The Price of Happy Hens: A
Hedonic Analysis of Retail Egg Prices.‖ Journal of Agricultural and
Resource Economics 35(3):406-423.
Cowburn, G., and L. Stockley. 2004. ―Consumer understanding and use of
nutrition labeling: a systematic review.‖ Public Health and Nutrition
8(1):21-28.
Cropper, M.L., L.B. Deck, and K.E. McConnell. 1988. ―On the Choice of
Functional Form for Hedonic Price Functions.‖ The Review of Economics
and Statistics 70(4):668-67.
Dairy Farmers of Ontario (DFO). 2012. Pricing. http://www.milk.org/Corporate/
View.aspx?Content=Students/Pricing (accessed February 23, 2012).
Department of Justice (DoJ). 2010. Consumer Packaging and Labelling Act (R.S.,
1985, c. C-38).

106
Diewert, W.E. 2003. ―Hedonic Regressions: A Review of Some Unresolved
Issues‖, 7th Ottawa Group Meeting on Price Indices, Paris, May 27-29.
Drichoutis, A.C., P. Lazaridis, and R.M. Nayga. 2006. ―Consumers‘ Use of
Nutritional Labels: A Review of Research Studies and Issues.‖ Academy of
Marketing Science Review 9:1-22.
Einav, L., E. Leibtag, and N. Nevo. 2008. ―On the Accuracy of Nielsen Homescan
Data.‖ United States Department of Agriculture, Economic Research Report
Number 69.
Electronic Code of Federal Regulations (e-CFR). Title 21: Food and Drugs, 2010.
http://www.gpoaccess.gov/cfr/index.html (accessed November 14, 2010).
El-Zammar, S. Personal Communication. Saputo Dairy Products Canada, October
2011.
Fédération des producteurs de lait du Québec. 2011. Rapport Annuel 2010 : Le
défi de la relève. Longueuil, Québec : Fédération des producteurs de lait du
Québec.
Feenstra, R.C. 1995. ―Exact Hedonic Price Indexes.‖ The Review of Economics
and Statistics 77(4):634-653.
Finkelstein, E.A., J.G. Trogdon, J.W. Cohen, and W. Dietz. 2009. ―Annual
Medical Spending Attributable to Obesity: Payer-and Service-Specific
Estimates.‖ Health Affairs (Millwood) 28(5):w822-w831.
Food and Drug Administration (FDA). 2008. ―Food Labeling Guide.” U.S.
Department of Health and Human Services, FDA, Center for Food Safety
and Applied Nutrition, Office of Nutrition, Labeling and Dietary
Supplements
—. 1993. ―Regulatory impact Analysis of the Final Rules to Amend the Food
Labeling Regulations.‖ Federal Register 58(3): 2927-2941.
Food Marketing Institute (FMI). 2010. Supermarket Facts. http://www.fmi.org/
facts_figs/?fuseaction=superfact (accessed March 30, 2012).
Garretson, J.A., and S. Burton. 2000. ―Effects of Nutrition Facts Panel Values,
Nutrition Claims, and Health Claims on Consumer Attitudes, Perceptions of

107
Disease-Related Risks, and Trust.‖ Journal of Public Policy and Marketing
19(2):213-227.
Geiger, C.J. 1998. ―Health claims: History, current regulatory status, and
consumer research.‖ Journal of the American Dietetic Association 98(11):
1312-1322.
Golan, E., F. Kuchler, L. Mitchell, C. Greene, and A. Jessup. 2001. ―Economics
of Food Labeling.‖ U.S. Department of Agriculture, Economic Research
Service, Agricultural Economics Report No. 793.
Grand Pré. 2012. FAQ Grand Pré Milk and Cream. http://www.grand-pre.ca/
index.php (accessed January 2, 2012).
Gulseven, O., and M. Wohlgenant. 2010. ―A Hedonic Metric Approach to
Estimating the Demand for Differentiated Products: An Application to
Retail Milk Demand.‖ Paper presented at the 84th
Annual Conference of the
Agricultural Economics Society, Edinburgh, March 29-31.
Halvorsen, R., and R. Palmquist. 1980. ―The Interpretation of Dummy Variables
in Semilogarithmic Equations.‖ American Economic Review 70:474-475.
Health Canada. 2005. Statement from Health Canada About Drinking Raw Milk.
http://www.hc-sc.gc.ca/fn-an/securit/facts-faits/rawmilk-laitcru-eng.php
(accessed December 18, 2011.)
Hidano, N. 2002. The Economic Valuation of the Environment and Public Policy:
A Hedonic Approach. Massachusetts: Edward Elgar Publishing, Inc.
Higgingson, C.S., T.R. Kirk, M.J. Rayner, and S. Draper. 2002a. ―The nutrition
label – which information is looked at?‖ Nutrition and Food Science 32
(3):92-99.
Higgingson, C.S., T.R. Kirk, M.J. Rayner, and S. Draper. 2002b. ―How do
consumers use nutrition label information?‖ Nutrition and Food Science 32,
(4):145-152.
Hill, R.C., W.E. Griffiths, and G.G. Judge. 2001. ―Collinear Economic
Variables,‖ In Undergraduate Econometrics, 2nd
edition. U.S.A.: John Wiley
and Sons Inc.

108
Hu, W., W.L. Adamowicz, and M.M. Veeman. 2006. ―Labeling Context and
Reference Point Effects in Models of Food Attribute Demand.‖ American
Journal of Agricultural Economics 88(4):1034-1049.
Hu, W,. M.T. Battle, T. Woods, and S. Ernst. 2011. ―Consumer Preferences for
Local Production and Other Value-Added Label Claims for a Processed
Food Product.‖ European Review of Agricultural Economics, Advance
Access doi: 10.1093/erae/jbr039: p.1-22.
Huffman, K.S., and H.H. Jensen. 2004. ―Demand for Enhanced Foods and the
Value of Nutritional Enhancements of Food: The Case of Margarines‖
Paper presented at the American Agricultural Economics Association,
Denver, August 1-4.
Hulten, C.R. 2003. ―Price Hedonics: A Critical Review.‖ Federal Reserve Bank of
New York Economic Policy Review 9(3):5-15.
Kennedy, P. 2008. A Guide to Econometrics, 6th
edition. Massachusetts:
Blackwell Publishing.
Ladd, G.W., and V. Suvannunt. 1976. ―A Model of Consumer Goods
Characteristics.‖ American Journal of Agricultural Economics 58(3):504-
510.
Lancaster, K.J. 1966. "A New Approach to Consumer Theory." Journal of
Political Economy 74:132-157.
Lee, C.M., H.R. Moskowitz, and S-Y. Lee. 2007. ―Expectations, Needs and
Segmentation of Healthy Breakfast Cereal Consumers.‖ Journal of Sensory
Studies 22:587-607.
LeGault, L., M.B. Brandt, N. McCabe, C. Adler, A-M. Brown, and S. Brecher.
2004. ―2000-2001 Food Label and Package Survey: An Update on
Prevalence of Nutrition Labeling and Claims on Processed, Packaged
Foods.‖ Journal of the American Dietetic Association 104(6):952-958.
Leibtag, E. 2008. ―Measuring Retail Food Price Variation: Does the Data Source
Matter?‖ Paper presented at the American Agricultural Economics
Association, Orlando, July 27-29.

109
Leszczyc, P.T.L., A. Sinha, and A. Sahgal. 2004. ―The effect of multi-purpose
shopping on pricing and location strategy for grocery stores.‖ Journal of
Retailing 80:85-89.
Leszczyc, P.T.L., A. Sinha, and H.J.P. Timmermans. 2000. ―Consumer Store
Choice Dynamics: An Analysis of the Competitive Market Structure for
Grocery Stores.” Journal of Retailing 76(3):323-345.
Li, J., and N.H. Hooker. 2009. ―Documenting Food Safety Claims and Their
Influence on Product Prices.‖ Agricultural and Resource Economics Review
38(3):311-323.
Loureiro, M.L., and J.J. McCluskey. 2000. ―Assessing Consumer Response to
Protected Geographical Identification Labeling.‖ Agribusiness 16(3):309-
320.
Louviere, J. 2001. ―Choice Experiments: an Overview of Concepts and Issues.‖ J.
Bennet and R. Blamey, eds. In The Choice Modelling Approach to
Environmental Valuation, Northampton, MA: Edward Elgar, pp.13-36.
Maguire, K.B., N. Owens, and N.B. Simon. 2004. ―The Price Premium for
Organic Babyfood: A Hedonic Analysis.‖ Journal of Agricultural and
Resource Economics 29(1):132-149.
Malpezzi, S. 2002. ―Hedonic Pricing Models: A Selective and Applied Review.‖
Unpublished, The Center for Urban Land Economics Research, University
of Wisconsin.
Martinez, S.W. ―Estimating the Value of Retail Beef Product Brands and Other
Attributes.‖ Paper presented at the American Agricultural Economics
Association, Orlando, July 27-29, 2008.
Mason, C., and J.M. Quigley. 1990 ―Comparing the Performance of Discrete
Choice and Hedonic Models.‖ In Spatial Choices and Processes. M.M.
Fischer, P. Nijkamp and Y.Y. Papageorgiou, eds. Amsterdam: Elsevier
Science Publishers. pp. 219-246.
Maynard, L., and C. Thompson. 2010. ―Support for Local Dairy Products Among
Kentucky Consumers.‖ Report prepared for the Kentucky Milk
Commission, Frankfort, KY.
110
Mojduszka, E.M. 2001. ―Integration of a product choice model and a latent
variable model of nutrition information.‖ Paper presented at the AAEA,
Chicago, August 5-8.
Muth, M.K., P.H. Siegel, and C. Zhen. 2007. ―Homescan Data Description.‖
Unpublished manuscript, RTI International, Project Number 0210153.001.
Muth M.K., C. Zhen, J. Taylor, S. Cates, and K. Kosa. 2009. ―The Value to
Consumers of Health Labeling Statements on Breakfast Foods and Cereals.‖
Paper presented at the International Association of Agricultural Economists
Conference, Beijing, August 16-22.
Nielsen. 2007. Organics and Functional Foods: a global Nielsen consumer
report. http://at.nielsen.com/pubs/documents/OrganicsFood5.pdf (accessed
December 23, 2011).
Nielsen. 2009. Service Descriptions. http://enus.nielsen.com/content/dam/nielsen/
en_us/documents/pdf/Contracts/ServiceDescriptions10_09.pdf (accessed
November 14, 2010).
Nielsen. 2010. ―Global Trends in Healthy Eating.‖ Nielsen Wire, August 30.
http://blog.nielsen.com/nielsenwire/consumer/global-trends-in-healthy-
eating/ (accessed March 30, 2012).
Olunk, N.J., G.T. Tonsor, and C.A. Wolf. 2010. ―Consumer Willingness to Pay
for Livestock Credence Attribute Claim Verification.‖ Journal of
Agricultural and Resource Economics 35(2):261-280.
Parcell J.L., and T.C. Schroeder. 2007. ―Hedonic Retail Beef and Pork Product
Prices.‖ Journal of Agricultural and Applied Economics 39(1):29-46.
Parmalat Canada Inc. No date. Where to Buy Beatrice. http://www.beatrice.ca/
where_to_buy.php (accessed December 18, 2011).
Parmalat South Africa. No date. What is Functional Milk. http://www.functional
milk.co.za/what_is.html (accessed December 23, 2011).
PepsiCo Canada ULC. No date. Quaker Weight Control Instant Oatmeal.
www.quakeroats.ca (accessed February 23, 2012).
Pothoulaki, M., and G. Chryssochoidis. 2009. ―Health claims: Consumers‘
matters.‖ Journal of Functional Foods 1:222-228.

111
Powell, L.M., and F.J. Chaloupka. 2009. ―Food Prices and Obesity: Evidence and
Policy Implications for Taxes and Subsidies.‖ The Milkbank Quarterly 87,
(1):229-257.
Public Health Agency of Canada (PHAC). 2009a. Economic Burden of Illness in
Canada, 2000. Ottawa (in press).
—. 2009b. Obesity in Canada – Snapshot. http://www.phac-aspc.gc.ca/
publicat/2009/oc/index-eng.php#eco (accessed November 13, 2010).
Raghunathan, R., R.E. Walker, and W.D. Hoyer. 2006. ―The Unhealthy = Tasty
Intuition and Its Effects on Taste Inferences, Enjoyment, and Choice of
Food Products.‖ Journal of Marketing 70:170–84.
Régie des marchés agricoles et alimentaires du Québec (RMAAQ). 2011.
Lait : Prix du lait de consommation. http://www.rmaaq.gouv.qc.ca/index.
php?id=118&0= (accessed December 17, 2011).
Rosen, S. 1974. ―Hedonic Prices and Implicit Markets: Product Differentiation in
Pure Competition.‖ The Journal of Political Economy 82(1):34-55.
Roy, R. 2009. ―Consumer Valuation of Food Attributes: A Comparison of
Willingness to Pay Estimates from Choice Modelling and Contingency
Valuation Methods.‖ MS thesis, McGill University.
Schulz, L.L., T.C. Schroeder, and K. White. 2010. ―Value of Beef Steak
Branding: Hedonic Analysis of Retail Scanner Data.‖ Paper presented at the
Agricultural and Applied Economics Association, Denver, July 25-27.
Smith T., C.L. Huang, and B-H Lin. 2009. ―How much are Consumers Paying for
Organic Baby Food?‖ Paper presented at the Southern Agricultural
Economics Association, Atlanta, January 31-February 3.
Spitzer, J.J. 1982. ―A Primer on Box-Cox Estimation.‖ The Review of Economics
and Statistics 64(2):307-313.
Statistics Canada. 2008. Population and dwelling counts, for Canada, census
metropolitan areas, census agglomerations and census subdivisions
(municipalities), 2006 and 2001 censuses - 100% data.
http://www12.statcan.ca/census-recensement/2006/dp-pd/hlt/97-550
(accessed December 31, 2011).

112
—. 2009. Population, urban and rural, by province and territory
(Quebec). http://www40.statcan.ca/l01/cst01/demo62f-eng.htm (accessed
December 23, 2011).
—. 2007. Urban area (UA). http://www12.statcan.gc.ca/census-recensement/
2006/ref/dict/geo049-eng.cfm (accessed December 18, 2011).
Steiner, B.E. 2004. ―Australian Wines in the British Wine market: A Hedonic
Price Analysis.‖ Agribusiness 20(3):287-307.
Stiegert, K.W., and V. Hovhannisyan. 2009. ―Food Retailing in the United States:
History, Trends, Perspectives.‖ K.W. Stiegert and D.H. Kim, eds. In
Structural Changes in Food Retailing: Six Country Case Studies. Food
System Research Group, November Publication.
Teratanavat, R., N.H. Hooker, C.P. Haugtvedt, and D.D. Rucker. 2004.
―Consumer Understanding and Use of Health Information on Product
Labels: Marketing Implications for Functional Food.‖ Paper presented at the
AAEA, Denver, 1-4August.
Teratanavat, R., and N.H. Hooker. 2006. ―Consumer Valuations and Preference
Heterogeneity for a Novel Functional Food.‖ Journal of Food Science 71
(7):S553-S541.
Trois Vallées. 2012. Qui Sommes Nous? http://www.troisvallees.ca (accessed
January 2, 2012).
Tuorila, H., and A.V. Cardello. 2002. ―Consumer responses to an off-flavor in
juice in the presence of specific health claims.‖ Food Quality and
Preference 13:561-569.
United States Department of Agriculture (USDA). 2008. Organic Labeling and
Marketing Information. http://www.ams.usda.gov/AMSv1.0/getfile?
dDocName=STELDEV3004446&acct=nopgeninfo (accessed November
13, 2010).
Wansink, B. 2003. ―Overcoming the Taste Stigma of Soy.‖ Journal of Food
Science 68(8): 2604-2606.
Wansink, B., and P. Chandon. 2006. ―Can ‗Low-Fat‘ Nutrition Labels Lead to
Obesity?‖ Journal of Marketing Research 43:605-617.

113
Ward, C.E., J.L. Lusk, and J.M. Dutton. 2008. ―Implicit Value of Retail Beef
Product Attributes.‖ Journal of Agricultural and Resource Economics
33(3):364-391.
Worsley, A. 1996. ―Which nutrition information do shoppers want on food
labels?‖ Asia Pacific Journal of Clinical Nutrition 5:70-78.
Yatchew, A. 1998. ―Nonparametric Regression Techniques in Economics.‖
Journal of Economic Literature 36(2):669-721.
Yen, S.M. 2009. ―Valuing Environmental, Health and Social Benefits using
Choice Modeling: a Comparison of the Implicit Prices of Food attributes for
Rural and Urban Consumers.‖ MS thesis, McGill University.
Zarkin G.A., N. Dean, J.A. Mauskopf, and Williams R. 1993. ―Potential Health
Benefits of Nutrition Label Changes.‖ American Journal of Public Health
83:717-724.
Zhen C., J.L. Taylor, M.K. Muth, and E. Leibtag. 2009. ―Understanding
Differences in Self-Reported Expenditures between Household Scanner
Data and Diary Survey Data: A Comparison of Homescan and Consumer
Expenditure Survey.‖ Review of Agricultural Economics 31(3):470-492.

114
APPENDIX I
Règlement sur les prix du lait de consommation
Loi sur la mise en marché des produits agricoles, alimentaires et de la pêche
(L.R.Q., c. M-35.1, a. 40.5)
Article 2 :
Les prix du lait sont fixés sur le territoire du Québec selon les régions ci-décrites:
région I: le territoire du Québec à l'exception des territoires de la Municipalité
de Rapides-des-Joachims et de la municipalité régionale de comté de
Minganie, des territoires situés au nord du 50e parallèle et des territoires des
régions II et III;
région II: le territoire couvrant:
les municipalités régionales de comté d'Abitibi, Abitibi-Ouest,
Témiscamingue, Rouyn-Noranda et Vallée-de-l'Or;
les villes de Lebel-sur-Quévillon et de Matagami;
les municipalités régionales de comté de Bonaventure, Le Rocher-Percé,
La Côte-de-Gaspé, La Haute-Gaspésie et Avignon;
les municipalités régionales de comté de La Haute-Côte-Nord,
Manicouagan et Sept-Rivières;
la Ville de Chibougamau ainsi que les municipalités situées à moins de 80
km de cette dernière;
région III: le territoire de la municipalité des Îles-de-la-Madeleine.

115
APPENDIX II
Region I Fluid Milk Retail Prices
Fat
%
Format
(litres)
January 28,
2008
September 1,
2008
February 1,
2009
February 1,
2010
min max min max min max min max
3.25 1 1.48$ 1.63$ 1.51$ 1.66$ 1.55$ 1.70$ 1.56$ 1.71$
2 2.91$ 3.21$ 2.97$ 3.27$ 3.05$ 3.35$ 3.09$ 3.39$
4 5.58$ 6.18$ 5.69$ 6.29$ 5.85$ 6.45$ 5.91$ 6.51$
2 1 1.41$ 1.56$ 1.44$ 1.59$ 1.48$ 1.63$ 1.50$ 1.65$
2 2.77$ 3.07$ 2.83$ 3.13$ 2.91$ 3.21$ 2.95$ 3.25$
4 5.31$ 5.91$ 5.43$ 6.03$ 5.58$ 6.18$ 5.65$ 6.25$
1 1 1.34$ 1.49$ 1.37$ 1.52$ 1.41$ 1.56$ 1.43$ 1.58$
2 2.63$ 2.93$ 2.69$ 2.99$ 2.77$ 3.07$ 2.81$ 3.11$
4 5.04$ 5.64$ 5.16$ 5.76$ 5.31$ 5.91$ 5.39$ 5.99$
skim 1 1.28$ 1.43$ 1.31$ 1.46$ 1.35$ 1.50$ 1.37$ 1.52$
2 2.53$ 2.83$ 2.59$ 2.89$ 2.67$ 2.97$ 2.70$ 3.00$
4 4.81$ 5.41$ 4.93$ 5.53$ 5.09$ 5.69$ 5.16$ 5.76$
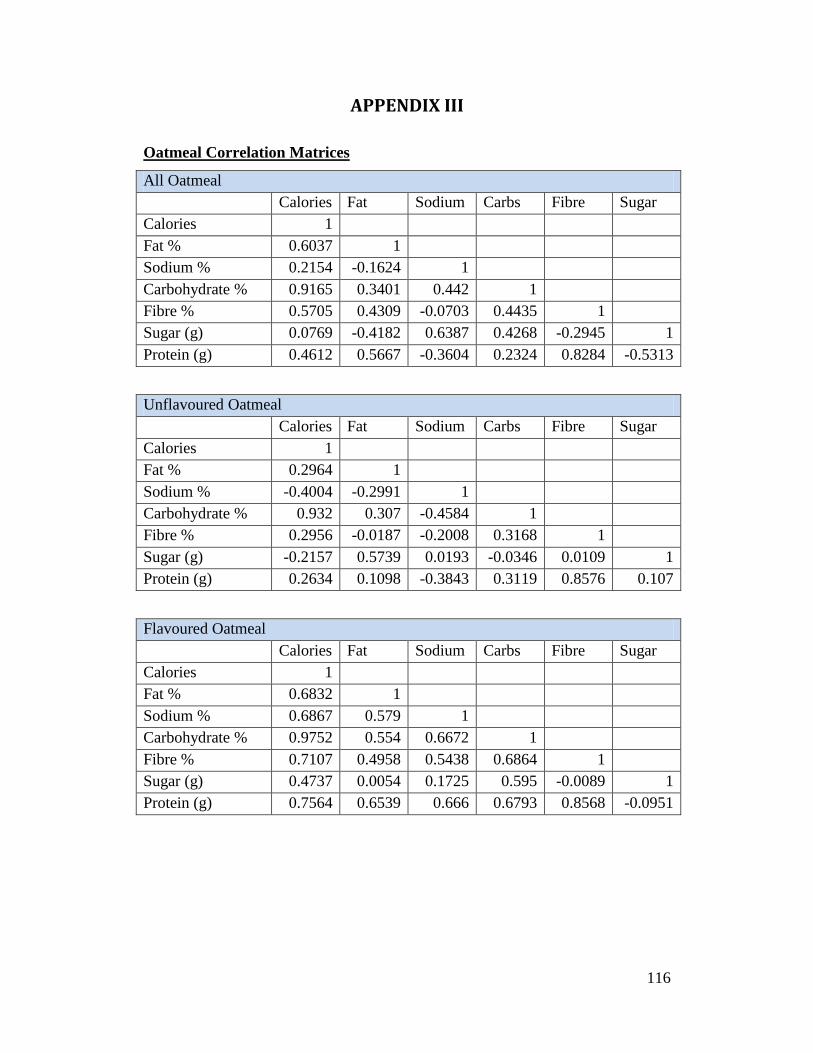
116
APPENDIX III
Oatmeal Correlation Matrices
All Oatmeal
Calories Fat Sodium Carbs Fibre Sugar
Calories 1
Fat % 0.6037 1
Sodium % 0.2154 -0.1624 1
Carbohydrate % 0.9165 0.3401 0.442 1
Fibre % 0.5705 0.4309 -0.0703 0.4435 1
Sugar (g) 0.0769 -0.4182 0.6387 0.4268 -0.2945 1
Protein (g) 0.4612 0.5667 -0.3604 0.2324 0.8284 -0.5313
Unflavoured Oatmeal
Calories Fat Sodium Carbs Fibre Sugar
Calories 1
Fat % 0.2964 1
Sodium % -0.4004 -0.2991 1
Carbohydrate % 0.932 0.307 -0.4584 1
Fibre % 0.2956 -0.0187 -0.2008 0.3168 1
Sugar (g) -0.2157 0.5739 0.0193 -0.0346 0.0109 1
Protein (g) 0.2634 0.1098 -0.3843 0.3119 0.8576 0.107
Flavoured Oatmeal
Calories Fat Sodium Carbs Fibre Sugar
Calories 1
Fat % 0.6832 1
Sodium % 0.6867 0.579 1
Carbohydrate % 0.9752 0.554 0.6672 1
Fibre % 0.7107 0.4958 0.5438 0.6864 1
Sugar (g) 0.4737 0.0054 0.1725 0.595 -0.0089 1
Protein (g) 0.7564 0.6539 0.666 0.6793 0.8568 -0.0951

117
APPENDIX IV
OLS Estimates of Milk Model by Regional Price-Regulated Markets ($/L)
Regulated Market Unregulated Market
Coefficient Coefficient
Intercept 1.555*** 256.17 2.571*** 425.26
Product Characteristics
Volume 0.036*** 29.03 -1.037*** 258.61
(Volume)2 -0.021*** 91.78 0.185*** 187.87
Milk type:
Cow milk -- Base
Buttermilk 1.094*** 212.9
Goat milk 1.724*** 303.38
Fat percentage:
Skim Base Base
1% 0.009 1.50 0.002 1.2
2% 0.069*** 11.23 0.022*** 14.09
Homogenized 0.139*** 22.76 0.061*** 36.4
Package type:
Carton/Bag -- Base
Twist Cap 0.271*** 60.51
Plastic 0.472*** 105.17
Bulk type:
None -- Base
Single-serve 0.625*** 209.65
Multi-package 0.684*** 94.5
Process:
Pasteurized -- Base
UHT 1.082*** 108.26
Micro-filtered -0.006 1.32
Flavour:
No Flavour -- Base
Chocolate 0.553*** 138.1
Strawberry 0.409*** 54.26
Other Flavour 0.425*** 35.39
Function:
None -- Base
Calcium Added 0.416*** 91.91
DHA 0.275*** 54.74
Lactose-Free 0.989*** 223.03
Omega-3 0.330*** 74.57
Organic 0.995*** 387.67
Pre/Probiotic 0.278*** 40.16
Reduced-Sugar 0.105*** 15.54

118
Appendix IV. CONTINUED
Regulated Market Unregulated Market
Coefficient Coefficient
Product Labels
Brand:
National Base Base
Local 0.022*** 11.07 0.016*** 3.74
Private N/A -0.431*** 102.89
Region of Production:
No Label Base Base
Canada -0.017*** 34.67 -0.055*** 8.66
Québec -0.024*** 6.80 0.069*** 60.28
Other Labels:
Low cholesterol: -0.060*** 9.74 -0.044*** 16.36
Low fat label: 0.013*** 7.22 0.147*** 13.5
Fat-free label: -0.047*** 7.58 -0.076*** 32.57
Calcium label: -0.034*** 26.84 -0.024*** 5.76
Protein label: N/A -0.113*** 22.28
Pasteurized label: 0.022*** 7.87 -0.310*** 61.64
Store Characteristics
Retail Chain:
Box Base Base
Gas 0.038*** 69.25 0.429*** 128.51
Retail1 0.007*** 12.05 0.156*** 47.55
Retail2 0.010*** 11.91 0.265*** 81.62
Retail3 0.001* 1.88 0.152*** 45.26
Retail4 0.010*** 14.38 0.266*** 84.85
Retail5 0.001** 2.47 0.320*** 96.55
Retail6 -0.003*** -6.24 0.207*** 62.15
Other 0.018*** 24.29 0.107*** 32.23
Store Region:
Rural Base Base
Urban -0.001*** 2.66 -0.020*** 11.35
R2: 0.767 0.782
No. of Observations: 128184 578024 Notes: Single, double, and triple asterisks denote statistical significance at the 10%, 5%, and 1%
levels, respectively. Numbers in parentheses are White‘s heteroskedastic-consistent standard
errors.

119
APPENDIX V
Summary Statistics of Standardized Nutritional Information of Oatmeal
Model by Flavour Category
Nutritional Information
Non-Flavoured
Flavoured
Mean Std. Dev. Mean Std. Dev.
Per 40g serving:
Fat (%) 4.333 0.652 2.995 0.510
Sodium (%) 0.023 0.059 0.120 0.044
Carbohydrates (%) 8.832 0.667 10.25 0.319
Fibre (%) 16.796 4.831 12.991 0.576
Sugar (g) .298 0.926 9.616 2.290
Protein (g) 6.521 2.110 3.852 0.293
Serving Size (g) 34.706 5.059 41.403 5.271
Price ($/350g) 1.653 0.963 2.791 0.790

120
APPENDIX VI
Table A. Store-Level Regression Results for Milk ($/L)
Gas Retail1 Retail2 Retail4
Intercept 2.434*** 2.503*** 2.625*** 2.424***
(0.007) (0.008) (0.01) (0.008)
Product Characteristics
Volume -0.848*** -0.818*** -0.915*** -0.729***
(0.006) (0.008) (0.008) (0.007)
(Volume)2 0.144*** 0.136*** 0.159*** 0.119***
(0.001) (0.002) (0.002) (0.001)
Regulation:
Regulated Base
Unregulated 0.214*** 0.199*** 0.203*** 0.217***
(0.015) (0.008) (0.007) (0.007)
Milk type:
Cow milk Base
Buttermilk N/A 0.991*** 0.905*** 0.993***
(0.008) (0.011) (0.008)
Goat milk N/A 1.556*** 1.669*** 1.700***
(0.009) (0.011) (0.007)
Fat percentage:
Skim Base
1% 0.123*** -0.001 -0.024*** 0.010**
(0.004) (0.003) (0.004) (0.004)
2% 0.227*** 0.023*** -0.015*** 0.035***
(0.004) (0.003) (0.004) (0.004)
Homogenized 0.277*** 0.068*** -0.009** 0.082***
(0.004) (0.003) (0.004) (0.004)
Package Type:
Carton/Bag Base
Plastic 0.405*** 0.357*** 0.431*** 0.340***
(0.014) (0.011) (0.01) (0.007)
Twist Cap 0.317*** 0.141*** 0.264*** 0.129***
(0.002) (0.005) (0.006) (0.005)
Bulk Type:
None Base
Single-serve 0.752*** 0.365*** 0.865*** 0.606***
(0.004) (0.009) (0.012) (0.008)
Multi-Package N/A 1.120*** 0.609*** 0.936***
(0.014) (0.018) (0.013)

121
Appendix VI: Table A. CONTINUED
Gas Retail1 Retail2 Retail4
Process:
Pasteurized Base Base
UHT N/A 0.804*** 0.915*** 1.072***
(0.012) (0.016) (0.011)
Micro-Filtered -0.126*** 0.109*** 0.020** 0.038***
(0.015) (0.007) (0.007) (0.008)
Flavour:
No Flavour Base Base
Chocolate 1.309*** 0.202*** 0.320*** 0.360***
(0.011) (0.007) (0.011) (0.007)
Strawberry 1.229*** 0.361*** 0.543*** 0.553***
(0.012) (0.022) (0.021) (0.016)
Other Flavour 1.748*** 0.672*** 0.328*** 0.874***
(0.016) (0.037) (0.029) (0.012)
Function:
None Base
Calcium + 0.549*** 0.289*** 0.397*** 0.297***
(0.025) (0.009) (0.008) (0.009)
DHA + -0.057** 0.178*** 0.237*** 0.199***
(0.026) (0.01) (0.008) (0.011)
Lactose-Free 0.668*** 0.947*** 0.871*** 0.974***
(0.016) (0.008) (0.008) (0.009)
Omega-3 + 0.239*** 0.247*** 0.263*** 0.280***
(0.015) (0.008) (0.008) (0.009)
Organic 0.916*** 0.938*** 0.911*** 0.930***
(0.011) (0.005) (0.005) (0.006)
Pre/Probiotic N/A 0.222*** 0.229*** 0.243***
(0.01) (0.01) (0.015)
Reduced-Sugar -0.105*** 0.209*** 0.122*** 0.299***
Brand:
National
Local -0.144*** 0.051*** 0.024** 0.029**
(0.006) (0.007) (0.009) (0.01)
Private N/A N/A -0.434*** -0.301***
(0.009) (0.007)
(0.025) (0.016) (0.015) (0.009)

122
Appendix VI: Table A. CONTINUED
Product Labels
Gas Retail1 Retail2 Retail4
Region of Production
No Label Base
Canada -0.045*** -0.048*** 0.119*** -0.107***
(0.002) (0.004) (0.01) (0.004)
Québec -0.008*** -0.032*** -0.013*** 0.060***
(0.001) (0.002) (0.002) (0.003)
Other Labels
Low cholesterol: -0.022*** -0.083*** -0.158*** -0.070***
(0.006) (0.004) (0.005) (0.005)
Low fat label: -0.713*** -0.217*** -0.637*** 0.024***
(0.017) (0.025) (0.031) (0.016)
Fat-free label: 0.054*** -0.053*** -0.037*** 0.046
(0.004) (0.004) (0.005) (0.005)
Calcium label: 0.166*** 0.355*** 0.173*** 0.205***
(0.008) (0.013) (0.010) (0.009)
Protein label: -0.816*** -0.163*** -0.291*** -0.013
(0.015) (0.013) (0.012) (0.008)
Pasteurized label: 0.156*** -0.233*** -0.204*** -0.158***
(0.013) (0.011) (0.012) (0.011)
Store Characteristics
Store Region
Rural Base
Urban -0.001 -0.003 -0.024*** -0.011***
(0.003) (0.003) (0.005) (0.002)
R2 0.833 0.859 0.865 0.923
No. of obs. 236975 75248 69845 61133 Notes: Single, double, and triple asterisks denote statistical significance at the 10%, 5%, and 1%
levels, respectively. Numbers in parentheses are White‘s heteroskedastic-consistent standard
errors.

123
Table B. Store-Level Regression Results for Milk ($/L)
Retail6 Other EDLP Hi-Lo
Intercept 2.293*** 2.279*** 2.326*** 2.534***
(0.010) (0.010) (0.008) (0.005)
Product Characteristics
Volume -0.659*** -0.602*** -0.704*** -0.872***
(0.010) (0.008) (0.007) (0.004)
(Volume)2 0.108*** 0.100*** 0.119*** 0.149***
(0.002) (0.002) (0.001) (0.001)
Regulation:
Regulated
Unregulated -0.219*** 0.007*** -0.012 0.222***
(0.012) (0.009) (0.009) (0.004)
Milk type:
Cow milk
Buttermilk 1.475*** 1.270*** 1.274*** 0.953***
(0.012) (0.010) (0.010) (0.005)
Goat milk 1.886*** 1.572*** 1.818*** 1.623***
(0.013) (0.021) (0.013) (0.005)
Fat percentage:
Skim
1% 0.019*** 0.042*** 0.037*** -0.001
(0.003) (0.004) (0.002) (0.002)
2% 0.040*** 0.049*** 0.041*** 0.013***
(0.003) (0.004) (0.002) (0.002)
Homogenized 0.056*** 0.113*** 0.069*** 0.038***
(0.003) (0.004) (0.002) (0.002)
Package Type:
Carton/Bag
Plastic 0.710*** 0.359*** 0.449*** 0.386***
(0.013) (0.012) (0.010) (0.005)
Twist Cap 0.199*** 0.114*** 0.262*** 0.207***
(0.006) (0.006) (0.005) (0.003)
Bulk Type:
None
Single-serve 0.875*** 0.557*** 0.799*** 0.562***
(0.013) (0.011) (0.010) (0.005)
Multi-Package 0.590*** 0.712*** 0.514*** 0.878***
(0.018) (0.024) (0.015) (0.008)

124
Appendix VI: Table B. CONTINUED
Retail6 Other EDLP Hi-Lo
Process:
Pasteurized
UHT 1.302*** 1.205*** 1.129*** 0.962***
(0.018) (0.020) (0.014) (0.007)
Micro-Filtered 0.508*** 0.191*** 0.256*** 0.029***
(0.013) (0.008) (0.009) (0.004)
Flavour:
No Flavour
Chocolate 0.335*** 0.557*** 0.384*** 0.304***
(0.013) (0.011) (0.008) (0.005)
Strawberry 0.343*** 0.482*** 0.206*** 0.492***
(0.039) (0.025) (0.023) (0.012)
Other Flavour 0.796*** 0.332*** -0.049 0.596***
(0.014) (0.036) (0.035) (0.016)
Function:
None
Calcium + 0.751*** 0.492*** 0.478*** 0.334***
(0.014) (0.010) (0.009) (0.005)
DHA + 0.633*** 0.404*** 0.371*** 0.200***
(0.015) (0.011) (0.010) (0.005)
Lactose-Free 1.284*** 1.065*** 0.995*** 0.932***
(0.014) (0.009) (0.010) (0.004)
Omega-3 + 0.598*** 0.425*** 0.368*** 0.260***
(0.014) (0.010) (0.010) (0.005)
Organic 0.666*** 0.922*** 0.732*** 0.927***
(0.006) (0.007) (0.004) (0.003)
Pre/Probiotic 0.154*** 0.376*** 0.274*** 0.219***
(0.036) (0.017) (0.015) (0.006)
Reduced-Sugar 0.505*** 0.191*** 0.205*** 0.216***
Brand:
National
Local 0.001 0.054*** 0.007 0.0004
(0.009) (0.007) (0.006) (0.005)
Private -0.015 -0.461*** -0.219*** -0.344***
(0.023) (0.012) (0.009) (0.005)
(0.020) (0.021) (0.015) (0.008)

125
Appendix VI: Table B. CONTINUED
Product Labels
Retail6 Other EDLP Hi-Lo
Region of Production
No Label
Canada -0.071*** -0.075*** -0.067*** -0.028***
(0.008) (0.006) (0.006) (0.003)
Québec -0.001 0.065*** -0.010*** 0.006***
(0.002) (0.002) (0.001) (0.001)
Other Labels
Low cholesterol: -0.060*** -0.075*** -0.060*** -0.106***
(0.004) (0.006) (0.003) (0.003)
Low fat label: N/A 0.294*** 0.117*** -0.206***
(0.020) (0.019) (0.013)
Fat-free label: 0.025*** 0.024*** 0.050*** -0.017***
(0.004) (0.006) (0.003) (0.003)
Calcium label: 0.275 -0.221*** 0.160*** 0.202***
(0.024) (0.008) (0.012) (0.006)
Protein label: 0.113*** 0.002 -0.167*** -0.101***
(0.029) (0.014) (0.013) (0.006)
Pasteurized label: 0.073*** -0.226*** -0.074*** -0.133***
(0.011) (0.011) (0.009) (0.006)
Store Characteristics
Store Region
Rural
Urban N/A -0.031*** -0.003 0.015***
(0.005) (0.005) (0.002)
R2 0.887 0.787 0.834 0.860
No. of obs. 39709 67623 98286 265583
Notes: Single, double, and triple asterisks denote statistical significance at the 10%, 5%, and 1%
levels, respectively. Numbers in parentheses are White‘s heteroskedastic-consistent standard
errors.

126
APPENDIX VII
Table A. Store-Level Regression Results for Oatmeal ($/350g)
Retail1 Retail2 Retail 4
Intercept 2.373*** 1.730*** 2.437***
(0.035) (0.028) (0.056)
Product Characteristics
Weight: -0.317*** -0.102*** -0.261***
(0.006) (0.002) (0.009)
(Weight)2: 0.010*** 0.002*** 0.009***
(0.0004) (0.0001) (0.001)
Nutritional Information:
Fat -0.007*** 0.077*** 0.036***
(0.002) (0.002) (0.005)
Sodium -0.381*** 1.508*** 0.159**
(0.050) (0.046) (0.069)
Carbohydrates 0.030*** -0.105*** -0.093***
(0.005) (0.003) (0.011)
Fibre -0.006*** 0.039*** 0.027***
(0.001) (0.001) (0.003)
Sugar -0.006*** 0.000 0.003
(0.002) (0.001) (0.003)
Protein -0.017*** -0.024*** -0.008
(0.005) (0.003) (0.006)
Oatmeal Type:
Regular
Other 0.150*** 0.206*** -0.233***
(0.023) (0.008) (0.042)
Cooking Time:
Instant
Minute 0.027*** -0.775*** -0.186***
(0.012) (0.012) (0.040)
>Minute 0.012 -0.755*** -0.209***
(0.013) (0.014) (0.040)
Package Type
Regular
Pre-Packaged N/A 0.562*** N/A
(0.021)
Flavour:
No Flavour Base
Regular
Flavour
-0.085*** 0.025* 0.162***
(0.014) (0.014) (0.030)

127
Appendix VII: Table A. CONTINUED
Retail1 Retail2 Retail 4
Other Flavour -0.023** -0.036** 0.074***
(0.009) (0.018) (0.020)
Variety -0.103*** 0.191*** 0.230***
(0.014) (0.013) (0.033)
Function:
No Function
Organic 0.389*** 0.171*** 0.283***
(0.015) (0.008) (0.062)
Reduced Sugar 0.104*** -0.149*** -0.031
(0.012) (0.011) (0.020)
Brand:
Quaker Base
National -0.273*** 0.081*** -0.070**
(0.016) (0.006) (0.028)
Local -0.535*** -0.083*** -0.375***
(0.017) (0.013) (0.020)
Private -0.200*** -0.329*** -0.409***
(0.005) (0.010) (0.053)
Weight
Control
0.201*** -0.052*** -0.173***
(0.020) (0.014) (0.038)
Product Labels
Flavour Label:
No Label Base
Natural
Flavour
0.014** 0.205*** -0.059***
(0.006) (0.008) (0.012)
Artificial
Flavour
0.036*** -0.003 -0.130***
(0.006) (0.007) (0.016)
Other Labels
Fibre Label -0.227*** -0.244*** -0.083**
(0.011) (0.010) (0.041)
Whole Grain Label -0.195*** 0.297*** -0.023
(0.009) (0.006) (0.015)
Store Characteristics
Store Region
Rural Base
Urban 0.007*** -0.017*** -0.002
(0.003) (0.005) (0.004)
R2 0.891 0.904 0.861
No. of Obs. 26247 25086 13898
Notes: Single, double, and triple asterisks denote statistical significance at the 10%, 5%, and 1%
levels, respectively. Numbers in parentheses are White‘s heteroskedastic-consistent standard
errors.

128
Table B. Store-Level Regression Results for Oatmeal ($/350g)
Retail6 Other EDLP Hi-Lo
Intercept 1.227*** 1.567*** 1.027*** 1.767***
(0.291) (0.039) (0.041) (0.016)
Product Characteristics
Weight: 0.190*** -0.102*** -0.076*** -0.197***
(0.025) (0.004) (0.002) (0.002)
(Weight)2: -0.015*** 0.003*** 0.002*** 0.006***
(0.002) (0.0001) (0.00007) (0.000)
Nutritional Information:
Fat 0.080*** 0.060*** 0.067*** 0.021***
(0.011) (0.004) (0.002) (0.001)
Sodium 2.440*** 1.310*** 0.908*** 0.650***
(0.310) (0.087) (0.063) (0.022)
Carbohydrates -0.269*** -0.096*** -0.048*** -0.015***
(0.043) (0.007) (0.006) (0.002)
Fibre 0.065*** 0.037*** 0.030*** 0.009***
(0.008) (0.002) (0.001) (0.001)
Sugar 0.007 -0.021*** -0.036*** -0.011***
(0.011) (0.003) (0.002) (0.001)
Protein -0.356*** -0.002 -0.018 -0.004***
(0.026) (0.006) (0.005) (0.001)
Oatmeal Type:
Regular Base
Other -1.827*** 0.135*** 0.133*** 0.203***
(0.136) (0.029) (0.019) (0.005)
Cooking Time:
Instant Base
Minute 1.198*** -0.661*** -0.598*** -0.299***
(0.136) (0.020) (0.013) (0.007)
>Minute 1.193*** -0.626*** -0.597*** -0.266***
(0.137) (0.020) (0.014) (0.007)
Package Type
Regular Base
Pre-Packaged N/A 0.575*** 0.355*** 0.223***
(0.035) (0.026) (0.010)
Flavour:
No Flavour
Regular
Flavour
0.105** 0.247*** 0.331*** 0.062***
(0.038) (0.025) (0.016) (0.008)
Other Flavour -0.393*** -0.019 0.029 -0.064***
(0.093) (0.029) (0.026) (0.007)
Variety 0.376*** 0.388*** 0.415*** 0.144***
(0.043) (0.020) (0.014) (0.008)

129
Appendix VII: Table B. CONTINUED
Retail6 Other EDLP Hi-Lo
Function:
No Function Base
Organic 2.083*** 0.282*** 0.688*** 0.279***
(0.205) (0.025) (0.031) (0.004)
Reduced Sugar 0.165 -0.286*** -0.198*** -0.065***
(0.049) (0.016) (0.011) (0.006)
Brand:
Quaker Base
National N/A 0.056*** -0.195*** -0.041***
(0.027) (0.029) (0.004)
Local 0.217** -0.222*** -0.310*** -0.318***
(0.107) (0.024) (0.013) (0.006)
Private 0.739*** -0.309*** -0.248*** -0.241***
(0.124) (0.015) (0.012) (0.003)
Weight
Control
0.742*** -0.258*** -0.159*** 0.131***
(0.138) (0.022) (0.018) (0.007)
Product Labels
Flavour Label:
No Label Base
Natural
Flavour
-0.600*** 0.186*** 0.138*** 0.092***
(0.031) (0.012) (0.008) (0.004)
Artificial
Flavour
-0.715*** 0.025** 0.019** -0.007*
(0.037) (0.009) (0.007) (0.004)
Other Labels
Fibre Label 2.092*** -0.168*** -0.056*** -0.140***
(0.142) (0.017) (0.013) (0.003)
Whole Grain Label 0.308*** 0.188*** 0.049 0.055***
(0.047) (0.023) (0.007) (0.004)
Store Characteristics
Store Region
Rural Base
Urban N/A -0.106*** -0.008 0.021***
(0.005) (0.005) (0.002)
R2 0.827 0.849 0.839 0.870
No. of Obs. 11052 16059 31958 83265
Notes: Single, double, and triple asterisks denote statistical significance at the 10%, 5%, and 1%
levels, respectively. Numbers in parentheses are White‘s heteroskedastic-consistent standard
errors.

130
APPENDIX VIII
Price per Litre by Volume
Predicted Price per Litre by Volume, General Hedonic Price Model (All data):
Predicted Price per Litre by Volume, Price-Regulated Milk Model:
$/L
vol (L)
vol (L)
$/L

131
Predicted Price per Litre by Volume, Non-Regulated Milk Model:
vol (L)
$/L

132
APPENDIX IX
OLS Estimates of Retail Milk Model for Québec and Gatineau, with Brand
Base ($/L)
All Data Gatineau
Coefficient Coefficient Intercept 2.326 583.5 2.326 160.7
Product Characteristics
Volume -0.803 292.47 -0.720 -61.76
(Volume)2 0.133 244.57 0.118 50.42
Milk type:
Cow milk Base
Buttermilk 1.175 236.72 1.191 79.15
Goat milk 1.752 326.85 1.765 103.15
Regulation:
Regulated Base
Unregulated 0.056 13.81 0.041 2.98
Fat percentage:
Skim Base
1% 0.010 6.92 -0.031 -6.25
2% 0.035 23.45 0.013 2.56
Homogenized 0.086 57.66 0.077 15.11
Package type:
Carton/Bag Base
Twist Cap 0.174 84.76 0.179 22.82
Plastic 0.469 109.61 0.448 27.17
Bulk type:
None Base
Single-serve 0.767 257.23 0.713 52.74
Multi-package 0.601 82.27 0.649 22.23
Process:
Pasteurized
UHT 1.020 133.16 1.134 43.53
Micro-filtered 0.119 31.16 0.166 12.13
Flavour:
No Flavour Base
Chocolate 0.557 139.29 0.482 33.55
Strawberry 0.419 55.96 0.313 9.16
Other Flavour 0.465 38.84 0.357 7.04

133
Appendix IX. CONTINUED
All Data Gatineau
Coefficient Coefficient Function:
None Base
Calcium + 0.499 130.67 0.474 30.43
DHA + 0.339 74.46 0.379 22.55
Lactose-Free 1.091 284.34 1.063 69.95
Omega-3 + 0.418 106.540 0.420 27.48
Organic 0.987 355.660 1.031 78.78
Reduced-Sugar 0.151 22.650 0.288 10.3
Pre/Probiotic 0.327 47.350 0.242 8.11
National Base
Local -0.013 4.55 -0.110 -10.57
Private -0.445 106.37 -0.415 -27.36
Brand base:
Québec Base
Ontario -0.216 67.99 -0.082 -12.49
Product Labels
Region of Production Label:
No Label Base
Canada 0.068 24.64 -0.029 -3.51
Québec 0.058 57.61 -0.007 * -1.75
Other Labels:
Low cholesterol: -0.071 -35.70 -0.101 -14.44
Low fat label: 0.205 27.13 0.398 12.08
Fat-free label: -0.048 -23.47 -0.148 -18.83
Calcium label: -0.010 -2.64 -0.019 † -1.38
Protein label: -0.071 -14.80 0.102 4.58
Pasteurized label: -0.223 -57.15 -0.312 -12.58
Store Characteristics
Retail Chain:
Box Base
Gas 0.334 131.21 0.276 29.82
Retail1 0.105 39.99 0.069 7.86
Retail2 0.204 79.71 0.135 12.64
Retail3 0.105 40.30 0.059 5.8
Retail4 0.195 78.86 0.164 19.3
Retail5 0.245 94.12 0.148 16.43
Retail6 0.141 53.72 0.104 12.36
Other 0.071 27.53 N/A
Store Region:
Rural Base
Urban -0.016 -10.77 N/A

134
Appendix IX. CONTINUED
All Data Gatineau
Coefficient Coefficient Regional Characteristics
Region:
Region I Base
Region II 0.021 5.80 N/A
Brand Base*Region:
Gatineau*Ontario Brand: 0.126 26.31 --
R2: 0.814 0.852
No. of Observations: 706208 33569 Notes: † Not statistically significant the 0.10 level; * Statistically significant at the 0.10 level; **
Statistically significant at the 0.05 level; All other variables are statistically significant at the 0.01
level. White‘s heteroskedastic-consistent standard errors reported.

135
APPENDIX X
OLS Estimates of Retail Milk Model by Price-Regulated Markets, with
RMAAQ-based Regions, Brand Base and Local Brand Regions ($/L)
All Data Regulated Unregulated
Intercept 2.309 1.556 2.488
(0.004) (0.006) (0.006)
Product Characteristics
Volume -0.804 0.037 -1.053
(0.003) (0.001) (0.004)
(Volume)2 0.133 -0.021 0.188
(0.001) (0.000) (0.001)
Milk type:
Cow milk Base
Buttermilk 1.176 -- 1.209
(0.005) (0.006)
Goat milk 1.746 1.777
(0.005) (0.006)
Regulation:
Regulated Base
Unregulated 0.065
(0.004)
Fat percentage:
Skim Base
1% 0.021 0.004 † 0.026
(0.001) (0.006) (0.002)
2% 0.044 0.065 0.048
(0.001) (0.006) (0.002)
Homogenized 0.096 0.135 0.083
(0.002) (0.006) (0.002)
Package type:
Carton/Bag Base
Twist Cap 0.175 -- 0.284
(0.002) (0.004)
Plastic 0.439 0.522
(0.004) (0.005)
Bulk type:
None Base
Single-serve 0.764 -- 0.641
(0.003) (0.003)
Multi-package 0.615 0.707
(0.007) (0.007)

136
Appendix X. CONTINUED
All Data Regulated Unregulated
Process:
Pasteurized Base
UHT 1.006 -- 0.957
(0.008) (0.010)
Micro-filtered 0.111 0.037
(0.004) (0.004)
Flavour:
No Flavour Base
Chocolate 0.574 -- 0.552
(0.004) (0.004)
Strawberry 0.423 0.405
(0.008) (0.007)
Other Flavour 0.488 0.478
(0.012) (0.012)
Function:
None Base
Calcium + 0.489 -- 0.431
(0.004) (0.004)
DHA + 0.331 0.320
(0.005) (0.005)
Lactose-Free 1.089 1.048
(0.004) (0.004)
Omega-3 + 0.409 0.376
(0.004) (0.004)
Organic 0.985 1.007
(0.003) (0.003)
Pre/Probiotic 0.320 0.309
(0.007) (0.007)
Reduced-Sugar 0.150 0.190
(0.007) (0.007)
Product Labels
Brand:
National Base
Local_Region -0.200 0.042 -0.278
(0.003) (0.003) (0.005)
Local_NoRegion -0.032 0.023 -0.038
(0.003) (0.002) (0.005)
Private -0.428 N/A -0.428
(0.004) (0.004)
Brand Base:
Québec Base
Ontario -0.217 0.003 -0.384
(0.003) (0.001) (0.005)
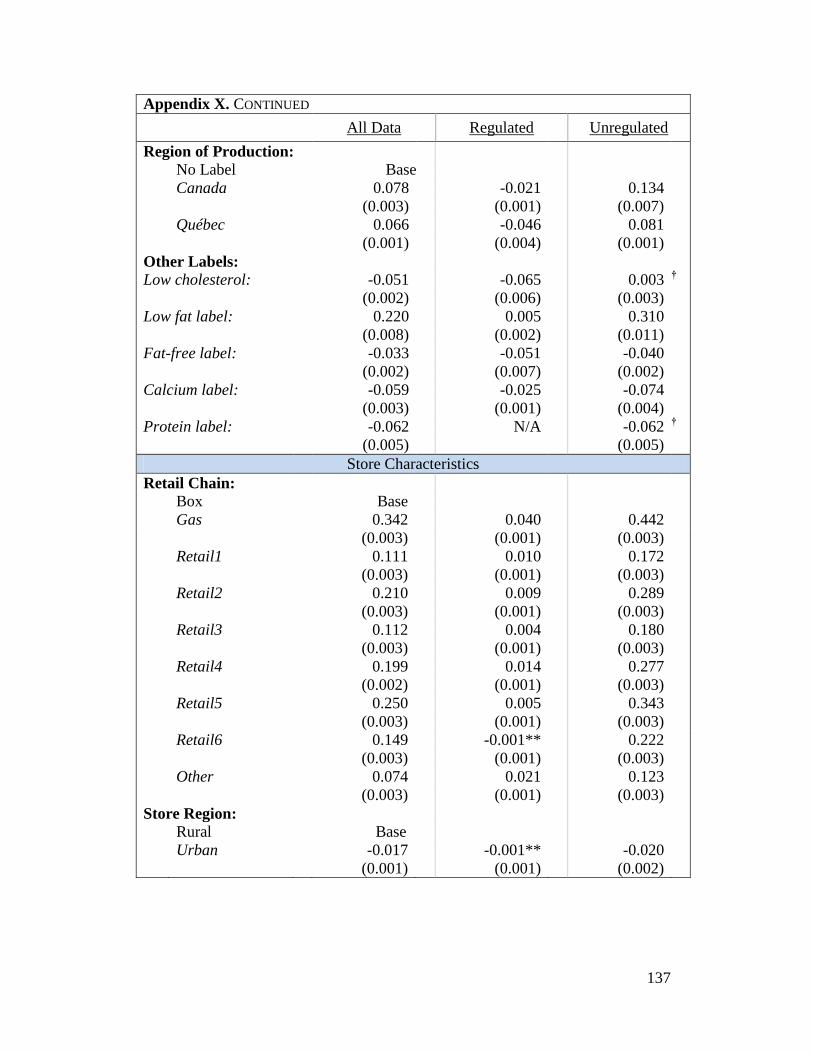
137
Appendix X. CONTINUED
All Data Regulated Unregulated
Region of Production:
No Label Base
Canada 0.078 -0.021 0.134
(0.003) (0.001) (0.007)
Québec 0.066 -0.046 0.081
(0.001) (0.004) (0.001)
Other Labels:
Low cholesterol: -0.051 -0.065 0.003 †
(0.002) (0.006) (0.003)
Low fat label: 0.220 0.005 0.310
(0.008) (0.002) (0.011)
Fat-free label: -0.033 -0.051 -0.040
(0.002) (0.007) (0.002)
Calcium label: -0.059 -0.025 -0.074
(0.003) (0.001) (0.004)
Protein label: -0.062 N/A -0.062 †
(0.005) (0.005)
Store Characteristics
Retail Chain:
Box Base
Gas 0.342 0.040 0.442
(0.003) (0.001) (0.003)
Retail1 0.111 0.010 0.172
(0.003) (0.001) (0.003)
Retail2 0.210 0.009 0.289
(0.003) (0.001) (0.003)
Retail3 0.112 0.004 0.180
(0.003) (0.001) (0.003)
Retail4 0.199 0.014 0.277
(0.002) (0.001) (0.003)
Retail5 0.250 0.005 0.343
(0.003) (0.001) (0.003)
Retail6 0.149 -0.001** 0.222
(0.003) (0.001) (0.003)
Other 0.074 0.021 0.123
(0.003) (0.001) (0.003)
Store Region:
Rural Base
Urban -0.017 -0.001** -0.020
(0.001) (0.001) (0.002)

138
Appendix X. CONTINUED
All Data Regulated Unregulated
Regional Characteristics
Region:
Region I Base
Region II 0.021 0.046 0.016
(0.004) (0.001) (0.004)
Brand Base*Region:
Gatineau*Ontario Brand: 0.131 -0.008 0.222
(0.005) (0.001) (0.009)
R2: 0.812 0.768 0.785
No. of Observations: 706208 128184 578024 Notes: † Not statistically significant the 0.10 level; * Statistically significant at the 0.10 level; **
Statistically significant at the 0.05 level; All other variables are statistically significant at the 0.01
level. White‘s heteroskedastic-consistent standard errors reported.