A Hardware-Aware Debugger for the OpenGL Shading …€¦ · A Hardware-Aware Debugger for the...
24
A Hardware-Aware Debugger for the OpenGL Shading Language A Hardware-Aware Debugger for the OpenGL Shading Language Magnus Strengert, Thomas Klein, Thomas Ertl Institute for Visualization and Interactive Systems, University of Stuttgart
Transcript of A Hardware-Aware Debugger for the OpenGL Shading …€¦ · A Hardware-Aware Debugger for the...
A Hardware-Aware Debugger for the OpenGL Shading Language
A Hardware-Aware Debugger for the OpenGL Shading Language
Magnus Strengert, Thomas Klein, Thomas Ertl
Institute for Visualization and Interactive Systems, University of Stuttgart
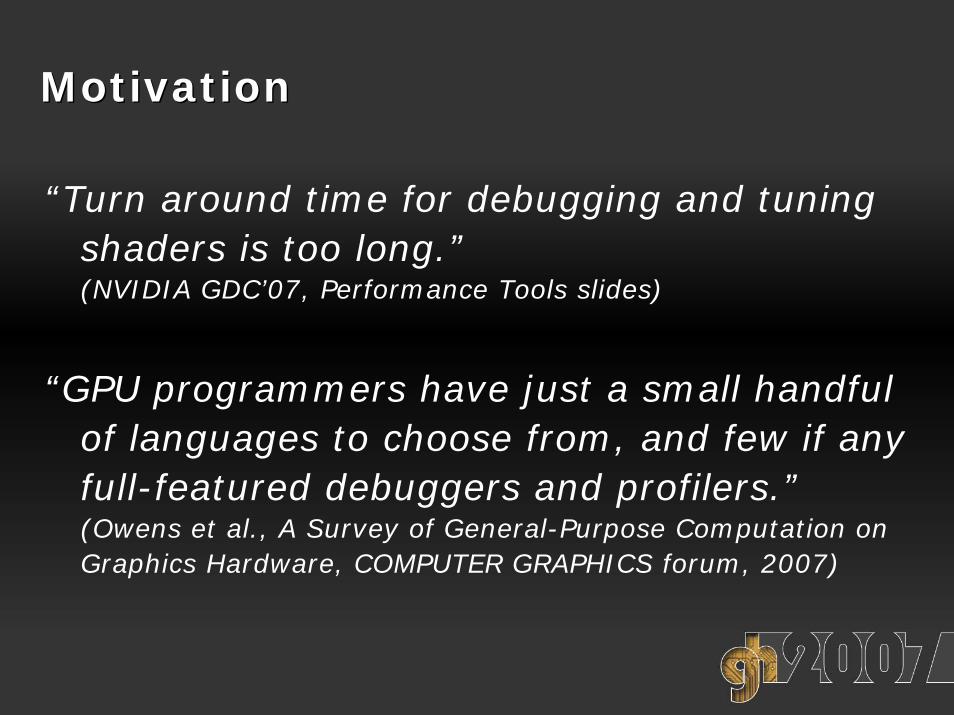
MotivationMotivation
“Turn around time for debugging and tuning shaders is too long.”(NVIDIA GDC’07, Performance Tools slides)
“GPU programmers have just a small handful of languages to choose from, and few if any full-featured debuggers and profilers.”(Owens et al., A Survey of General-Purpose Computation on Graphics Hardware, COMPUTER GRAPHICS forum, 2007)
MotivationMotivation
Limited debug interface to GPUs
• Performance counters
• No register content, no single stepping
Shaders tend to become very long, complex
• Printf debugging increasingly difficult
• How to printf Vertex, Geometry shaders?
Related Work:Related Work:
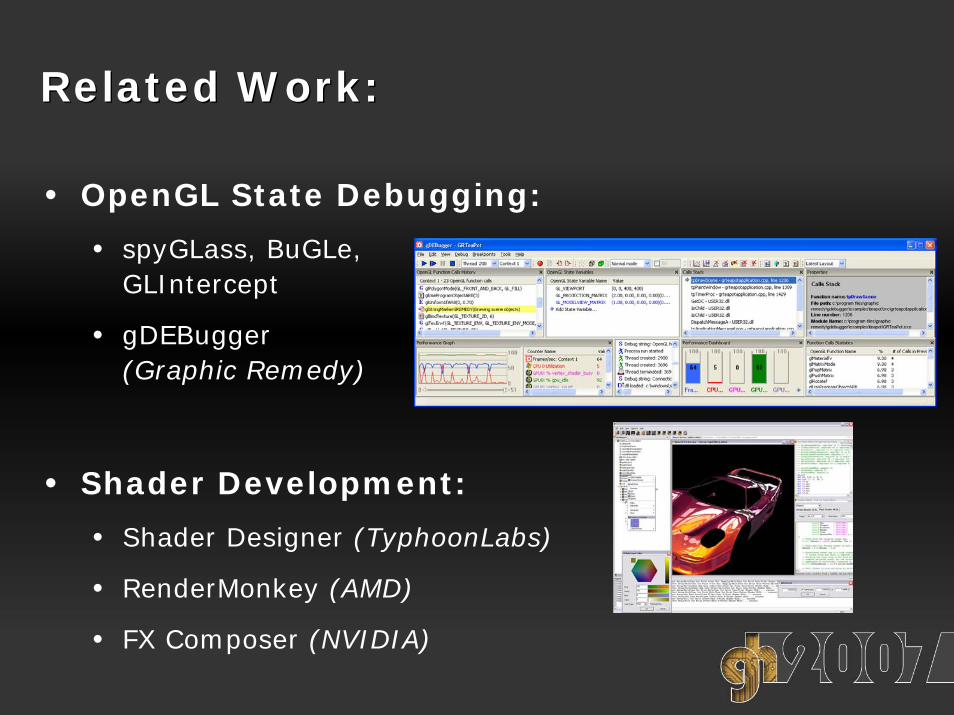
• OpenGL State Debugging:
• spyGLass, BuGLe,GLIntercept
• gDEBugger(Graphic Remedy)
• Shader Development:
• Shader Designer (TyphoonLabs)
• RenderMonkey (AMD)
• FX Composer (NVIDIA)
Related Work: Shader DebuggingRelated Work: Shader Debugging
• Shadesmith (Purcell et al., 2003)
• ARB fragment programs, interactive deepening
• A Relational Debugging Engine for the Graphics Pipeline (Duca et al., Siggraph 2005)
• CG vertex and fragment programs
• GQL: Graphical Query Language
• Never publicly available
• Software Rasterization:
• Microsoft PIX: HLSL Shader Debugger
• Mesa 7.0: GLSL 1.2 Software Emulation
GoalGoal
GPU-Debugging as easy as CPU-Debugging
• Application transparent
• OpenGL call interception (Dll-Hooking/Pre-Loading)
• No software emulation, real hardware values
• Shader Instrumentation
• Support for Vertex, Geometry, and Fragment shaders
• Readback Vertex and Fragment data
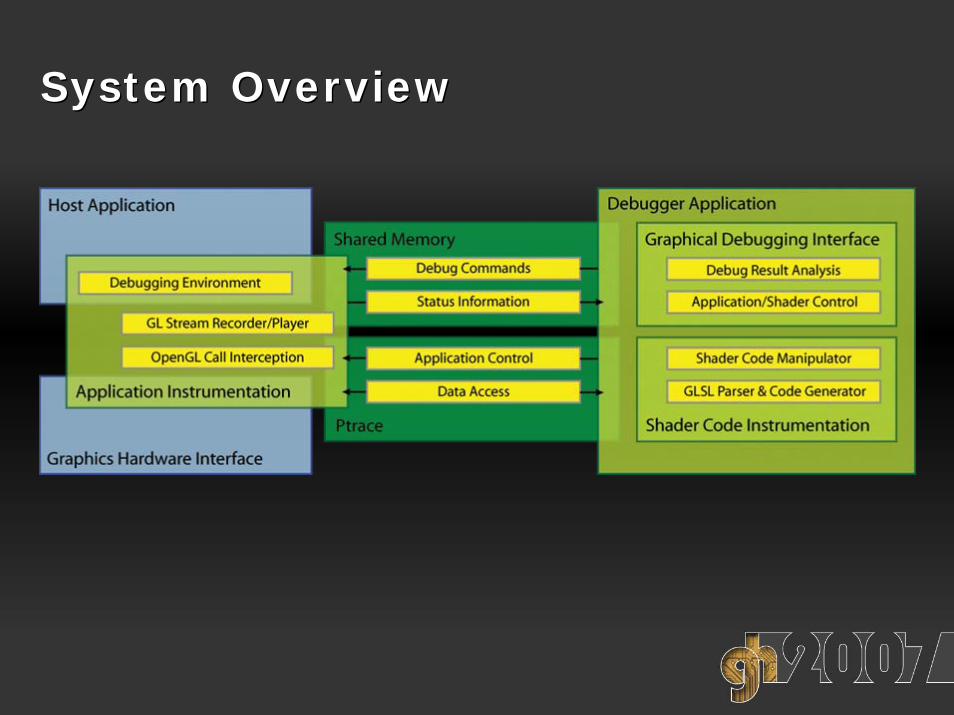
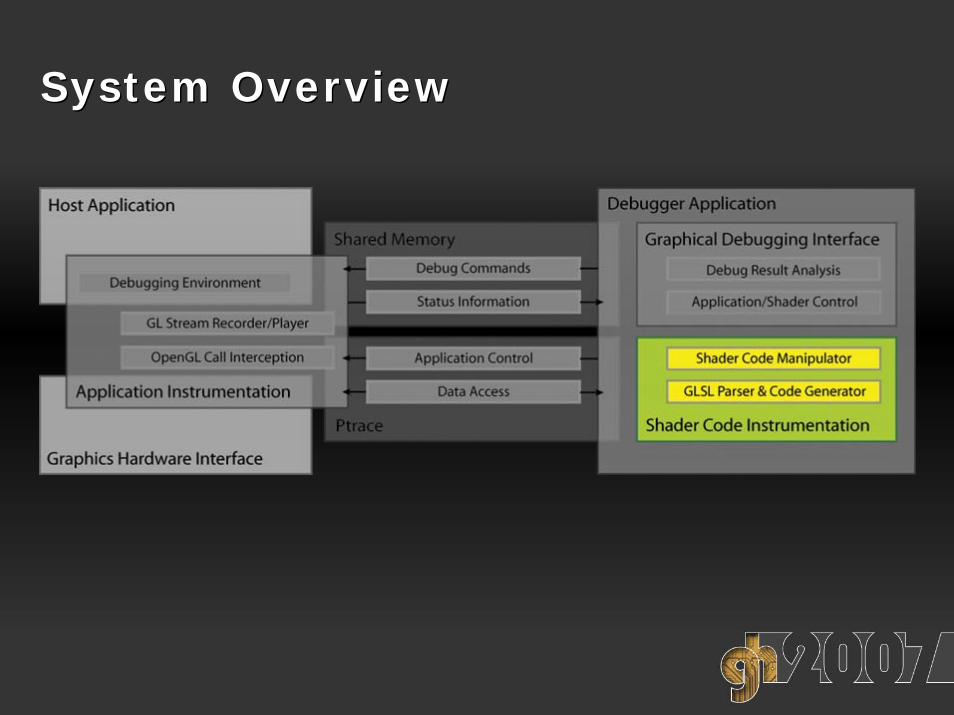
System OverviewSystem Overview
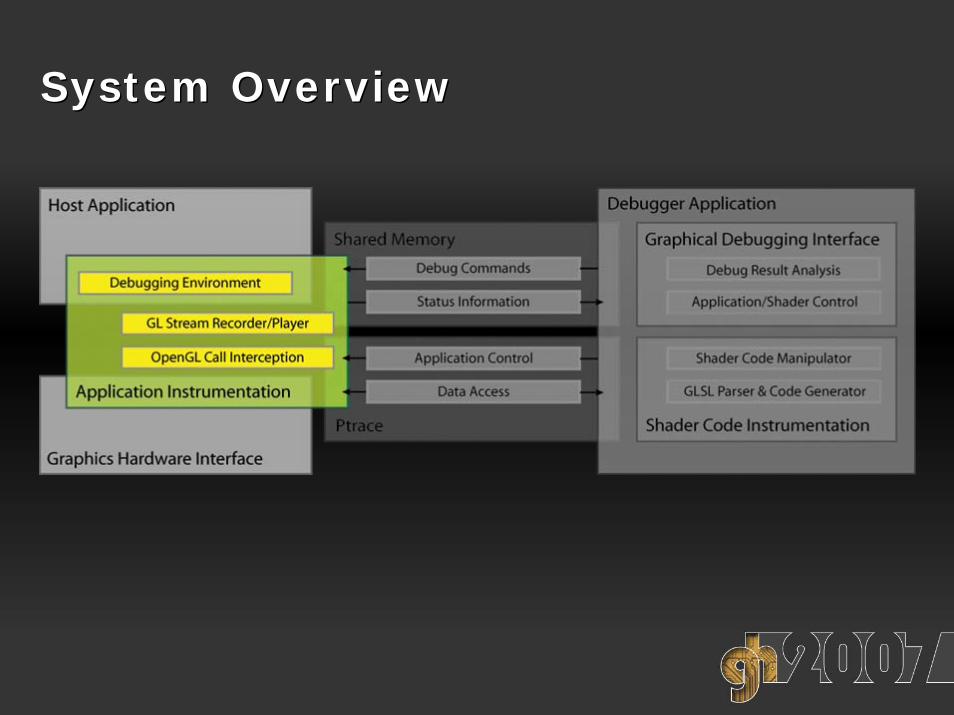
System OverviewSystem Overview
Application InstrumentationApplication Instrumentation
• Control execution of debugged application
• Execute, Run, Interrupt
• Single stepping through OpenGL calls
• Edit OpenGL function call parameters
• Debug shader invocation of interest
• Retrieve/Inject shader code
• Provide contained environment for debugging
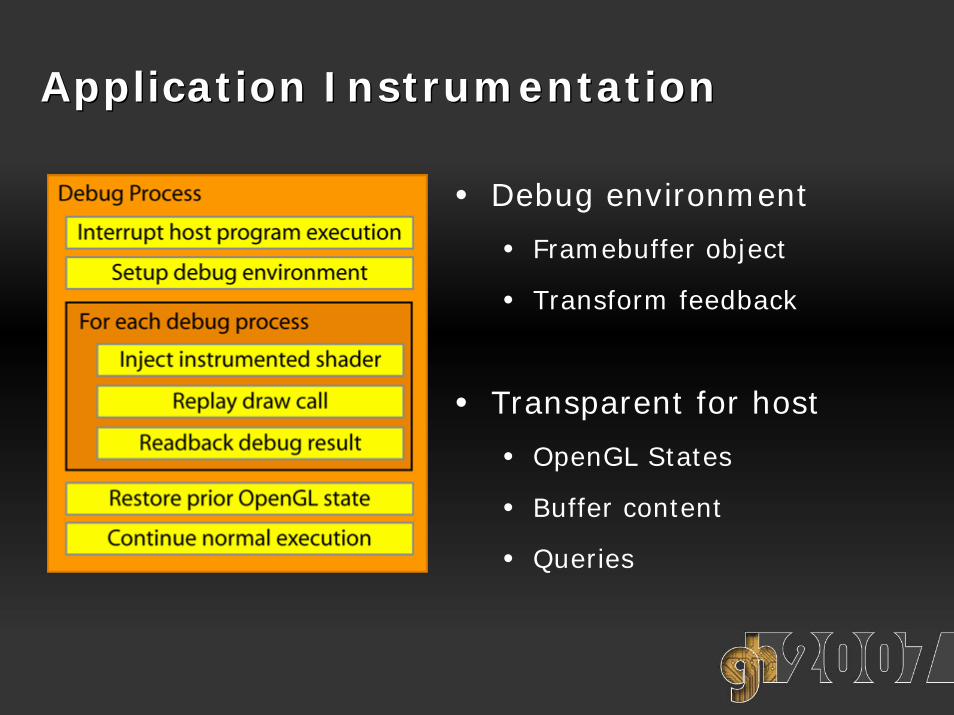
Application InstrumentationApplication Instrumentation
• Debug environment
• Framebuffer object
• Transform feedback
• Transparent for host
• OpenGL States
• Buffer content
• Queries

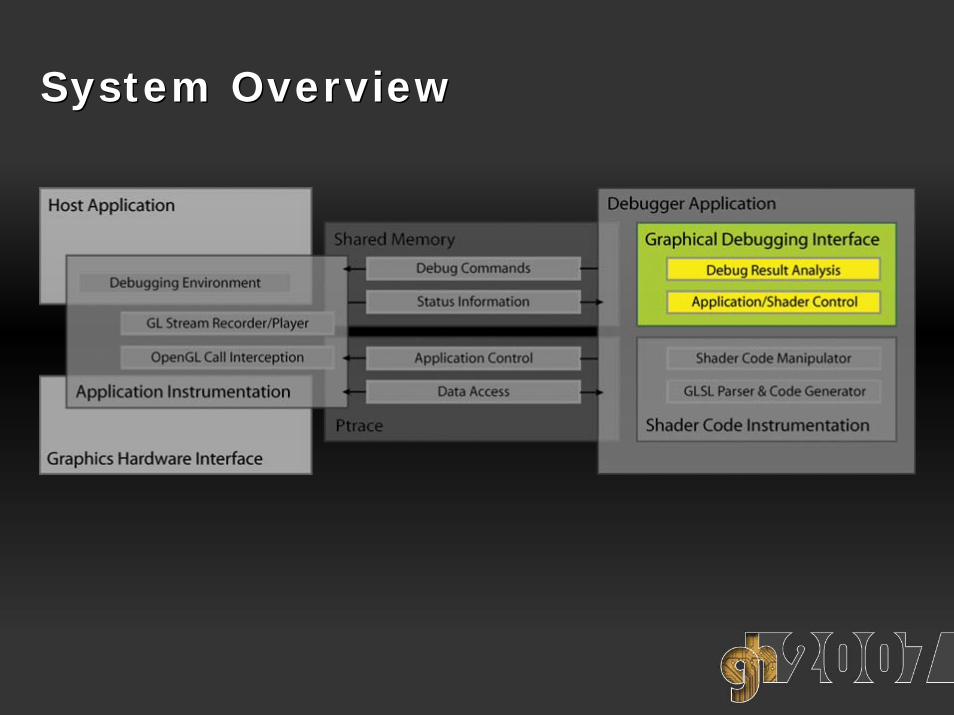
System OverviewSystem Overview

System OverviewSystem Overview
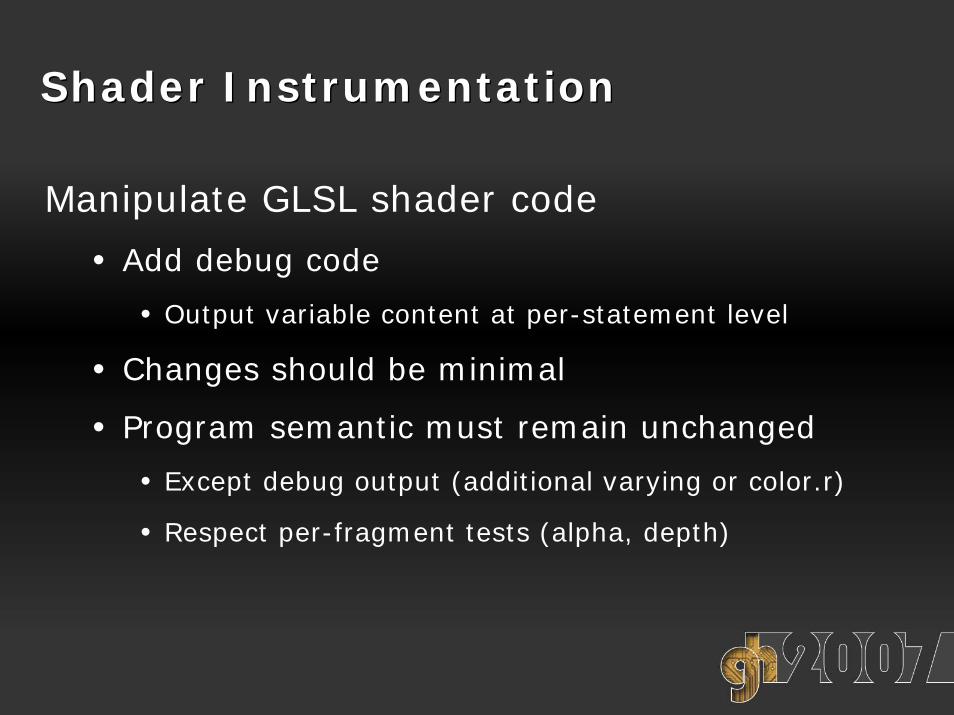
Shader InstrumentationShader Instrumentation
Manipulate GLSL shader code
• Add debug code
• Output variable content at per-statement level
• Changes should be minimal
• Program semantic must remain unchanged
• Except debug output (additional varying or color.r)
• Respect per-fragment tests (alpha, depth)
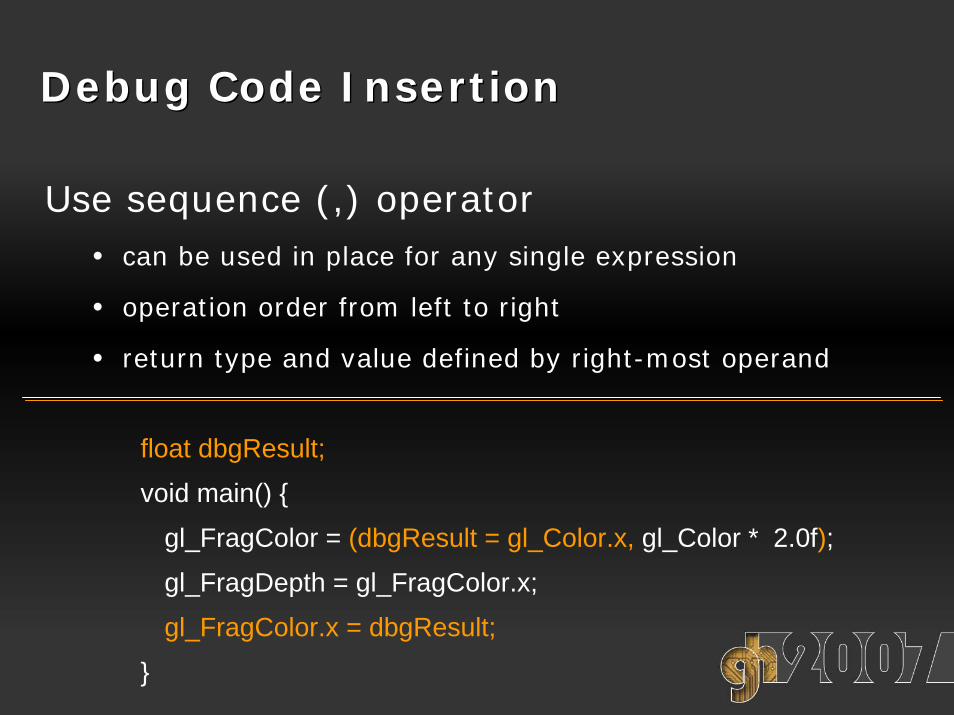
Debug Code InsertionDebug Code Insertion
Use sequence (,) operator• can be used in place for any single expression
• operation order from left to right
• return type and value defined by right-most operand
float dbgResult;
void main() {
gl_FragColor = (dbgResult = gl_Color.x, gl_Color * 2.0f);
gl_FragDepth = gl_FragColor.x;
gl_FragColor.x = dbgResult;
}
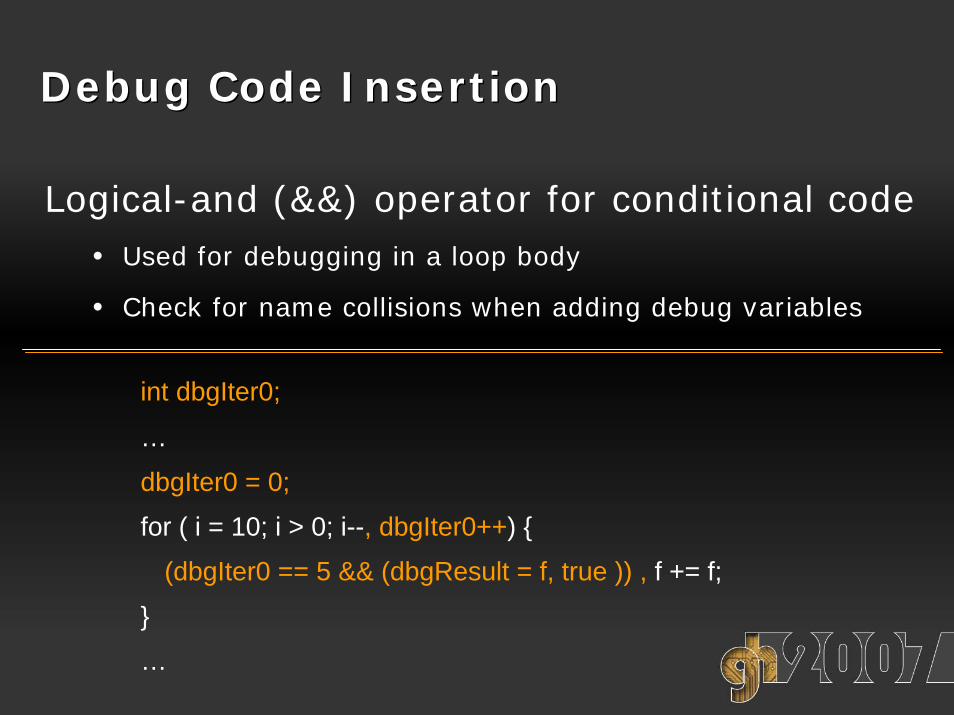
Debug Code InsertionDebug Code Insertion
Logical-and (&&) operator for conditional code• Used for debugging in a loop body
• Check for name collisions when adding debug variables
int dbgIter0;
…
dbgIter0 = 0;
for ( i = 10; i > 0; i--, dbgIter0++) {
(dbgIter0 == 5 && (dbgResult = f, true )) , f += f;
}
…
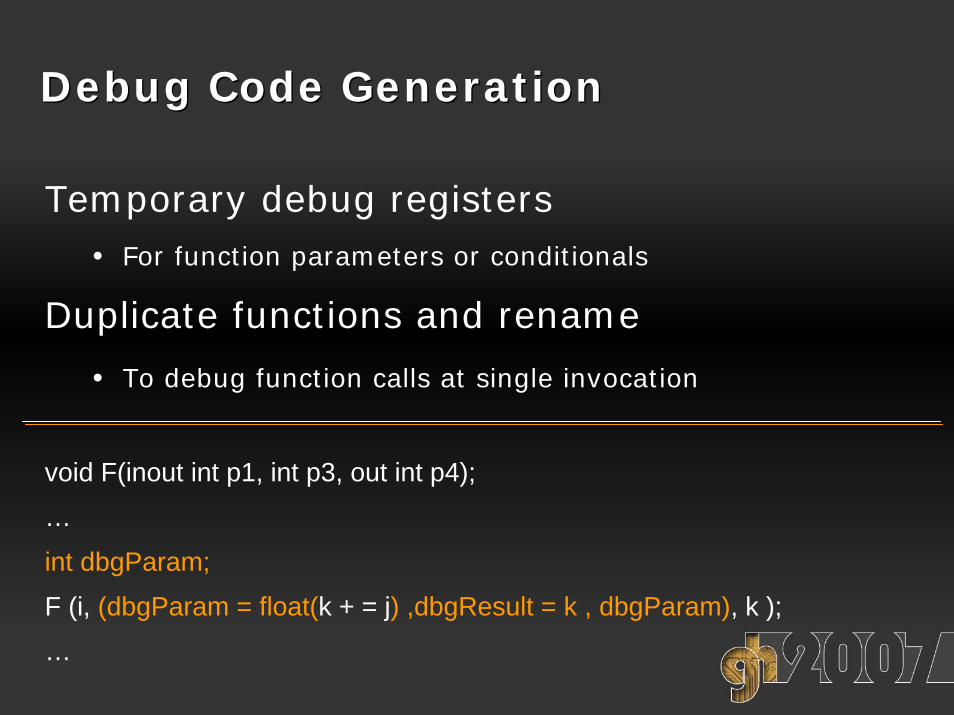
Debug Code GenerationDebug Code Generation
Temporary debug registers• For function parameters or conditionals
Duplicate functions and rename
• To debug function calls at single invocation
void F(inout int p1, int p3, out int p4);
…
int dbgParam;
F (i, (dbgParam = float(k + = j) ,dbgResult = k , dbgParam), k );
…
RealizationRealization
Built intermediate shader representation
• GLSL compiler build upon 3DLabs GLSL Compiler Frontend
• Added support for GLSL 1.20
• Includes extension EXT_gpu_shader4
• Debug Code Generator Backend
System OverviewSystem Overview
System OverviewSystem Overview
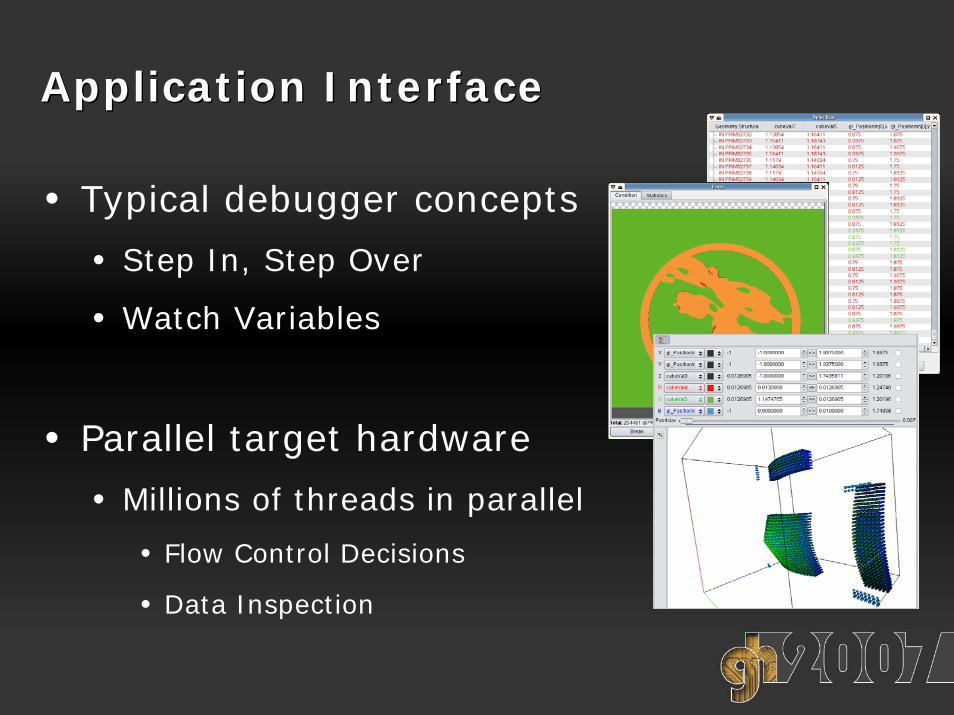
Application InterfaceApplication Interface
• Typical debugger concepts
• Step In, Step Over
• Watch Variables
• Parallel target hardware
• Millions of threads in parallel
• Flow Control Decisions
• Data Inspection
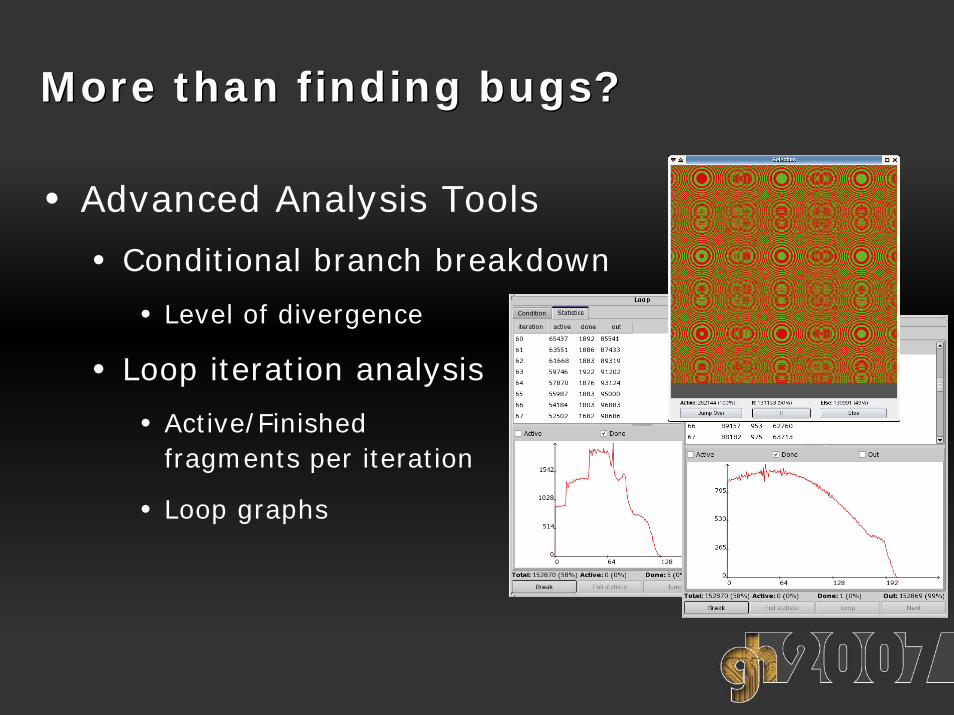
More than finding bugs?More than finding bugs?
• Advanced Analysis Tools
• Conditional branch breakdown
• Level of divergence
• Loop iteration analysis
• Active/Finished fragments per iteration
• Loop graphs
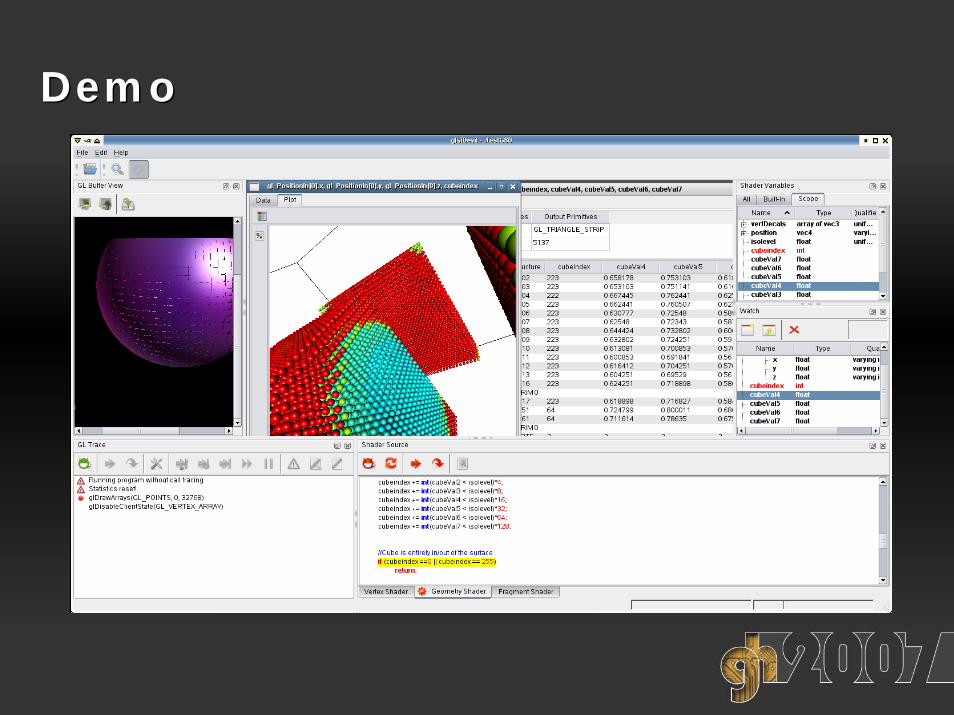
DemoDemo
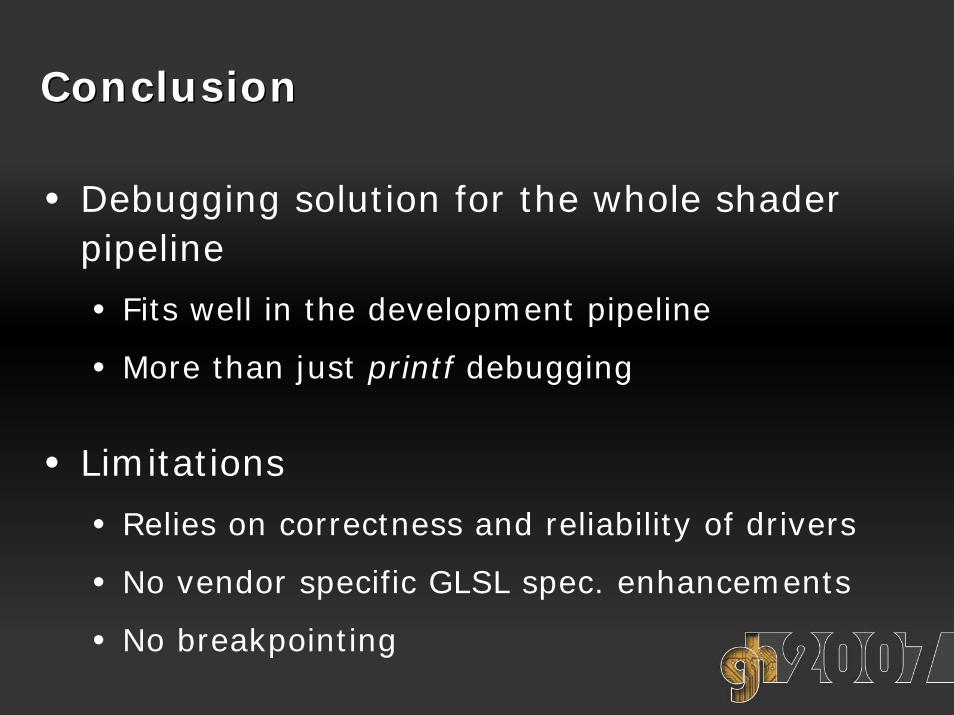
ConclusionConclusion
• Debugging solution for the whole shaderpipeline
• Fits well in the development pipeline
• More than just printf debugging
• Limitations
• Relies on correctness and reliability of drivers
• No vendor specific GLSL spec. enhancements
• No breakpointing

Project webpage and download:
http://www.vis.uni-stuttgart.de/glsldevil
Thank you!Thank you!


![Shading in OpenGL · Polygonal Shading Light Source in OpenGL Material Properties in OpenGL Normal Vectors in OpenGL Approximating a Sphere [Angel 6.5-6.9] Polygonal Shading Light](https://static.fdocuments.us/doc/165x107/60b0a5eae15ec915e36c8c60/shading-in-opengl-polygonal-shading-light-source-in-opengl-material-properties-in.jpg)