![Emails...2020/04/24 · Emails: RODNEY CULLORS, DENEAL CLASS ACTION PETITION FOR WRIT OF HABEAS CORPUS-COMPLAINT FOR INJUNCTIVE & DECLARATORY RELIEF Dan Stormer, Esq. [S.B. #101967]](https://static.fdocuments.us/doc/165x107/5eaa4350213d2f6a4a21dff0/emails-20200424-emails-rodney-cullors-deneal-class-action-petition-for.jpg)
A hands-on practical tutorial on performing meta-analysis … · A hands-on practical tutorial on...
6
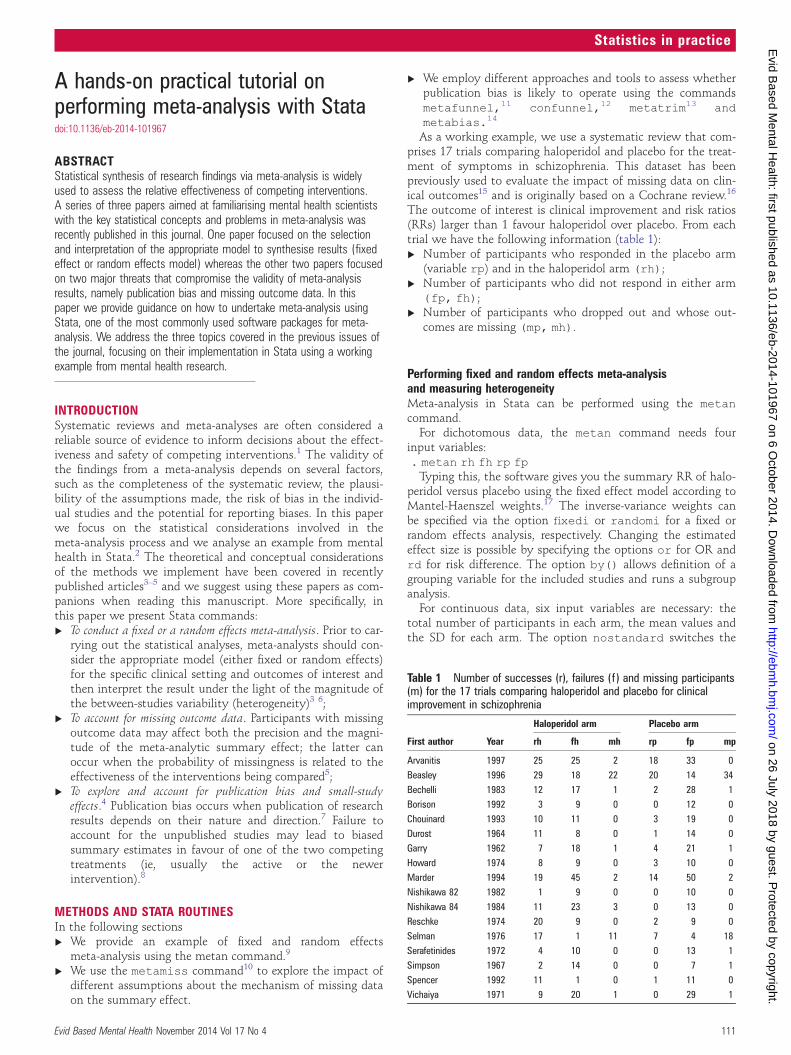
A hands-on practical tutorial on performing meta-analysis with Stata doi:10.1136/eb-2014-101967 ABSTRACT Statistical synthesis of research findings via meta-analysis is widely used to assess the relative effectiveness of competing interventions. A series of three papers aimed at familiarising mental health scientists with the key statistical concepts and problems in meta-analysis was recently published in this journal. One paper focused on the selection and interpretation of the appropriate model to synthesise results ( fixed effect or random effects model) whereas the other two papers focused on two major threats that compromise the validity of meta-analysis results, namely publication bias and missing outcome data. In this paper we provide guidance on how to undertake meta-analysis using Stata, one of the most commonly used software packages for meta- analysis. We address the three topics covered in the previous issues of the journal, focusing on their implementation in Stata using a working example from mental health research. INTRODUCTION Systematic reviews and meta-analyses are often considered a reliable source of evidence to inform decisions about the effect- iveness and safety of competing interventions. 1 The validity of the findings from a meta-analysis depends on several factors, such as the completeness of the systematic review, the plausi- bility of the assumptions made, the risk of bias in the individ- ual studies and the potential for reporting biases. In this paper we focus on the statistical considerations involved in the meta-analysis process and we analyse an example from mental health in Stata. 2 The theoretical and conceptual considerations of the methods we implement have been covered in recently published articles 3–5 and we suggest using these papers as com- panions when reading this manuscript. More specifically, in this paper we present Stata commands: ▸ To conduct a fixed or a random effects meta-analysis. Prior to car- rying out the statistical analyses, meta-analysts should con- sider the appropriate model (either fixed or random effects) for the specific clinical setting and outcomes of interest and then interpret the result under the light of the magnitude of the between-studies variability (heterogeneity) 36 ; ▸ To account for missing outcome data. Participants with missing outcome data may affect both the precision and the magni- tude of the meta-analytic summary effect; the latter can occur when the probability of missingness is related to the effectiveness of the interventions being compared 5 ; ▸ To explore and account for publication bias and small-study effects. 4 Publication bias occurs when publication of research results depends on their nature and direction. 7 Failure to account for the unpublished studies may lead to biased summary estimates in favour of one of the two competing treatments (ie, usually the active or the newer intervention). 8 METHODS AND STATA ROUTINES In the following sections ▸ We provide an example of fixed and random effects meta-analysis using the metan command. 9 ▸ We use the metamiss command 10 to explore the impact of different assumptions about the mechanism of missing data on the summary effect. ▸ We employ different approaches and tools to assess whether publication bias is likely to operate using the commands metafunnel, 11 confunnel, 12 metatrim 13 and metabias. 14 As a working example, we use a systematic review that com- prises 17 trials comparing haloperidol and placebo for the treat- ment of symptoms in schizophrenia. This dataset has been previously used to evaluate the impact of missing data on clin- ical outcomes 15 and is originally based on a Cochrane review. 16 The outcome of interest is clinical improvement and risk ratios (RRs) larger than 1 favour haloperidol over placebo. From each trial we have the following information (table 1): ▸ Number of participants who responded in the placebo arm (variable rp) and in the haloperidol arm (rh); ▸ Number of participants who did not respond in either arm (fp, fh); ▸ Number of participants who dropped out and whose out- comes are missing (mp, mh). Performing fixed and random effects meta-analysis and measuring heterogeneity Meta-analysis in Stata can be performed using the metan command. For dichotomous data, the metan command needs four input variables: . metan rh fh rp fp Typing this, the software gives you the summary RR of halo- peridol versus placebo using the fixed effect model according to Mantel-Haenszel weights. 17 The inverse-variance weights can be specified via the option fixedi or randomi for a fixed or random effects analysis, respectively. Changing the estimated effect size is possible by specifying the options or for OR and rd for risk difference. The option by() allows definition of a grouping variable for the included studies and runs a subgroup analysis. For continuous data, six input variables are necessary: the total number of participants in each arm, the mean values and the SD for each arm. The option nostandard switches the Table 1 Number of successes (r), failures (f) and missing participants (m) for the 17 trials comparing haloperidol and placebo for clinical improvement in schizophrenia First author Year Haloperidol arm Placebo arm rh fh mh rp fp mp Arvanitis 1997 25 25 2 18 33 0 Beasley 1996 29 18 22 20 14 34 Bechelli 1983 12 17 1 2 28 1 Borison 1992 3 9 0 0 12 0 Chouinard 1993 10 11 0 3 19 0 Durost 1964 11 8 0 1 14 0 Garry 1962 7 18 1 4 21 1 Howard 1974 8 9 0 3 10 0 Marder 1994 19 45 2 14 50 2 Nishikawa 82 1982 1 9 0 0 10 0 Nishikawa 84 1984 11 23 3 0 13 0 Reschke 1974 20 9 0 2 9 0 Selman 1976 17 1 11 7 4 18 Serafetinides 1972 4 10 0 0 13 1 Simpson 1967 2 14 0 0 7 1 Spencer 1992 11 1 0 1 11 0 Vichaiya 1971 9 20 1 0 29 1 Evid Based Mental Health November 2014 Vol 17 No 4 111 Statistics in practice on 26 July 2018 by guest. Protected by copyright. http://ebmh.bmj.com/ Evid Based Mental Health: first published as 10.1136/eb-2014-101967 on 6 October 2014. Downloaded from
Transcript of A hands-on practical tutorial on performing meta-analysis … · A hands-on practical tutorial on...
A hands-on practical tutorial onperforming meta-analysis with Statadoi:10.1136/eb-2014-101967
ABSTRACTStatistical synthesis of research findings via meta-analysis is widelyused to assess the relative effectiveness of competing interventions.A series of three papers aimed at familiarising mental health scientistswith the key statistical concepts and problems in meta-analysis wasrecently published in this journal. One paper focused on the selectionand interpretation of the appropriate model to synthesise results (fixedeffect or random effects model) whereas the other two papers focusedon two major threats that compromise the validity of meta-analysisresults, namely publication bias and missing outcome data. In thispaper we provide guidance on how to undertake meta-analysis usingStata, one of the most commonly used software packages for meta-analysis. We address the three topics covered in the previous issues ofthe journal, focusing on their implementation in Stata using a workingexample from mental health research.
INTRODUCTIONSystematic reviews and meta-analyses are often considered areliable source of evidence to inform decisions about the effect-iveness and safety of competing interventions.1 The validity ofthe findings from a meta-analysis depends on several factors,such as the completeness of the systematic review, the plausi-bility of the assumptions made, the risk of bias in the individ-ual studies and the potential for reporting biases. In this paperwe focus on the statistical considerations involved in themeta-analysis process and we analyse an example from mentalhealth in Stata.2 The theoretical and conceptual considerationsof the methods we implement have been covered in recentlypublished articles3–5 and we suggest using these papers as com-panions when reading this manuscript. More specifically, inthis paper we present Stata commands:▸ To conduct a fixed or a random effects meta-analysis. Prior to car-
rying out the statistical analyses, meta-analysts should con-sider the appropriate model (either fixed or random effects)for the specific clinical setting and outcomes of interest andthen interpret the result under the light of the magnitude ofthe between-studies variability (heterogeneity)3 6;
▸ To account for missing outcome data. Participants with missingoutcome data may affect both the precision and the magni-tude of the meta-analytic summary effect; the latter canoccur when the probability of missingness is related to theeffectiveness of the interventions being compared5;
▸ To explore and account for publication bias and small-studyeffects.4 Publication bias occurs when publication of researchresults depends on their nature and direction.7 Failure toaccount for the unpublished studies may lead to biasedsummary estimates in favour of one of the two competingtreatments (ie, usually the active or the newerintervention).8
METHODS AND STATA ROUTINESIn the following sections▸ We provide an example of fixed and random effects
meta-analysis using the metan command.9
▸ We use the metamiss command10 to explore the impact ofdifferent assumptions about the mechanism of missing dataon the summary effect.
▸ We employ different approaches and tools to assess whetherpublication bias is likely to operate using the commandsmetafunnel,11 confunnel,12 metatrim13 andmetabias.14
As a working example, we use a systematic review that com-prises 17 trials comparing haloperidol and placebo for the treat-ment of symptoms in schizophrenia. This dataset has beenpreviously used to evaluate the impact of missing data on clin-ical outcomes15 and is originally based on a Cochrane review.16
The outcome of interest is clinical improvement and risk ratios(RRs) larger than 1 favour haloperidol over placebo. From eachtrial we have the following information (table 1):▸ Number of participants who responded in the placebo arm
(variable rp) and in the haloperidol arm (rh);▸ Number of participants who did not respond in either arm
(fp, fh);▸ Number of participants who dropped out and whose out-
comes are missing (mp, mh).
Performing fixed and random effects meta-analysisand measuring heterogeneityMeta-analysis in Stata can be performed using the metancommand.
For dichotomous data, the metan command needs fourinput variables:. metan rh fh rp fpTyping this, the software gives you the summary RR of halo-
peridol versus placebo using the fixed effect model according toMantel-Haenszel weights.17 The inverse-variance weights canbe specified via the option fixedi or randomi for a fixed orrandom effects analysis, respectively. Changing the estimatedeffect size is possible by specifying the options or for OR andrd for risk difference. The option by() allows definition of agrouping variable for the included studies and runs a subgroupanalysis.
For continuous data, six input variables are necessary: thetotal number of participants in each arm, the mean values andthe SD for each arm. The option nostandard switches the
Table 1 Number of successes (r), failures (f) and missing participants(m) for the 17 trials comparing haloperidol and placebo for clinicalimprovement in schizophrenia
First author Year
Haloperidol arm Placebo arm
rh fh mh rp fp mp
Arvanitis 1997 25 25 2 18 33 0Beasley 1996 29 18 22 20 14 34Bechelli 1983 12 17 1 2 28 1Borison 1992 3 9 0 0 12 0Chouinard 1993 10 11 0 3 19 0Durost 1964 11 8 0 1 14 0Garry 1962 7 18 1 4 21 1Howard 1974 8 9 0 3 10 0Marder 1994 19 45 2 14 50 2Nishikawa 82 1982 1 9 0 0 10 0Nishikawa 84 1984 11 23 3 0 13 0Reschke 1974 20 9 0 2 9 0Selman 1976 17 1 11 7 4 18Serafetinides 1972 4 10 0 0 13 1Simpson 1967 2 14 0 0 7 1Spencer 1992 11 1 0 1 11 0Vichaiya 1971 9 20 1 0 29 1
Evid Based Mental Health November 2014 Vol 17 No 4 111
Statistics in practice
on 26 July 2018 by guest. Protected by copyright.
http://ebmh.bm
j.com/
Evid B
ased Mental H
ealth: first published as 10.1136/eb-2014-101967 on 6 October 2014. D
ownloaded from
estimated effect measure from standardised mean difference tomean difference.
The command gives information on the presence and magni-tude of statistical heterogeneity via the Q-test, the I2 measureand the estimate of the heterogeneity variance τ2 (using the‘method of moments estimator ’), which are provided in theoutput results. Although the estimated I2 and τ2 are routinelyreported as fixed values, they are not free of uncertainty aroundthe mean estimate. The CI for the I2 measure can be derivedusing the command heterogi, which requires the input ofthe Q-statistic of the meta-analysis and the correspondingdegrees of freedom (df, the number of studies minus one):. heterogi Q df(Q)
To date the metan command does not provide a CI for themagnitude of heterogeneity (τ2). However, it allows assessingthe impact of heterogeneity on the summary effect via the pre-dictive interval, which is the interval within which the effectof a future study is expected to lie.18 The predictive intervalexpresses the additional uncertainty induced in the estimates offuture studies due to the heterogeneity and can be estimated byadding the rfdist option in metan (under the random effectsmodel).
Many additional options are available (eg, options thathandle the appearance of the forest plot), which can be foundat the help file of the command (by typing ‘help metan’).
Exploring the impact of missing outcome dataStata has a readily available command called metamiss thatenables incorporation of different assumptions for the mechan-ism of missing outcome data in a meta-analysis. To date themetamiss command can be applied only for dichotomousdata but is currently being extended to account for continuousoutcomes.19 The syntax is similar to the metan command butrequires also the number of participants that dropped out fromeach arm (ie, six input variables are necessary) as well as thedesired method of imputing information for the missing data:. metamiss rh fh mh rp fp mp, imputation_method
In general, we can assume the following scenarios:▸ An available case analysis (ACA), which ignores the missing
data (option aca) and justifies the missing at randomassumption;
▸ The best-case scenario, which imputes all missing participantsin the experimental group as successes and in the controlgroup as failures (option icab);
▸ The worst-case scenario, which is the opposite of the best-casescenario (option icaw)The two previous approaches are naïve imputation methods
since they do not account properly for the uncertainty in theimputed missing data. Methods that take into account theuncertainty in the imputed data include:▸ The Gamble-Hollis analysis,20 which inflates the uncertainty
of the studies using the results from the best-case andworst-case analyses (option gamblehollis);
▸ The informative missingness OR (IMOR) model,15 21 whichrelates within each study arm the results from observed andmissing participants (options imor () or logimor ())allowing for uncertainty in the assumed association (sdlo-gimor ()).Note that the metamiss command always assumes that the
outcome is beneficial; hence for a harmful outcome (eg, adverseevents) the options icab and icaw will give the worst-caseand best-case scenario, respectively. If it is not possible toassume that missing data are missing at random, the IMORmodel is the most appropriate method because it takes the
uncertainty of imputed data into account.5 This model uses aparameter that relates the odds of the outcome in the missingdata to the odds of the outcome in the observed data. If thisparameter cannot be informed by expert opinion, it is prudentto conduct a sensitivity analysis assuming various values (eg, ifwe set the odds of the outcome in the missing data to be twiceas much as the odds in the observed data for treatment as wellas control groups, we type metamiss rh fh mh rp fp mp,imor (2)).
Assessing the presence of small study effects and the riskof publication biasThe available approaches for assessing the risk of publicationbias in a meta-analysis can be broadly classified into two cat-egories: (1) methods based on associating effect sizes to theirprecision and (2) selection models. We focus on the first groupof methods, which have been implemented in Stata via thecommands metafunnel, confunnel, metatrim andmetabias. However, researchers should always remember thatthis approach gives information about the presence of smallstudy effects, which might or might not be associated withgenuine publication bias.4
The command metafunnel draws the standard funnelplot22 and requires two input variables. Let logRR andselogRR be the two variables containing the observed effectsizes in studies and their SEs. The syntax of the metafunnelcommand would be:. metafunnel logRR selogRRThe option by () can be added to display the studies in sub-
groups (using different shapes and colors) according to a group-ing variable. A limitation of the standard funnel plot is that itdoes not explain whether the apparent asymmetry is due topublication bias or other reasons, such as genuine heterogeneitybetween small and large studies or differences in the baselinerisk of the participants.4 Contour-enhanced funnel plots can beused instead where shaded areas have been added in the graphto indicate whether missing studies lie in the areas of statisticalsignificance (eg, p value <0.05).23 If non-significant studieshave been published, it is unlikely that the asymmetry is dueto publication bias. The command confunnel can beemployed to produce this modified funnel plot using the samesyntax with the metafunnel command:. confunnel logRR selogRRThe measure of study precision plotted in the vertical axis
(eg, the variance instead of the SE) can be modified via theoption metric (), while the option extraplot () allowsthe incorporation of additional graphs (such as regression lines,alternative scatterplots, etc) using standard Stata commands.Alternatives to funnel plot have also been implemented in
Stata.22 More specifically, regression models that consider themagnitude of effect in a trial to be related to its precision arevery popular. The command metabias can fit four differentregression models; these are the Egger ’s test22 (option egger),the Harbord’s test24 (option harbord), the Peter ’s test25
(option peter) and the rank correlation test by Begg andMazumdar26 (option begg). For a generic approach where thestudy effect sizes (effect) are regressed on their standarderrors (se). metabias effect se, modelor for dichotomous data
. metabias rh fh rp fp, modelwhere model defines one of the four models described above.
Adding the option graph also gives a graphical depiction ofthe results. Note that the regression line estimated by the
112 Evid Based Mental Health November 2014 Vol 17 No 4
Statistics in practice
on 26 July 2018 by guest. Protected by copyright.
http://ebmh.bm
j.com/
Evid B
ased Mental H
ealth: first published as 10.1136/eb-2014-101967 on 6 October 2014. D
ownloaded from

Egger ’s test can also be added to the funnel plot by adding theoption egger in the metafunnel command.
The trim-and-fill method aims to estimate the summaryeffect as if the funnel plot were symmetrical assuming thatpublication bias is the only explanation of asymmetry. Themethod can be applied using the metatrim command withthe following syntax:. metatrim effect se
Specifying the option funnel in metatrim gives the estimatedfilled funnel plot that includes both published and unpublishedstudies.
RESULTSA Stata script that produces all results described below can befound online at http://missoptima.project.uoi.gr/index.php/our-research-projects.
Fixed and random effects meta-analysisWe fitted fixed effect as well as random effects models for illus-tration purposes. Using the metan command, we carried outACAs for both models and produced the forest plot of figure 1.It is generally misleading to focus on the diamond when inter-preting the results of a random effects meta-analysis; forexample, in the presence of excessive heterogeneity thediamond is often meaningless.
According to figure 1, both models suggested that haloperidolwas statistically significantly more effective than placebo in thetreatment of schizophrenia and, as expected, the randomeffects analysis produced wider CI. Despite this finding, theestimated predictive interval crossed the line of no effect imply-ing that in a future study placebo might appear to be moreeffective than the active drug. The study-specific estimatesseemed substantially heterogeneous (eg, the CIs of the follow-ing studies, Bechelli 1983 and Beasley 1996 did not overlap);hence the fixed effect assumption might not be plausible forthis dataset. This is supported by the Q-test, which suggestedthe presence of heterogeneity (p=0.038). The mean of the I2
measure, which measures the amount of heterogeneity across
studies, suggested the presence of low heterogeneity (41%).Using the heterogi command we estimated the CI for the I2,which ranged from 0% to 67% implying that heterogeneitywas potentially null to large, but not excessive.
The two models did not differ only in the level of uncer-tainty but also with respect to the magnitude of the summaryeffect. This is very common when there is a small-study effect(ie, there is an association between effect size and study size)because the random effects model assigns relatively largerweights to smaller studies.4 Indeed, in our example smallerstudies (ie, studies corresponding to smaller squares in figure 1)gave more favourable results for haloperidol, whereas largerstudies were closer to the null effect.
Impact of missing outcome dataWe first fitted a subgroup analysis (using metan with theby () option) to investigate whether studies with and withoutmissing data (in both arms) produced different results. Thisanalysis was based only on the observed data and thus, instudies with missing data, the sample size was less than thenumber of randomised participants. A common misconceptionabout subgroup analyses is that results differ between sub-groups when the summary effect for one subgroup is statistic-ally significant and not for the other. However, inference onsubgroup differences should be based on an interaction test (ie,the test for subgroup differences implemented also in RevMan—http://tech.cochrane.org/revman) that compares statisticallythe two subgroup means accounting for their uncertainty.Differences between subgroups can be also identified visuallyby looking at the overlap of the CIs in their summaryestimates.17
In figure 2, trials without missing data gave more favourableresults for haloperidol than trials with missing data. This dis-agreement was also statistically significant since p value for theoverall test for heterogeneity between subgroups (provided inthe output of metan under the fixed effect model) was equalto 0.001. Hence, it is likely that missing data in trials substan-tially affected the results; a possible explanation is that there
Figure 1 Forest plot showing theresults of fixed and random effectsmeta-analysis for the 17 trialscomparing haloperidol and placebo forclinical improvement in schizophrenia(outcome: response rate) (RR, riskratio).
Evid Based Mental Health November 2014 Vol 17 No 4 113
Statistics in practice
on 26 July 2018 by guest. Protected by copyright.
http://ebmh.bm
j.com/
Evid B
ased Mental H
ealth: first published as 10.1136/eb-2014-101967 on 6 October 2014. D
ownloaded from

was a high dropout rate in the placebo arm due to lack of effi-cacy, which is quite common in trials in psychiatry.
We further explored the impact of missing data by incorpor-ating in the analysis different assumptions about the mechan-ism of missingness. We presented the results from the randomeffects model (figure 3) and focused on the differences in thesummary effects across the different scenarios. Under all sixanalyses haloperidol appeared to work better than placebo forschizophrenia. Small differences existed in the point estimatesbetween the IMOR models and the Gable-Hollis analysis com-pared to the ACA. Unlike the rest of the methods these twoapproaches do not impute data and do not artificially inflatethe sample size. The IMOR model increased uncertaintywithin studies which, in turn, resulted in a slight reduction of
heterogeneity. The changes in the summary estimate were neg-ligible. Under the ACA analysis studies with large missing ratesfavoured placebo (figure 1). The IMOR models down-weightedthese studies and the mean summary estimate moved slightlytowards the direction of the active intervention.
Publication bias and small-study effectsDifferent summary estimates between fixed and random effectsmodels (figure 1) raised concerns that small-study effects pos-sibly operated in our example, questioning the correct interpret-ation of the overall effect. To explore this apparent associationbetween effect size and study size, we employed a series ofgraphical approaches and statistical tests (it is important to
Figure 2 Subgroup analysis of the17 trials comparing haloperidol andplacebo in schizophrenia (outcome:response rate). Studies have beenclassified according to the presence orabsence of missing outcome data inboth arms (RR, risk ratio).
Figure 3 Summary risk ratios (RRs)as estimated when the missing dataare ignored (available case), by naïveimputation methods (best-case andworst-case) and by methods thatproperly account for the uncertainty inmissing data (Gamble-Hollis andinformative missingness OR (IMOR)models). Both IMOR models assumethat the odds of the outcome in themissing data are equal to the odds inthe observed data (mean IMOR=1)and reflect the uncertainty of thisassumption by allowing for a non-zeroSD of the missing parameter.
114 Evid Based Mental Health November 2014 Vol 17 No 4
Statistics in practice
on 26 July 2018 by guest. Protected by copyright.
http://ebmh.bm
j.com/
Evid B
ased Mental H
ealth: first published as 10.1136/eb-2014-101967 on 6 October 2014. D
ownloaded from
note that all these methods have low power and at least 10studies are needed to draw conclusions).17
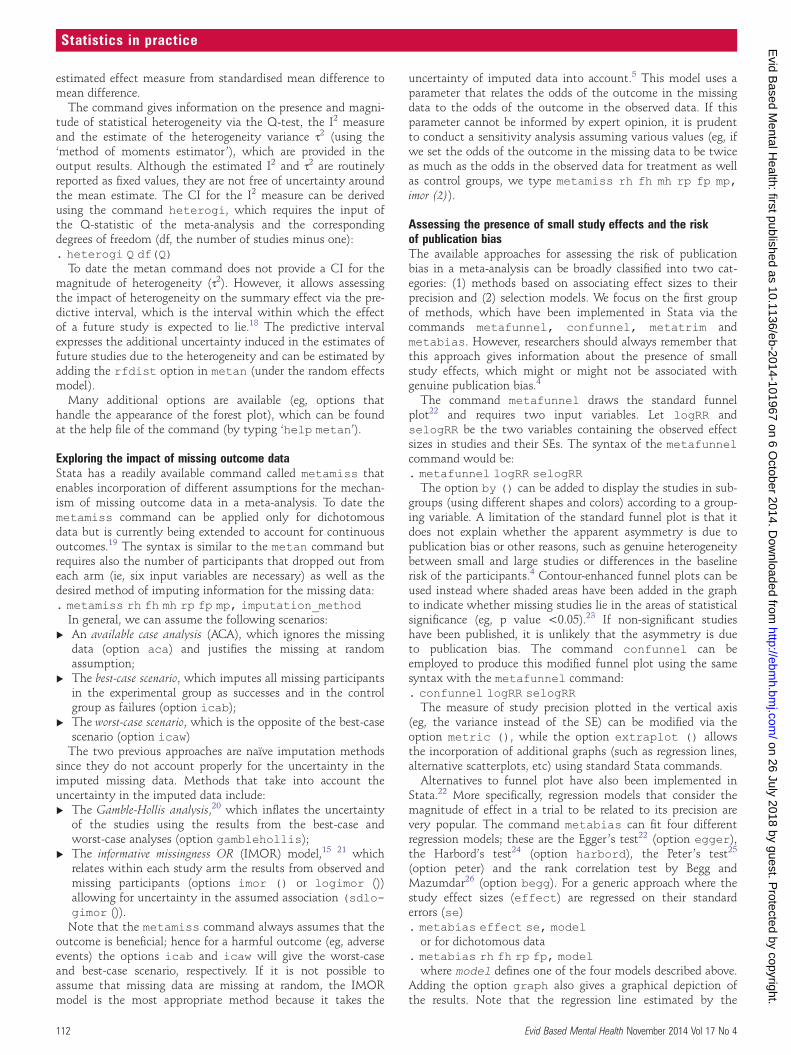
The funnel plot in figure 4 was rather asymmetric andshowed that smaller studies tended to give results emphasisingthe effectiveness of haloperidol. The contour-enhanced funnelplot (figure 5) helped us distinguish between publication biasand other causes of the asymmetry. It showed that smallstudies were found not only in the areas of statistical signifi-cance (shaded area) but also in areas of non-statistical signifi-cance (white area); hence asymmetry might have been causedby several factors and not solely by publication bias. To assessthe magnitude and statistical significance of the relationshipbetween observed effect sizes and the size of studies we ran theEgger ’s meta-regression model (table 2). The test suggestedthat smaller studies tended to give different results if comparedwith larger trials, as the CI of the intercept did not include thezero value.
We finally applied the trim-and-fill method, although theassumption that funnel plot asymmetry was solely caused bypublication bias probably did not hold for this dataset. Theaddition of the nine estimated unpublished studies slightlymoved the summary estimate of the fixed effect model closerto 0 (figure 6), while the random effects model (table 3)resulted in a non-significant summary estimate (p=0.083).
DISCUSSIONAlong with the rapid methodological development ofmeta-analysis, a variety of relevant software options have beenmade available enabling the application of different models andthe exploration of characteristics that may affect the results.Using a working example, in this paper we offered a brief tutor-ial to researchers and interested clinicians about the use ofStata in meta-analysis, highlighting common pitfalls in theinterpretation of results (more information about Stata can befound elsewhere).27 Our findings suggested that the presence ofimportant small-study effects as well as the missing outcomedata in some trials made the estimated summary effect not rep-resentative for the entire set of studies. Including in themeta-analysis only studies with data for all randomised partici-pants was not the recommended approach, since the bulk ofevidence came from trials with missing outcome data.
Clinical insight for the outcomes and treatments of interestis necessary to make reasonable assumptions for the mechan-ism of missing data and inform the choice of the appropriatestatistical model. The results from the three models thataccounted for the uncertainty in the imputed missing data(Gamble-Hollis and the two IMOR models) were similar andprobably are the most accurate estimates of the summary RR.
Figure 4 Funnel plot of the 17 trials comparing haloperidol andplacebo in schizophrenia (outcome: response rate). The vertical linecorresponds to the summary log(RR) as estimated from the fixed effectmodel (RR, risk ratio).
Figure 5 Contour-enhanced funnel plot of the 17 trials comparinghaloperidol and placebo for clinical improvement in schizophrenia. Thevertical line corresponds to the estimated summary log(RR). Theshaded areas correspond to levels of statistical significance defined bythe p value of a z-test for the logRR (RR, risk ratio).
Table 2 Results from the Egger’s meta-regression test assessing thepresence of small-study effects in the 17 trials comparing haloperidoland placebo for clinical improvement in schizophrenia
Parameter Estimate SE t Value p Value 95% CI
Slope (coefficient) −0.15 0.11 −1.34 0.20 −0.38 0.09Bias (intercept) 1.79 0.26 6.95 0.00 1.24 2.34Test of H0: no small-study effects, p value=0.000
Figure 6 Funnel plot including the 17 published haloperidol trials inschizophrenia (circles) and the unpublished studies (squares) asestimated from the trim-and-fill method. The solid line corresponds tothe adjusted for the impact of publication bias summary effect(logRR=0.27) and the dashed line to the summary effect that does notaccount for publication bias (logRR=0.45) (RR, risk ratio).
Evid Based Mental Health November 2014 Vol 17 No 4 115
Statistics in practice
on 26 July 2018 by guest. Protected by copyright.
http://ebmh.bm
j.com/
Evid B
ased Mental H
ealth: first published as 10.1136/eb-2014-101967 on 6 October 2014. D
ownloaded from

However, the fact small and large trials gave different resultsneeds further exploration. For example, if the size of the studieswas associated with differences in population characteristicswith respect to some effect modifiers, then there might not bea common RR applicable to all populations.
Anna Chaimani,1 Dimitris Mavridis,1,2 Georgia Salanti11Department of Hygiene and Epidemiology, University of Ioannina School of Medicine,Ioannina, Greece2Department of Primary Education, University of Ioannina, Ioannina, Greece
Correspondence to: Dr Anna Chaimani, [email protected]
Competing interests AC received funding from Greek national funds through theOperational Program “Education and Lifelong Learning” of the National StrategicReference Framework (NSRF)—Research Funding Program: ARISTEIA. Investing inknowledge society through the European Social Fund. DM and GS received fundingfrom the European Research Council (IMMA 260559).
REFERENCES1. Cipriani A, Furukawa TA. Advancing evidence-based practice to improve patient
care. Evid Based Ment Health 2014;17:1–2.2. StataCorp. Stata Statistical Software. College Station, TX: StataCorp LP, 2013.3. Nikolakopoulou A, Mavridis D, Salanti G. Demystifying fixed and random effects
meta-analysis. Evid Based Ment Health 2014;17:53–7.4. Mavridis D, Salanti G. Exploring and accounting for publication bias in
mental health: a brief overview of methods. Evid Based Ment Health2014;17:11–15.
5. Mavridis D, Chaimani A, Efthimiou O, et al. Addressing missing outcome data inmeta-analysis. Evid Based Ment Health 2014;17:85–9.
6. Borenstein M, Hedges LV, Higgins JPT, et al. A basic introduction to fixed-effectand random-effects models for meta-analysis. Res Synth Methods 2010;1:97–111.
7. Dickersin K. The existence of publication bias and risk factors for its occurrence.JAMA 1990;263:1385–9.
8. Turner EH, Matthews AM, Linardatos E, et al. Selective publication ofantidepressant trials and its influence on apparent efficacy. N Engl J Med2008;358:252–60.
9. Harris R, Bradburn M, Deeks J, et al. Metan: fixed-and random-effectsmeta-analysis. Stata J 2008;8:3.
10. White IR, Higgins JP. Meta-analysis with missing data. Stata J 2009;9:57.11. Sterne JA, Harbord RM. Funnel plots in meta-analysis. Stata J 2004;4:
127–41.12. Palmer TM, Peters JL, Sutton AJ, et al. Contour-enhanced funnel plots for
meta-analysis. Stata J 2008;8:242.13. Steichen TJ. Nonparametric trim and fill analysis of publication bias in
meta-analysis: erratum. Stata Tech Bull 2001;10. http://econpapers.repec.org/article/tsjstbull/y_3a2001_3av_3a10_3ai_3a58_3asbe39.1.htm (accessed 3 Sep 2014).
14. Harbord RM, Harris RJ, Sterne JAC. Updated tests for small-study effects inmeta-analyses. Stata J 2009;9:197–210.
15. Higgins JP, White IR, Wood AM. Imputation methods for missing outcome data inmeta-analysis of. Clin Trials 2008;5:225–39.
16. Joy CB, Adams CE, Lawrie SM. Haloperidol versus placebo for schizophrenia.Cochrane Database Syst Rev 2006;(4):CD003082.
17. Deeks JJ, Higgins JP, Altman DG. Analysing data and undertaking meta-analyses.In: Higgins JPT, Green S. eds. Cochrane handbook for systematic reviews ofinterventions. John Wiley & Sons, Ltd, 2008:243–96.
18. Riley RD, Higgins JPT, Deeks JJ. Interpretation of random effects meta-analyses.BMJ 2011;342:d549.
19. Mavridis D, White IR, Higgins JPT, et al. Addressing continuous missing outcomesin pairwise and network meta-analysis. 35th ISCB Annual Conference; Vienna,August 2014. http://www.mtm.uoi.gr/index.php/research-and-publications/11-rap-articles/22-talks
20. Gamble C, Hollis S. Uncertainty method improved on best-worst case analysis in abinary meta-analysis. J Clin Epidemiol 2005;58:579–88.
21. White IR, Higgins JPT, Wood AM. Allowing for uncertainty due to missing data inmeta-analysis—part 1: two-stage methods. Stat Med 2008;27:711–27.
22. Egger M, Davey Smith G, Schneider M, et al. Bias in meta-analysis detected by asimple, graphical test. BMJ 1997;315:629–34.
23. Peters JL, Sutton AJ, Jones DR, et al. Contour-enhanced meta-analysis funnelplots help distinguish publication bias from other causes of asymmetry. J ClinEpidemiol 2008;61:991–6.
24. Harbord RM, Egger M, Sterne JAC. A modified test for small-study effects inmeta-analyses of controlled trials with binary endpoints. Stat Med 2006;25:3443–57.
25. Peters JL, Sutton AJ, Jones DR, et al. Comparison of two methods to detectpublication bias in meta-analysis. JAMA 2006;295:676–80.
26. Begg CB, Mazumdar M. Operating characteristics of a rank correlation test forpublication bias. Biometrics 1994;50:1088–101.
27. Sterne J. ed. Meta-analysis in Stata: an updated collection from the Stata Journal.Stata Press, 2009. http://www.libreriasaulamedica.com/ficha.asp?id=69107(accessed 3 Sep 2014).
Table 3 Results from the trim-and-fill method for publication bias inthe 17 haloperidol trials for schizophrenia
Filled meta-analysis
ModelSummarylogRR 95% CI z Value p Value
Numberof studies
Fixed effect 0.274 0.084 0.465 2.825 0.005 26Randomeffects
0.331 −0.044 0.705 1.731 0.083 26
RR, risk ratio.
116 Evid Based Mental Health November 2014 Vol 17 No 4
Statistics in practice
on 26 July 2018 by guest. Protected by copyright.
http://ebmh.bm
j.com/
Evid B
ased Mental H
ealth: first published as 10.1136/eb-2014-101967 on 6 October 2014. D
ownloaded from


![1 Dan Stormer, Esq. [S.B. # 101967] HADSELL STORMER ... - Complaint for... · HADSELL STORMER & RENICK LLP Dan Stormer Josh Piovia-Scott Mohammad Tajsar ...](https://static.fdocuments.us/doc/165x107/5bf1ef0b09d3f2fb7d8c7e72/1-dan-stormer-esq-sb-101967-hadsell-stormer-complaint-for-hadsell.jpg)