Color Theory. Classic Color Wheel Primary Colors: Red Yellow Blue.
Upload
truongliemCategory
view
218download
2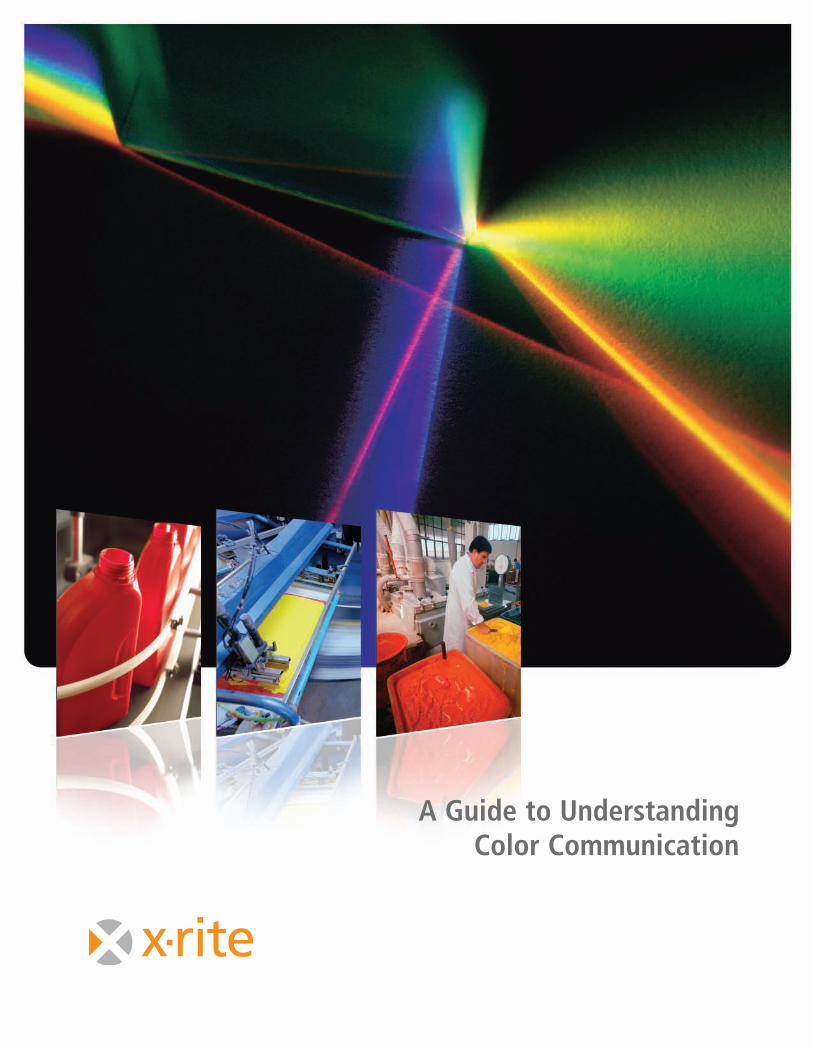
A Guide to UnderstandingColor Communication
1
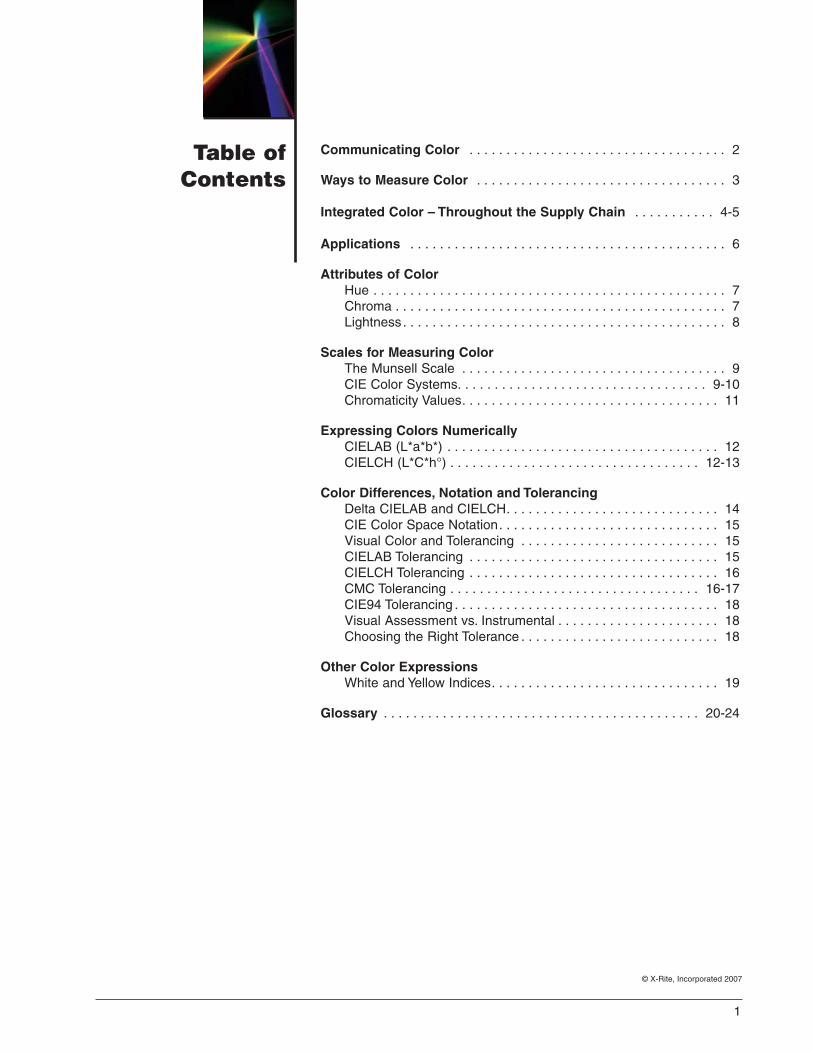
Communicating Color . . . . . . . . . . . . . . . . . . . . . . . . . . . . . . . . . . . 2
Ways to Measure Color . . . . . . . . . . . . . . . . . . . . . . . . . . . . . . . . . . 3
Integrated Color – Throughout the Supply Chain . . . . . . . . . . . 4-5
Applications . . . . . . . . . . . . . . . . . . . . . . . . . . . . . . . . . . . . . . . . . . . 6
Attributes of ColorHue . . . . . . . . . . . . . . . . . . . . . . . . . . . . . . . . . . . . . . . . . . . . . . . . 7Chroma . . . . . . . . . . . . . . . . . . . . . . . . . . . . . . . . . . . . . . . . . . . . . 7Lightness. . . . . . . . . . . . . . . . . . . . . . . . . . . . . . . . . . . . . . . . . . . . 8
Scales for Measuring ColorThe Munsell Scale . . . . . . . . . . . . . . . . . . . . . . . . . . . . . . . . . . . . 9CIE Color Systems. . . . . . . . . . . . . . . . . . . . . . . . . . . . . . . . . . 9-10Chromaticity Values. . . . . . . . . . . . . . . . . . . . . . . . . . . . . . . . . . . 11
Expressing Colors NumericallyCIELAB (L*a*b*) . . . . . . . . . . . . . . . . . . . . . . . . . . . . . . . . . . . . . 12CIELCH (L*C*h°) . . . . . . . . . . . . . . . . . . . . . . . . . . . . . . . . . . 12-13
Color Differences, Notation and TolerancingDelta CIELAB and CIELCH. . . . . . . . . . . . . . . . . . . . . . . . . . . . . 14CIE Color Space Notation. . . . . . . . . . . . . . . . . . . . . . . . . . . . . . 15Visual Color and Tolerancing . . . . . . . . . . . . . . . . . . . . . . . . . . . 15CIELAB Tolerancing . . . . . . . . . . . . . . . . . . . . . . . . . . . . . . . . . . 15CIELCH Tolerancing . . . . . . . . . . . . . . . . . . . . . . . . . . . . . . . . . . 16CMC Tolerancing . . . . . . . . . . . . . . . . . . . . . . . . . . . . . . . . . . 16-17CIE94 Tolerancing . . . . . . . . . . . . . . . . . . . . . . . . . . . . . . . . . . . . 18Visual Assessment vs. Instrumental . . . . . . . . . . . . . . . . . . . . . . 18Choosing the Right Tolerance . . . . . . . . . . . . . . . . . . . . . . . . . . . 18
Other Color ExpressionsWhite and Yellow Indices. . . . . . . . . . . . . . . . . . . . . . . . . . . . . . . 19
Glossary . . . . . . . . . . . . . . . . . . . . . . . . . . . . . . . . . . . . . . . . . . . 20-24
Table ofContents
© X-Rite, Incorporated 2007
2
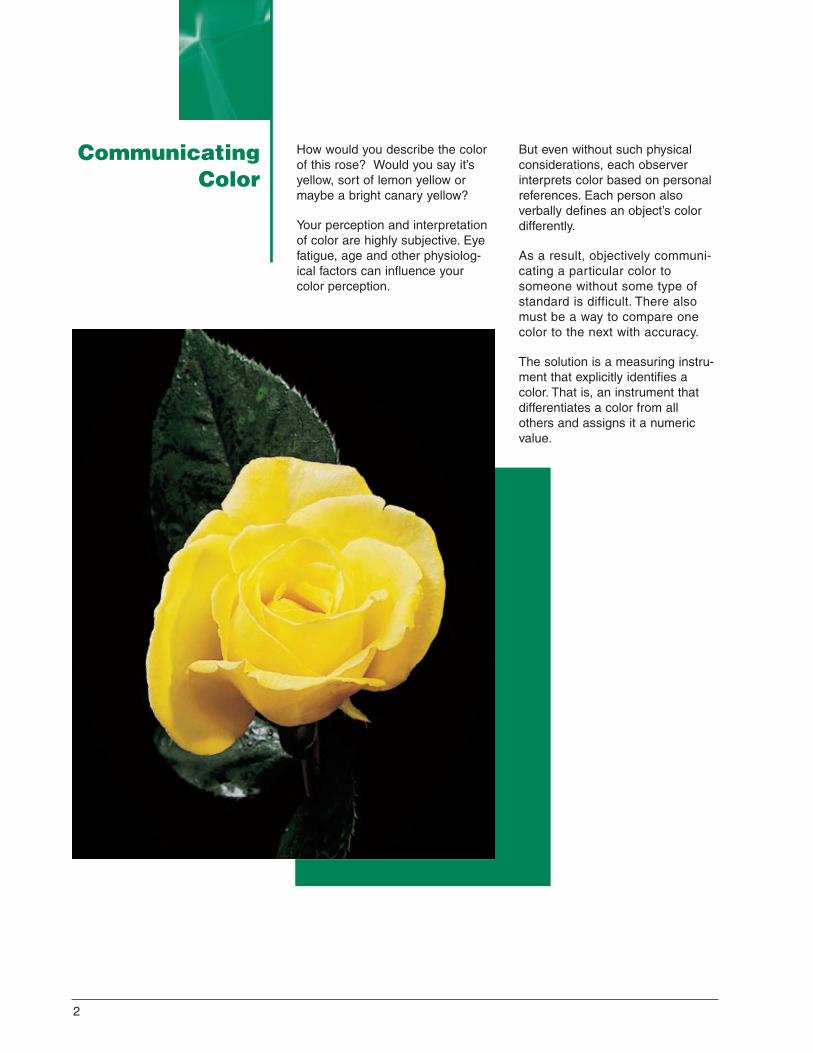
How would you describe the colorof this rose? Would you say it’syellow, sort of lemon yellow ormaybe a bright canary yellow?
Your perception and interpretationof color are highly subjective. Eyefatigue, age and other physiolog-ical factors can influence yourcolor perception.
But even without such physicalconsiderations, each observerinterprets color based on personalreferences. Each person alsoverbally defines an object’s colordifferently.
As a result, objectively communi-cating a particular color tosomeone without some type ofstandard is difficult. There alsomust be a way to compare onecolor to the next with accuracy.
The solution is a measuring instru-ment that explicitly identifies acolor. That is, an instrument thatdifferentiates a color from allothers and assigns it a numericvalue.
CommunicatingColor
3
Ways to Measure Color
Today, the most commonly usedinstruments for measuring colorare spectrophotometers.
Spectro technology measuresreflected or transmitted light atmany points on the visual spec-trum, which results in a curve.Since the curve of each color is asunique as a signature or finger-print, the curve is an excellent toolfor identifying, specifying andmatching color.
The following information can helpyou to understand which type ofinstrument is the best choice forspecific applications.
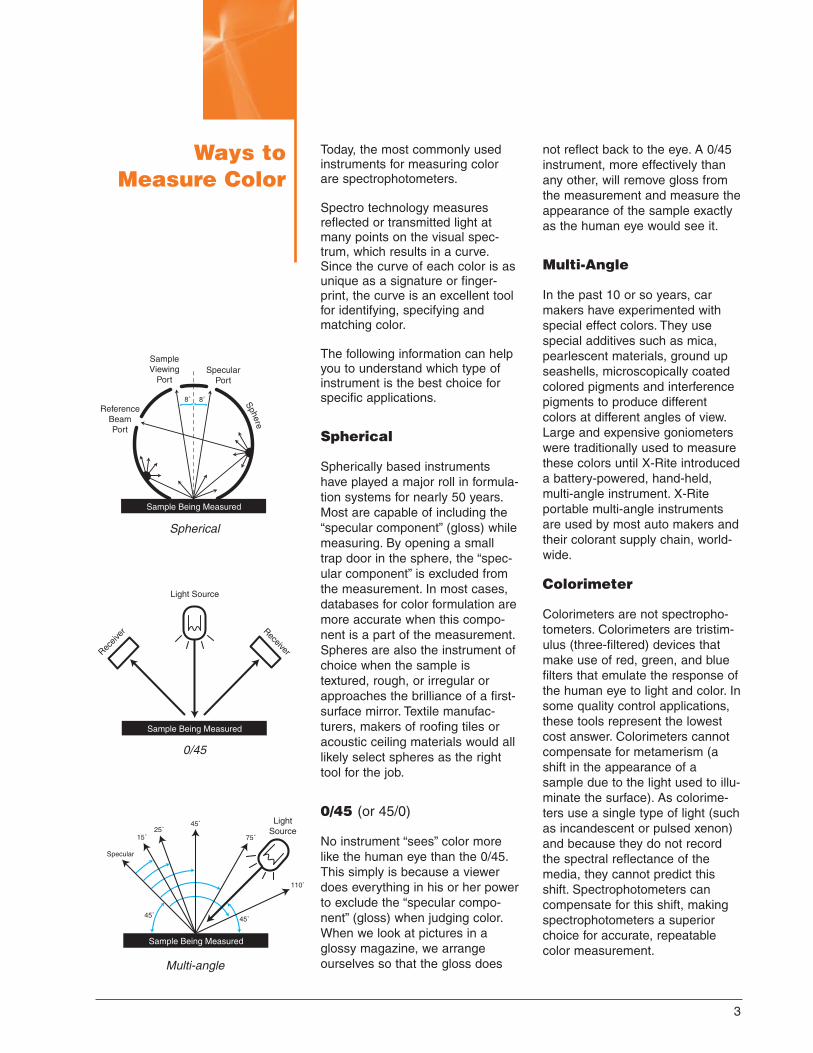
Spherical
Spherically based instrumentshave played a major roll in formula-tion systems for nearly 50 years.Most are capable of including the“specular component” (gloss) whilemeasuring. By opening a smalltrap door in the sphere, the “spec-ular component” is excluded fromthe measurement. In most cases,databases for color formulation aremore accurate when this compo-nent is a part of the measurement.Spheres are also the instrument ofchoice when the sample istextured, rough, or irregular orapproaches the brilliance of a first-surface mirror. Textile manufac-turers, makers of roofing tiles oracoustic ceiling materials would alllikely select spheres as the righttool for the job.
0/45 (or 45/0)
No instrument “sees” color morelike the human eye than the 0/45.This simply is because a viewerdoes everything in his or her powerto exclude the “specular compo-nent” (gloss) when judging color.When we look at pictures in aglossy magazine, we arrangeourselves so that the gloss does
not reflect back to the eye. A 0/45instrument, more effectively thanany other, will remove gloss fromthe measurement and measure theappearance of the sample exactlyas the human eye would see it.
Multi-Angle
In the past 10 or so years, carmakers have experimented withspecial effect colors. They usespecial additives such as mica,pearlescent materials, ground upseashells, microscopically coatedcolored pigments and interferencepigments to produce differentcolors at different angles of view.Large and expensive goniometerswere traditionally used to measurethese colors until X-Rite introduceda battery-powered, hand-held,multi-angle instrument. X-Riteportable multi-angle instrumentsare used by most auto makers andtheir colorant supply chain, world-wide.
Colorimeter
Colorimeters are not spectropho-tometers. Colorimeters are tristim-ulus (three-filtered) devices thatmake use of red, green, and bluefilters that emulate the response ofthe human eye to light and color. Insome quality control applications,these tools represent the lowestcost answer. Colorimeters cannotcompensate for metamerism (ashift in the appearance of asample due to the light used to illu-minate the surface). As colorime-ters use a single type of light (suchas incandescent or pulsed xenon)and because they do not recordthe spectral reflectance of themedia, they cannot predict thisshift. Spectrophotometers cancompensate for this shift, makingspectrophotometers a superiorchoice for accurate, repeatablecolor measurement.
Sample Being Measured
Light Source
Receiv
erReceiver
Sample Being Measured
Light Source
15˚ 25˚
45˚
75˚
110˚
45˚ 45˚
Specular
Sample Being Measured
Sample Viewing
PortSpecular
Port
Reference Beam Port
Sphere
8˚ 8˚
Spherical
0/45
Multi-angle

4
IntegratedColor –
Throughout theSupply Chain
Since color is a key element of aconsumer's buying decisions, howdo you handle color consistencyand quality in a global environment?How do you keep in step withconsumer color preferences whileensuring color options are availableand easy to reproduce? The solu-tion: X-Rite color measurementtechnology.
Accurate Color. On Time. Every Time.
Whether you're working with coatings, plastics or textiles, X-Rite understands the challengesunique to your business. Becausecustomer needs—not off-the-shelfproducts—drive the solutions webring, our industry experts take thetime to understand your business.The unique combination of X-Rite'stechnology, our vertically integratedmanufacturing capabilities and theindustry's largest global presenceallows us to invent and adapt specificsolutions for you, wherever you are.
When you streamline your work-flow system, it can greatly reducethe complexity of your supplychain. With a digital supply chainsolution for color control, you canshift color management responsi-bilities to your organization. Thismeans you control color data work-flow. The result: data flows faster,which provides the informationneeded to optimize choice ofsuppliers, and respond quickly tomarket pressures.

5
Controlling Color throughout the Process
X-Rite's product portfolio offerssolutions which connect coloraccurately throughout the entireprocess. Our solutions save youmoney by reducing scrap, produc-tion downtime, off-color productshipments and rework. We simplifythe process of managing colorthrough-out your global supplychain, whether with multiple locations or at a single facility,helping you protect the quality of corporate brands.
Offering a broad range of benchtop,portable or non-contact systems,X-Rite instruments can be found on the desktop, in retail settings, inlaboratories or on production lines,all managing color reliably andaccurately. Your total solutionincludes software that enhancesinstrument functionality by addingquality control, profiling functions,color matching, or color manage-ment packages. Complimentedwith our Macbeth Lighting offeringand visual evaluation tools fromMunsell Color, X-Rite offers thecomplete portfolio for all of yourcolor needs.
X-Rite is a global leader in colormeasurement, management andcommunication solutions, and canhelp you get the right color, everytime, from the earliest stages ofproduction to final product shipment.
Calibrated, On-Screen Color
X-Rite offers the only color for-mulation and quality assurance software to use the InternationalColor Consortium’s (ICC) standarddevice profiles for on-screen color.This means that colors will beconsistently displayed on differentcomputers, so long as ICC profilesare used. Use X-Rite monitor optimizers and auto-scan densito-meters for complete color calibrationand control on computers, printersand scanners.
6
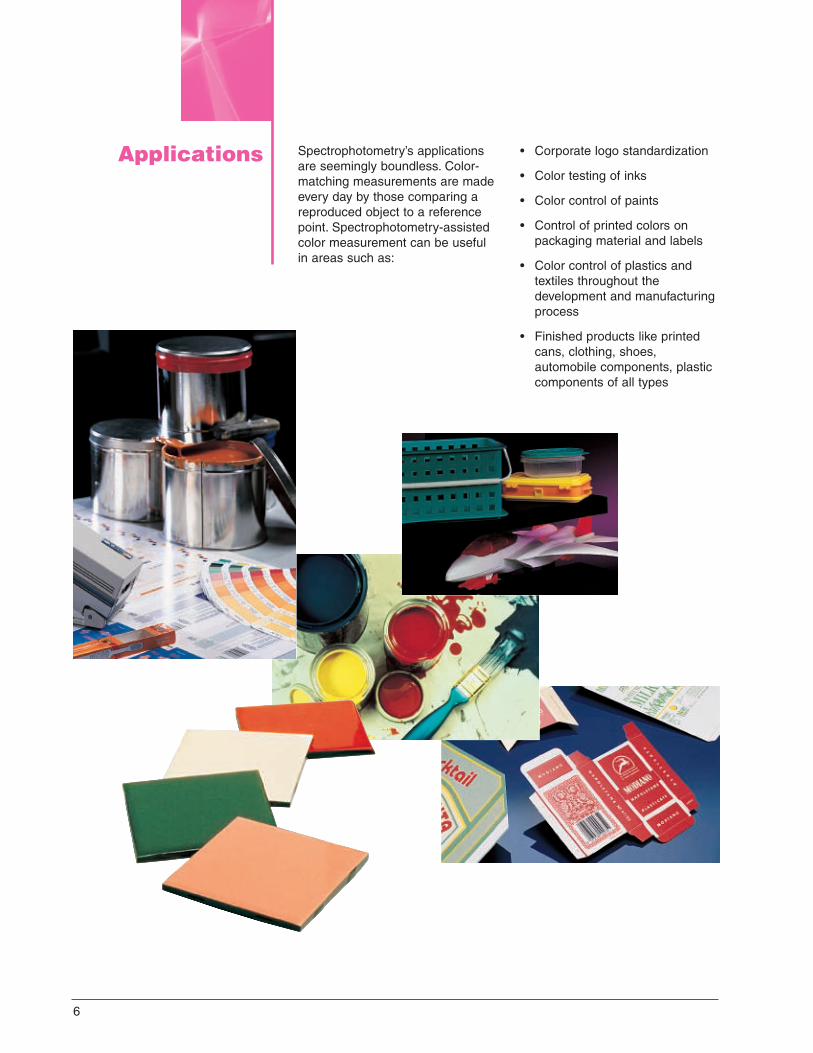
Spectrophotometry’s applicationsare seemingly boundless. Color-matching measurements are madeevery day by those comparing areproduced object to a referencepoint. Spectrophotometry-assistedcolor measurement can be usefulin areas such as:
• Corporate logo standardization
• Color testing of inks
• Color control of paints
• Control of printed colors onpackaging material and labels
• Color control of plastics andtextiles throughout thedevelopment and manufacturingprocess
• Finished products like printedcans, clothing, shoes,automobile components, plasticcomponents of all types
Applications
7
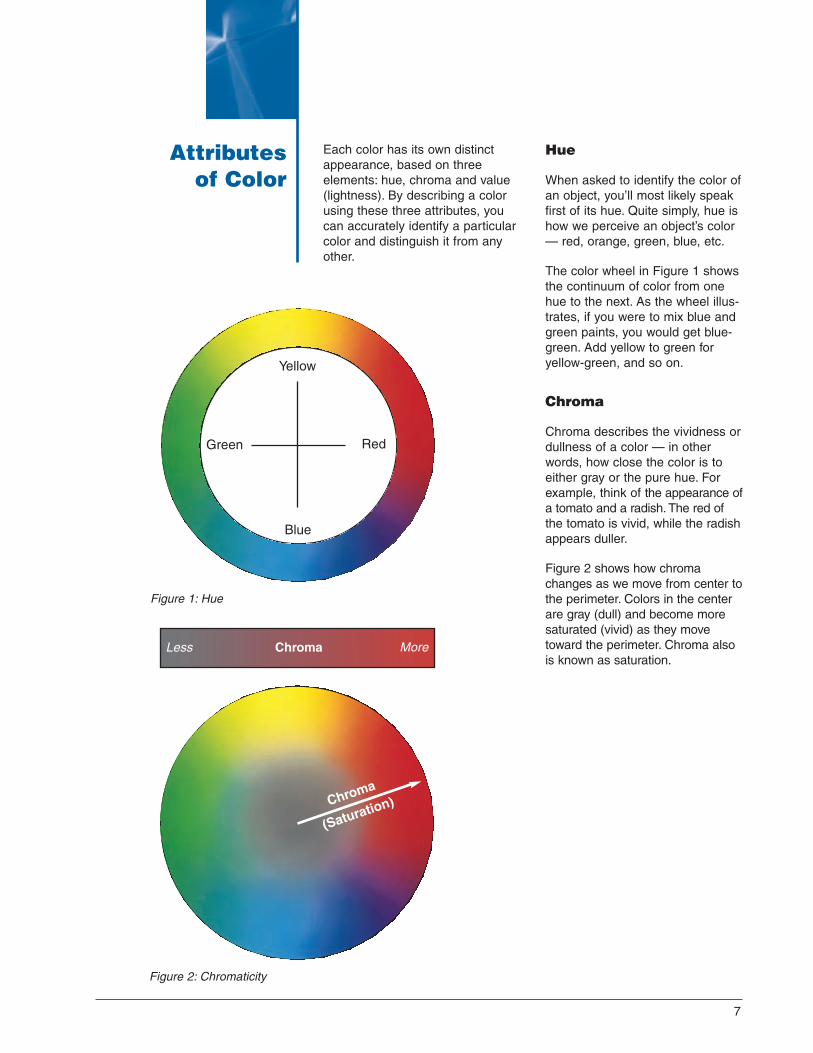
Each color has its own distinctappearance, based on threeelements: hue, chroma and value(lightness). By describing a colorusing these three attributes, youcan accurately identify a particularcolor and distinguish it from anyother.
Hue
When asked to identify the color ofan object, you’ll most likely speakfirst of its hue. Quite simply, hue ishow we perceive an object’s color— red, orange, green, blue, etc.
The color wheel in Figure 1 showsthe continuum of color from onehue to the next. As the wheel illus-trates, if you were to mix blue andgreen paints, you would get blue-green. Add yellow to green foryellow-green, and so on.
Chroma
Chroma describes the vividness ordullness of a color — in otherwords, how close the color is toeither gray or the pure hue. Forexample, think of the appearance ofa tomato and a radish. The red ofthe tomato is vivid, while the radishappears duller.
Figure 2 shows how chromachanges as we move from center tothe perimeter. Colors in the centerare gray (dull) and become moresaturated (vivid) as they movetoward the perimeter. Chroma alsois known as saturation.
Attributesof Color
Yellow
Blue
Green Red
Figure 1: Hue
Chroma
(Saturation)
Less MoreChroma
Figure 2: Chromaticity
8
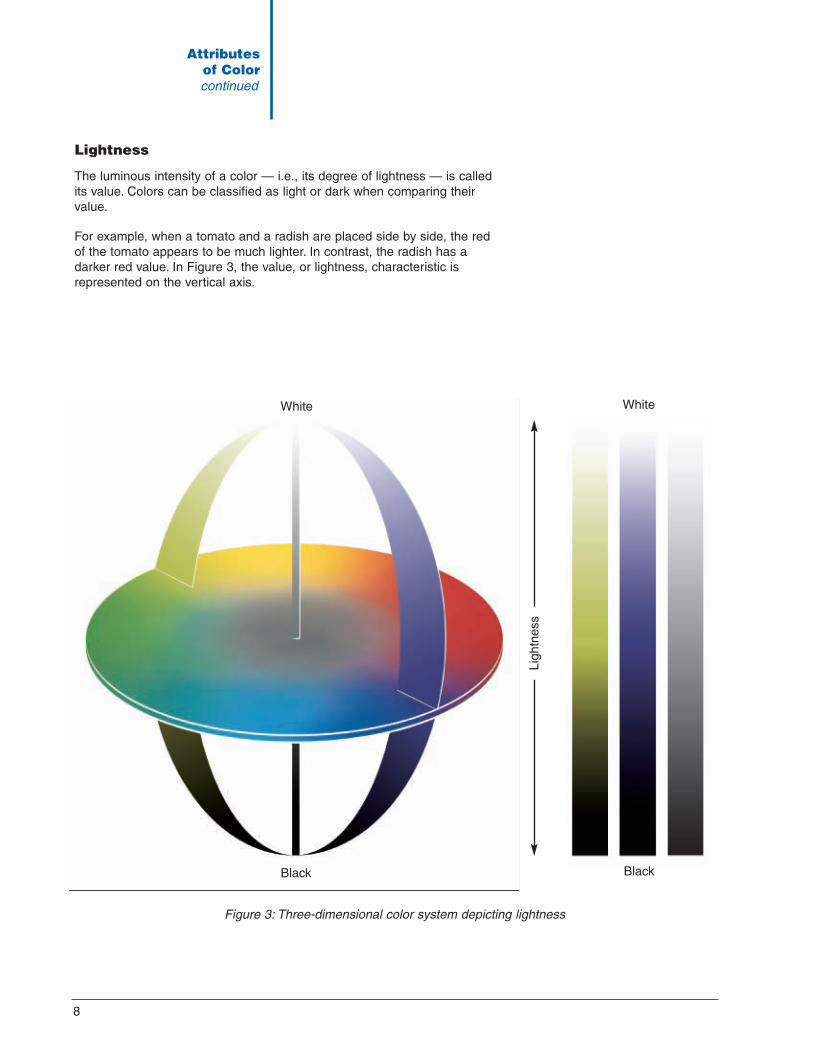
Figure 3: Three-dimensional color system depicting lightness
White
Black
White
Black
Ligh
tnes
s
The luminous intensity of a color — i.e., its degree of lightness — is calledits value. Colors can be classified as light or dark when comparing theirvalue.
For example, when a tomato and a radish are placed side by side, the redof the tomato appears to be much lighter. In contrast, the radish has adarker red value. In Figure 3, the value, or lightness, characteristic isrepresented on the vertical axis.
Lightness
Attributesof Colorcontinued
The Munsell Scale
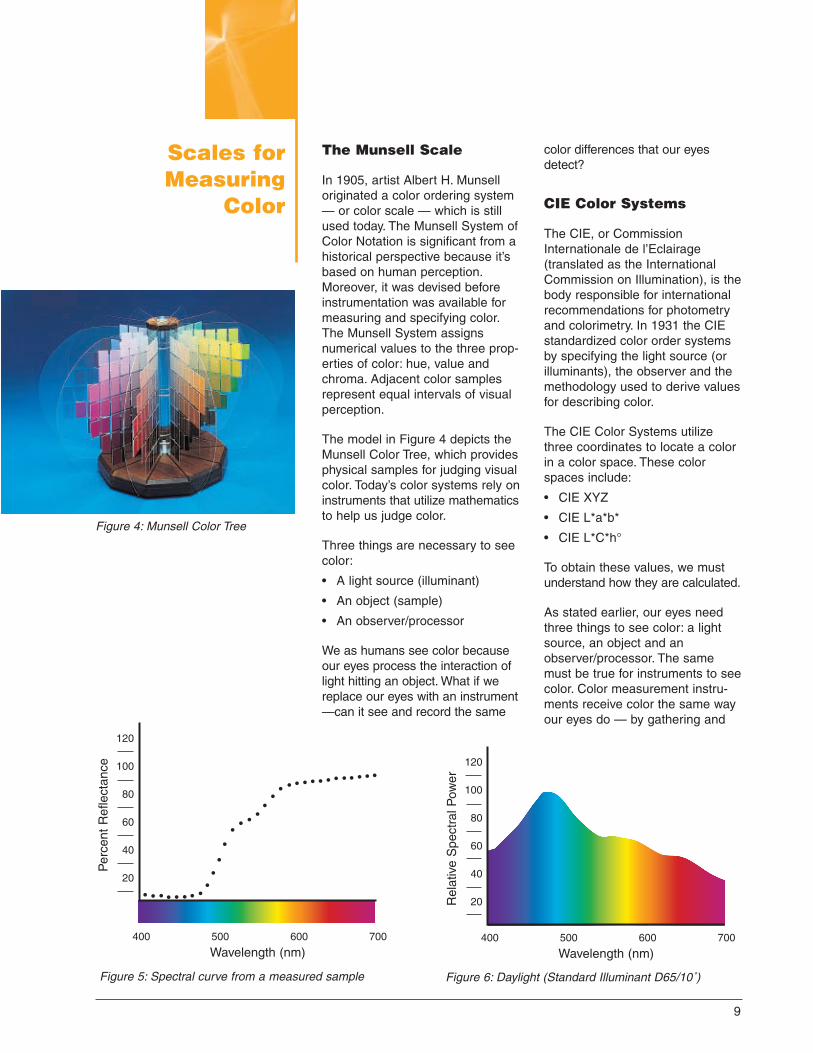
In 1905, artist Albert H. Munselloriginated a color ordering system— or color scale — which is stillused today. The Munsell System ofColor Notation is significant from ahistorical perspective because it’sbased on human perception.Moreover, it was devised beforeinstrumentation was available formeasuring and specifying color.The Munsell System assignsnumerical values to the three prop-erties of color: hue, value andchroma. Adjacent color samplesrepresent equal intervals of visualperception.
The model in Figure 4 depicts theMunsell Color Tree, which providesphysical samples for judging visualcolor. Today’s color systems rely oninstruments that utilize mathematicsto help us judge color.
Three things are necessary to seecolor:
• A light source (illuminant)
• An object (sample)
• An observer/processor
We as humans see color becauseour eyes process the interaction oflight hitting an object. What if wereplace our eyes with an instrument—can it see and record the same
color differences that our eyesdetect?
CIE Color Systems
The CIE, or CommissionInternationale de l’Eclairage(translated as the InternationalCommission on Illumination), is thebody responsible for internationalrecommendations for photometryand colorimetry. In 1931 the CIEstandardized color order systemsby specifying the light source (orilluminants), the observer and themethodology used to derive valuesfor describing color.
The CIE Color Systems utilizethree coordinates to locate a colorin a color space. These colorspaces include:
• CIE XYZ
• CIE L*a*b*
• CIE L*C*h°
To obtain these values, we mustunderstand how they are calculated.
As stated earlier, our eyes needthree things to see color: a lightsource, an object and anobserver/processor. The samemust be true for instruments to seecolor. Color measurement instru-ments receive color the same wayour eyes do — by gathering and
Figure 5: Spectral curve from a measured sample
Figure 4: Munsell Color Tree
Scales for Measuring
Color
400 500 600 700
Wavelength (nm)
120
100
80
60
40
20
Per
cent
Ref
lect
ance
9
400 500 600 700
Figure 6: Daylight (Standard Illuminant D65/10˚)
Wavelength (nm)
120
100
80
60
40
20Rel
ativ
e S
pect
ral P
ower
10
Scales for Measuring Color
continued
filtering the wavelengths of light reflected from an object. The instrumentperceives the reflected light wavelengths as numeric values. These valuesare recorded as points across the visible spectrum and are called spectraldata. Spectral data is represented as a spectral curve. This curve is thecolor’s fingerprint (Figure 5).
Once we obtain a color’s reflectance curve, we can apply mathematics tomap the color onto a color space.
To do this, we take the reflectance curve and multiply the data by a CIEstandard illuminant. The illuminant is a graphical representation of the lightsource under which the samples are viewed. Each light source has a powerdistribution that affects how we see color. Examples of different illuminantsare A — incandescent, D65 — daylight (Figure 6) and F2 — fluorescent.
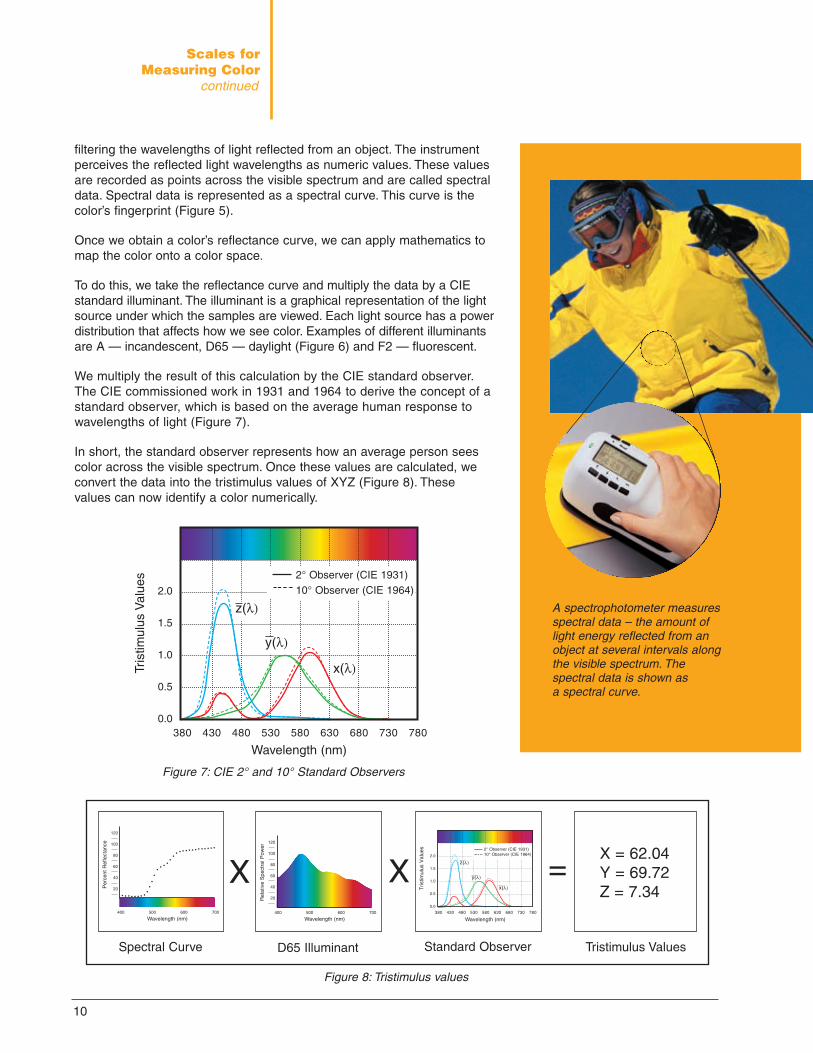
We multiply the result of this calculation by the CIE standard observer.The CIE commissioned work in 1931 and 1964 to derive the concept of astandard observer, which is based on the average human response towavelengths of light (Figure 7).
In short, the standard observer represents how an average person seescolor across the visible spectrum. Once these values are calculated, weconvert the data into the tristimulus values of XYZ (Figure 8). Thesevalues can now identify a color numerically.
A spectrophotometer measuresspectral data – the amount oflight energy reflected from anobject at several intervals alongthe visible spectrum. Thespectral data is shown as a spectral curve.
2.0
1.5
1.0
0.5
0.0380 430 480 530 580 630 680 730 780
z(λ)
y(λ)
x(λ)
Wavelength (nm)
Tris
timul
us V
alue
s 2° Observer (CIE 1931)10° Observer (CIE 1964)
Figure 7: CIE 2° and 10° Standard Observers
400 500 600 700
Wavelength (nm)
120
100
80
60
40
20Ref
lect
ance
Int
ensi
ty
300
250
200
150
100
50
0380 430 480 530 580 630 680 730 780
z(λ)
y(λ)
x(λ)
Wavelength (nm)
Ref
lect
ance
Int
ensi
ty
2° Observer (CIE 1931)10° Observer (CIE 1964)
400 500 600 700
Wavelength (nm)
120
100
80
60
40
20Ref
lect
ance
Int
ensi
ty
400 500 600 700
Wavelength (nm)
120
100
80
60
40
20Ref
lect
ance
Int
ensi
ty
300
250
200
150
100
50
0380 430 480 530 580 630 680 730 780
z(λ)
y(λ)
x(λ)
Wavelength (nm)
Ref
lect
ance
Int
ensi
ty
2° Observer (CIE 1931)10° Observer (CIE 1964)
400 500 600 700
Wavelength (nm)
120
100
80
60
40
20Ref
lect
ance
Int
ensi
ty
X X =X = 62.04Y = 69.72Z = 7.34
Spectral Curve D65 Illuminant Standard Observer Tristimulus Values
Figure 8: Tristimulus values
Per
cent
Ref
lect
ance
Rel
ativ
e S
pect
ral P
ower
Tris
timul
us V
alue
s
2.0
1.5
1.0
0.5
0.0
y
x
Hue
Saturation
11
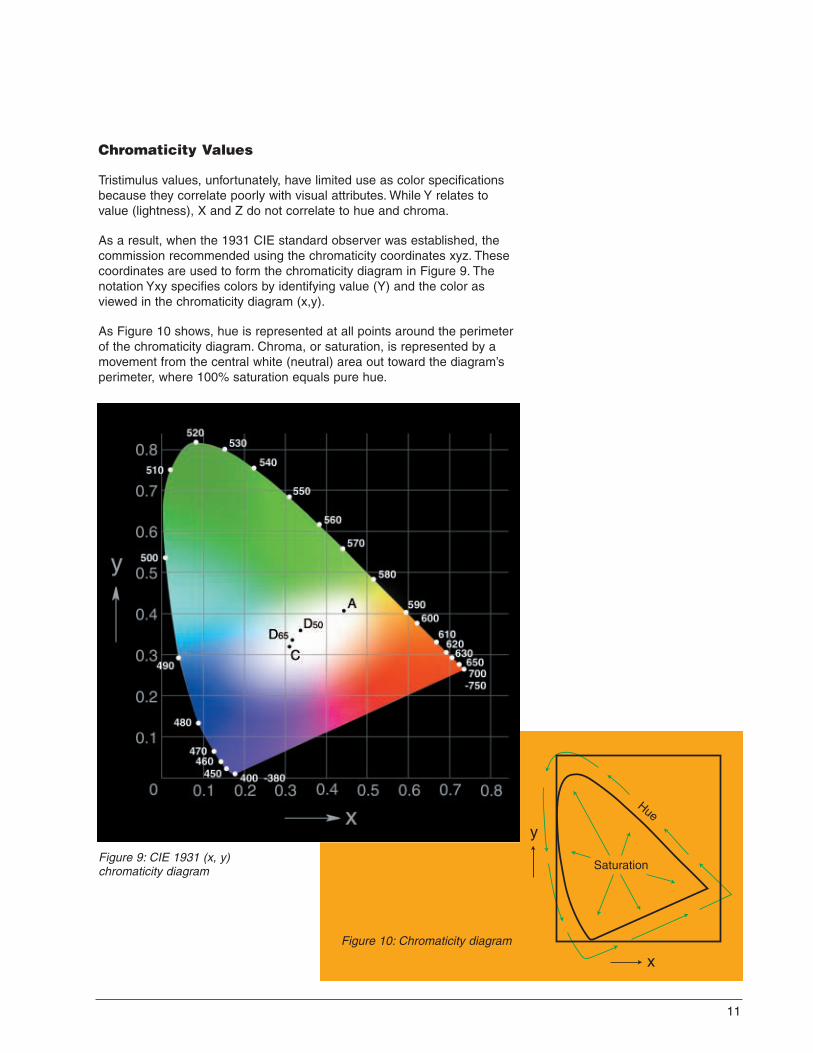
Figure 9: CIE 1931 (x, y)chromaticity diagram
Figure 10: Chromaticity diagram
Chromaticity Values
Tristimulus values, unfortunately, have limited use as color specificationsbecause they correlate poorly with visual attributes. While Y relates tovalue (lightness), X and Z do not correlate to hue and chroma.
As a result, when the 1931 CIE standard observer was established, thecommission recommended using the chromaticity coordinates xyz. Thesecoordinates are used to form the chromaticity diagram in Figure 9. Thenotation Yxy specifies colors by identifying value (Y) and the color asviewed in the chromaticity diagram (x,y).
As Figure 10 shows, hue is represented at all points around the perimeterof the chromaticity diagram. Chroma, or saturation, is represented by amovement from the central white (neutral) area out toward the diagram’sperimeter, where 100% saturation equals pure hue.
12
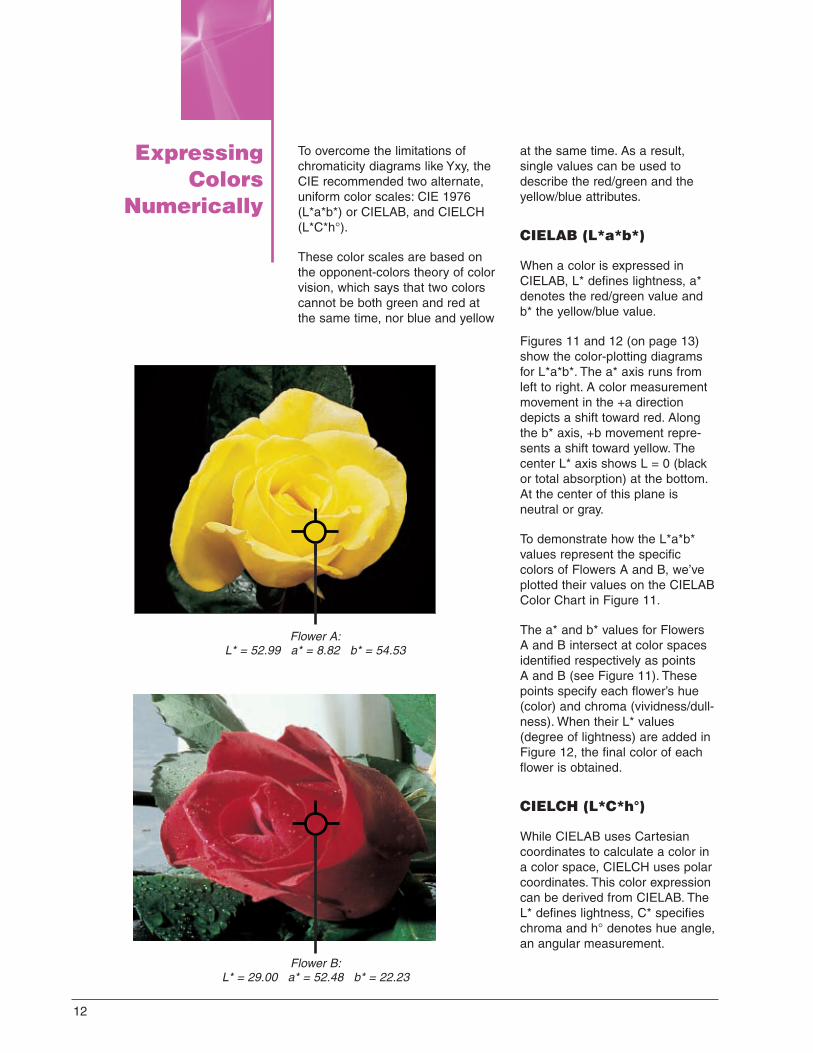
To overcome the limitations ofchromaticity diagrams like Yxy, theCIE recommended two alternate,uniform color scales: CIE 1976(L*a*b*) or CIELAB, and CIELCH(L*C*h°).
These color scales are based onthe opponent-colors theory of colorvision, which says that two colorscannot be both green and red atthe same time, nor blue and yellow
at the same time. As a result,single values can be used todescribe the red/green and theyellow/blue attributes.
CIELAB (L*a*b*)
When a color is expressed inCIELAB, L* defines lightness, a*denotes the red/green value andb* the yellow/blue value.
Figures 11 and 12 (on page 13)show the color-plotting diagramsfor L*a*b*. The a* axis runs fromleft to right. A color measurementmovement in the +a directiondepicts a shift toward red. Alongthe b* axis, +b movement repre-sents a shift toward yellow. Thecenter L* axis shows L = 0 (blackor total absorption) at the bottom.At the center of this plane isneutral or gray.
To demonstrate how the L*a*b*values represent the specificcolors of Flowers A and B, we’veplotted their values on the CIELABColor Chart in Figure 11.
The a* and b* values for Flowers A and B intersect at color spacesidentified respectively as points A and B (see Figure 11). Thesepoints specify each flower’s hue(color) and chroma (vividness/dull-ness). When their L* values(degree of lightness) are added inFigure 12, the final color of eachflower is obtained.
CIELCH (L*C*h°)
While CIELAB uses Cartesiancoordinates to calculate a color ina color space, CIELCH uses polarcoordinates. This color expressioncan be derived from CIELAB. TheL* defines lightness, C* specifieschroma and h° denotes hue angle,an angular measurement.
ExpressingColors
Numerically
Flower A:L* = 52.99 a* = 8.82 b* = 54.53
Flower B:L* = 29.00 a* = 52.48 b* = 22.23
90˚ Yellow
+b*
0˚Red +a*
180˚Green
-a*
Blue -b*
270˚
Hue
13
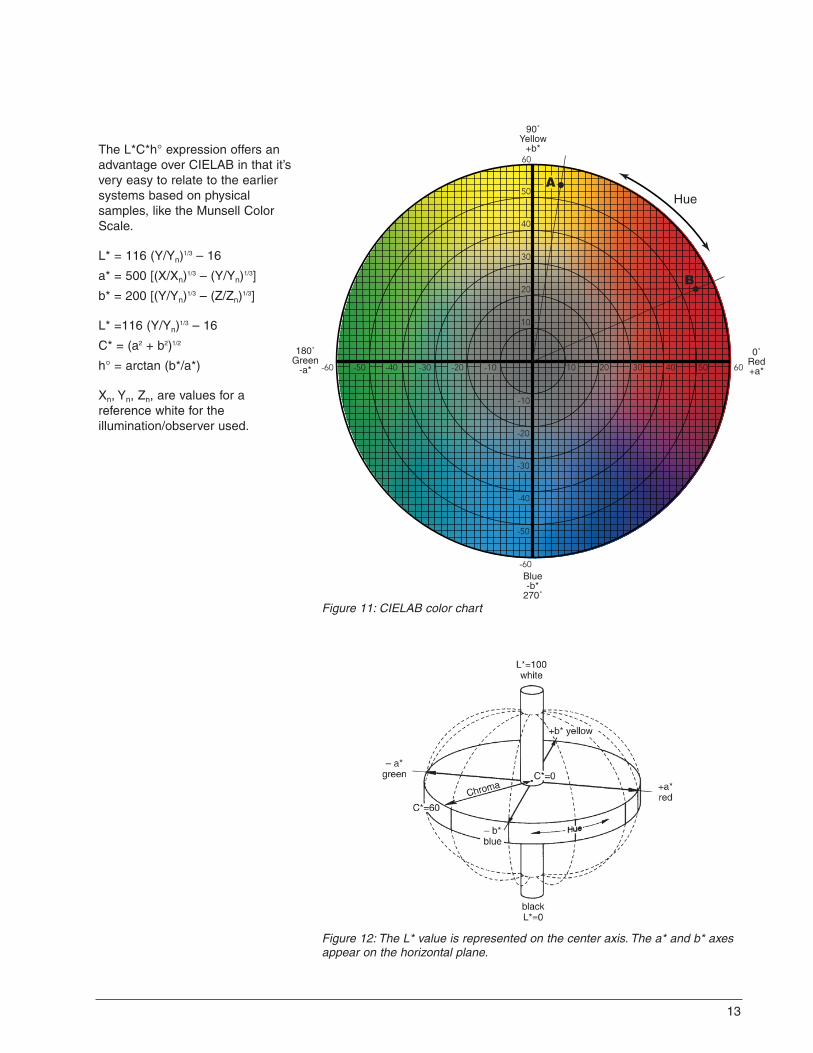
Figure 12: The L* value is represented on the center axis. The a* and b* axesappear on the horizontal plane.
Figure 11: CIELAB color chart
The L*C*h° expression offers anadvantage over CIELAB in that it’svery easy to relate to the earliersystems based on physicalsamples, like the Munsell ColorScale.
L* = 116 (Y/Yn)1/3 – 16
a* = 500 [(X/Xn)1/3 – (Y/Yn)1/3]
b* = 200 [(Y/Yn)1/3 – (Z/Zn)1/3]
L* =116 (Y/Yn)1/3 – 16
C* = (a2 + b2)1/2
h° = arctan (b*/a*)
Xn, Yn, Zn, are values for areference white for theillumination/observer used.
14
ColorDifferences,
Notation andTolerancing
Delta CIELAB and CIELCH
Assessment of color is more than anumeric expression. Usually it’s anassessment of the color difference(delta) from a known standard.CIELAB and CIELCH are used tocompare the colors of two objects.
The expressions for these colordifferences are ∆L* ∆a* ∆b* or DL*Da* Db*, and ∆L* ∆C* ∆H* or DL*DC* DH* (∆ or D symbolizes“delta,” which indicates difference).
Given ∆L* ∆a* ∆b*, the total differ-ence or distance on the CIELABdiagram can be stated as a singlevalue, known as ∆E*.
∆E*ab = [(∆L2) + (∆a2) + (∆b2)]1/2
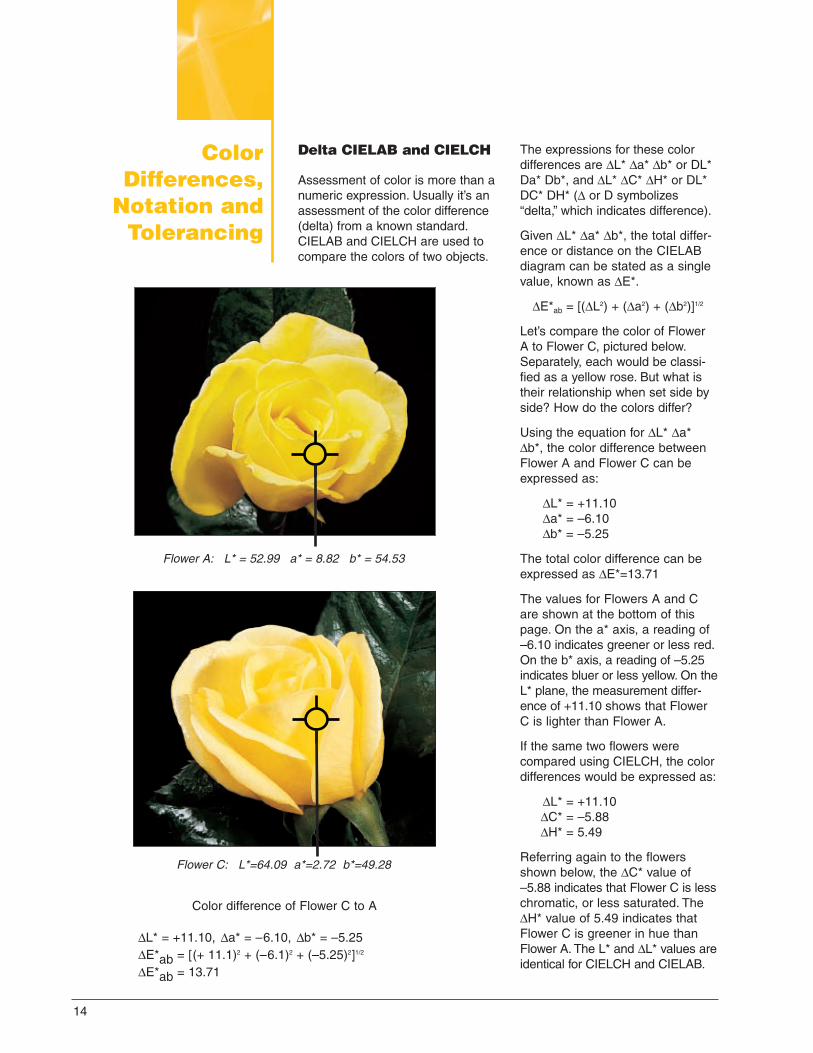
Let’s compare the color of Flower A to Flower C, pictured below.Separately, each would be classi-fied as a yellow rose. But what istheir relationship when set side byside? How do the colors differ?
Using the equation for ∆L* ∆a*∆b*, the color difference betweenFlower A and Flower C can beexpressed as:
∆L* = +11.10 ∆a* = –6.10 ∆b* = –5.25
The total color difference can beexpressed as ∆E*=13.71
The values for Flowers A and Care shown at the bottom of thispage. On the a* axis, a reading of–6.10 indicates greener or less red.On the b* axis, a reading of –5.25indicates bluer or less yellow. On theL* plane, the measurement differ-ence of +11.10 shows that FlowerC is lighter than Flower A.
If the same two flowers werecompared using CIELCH, the colordifferences would be expressed as:
∆L* = +11.10∆C* = –5.88∆H* = 5.49
Referring again to the flowersshown below, the ∆C* value of–5.88 indicates that Flower C is lesschromatic, or less saturated. The∆H* value of 5.49 indicates thatFlower C is greener in hue thanFlower A. The L* and ∆L* values areidentical for CIELCH and CIELAB.
Flower A: L* = 52.99 a* = 8.82 b* = 54.53
Flower C: L*=64.09 a*=2.72 b*=49.28
Color difference of Flower C to A
∆L* = +11.10, ∆a* = –6.10, ∆b* = –5.25∆E*ab = [(+ 11.1)2 + (–6.1)2 + (–5.25)2]1/2
∆E*ab = 13.71
15
Hue
Chroma
Ligh
tnes
s
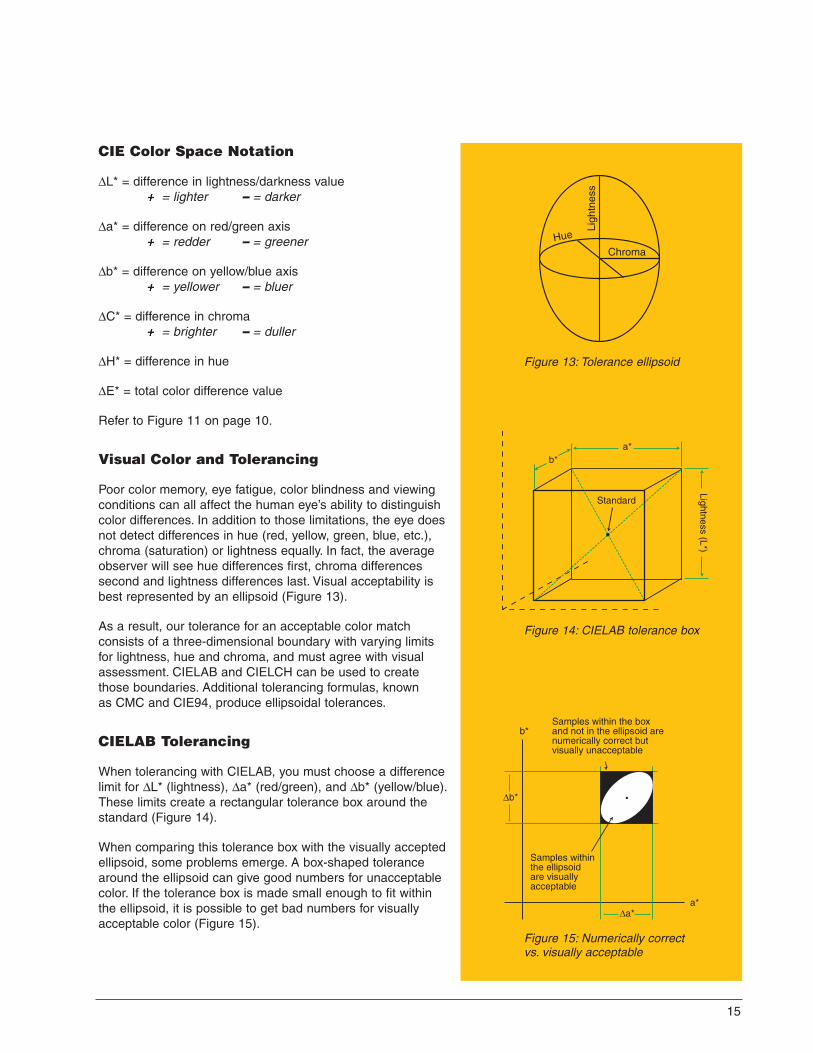
Figure 13: Tolerance ellipsoid
Standard
a*b*
Lightness(L*)
Figure 14: CIELAB tolerance box
a*
b*
∆a*
∆b*
Samples within the ellipsoid are visually acceptable
Samples within the box and not in the ellipsoid are numerically correct but visually unacceptable
Figure 15: Numerically correctvs. visually acceptable
CIE Color Space Notation
∆L* = difference in lightness/darkness value+ = lighter – = darker
∆a* = difference on red/green axis+ = redder – = greener
∆b* = difference on yellow/blue axis+ = yellower – = bluer
∆C* = difference in chroma+ = brighter – = duller
∆H* = difference in hue
∆E* = total color difference value
Refer to Figure 11 on page 10.
Visual Color and Tolerancing
Poor color memory, eye fatigue, color blindness and viewingconditions can all affect the human eye’s ability to distinguishcolor differences. In addition to those limitations, the eye doesnot detect differences in hue (red, yellow, green, blue, etc.),chroma (saturation) or lightness equally. In fact, the averageobserver will see hue differences first, chroma differencessecond and lightness differences last. Visual acceptability isbest represented by an ellipsoid (Figure 13).
As a result, our tolerance for an acceptable color matchconsists of a three-dimensional boundary with varying limits for lightness, hue and chroma, and must agree with visualassessment. CIELAB and CIELCH can be used to create those boundaries. Additional tolerancing formulas, known as CMC and CIE94, produce ellipsoidal tolerances.
CIELAB Tolerancing
When tolerancing with CIELAB, you must choose a differencelimit for ∆L* (lightness), ∆a* (red/green), and ∆b* (yellow/blue).These limits create a rectangular tolerance box around thestandard (Figure 14).
When comparing this tolerance box with the visually acceptedellipsoid, some problems emerge. A box-shaped tolerancearound the ellipsoid can give good numbers for unacceptablecolor. If the tolerance box is made small enough to fit within the ellipsoid, it is possible to get bad numbers for visuallyacceptable color (Figure 15).
16
Color Differences,Notation and
Tolerancingcontinued
CIELCH Tolerancing
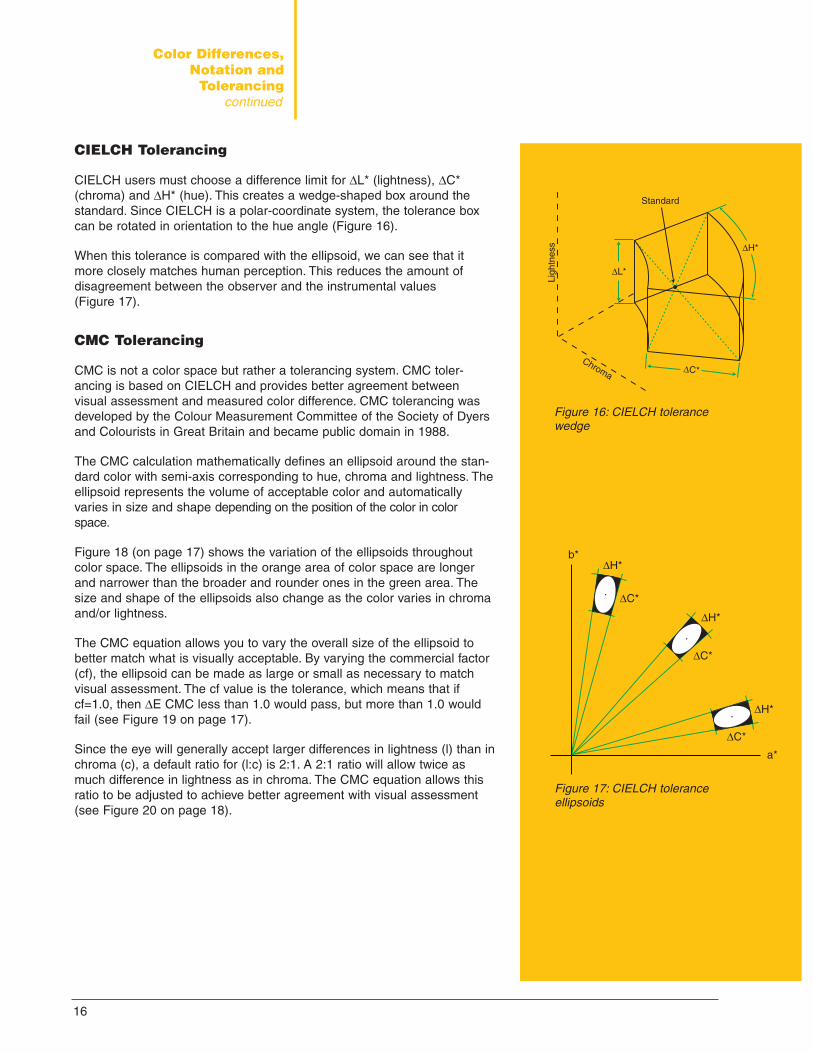
CIELCH users must choose a difference limit for ∆L* (lightness), ∆C*(chroma) and ∆H* (hue). This creates a wedge-shaped box around thestandard. Since CIELCH is a polar-coordinate system, the tolerance boxcan be rotated in orientation to the hue angle (Figure 16).
When this tolerance is compared with the ellipsoid, we can see that itmore closely matches human perception. This reduces the amount ofdisagreement between the observer and the instrumental values (Figure 17).
CMC Tolerancing
CMC is not a color space but rather a tolerancing system. CMC toler-ancing is based on CIELCH and provides better agreement betweenvisual assessment and measured color difference. CMC tolerancing wasdeveloped by the Colour Measurement Committee of the Society of Dyersand Colourists in Great Britain and became public domain in 1988.
The CMC calculation mathematically defines an ellipsoid around the stan-dard color with semi-axis corresponding to hue, chroma and lightness. Theellipsoid represents the volume of acceptable color and automaticallyvaries in size and shape depending on the position of the color in colorspace.
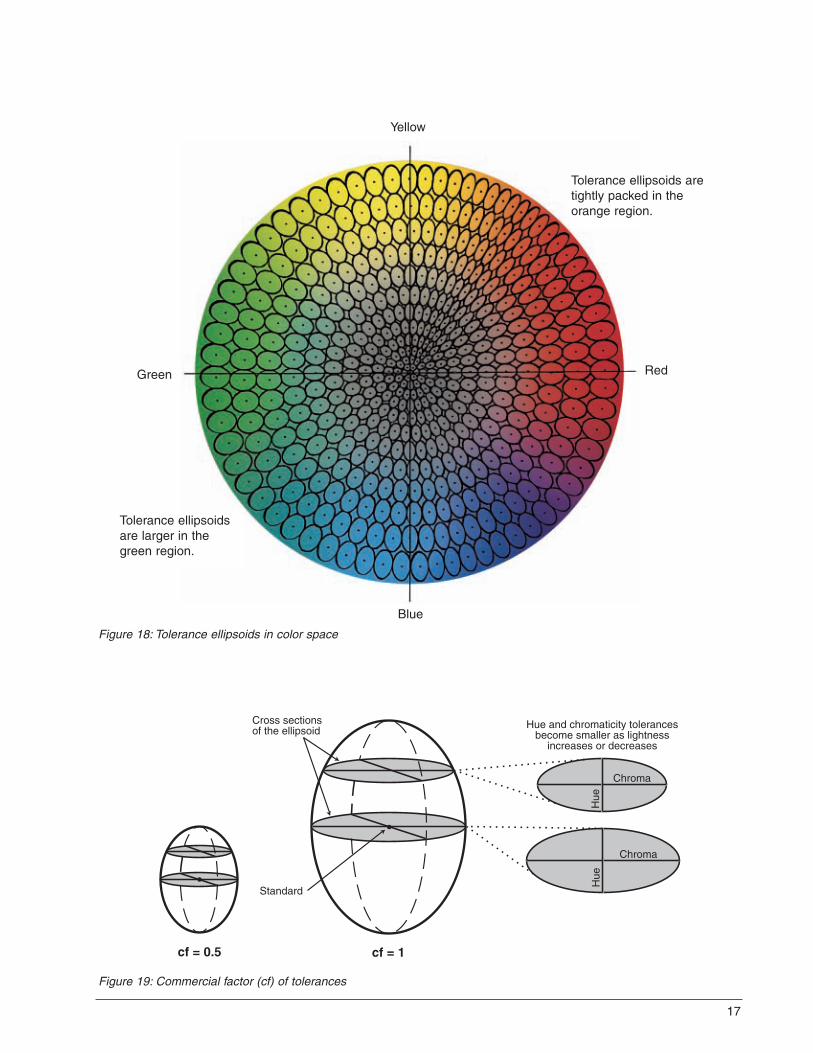
Figure 18 (on page 17) shows the variation of the ellipsoids throughoutcolor space. The ellipsoids in the orange area of color space are longerand narrower than the broader and rounder ones in the green area. Thesize and shape of the ellipsoids also change as the color varies in chromaand/or lightness.
The CMC equation allows you to vary the overall size of the ellipsoid tobetter match what is visually acceptable. By varying the commercial factor(cf), the ellipsoid can be made as large or small as necessary to matchvisual assessment. The cf value is the tolerance, which means that ifcf=1.0, then ∆E CMC less than 1.0 would pass, but more than 1.0 wouldfail (see Figure 19 on page 17).
Since the eye will generally accept larger differences in lightness (l) than inchroma (c), a default ratio for (l:c) is 2:1. A 2:1 ratio will allow twice asmuch difference in lightness as in chroma. The CMC equation allows thisratio to be adjusted to achieve better agreement with visual assessment(see Figure 20 on page 18).
∆H*
∆L*
∆C*
Standard
Ligh
tnes
s
Chroma
Figure 16: CIELCH tolerancewedge
a*
b*
∆C*
∆C*
∆C*
∆H*
∆H*
∆H*
Figure 17: CIELCH toleranceellipsoids
Cross sections of the ellipsoid
Standard
cf = 1cf = 0.5
Chroma
Chroma
Hue
Hue
Hue and chromaticity tolerances become smaller as lightness
increases or decreases
Figure 19: Commercial factor (cf) of tolerances
Figure 18: Tolerance ellipsoids in color space
Yellow
Blue
RedGreen
Tolerance ellipsoids aretightly packed in theorange region.
Tolerance ellipsoidsare larger in thegreen region.
∆H*
∆L*
∆C*
Standard
Ligh
tnes
s
Chroma
a*
b*
∆C*
∆C*
∆C*
∆H*
∆H*
∆H*
17
18
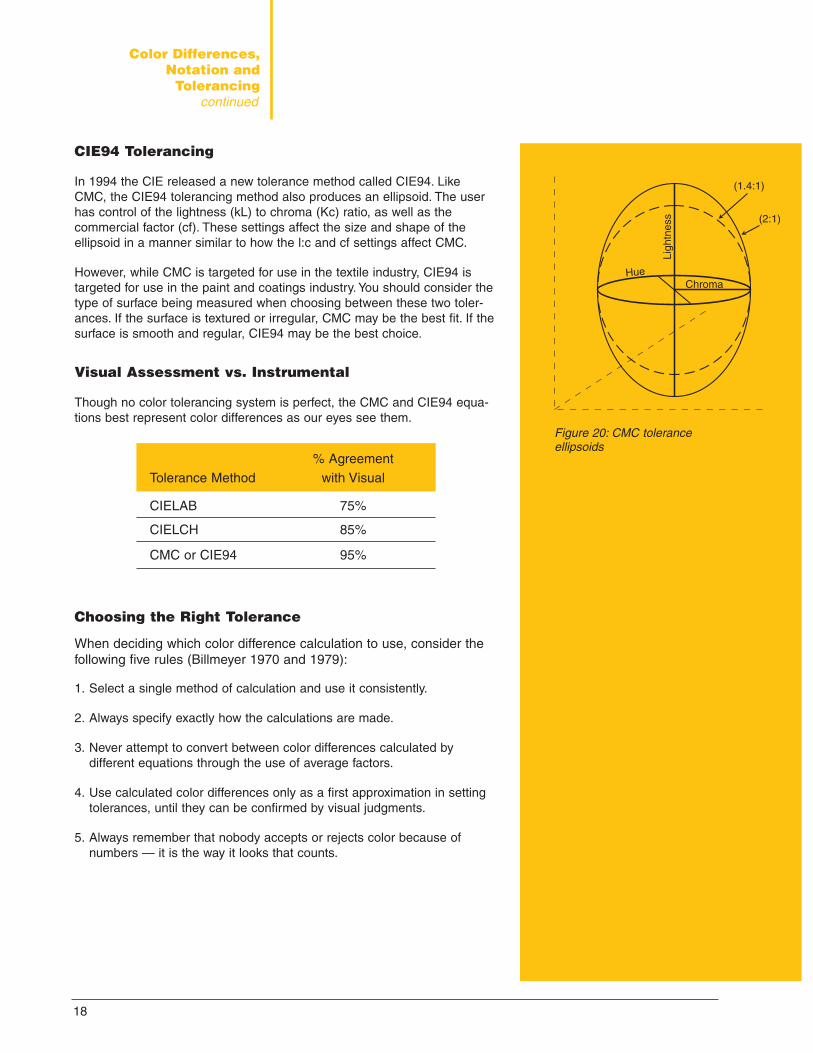
CIE94 Tolerancing
In 1994 the CIE released a new tolerance method called CIE94. LikeCMC, the CIE94 tolerancing method also produces an ellipsoid. The userhas control of the lightness (kL) to chroma (Kc) ratio, as well as thecommercial factor (cf). These settings affect the size and shape of theellipsoid in a manner similar to how the l:c and cf settings affect CMC.
However, while CMC is targeted for use in the textile industry, CIE94 istargeted for use in the paint and coatings industry. You should consider thetype of surface being measured when choosing between these two toler-ances. If the surface is textured or irregular, CMC may be the best fit. If thesurface is smooth and regular, CIE94 may be the best choice.
Visual Assessment vs. Instrumental
Though no color tolerancing system is perfect, the CMC and CIE94 equa-tions best represent color differences as our eyes see them.
Choosing the Right Tolerance
When deciding which color difference calculation to use, consider thefollowing five rules (Billmeyer 1970 and 1979):
1. Select a single method of calculation and use it consistently.
2. Always specify exactly how the calculations are made.
3. Never attempt to convert between color differences calculated bydifferent equations through the use of average factors.
4. Use calculated color differences only as a first approximation in settingtolerances, until they can be confirmed by visual judgments.
5. Always remember that nobody accepts or rejects color because ofnumbers — it is the way it looks that counts.
% AgreementTolerance Method with Visual
CIELAB 75%
CIELCH 85%
CMC or CIE94 95%
Figure 20: CMC toleranceellipsoids
HueChroma
Ligh
tnes
s
(1.4:1)
(2:1)
Color Differences,Notation and
Tolerancingcontinued
19
Other Color
Expressions
White and Yellow Indices
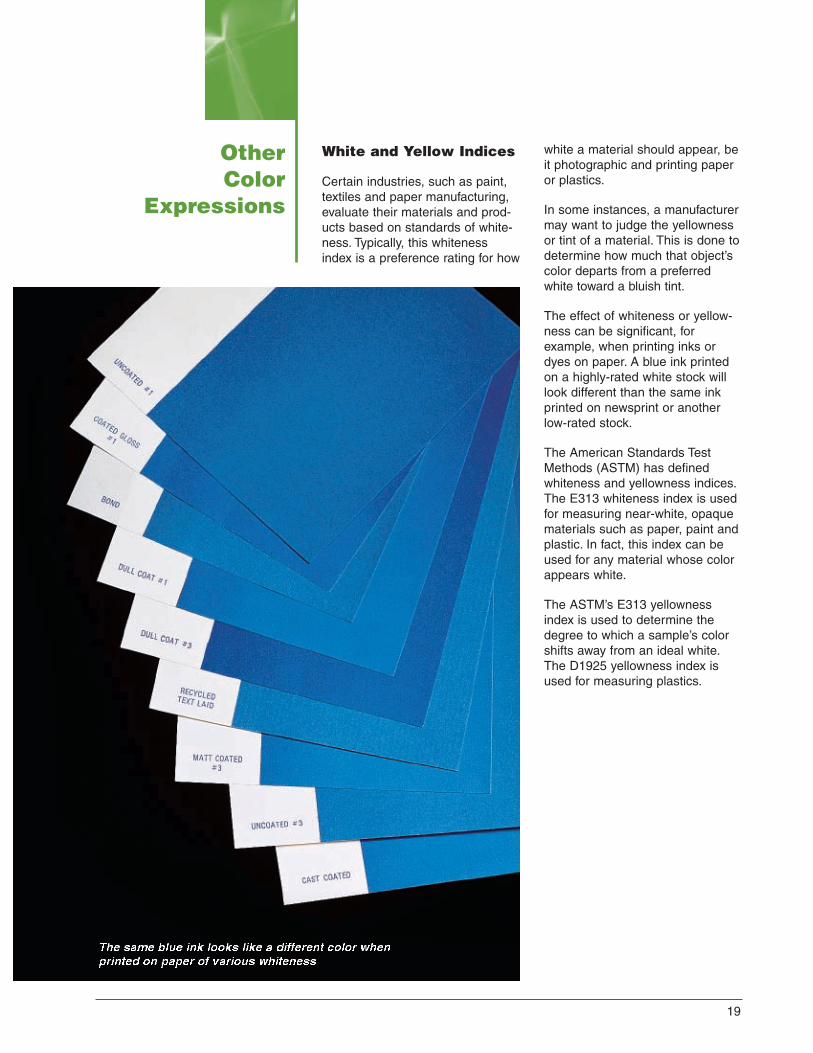
Certain industries, such as paint,textiles and paper manufacturing,evaluate their materials and prod-ucts based on standards of white-ness. Typically, this whitenessindex is a preference rating for how
white a material should appear, beit photographic and printing paperor plastics.
In some instances, a manufacturermay want to judge the yellownessor tint of a material. This is done todetermine how much that object’scolor departs from a preferredwhite toward a bluish tint.
The effect of whiteness or yellow-ness can be significant, forexample, when printing inks ordyes on paper. A blue ink printedon a highly-rated white stock willlook different than the same inkprinted on newsprint or anotherlow-rated stock.
The American Standards TestMethods (ASTM) has definedwhiteness and yellowness indices.The E313 whiteness index is usedfor measuring near-white, opaquematerials such as paper, paint andplastic. In fact, this index can beused for any material whose colorappears white.
The ASTM’s E313 yellownessindex is used to determine thedegree to which a sample’s colorshifts away from an ideal white.The D1925 yellowness index isused for measuring plastics.
The same blue ink looks like a different color whenprinted on paper of various whiteness
20
Glossary absolute white – In theory, a mate-rial that perfectly reflects all lightenergy at every visible wavelength.In practice, a solid white with knownspectral reflectance data that is usedas the “reference white” for all meas-urements of absolute reflectance.When calibrating a spectropho-tometer, often a white ceramicplaque is measured and used as theabsolute white reference.
absorb/absorption – Dissipation ofthe energy of electromagnetic wavesinto other forms (e.g., heat) as aresult of its interaction with matter; adecrease in directional transmittanceof incident radiation, resulting in amodification or conversion of theabsorbed energy.
achromatic color – A neutral colorthat has no hue (white, gray or black).
additive primaries – Red, greenand blue light. When all three addi-tive primaries are combined at 100%intensity, white light is produced.When these three are combined atvarying intensities, a gamut ofdifferent colors is produced.Combining two primaries at 100%produces a subtractive primary,either cyan, magenta or yellow:
100% red + 100% green = yellow100% red + 100% blue = magenta100% green + 100% blue = cyan
See subtractive primaries
appearance – An object’s or mate-rial’s manifestation through visualattributes such as size, shape, color,texture, glossiness, transparency,opacity, etc.
artificial daylight – Term looselyapplied to light sources, frequentlyequipped with filters, that try toreproduce the color and spectraldistribution of daylight. A morespecific definition of the light sourceis preferred.
attribute – Distinguishing character-istic of a sensation, perception ormode of appearance. Colors areoften described by their attributes ofhue, chroma (or saturation) andlightness.
black – In theory, the completeabsorption of incident light; theabsence of any reflection. In prac-tice, any color that is close to thisideal in a relative viewing situation —i.e., a color of very low saturationand very low luminance.
brightness – The dimension of colorthat refers to an achromatic scale,ranging from black to white. Alsocalled lightness, luminousreflectance or transmittance (q.v.).Because of confusion with satura-tion, the use of this term should bediscouraged.
c* – Abbreviation for chromaticity.
chroma/chromaticity – The inten-sity or saturation level of a particularhue, defined as the distance ofdeparture of a chromatic color fromthe neutral (gray) color with thesame value. In an additive color-mixing environment, imagine mixinga neutral gray and a vivid red withthe same value. Starting with theneutral gray, add small amounts ofred until the vivid red color isachieved. The resulting scaleobtained would represent increasingchroma. The scale begins at zero forneutral colors, but has no arbitraryend. Munsell originally established10 as the highest chroma for avermilion pigment and related otherpigments to it. Other pigments withhigher chroma were noted, but theoriginal scale remained. The chromascale for normal reflecting materialsmay extend as high as 20, and forfluorescent materials it may be ashigh as 30.
chromatic – Perceived as having ahue — not white, gray or black.
chromaticity coordinates (CIE) –The ratios of each of the three tris-timulus values X, Y and Z in relationto the sum of the three — desig-nated as x, y and z respectively.They are sometimes referred to asthe trichromatic coefficients. Whenwritten without subscripts, they areassumed to have been calculated forilluminant C and the 2° (1931) stan-dard observer unless specifiedotherwise. If they have been
21
obtained for other illuminants orobservers, a subscript describing theobserver or illuminant should beused. For example, x10 and y10 arechromaticity coordinates for the 10°observer and illuminant C.
chromaticity diagram (CIE) – Atwo-dimensional graph of the chro-maticity coordinates (x as theabscissa and y as the ordinate),which shows the spectrum locus(chromaticity coordinates of mono-chromatic light, 380-770nm). It hasmany useful properties forcomparing colors of both luminousand non-luminous materials.
CIE (Commission Internationale del’Eclairage) – The InternationalCommission on Illumination, theprimary international organizationconcerned with color and colormeasurement.
CIE 1976 L*a*b* color space – Auniform color space utilizing anAdams-Nickerson cube root formula,adopted by the CIE in 1976 for usein the measurement of small colordifferences.
CIE 1976 L*u*v* color space – Auniform color space adopted in 1976.Appropriate for use in additive mixingof light (e.g., color TV).
CIE chromaticity coordinates –See chromaticity coordinates (CIE).
CIE chromaticity diagram – Seechromaticity diagram (CIE).
CIE daylight illuminants – Seedaylight illuminants (CIE).
CIE luminosity function (y) – Seeluminosity function (CIE).CIE standard illuminants – Seestandard illuminants (CIE).
CIE standard observer – See stan-dard observer (CIE).
CIE tristimulus values – See tris-timulus values (CIE).
CIELAB (or CIE L*a*b*, CIE Lab) –Color space in which values L*, a*and b* are plotted using Cartesiancoordinate system. Equal distances
in the space approximately representequal color differences. Value L*represents lightness; value a* repre-sents the red/green axis; and valueb* represents the yellow/blue axis.CIELAB is a popular color space foruse in measuring reflective andtransmissive objects.
CMC (Colour MeasurementCommittee of the Society of Dyesand Colourists of Great Britain) –Organization that developed andpublished in 1988 a more logical,ellipse-based equation based onL*C*h˚ color space for computing DE(see delta E*) values as an alterna-tive to the rectangular coordinates ofthe CIELAB color space.
color – One aspect of appearance; astimulus based on visual response tolight, consisting of the three dimen-sions of hue, saturation and light-ness.
color attribute – A three-dimen-sional characteristic of the appear-ance of an object. One dimensionusually defines the lightness, theother two together define the chro-maticity.
color difference – The magnitudeand character of the differencebetween two colors under specifiedconditions.
color-matching functions –Relative amounts of three additiveprimaries required to match eachwavelength of light. The term isgenerally used to refer to the CIEstandard observer color-matchingfunctions.
color measurement – Physicalmeasurement of light radiated, trans-mitted or reflected by a specimenunder specified condition and mathe-matically transformed into standard-ized colorimetric terms. These termscan be correlated with visual evalua-tions of colors relative to oneanother.
color model – A color-measurementscale or system that numericallyspecifies the perceived attributes ofcolor. Used in computer graphics
applications and by color measure-ment instruments.
color order systems – Systemsused to describe an orderly three-dimensional arrangement of colors.Three bases can be used forordering colors: 1) an appearancebasis (i.e., a psychological basis) interms of hue, saturation and light-ness; an example is the MunsellSystem; 2) an orderly additive colormixture basis (i.e., a psychophysicalbasis); examples are the CIE Systemand the Ostwald System; and 3) anorderly subtractive color mixturebasis; an example is the PlochereColor System based on an orderlymixture of inks.
color space – Three-dimensionalsolid enclosing all possible colors.The dimensions may be described invarious geometries, giving rise tovarious spacings within the solid.
color specification – Tristimulusvalues, chromaticity coordinates andluminance value, or other color-scalevalues, used to designate a colornumerically in a specified colorsystem.
color temperature – A measure-ment of the color of light radiated bya black body while it is being heated.This measurement is expressed interms of absolute scale, or degreesKelvin. Lower Kelvin temperaturessuch as 2400K are red; highertemperatures such as 9300K areblue. Neutral temperature is white, at6504K.
color wheel – The visible spectrum’scontinuum of colors arranged in acircle, where complementary colorssuch as red and green are locateddirectly across from each other.
colorants – Materials used to createcolors — dyes, pigments, toners,waxes, phosphors.
colorimeter – An optical measure-ment instrument that responds tocolor in a manner similar to thehuman eye — by filtering reflectedlight into its dominant regions of red,green and blue.
22
colorimetric – Of, or relating to,values giving the amounts of threecolored lights or receptors — red,green and blue.
colorist – A person skilled in the artof color matching (colorant formula-tion) and knowledgeable concerningthe behavior of colorants in a partic-ular material; a tinter (q.v.) (in theAmerican usage) or a shader. Theword “colorist” is of European origin.
complements – Two colors thatcreate neutral gray when combined.On a color wheel, complements aredirectly opposite from each other:blue/yellow, red/green and so on.
contrast – The level of variationbetween light and dark areas in animage.
D65 – The CIE standard illuminantthat represents a color temperatureof 6504K. This is the color tempera-ture most widely used in graphicarts industry viewing booths. SeeKelvin (K).
daylight illuminants (CIE) – Seriesof illuminant spectral power distribu-tion curves based on measurementsof natural daylight and recommendedby the CIE in 1965. Values aredefined for the wavelength region300 to 830nm. They are described interms of the correlated color temper-ature. The most important is D65because of the closeness of itscorrelated color temperature to thatof illuminant C, 6774K. D75 bluerthan D65 and D55 yellower than D65are also used.
delta (D or ∆) – A symbol used toindicate deviation or difference.
delta E*, delta e* – The total colordifference computed with a colordifference equation (∆Eab or ∆Ecmc).In color tolerancing, the symbol DEis often used to express Delta Error.
dye – A soluble colorant — asopposed to pigment, which is insol-uble.
dynamic range – An instrument’srange of measurable values, fromthe lowest amount it can detect tothe highest amount it can handle.
electromagnetic spectrum – Themassive band of electromagneticwaves that pass through the air indifferent sizes, as measured bywavelength. Different wavelengthshave different properties, but mostare invisible — and some completelyundetectable — to human beings.Only wavelengths that are between380 and 720 nanometers are visible,producing light. Waves outside thevisible spectrum include gammarays, x-rays, microwaves and radiowaves.
emissive object – An object thatemits light. Emission is usuallycaused by a chemical reaction, suchas the burning gasses of the sun orthe heated filament of a light bulb.
fluorescent lamp – A glass tubefilled with mercury gas and coatedon its inner surface with phosphors.When the gas is charged with anelectrical current, radiation isproduced. This, in turn, energizes thephosphors, causing them to glow.
gloss – An additional parameter toconsider when determining a colorstandard, along with hue, value,chroma, the texture of a material andwhether the material has metallic orpearlescent qualities. Gloss is anadditional tolerance that may bespecified in the Munsell ColorTolerance Set. The general rule forevaluating the gloss of a colorsample is the higher the gloss unit,the darker the color sample willappear. Conversely, the lower thegloss unit, the lighter a sample willappear.
Gloss is measured in gloss units,which use the angle of measurementand the gloss value (e.g. 60˚ gloss =29.8). A 60˚ geometry is recom-mended by the American Society forTesting and Materials (ASTM) D523standard for the general evaluationof gloss.
grayscale – An achromatic scaleranging from black through a seriesof successively lighter grays to white.Such a series may be made up ofsteps that appear to be equallydistant from one another (such asthe Munsell Value Scale), or it may
be arranged according to some othercriteria such as a geometric progres-sion based on lightness. Such scalesmay be used to describe the relativeamount of difference between twosimilar colors.
hue – 1) The first element in thecolor-order system, defined as theattribute by which we distinguish redfrom green, blue from yellow, etc.Munsell defined five principal hues(red, yellow, green, blue and purple)and five intermediate hues (yellow-red, green-yellow, blue-green,purple-blue and red-purple. These 10hues (represented by their corre-sponding initials R, YR, Y, GY, G,BG, B, PB, P and RP) are equallyspaced around a circle divided into100 equal visual steps, with the zeropoint located at the beginning of thered sector. Adjacent colors in thiscircle may be mixed to obtain contin-uous variation from one hue toanother. Colors defined around thehue circle are known as chromaticcolors. 2) The attribute of color bymeans of which a color is perceivedto be red, yellow, green, blue, purple,etc. White, black and gray possessno hue.
illuminant – Mathematical descrip-tion of the relative spectral powerdistribution of a real or imaginarylight source — i.e., the relativeenergy emitted by a source at eachwavelength in its emission spectrum.Often used synonymously with “lightsource” or “lamp,” though such usageis not recommended.
illuminant A (CIE) – Incandescentillumination, yellow-orange in color,with a correlated color temperatureof 2856K. It is defined in the wave-length range of 380 to 770nm.
illuminant C (CIE) – Tungsten illumi-nation that simulates averagedaylight, bluish in color, with a corre-lated color temperature of 6774K.
illuminants D (CIE) – Daylight illu-minants, defined from 300 to 830nm(the UV portion 300 to 380nm beingnecessary to correctly describecolors that contain fluorescent dyesor pigments). They are designated asD, with a subscript to describe the
Glossarycontinued
23
correlated color temperature; D65 isthe most commonly used, having acorrelated color temperature of6504K, close to that of illuminant C.They are based on actual measure-ments of the spectral distribution ofdaylight.
integrating sphere – A spheremanufactured or coated with a highlyreflective material that diffuses lightwithin it.
Kelvin (K) – Unit of measurementfor color temperature. The Kelvinscale starts from absolute zero,which is -273˚ Celsius.
light – 1) Electromagnetic radiationof which a human observer is awarethrough the visual sensations thatarise from the stimulation of theretina of the eye. This portion of thespectrum includes wavelengths fromabout 380 to 770nm. Thus, to speakof ultraviolet light is incorrectbecause the human observer cannotsee radiant energy in the ultravioletregion. 2) Adjective meaning highreflectance, transmittance or level ofillumination as contrasted to dark, orlow level of intensity.
light source – An object that emitslight or radiant energy to which thehuman eye is sensitive. The emissionof a light source can be described bythe relative amount of energyemitted at each wavelength in thevisible spectrum, thus defining thesource as an illuminant. The emis-sion also may be described in termsof its correlated color temperature.
lightness – Perception by whichwhite objects are distinguished fromgray, and light-colored objects fromdark-colored.
luminosity function (y) (CIE) – Aplot of the relative magnitude of thevisual response as a function ofwavelength from about 380 to780nm, adopted by CIE in 1924.
metamerism – A phenomenonexhibited by a pair of colors thatmatch under one or more sets of illu-minants (be they real or calculated),but not under all illuminants.Munsell Color System – The color
identification of a specimen by itsMunsell hue, value and chroma asvisually estimated by comparisonwith the Munsell Book of Color.
nanometer (nm) – Unit of lengthequal to 10-9 meter (a.k.a. onebillionth of a meter, or a milli-micron).
observer – The human viewer whoreceives a stimulus and experiencesa sensation from it. In vision, thestimulus is a visual one and thesensation is an appearance.
observer, standard – See standardobserver.
radiant energy – A form of energyconsisting of the electromagneticspectrum, which travels at 299,792kilometers/second (186,206miles/second) through a vacuum,and more slowly in denser media(air, water, glass, etc.). The nature ofradiant energy is described by itswavelength or frequency, although italso behaves as distinct quanta(“corpuscular theory”). The varioustypes of energy may be transformedinto other forms of energy (electrical,chemical, mechanical, atomic,thermal, radiant), but the energyitself cannot be destroyed.
reflectance – The ratio of the inten-sity of reflected radiant flux to that ofincident flux. In popular usage, it isconsidered the ratio of the intensityof reflected radiant energy to thatreflected from a defined referencestandard.
reflectance, specular – See spec-ular reflectance.
reflectance, total – See totalreflectance.
saturation – The attribute of colorperception that expresses theamount of departure from a gray ofthe same lightness. All grays havezero saturation (ASTM). Seechroma/chromaticity.
scattering – Diffusion or redirection ofradiant energy encountering particlesof different refractive index. Scatteringoccurs at any such interface, at the
surface, or inside a medium containingparticles.
spectral power distribution curve– Intensity of radiant energy as afunction of wavelength, generallygiven in relative power terms.
spectrophotometer – Photometricdevice that measures spectral trans-mittance, spectral reflectance or rela-tive spectral emittance.
spectrophotometric curve – Acurve measured on a spectropho-tometer; a graph with relativereflectance or transmittance (orabsorption) as the ordinate, plottedwith wavelength or frequency as theabscissa.
spectrum – Spatial arrangement ofcomponents of radiant energy inorder of their wavelengths, wavenumber or frequency.
specular gloss – Relative luminousfractional reflectance from a surfacein the mirror or specular direction. Itis sometimes measured at 60˚ rela-tive to a perfect mirror.
specular reflectance – Reflectanceof a beam of radiant energy at anangle equal but opposite to the inci-dent angle; the mirror-like reflectance.The magnitude of the specularreflectance on glossy materialsdepends on the angle and the differ-ence in refractive indices betweentwo media at a surface. The magni-tude may be calculated fromFresnel’s Law.
specular reflectance excluded(SCE) – Measurement of reflectancemade in such a way that the spec-ular reflectance is excluded from themeasurement; diffuse reflectance.The exclusion may be accomplishedby using 0˚ (perpendicular) incidenceon the samples. This then reflectsthe specular component of thereflectance back into the instrumentby use of black absorbers or lighttraps at the specular angle when theincident angle is not perpendicular,or in directional measurements bymeasuring at an angle different fromthe specular angle.
24
specular reflectance included(SCI) – Measurement of the totalreflectance from a surface, includingthe diffuse and specular reflectances.
standard – A reference againstwhich instrumental measurementsare made.
standard illuminants (CIE) –Known spectral data established bythe CIE for four different types oflight sources. When using tristimulusdata to describe a color, the illumi-nant must also be defined. Thesestandard illuminants are used inplace of actual measurements of thelight source.
standard observer (CIE) – 1) Ahypothetical observer having the tris-timulus color-mixture data recom-mended in 1931 by the CIE for a 2˚viewing angle. A supplementaryobserver for a larger angle of 10˚was adopted in 1964. 2) The spectralresponse characteristics of theaverage observer defined by theCIE. Two such sets of data aredefined, the 1931 data for the 2˚visual field (distance viewing) andthe 1964 data for the annular 10˚visual field (approximately arm’slength viewing). By custom, theassumption is made that if theobserver is not specified, the tristim-ulus data has been calculated for the1931, or 2˚ field observer. The use ofthe 1964 data should be specified.
subtractive primaries – Cyan,magenta and yellow. Theoretically,when all three subtractive primariesare combined at 100% on whitepaper, black is produced. Whenthese are combined at varying inten-sities, a gamut of different colors isproduced. Combining two primariesat 100% produces an additiveprimary, either red, green or blue:
100% cyan + 100% magenta = blue100% cyan + 100% yellow = green100% magenta + 100% yellow = red
tint – 1) verb: To mix white pigmentwith absorbing (generally chromatic)colorants. 2) noun: The colorproduced by mixing white pigmentwith absorbing (generally chromatic)colorants. The resulting mixture is
lighter and less saturated than thecolor without the white added.
total reflectance – Reflectance ofradiant flux reflected at all anglesfrom the surface, thus including bothdiffuse and specular reflectances.
transparent – Describes a materialthat transmits light without diffusionor scattering.
tristimulus – Of, or consisting of,three stimuli; generally used todescribe components of additivemixture required to evoke a partic-ular color sensation.
tristimulus colorimeter – An instru-ment that measures tristimulusvalues and converts them to chro-maticity components of color.
tristimulus values (CIE) –Percentages of the components in athree-color additive mixture necessaryto match a color; in the CIE system,they are designated as X, Y and Z.The illuminant and standard observercolor-matching functions used mustbe designated; if they are not, theassumption is made that the valuesare for the 1931 observer (2˚ field)and illuminant C. The values obtaineddepend on the method of integrationused, the relationship of the nature ofthe sample and the instrument designused to measure the reflectance ortransmittance. Tristimulus values arenot, therefore, absolute values char-acteristic of a sample, but relativevalues dependent on the methodused to obtain them. Approximationsof CIE tristimulus values may beobtained from measurements madeon a tristimulus colorimeter that givesmeasurements generally normalizedto 100. These must then be normal-ized to equivalent CIE values. Thefilter measurements should be prop-erly designated as R, G and Binstead of X, Y and Z.
value – Indicates the degree of light-ness or darkness of a color in rela-tion to a neutral gray scale. Thescale of value (or V, in the Munsellsystem of color notation) rangesfrom 0 for pure black to 10 for purewhite. The value scale is neutral orwithout hue.
X – 1) One of the three CIE tristim-ulus values; the red primary. 2)Spectral color-matching functions ofthe CIE standard observer used forcalculating the X tristimulus value. 3)One of the CIE chromaticity coordi-nates calculated as the fraction ofthe sum of the three tristimulusvalues attributable to the X value.
Y – 1) One of the three CIE tristim-ulus values, equal to the luminousreflectance or transmittance; thegreen primary. 2) Spectral color-matching function of the CIE stan-dard observer used for calculating Ytristimulus value. 3) One of the CIEchromaticity coordinates calculatedas the fraction of the sum of thethree tristimulus values, attributableto the Y value.
Z – 1) One of the three CIE tristim-ulus values; the blue primary. 2)Spectral color-matching function ofthe CIE standard observer used forcalculating the Z tristimulus value. 3)One of the CIE chromaticity coordi-nates calculated as the fraction ofthe sum of the three tristimulusvalues attributable to the Z primary.
Glossarycontinued
L10-001 (03/07) Printed in U.S.A.
xrite.com
Corporate Headquarters - USA4300 44th Street SEGrand Rapids, Michigan 49512Phone 1 800 248 9748 or 1 616 803 2100Fax 1 800 292 4437 or 1 616 803 2705
Corporate Headquarters - EuropeAlthardstrasse 708105 RegensdorfSwitzerlandPhone (+41) 44 842 24 00Fax (+41) 44 842 22 22
Corporate Headquarters - AsiaRoom 808-810Kornhill Metro Tower, 1 Kornhill RoadQuarry Bay, Hong KongPhone (+852) 2 568 6283Fax (+852) 2 885 8610
Please visit xrite.com for a local office near you.