A Guide To The European Loan Market · Standard & Poor’s 55 Water Street New York, NY 10041 A...
62
A Guide To The European Loan Market January 2010
Transcript of A Guide To The European Loan Market · Standard & Poor’s 55 Water Street New York, NY 10041 A...

www.standardandpoors.com
Standard & Poor’s55 Water StreetNew York, NY 10041
A Guide To The European Loan Market
January 2010

I don’t like surprises—especially in my leveraged loan portfolio.
That’s why I insist on Standard & Poor’s Bank Loan & Recovery Ratings.
All loans are not created equal. And distinguishing the well secured from those that aren’t is easier with a Standard & Poor’s Bank Loan & Recovery Rating. Objective, widely recognized benchmarks developed by dedicated loan and recovery analysts, Standard & Poor’s Bank Loan & Recovery Ratings are determined through fundamental, deal-specifi c analysis. The kind of analysis you want behind you when you’re trying to gauge your chances of capital recovery. Get the information you need. Insist on Standard & Poor’s Bank Loan & Recovery Ratings.
The credit-related analyses, including ratings, of Standard & Poor’s and its affiliates are statements of opinion as of the date they are expressed and not statements of fact or recommendations to purchase, hold, or sell any securities or to make any investment decisions. Ratings, credit-related analyses, data, models, software and output therefrom should not be relied on when making any investment decision. Standard & Poor’s opinions and analyses do not address the suitability of any security. Standard & Poor’s does not act as a fiduciary or an investment advisor.
Copyright © 2010 Standard & Poor’s, a division of The McGraw-Hill Companies, Inc. All rights reserved.STANDARD & POOR’S is a registered trademark of The McGraw-Hill Companies, Inc.

A Guide To The European Loan MarketJanuary 2010

Published by Standard & Poor's Financial Services LLC, a subsidiary of The McGraw-Hill Companies, Inc. Executive and Editorial offices: 55 Water Street, New York, NY 10041. Subscriber services: (1) 212-438-7280. Copyright © 2009 by Standard & Poor’s Financial Services LLC (S&P). All rights reserved.
No part of this information may be reproduced or distributed in any form or by any means, or stored in a database or retrieval system, without the prior written permission of S&P. S&P, its affiliates, and/or their third-party providers have exclusive proprietary rights in the information, including ratings, credit-related analyses and data, provided herein. This information shall not be used for any unlawful or unauthorized purposes. Neither S&P, nor its affiliates, nor their third-party providers guarantee the accuracy, completeness, timeliness or availability of any information. S&P, its affiliates or their third-party providers and their directors, officers, shareholders, employees or agents are not responsible for any errors or omissions, regardless of the cause, or for the results obtained from the use of such information. S&P, ITS AFFILIATES AND THEIR THIRD-PARTY PROVIDERS DISCLAIM ANY AND ALL EXPRESS OR IMPLIED WARRANTIES, INCLUDING, BUT NOT LIMITED TO, ANY WARRANTIES OF MERCHANTABILITY OR FITNESS FOR A PARTICULAR PURPOSE OR USE. In no event shall S&P, its affiliates or their third-party providers and their directors, officers, shareholders, employees or agents be liable to any party for any direct, indirect, incidental, exemplary, compensatory, punitive, special or consequential damages, costs, expenses, legal fees, or losses (including, without limitation, lost income or lost profits and opportunity costs) in connection with any use of the information contained herein even if advised of the possibility of such damages.
The ratings and credit-related analyses of S&P and its affiliates and the observations contained herein are statements of opinion as of the date they are expressed and not statements of fact or recommendations to purchase, hold, or sell any securities or make any investment decisions. S&P assumes no obligation to update any information following publication. Users of the information contained herein should not rely on any of it in making any investment decision. S&P’s opinions and analyses do not address the suitability of any security. S&P does not act as a fiduciary or an investment advisor. While S&P has obtained information from sources it believes to be reliable, S&P does not perform an audit and undertakes no duty of due diligence or independent verification of any information it receives. S&P keeps certain activities of its business units separate from each other in order to preserve the independence and objectivity of each of these activities. As a result, certain business units of S&P may have information that is not available to other S&P business units. S&P has established policies and procedures to maintain the confidentiality of certain non-public information received in connection with each analytical process.
S&P’s Ratings Services business may receive compensation for its ratings and credit-related analyses, normally from issuers or underwriters of securities or from obligors. S&P reserves the right to disseminate its opinions and analyses. S&P's public ratings and analyses are made available on its Web sites, www.standardandpoors.com (free of charge), www.globalcreditportal.com and www. ratingsdirect.com (subscription), and may be distributed through other means, including via S&P publications and third-party redistributors. Additional information about our ratings fees is available at www.standardandpoors.com/usratingsfees.
S&P uses billing and contact data collected from subscribers for billing and order fulfillment purposes, and occasionally to inform subscribers about products or services from S&P, its affiliates, and reputable third parties that may be of interest to them. All subscriber billing and contact data collected is stored in a secure database in the U.S. and access is limited to authorized persons. If you would prefer not to have your information used as outlined in this notice, if you wish to review your information for accuracy, or for more information on our privacy practices, please call us at (1) 212-438-7280 or write to us at: [email protected]. For more information about The McGraw-Hill Companies Customer Privacy Policy please visit www.mcgraw-hill.com/privacy.html. Privacy Notice Last Updated: 23 September, 2008.
Permissions: To reprint, translate, or quote Standard & Poor's publications, contact: Client Services, 55 Water Street, New York, NY 10041; (1) 212-438-9823; or by email to: [email protected].

Standard & Poor’s ● A Guide To The European Loan Market� January 2010 3
Sucheet Gupte Paul Watters
To Our Clients
Standard & Poor’s Leveraged Commentary & Data (LCD) and Standard & Poor’s Ratings Services are pleased to publish the fourth edition of our European Guide To The Loan Market, which provides commentary on the European leveraged loan
market covering a gamut of topics, including secondary trading, default, restructurings, and recovery. As usual, we have also updated and amended our primer on the European leveraged loan market.
After a tumultuous end to 2008, during which successive waves of forced selling had taken secondary prices to extremely distressed levels, 2009 has seen secondary prices recover to pre-Lehman levels, with the market differentiating far more based on credit fundamentals, as well as reflecting the relative value of security provided to support senior and subordinated debt instruments in the capital structure. At the beginning of September 2008, the average bid within the Standard & Poor’s European Leveraged Loan Index for senior loan issuers rated ‘BB’ was 89.98 and 86.40 for single ‘B’s. In contrast, as of the end of September 2009, double ‘BB’s had an average bid of 91.94 while single ‘B’s had an average bid of 79.90.
As we look ahead to 2010 what we can confidently predict is that little is predictable. The high-yield bond market is outpacing the loan market for now in Europe in terms of issuance, yet judging from the pick-up in primary market activity recently in the U.S., it would probably be a mistake to rule out European banks starting to underwrite transac-tions as the next year unfolds.
The last two years have severely tested the leveraged loan market in Europe. Many mar-ket assumptions and established practices about market, credit, and legal risk have had to be reassessed in light of recent events. Whether it is the volatility in loan pricing, forbear-ance from lenders keen to avoid addressing overlevered balance sheets, or using pre-pack administration in the U.K. to cram down dissenting minority interests in a restructuring, there have been many material developments that loan market participants now have to factor into their future lending and investment decisions.
These are all issues that Standard & Poor’s strives to incorporate into our loan, high yield bond and recovery ratings as well as through the market leading research and commentary that Standard & Poor’s LCD provides to the leveraged loan, distressed, and high-yield mar-kets in Europe. In addition, Standard & Poor’s continues to work with 15 of the most active European leveraged loan institutions to pool their default and recovery experience. The European Leveraged Loan Study, now its fifth year, is starting to generate, really for the first time given the severity of this default cycle, some robust data around default and post- default recovery that over time will better inform investors about the risk characteristics of this asset class.
If you want to learn more about our loan market services, all the appropriate contact infor-mation is listed in the back of this publication. We welcome questions, suggestions, and feed-back of all kinds on our products and services, including this annual Guide. You can access this report and other relevant articles on LCD’s website, www.lcdcomps.com, as well as Standard & Poor’s loan rating website that includes a link to all our current loan and recov-ery ratings: www.bankloanrating.standardandpoors.com or www.sandprecoveryratings.com.


5Standard & Poor’s ● A Guide To The European Loan Market� January 2010
Contents
A Primer For The European Syndicated Loan Market 7
Loans Limp Along, High-Yield Strides Out As Europe Moves Into Recovery Mode In 2009 31
Western European Leveraged Loan Defaults Should Have Peaked In Q3 2009, But Only Gradually Fall In 2010 37
LBO Performance In Europe Falls Behind Expectations As Recession Bites 43
Is History Repeating Itself In The European High-Yield Market? 50
Charting The Evolution Of Post-Default Recovery Prospects At U.K.-Based Countrywide 54
Key Contacts 58


Standard & Poor’s ● A Guide To The European Loan Market� January 2010 7
A Primer For The European
Syndicated Loan Market
A syndicated loan is one that is provided by a group of lenders and is structured, arranged, and administered by one or several commer-cial or investment banks known as arrangers. They are less expensive and more efficient to administer than traditional bilateral, or indi-vidual, credit lines.
At the most basic level, arrangers raise investor funds for an issuer in need of capi-tal. The issuer pays the arranger a fee for this service, and, naturally, this fee increases with the loan’s complexity and riskiness. In the U.S., corporate borrowers and private equity sponsors fairly even-handedly drive debt issuance. Europe, however, has far less cor-porate activity and its issuance is dominated by private equity sponsors, who, in turn, determine many of the standards and prac-tices of loan syndication.
High-quality, or investment grade, compa-nies pay lower fees for loans than do specula-tive-grade, or leveraged, borrowers. However, investment-grade companies generally require just a plain-vanilla loan, typically an unse-cured revolving credit instrument that is used to provide support for short-term commercial paper borrowings or for working capital.
Leveraged borrowers carry riskier credit profiles and thus pay higher fees for more complex loans. These loans, which are gener-ally secured, also require spreads (premiums
above Euribor or LIBOR, depending on the currency) sufficient to attract investor appe-tite for this relatively risky asset class, typi-cally Euribor + 200 or higher.
The “retail” market for a syndicated loan consists of banks and, in the case of leveraged transactions, finance companies, hedge funds, and institutional investors. The balance of power among these different investors groups is different in the U.S. than in Europe. The U.S. has a capital market where pricing is linked to credit quality and institutional investor appetite. In Europe, although institu-tional investors have increased their market presence over the past few years, banks remain a key part of the market. Conse-quently, although market-flex language has become standard, pricing is not yet fully driven by capital market forces.
Banks have historically dominated the Euro-pean debt markets because of the intrinsically regional nature of the arena. Regional banks have traditionally funded local and regional enterprises because they are familiar with regional issuers and can fund in the local cur-rency. Since the Eurozone was formed in 1998, the growth of the European leveraged loan market has been fuelled by the efficiency pro-vided by this single currency as well as an overall growth in merger and acquisition (M&A) activity, particularly leveraged buyouts
Corporate lending is the primary route that European compa-
nies use to access the debt markets, unlike in the U.S., where
high-yield bond issuance plays a significant role. Since the euro
launched in 1999, the syndicated loan market in particular has
become the dominant way for European issuers to tap banks and
other institutional capital providers for loans.
Robert Polenberg New York (1) 212-438-2717
Marina Lukatsky New York (1) 212-438-2709
Sucheet C. Gupte London (44) 20-7176-7235

A Primer For The European Syndicated Loan Market
www.standardandpoors.com8
(LBO) due to private equity activity. Regional barriers (and sensitivities toward consolida-tion across borders) have fallen, economies have grown, and the euro has helped to bridge currency gaps.
As a result, more and more leveraged buy-outs have occurred over the past few years and, more significantly, they have grown in size as arrangers have been able to raise big-ger pools of capital to support larger, multi-national transactions. To fuel this growing market, a broader array of banks from multi-ple regions now funds these deals, along with European institutional investors as well as U.S. institutional investors.
The European market has taken advantage of many of the lessons from the U.S. market while maintaining its regional diversity. In Europe, the regional diversity allows banks to maintain a significant lending influence and fosters private equity’s dominance in the market.
Types Of SyndicationsGlobally, there are three types of syndications: an underwritten deal, a “best-efforts” syndi-cation, and a “club deal.” The European lev-eraged syndicated loan market almost exclusively consists of underwritten deals, whereas the U.S. market is mostly best-efforts.
Underwritten deal
An underwritten deal is one for which the arrangers guarantee the entire commitment, and then syndicate the loan to other banks and institutional investors. If they cannot fully subscribe the loan, they absorb the difference and may later try again to sell to investors. This is easy, of course, if market conditions or the credit’s fundamentals im–prove. If not, the arranger may be forced to hold a larger posi-tion on its balance sheet than originally planned. Alternatively, they may have to sell at a discount and, potentially, even take a loss on the paper. Of course, with flex-language now widely accepted, underwriting a deal does not carry the same risk as it did when the pricing was set in stone before syndication.
Best-efforts syndication
A best-efforts syndication is one for which the arranger group commits to underwrite less than the entire amount of the loan, leav-ing the credit to market vicissitudes. If the
loan is undersubscribed, the credit may not close—or may need major surgery to clear the market.
Club deal
A “club deal” is a smaller loan (usually E150 million or less, but determined by the regional banks’ appetite for risk) that is pre-marketed to a group of relationship lenders. The arranger is generally a first among equals, and each lender gets a full cut, or nearly a full cut, of the fees. Club deals are traditionally rare from the perspective of transactions syndicated across regions, but they are common regional plays in Europe, where regional banks provide the funding.
Club deals became much more prominent during 2008/2009 as the credit crunch side-lined the bulk of institutional investors, and banks scaled back their lending. During this period club deals of more than E150 million became common.
The Syndication Process
Purpose and preparation in leveraged lending
Leveraged transactions fund a number of purposes. They provide support for general corporate purposes, including capital expen-ditures, working capital, and expansion. They refinance the existing capital structure or support a full recapitalization including, not infrequently, the payment of a dividend to the equity holders. Their primary purpose, however, is to fund M&A activity, specifi-cally leveraged buyouts, where the buyer uses the debt markets to acquire the acquisition target’s equity.
The core of European leveraged lending comes from borrowers owned by private equity funds. In the U.S., these are called “sponsored transactions.” In Europe, all sponsor-related activity, including refinancings and recapitalizations, are referred to as LBOs.
The transaction originates well before lend-ers see the transaction’s terms. In an LBO, the company is first put up for auction. A com-pany that is for the first time up for sale to private equity sponsors is a primary LBO. A secondary LBO is one that is going from one sponsor to another sponsor (and a tertiary LBO is one that is going for the second time from sponsor to sponsor). A public-to-private transaction (P2P) occurs when a company is

Standard & Poor’s ● A Guide To The European Loan Market� January 2010 9
going from the public domain to a private equity sponsor.
As prospective acquirers are evaluating tar-get companies, they are also lining up debt financing. A staple financing package may be on offer as part of the sale process. By the time the auction winner is announced, that acquirer usually has funds lined up via a financing package funded by its designated mandated lead arrangers (MLA).
Where the loan is not part of a competitive auction, an issuer usually solicits bids from arrangers before awarding a mandate. The competing banks will outline their syndication strategy and qualifications, as well as their view on the way the loan will price in the market. In Europe, where mezzanine funding is a market standard, issuers may choose to pursue a dual track approach to syndication whereby the MLAs handle the senior debt and a specialist mezzanine fund oversees place-ment of the subordinated mezzanine portion.
The information memo, or “bank book”
Once the mandate is awarded, the syndica-tion process starts. The arranger will prepare an information memo (IM) describing the terms of the transactions. The IM typically will include an executive summary, invest-ment considerations, a list of terms and con-ditions, an industry overview, and a financial model. Because loans are not securities, this will be a confidential offering made only to qualified banks and accredited investors. If the issuer is speculative grade and seeking capital from nonbank investors, the arranger will often prepare a “public” version of the IM. This version will be stripped of all con-fidential material such as management finan-cial projections so that it can be viewed by accounts that operate on the public side of the wall or that want to preserve their abil-ity to buy bonds or stock or other public securities of the particular issuer (see the Public Versus Private section below). Investors that view materially nonpublic information of a company are disqualified from buying the company’s public securities for some period of time.
As the IM (or “bank book,” in traditional market lingo) is being prepared, the syndicate desk will solicit informal feedback from potential investors on what their appetite for the deal will be and at what price they are willing to invest. Once this intelligence has
been gathered, the agent will formally market the deal to potential investors.
The executive summary will include a description of the issuer, an overview of the transaction and rationale, sources and uses, and key statistics on the financials.
Investment considerations will be, basically, management’s sales “pitch” for the deal.
The list of terms and conditions will be a preliminary term sheet describing the pricing, structure, collateral, covenants, and other terms of the credit (covenants are usually negotiated in detail after the arranger receives investor feedback).
The industry overview will describe the company’s industry and competitive position relative to its industry peers.
The financial model will be a detailed model of the issuer’s historical, pro forma, and projected financials including manage-ment’s high, low, and base case for the issuer.
Most new acquisition-related loans are kicked off at a bank meeting at which poten-tial lenders hear management and the spon-sor group describe what the terms of the loan are and what transaction it backs. Management will provide its vision for the transaction and, most important, tell why and how the lenders will be repaid on or ahead of schedule. In addition, investors will be briefed regarding the multiple exit strate-gies, including second ways out via asset sales. (If it is a small deal or a refinancing instead of a formal meeting, there may be a series of calls or one-on-one meetings with potential investors.)
Once the loan is closed, the final terms are then documented in detailed credit and secu-rity agreements. Subsequently, liens are per-fected and collateral is attached.
Loans, by their nature, are flexible docu-ments that can be revised and amended from time to time. These amendments require differ-ent levels of approval (see Voting Rights sec-tion below). Amendments can range from something as simple as a covenant waiver to something as complex as a change in the col-lateral package or allowing the issuer to stretch out its payments or make an acquisition.
The loan investor market
Loans are “launched” to the market in a series of steps. The roles of each of the play-ers in the each of those phases are based on their relationships in the market and access to
A Primer For The European Syndicated Loan Market
www.standardandpoors.com10
paper. On the arrangers’ side, the players are determined by how well they can access capi-tal in the market and bring in lenders. On the lenders’ side, it’s about getting access to as many deals as possible.
There are three primary phases of syndica-tion. During the underwriting phase, the spon-sor or corporate borrower designates the MLA (or the group of MLAs) and the deal is ini-tially underwritten. During the sub-under-writing phases, other arrangers are brought into the deal. In general syndication, the trans-action is opened up to the institutional inves-tor market, along with other banks that are interested in participating in the transaction.
There are two primary investor consti-tuencies in Europe: banks and institutional investors.
Banks in the U.S. can be a commercial bank, a savings and loan institution, or a securities firm that usually provides invest-ment-grade loans. In Europe, the banking segment is almost exclusively made up of commercial banks. For leveraged loans, European banks fund and hold all tranches within the credit structure. U.S. banks typi-cally provide any unfunded revolving credits and letters of credit (LOC); it is becoming increasingly less common for them to fund amortizing term loans under a syndicated loan agreement.
Institutional investors in the loan market are principally structured vehicles known as col-lateralized loan obligations (CLO). In the U.S., a large part of the institutional investor market funds loan participation mutual funds (known as “prime funds” because they were originally pitched to investors as a money-market-like fund that would approximate the prime rate). Although U.S. prime funds do make alloca-tions to the European loan market, there is no European version of prime funds.
Additionally, private equity funds, hedge funds, high-yield bond funds, pension funds, insurance companies, and other proprietary investors do participate opportunistically in loans
CLOs are special-purpose vehicles set up to hold and manage pools of leveraged loans. The special-purpose vehicle is financed with several tranches of debt (typically a ‘AAA’ rated tranche, a ‘AA’ tranche, a ‘BBB’ tranche, and a mezzanine tranche) that have rights to the collateral and payment stream in descending order. In addition, there is an
equity tranche, but the equity tranche is usu-ally not rated. CLOs are created as arbitrage vehicles that generate equity returns through leverage, by issuing debt 10 to 11 times their equity contribution. There also are market-value CLOs that are less leveraged—typically three to five times—and allow managers more flexibility than more tightly structured arbitrage deals. CLOs are usually rated by two of the three major ratings agencies and impose a series of covenant tests on collat-eral managers, including minimum rating, industry diversification, and maximum default basket. CLOs traditionally were the dominant institutional investor vehicle in Europe. Over the past few years, other vehi-cles, such as credit funds, have begun to appear in the market.
Credit funds are open-ended pools of debt investments. Unlike CLOs, however, they are not subject to ratings oversight or restrictions regarding industry or rating diversification. They are generally lightly levered (two to three times) and allow managers significant freedom in picking and choosing investments and are subject to being marked to market.
Mezzanine funds are also investment pools, which traditionally focused on the mezzanine market only. However, when second lien entered the market, it eroded the mezzanine market; consequently, mezzanine funds expanded their investment universe and began to commit to second lien as well as payment-in-kind (PIK) portions of transac-tions. As with credit funds, these pools are not subject to ratings oversight or diversifica-tion requirements, and allow managers signif-icant freedom in picking and choosing investments. Mezzanine funds are, however, riskier than credit funds in that they carry both debt and equity characteristics.
Prime funds allow U.S. retail investors to access the loan market. They are mutual funds that invest in leveraged loans and are sold only in the U.S.—there is no European equivalent. How ever, U.S. prime funds have made significant allocations to investments in European loans; an estimated 10% of some of the largest funds in the U.S. are available for funding European loans.
Public Versus PrivateIn Europe, the line between public and pri-vate information in the loan market is far

Standard & Poor’s ● A Guide To The European Loan Market� January 2010 11
simpler than in the U.S. European loans are strictly on the private side of the wall and any information transmitted between the issuer and the lender group is considered con-fidential. High-yield bonds are public instru-ments. However, because most European debt is in the form of loans, privacy reigns.
In the U.S., since the late 1980s, that line has begun to blur as a result of two market innovations. The first was more active sec-ondary trading that sprung up to support (1) the entry of nonbank investors in the market, such as insurance companies and loan mutual funds and (2) to help banks sell rapidly expanding portfolios of distressed and highly leveraged loans that they no lon-ger wanted to hold. This meant that parties that were insiders on loans might now exchange confidential information with traders and potential investors who were not (or not yet) a party to the loan. The sec-ond innovation that weakened the public-private divide was trade journalism that focuses on the loan market. In Europe, the same trends began to emerge, thanks in part to a period of rapid growth in the institu-tional investor base.
Nonetheless, there has been growing con-cern among issuers, lenders, and regulators in the U.S. and Europe that this migration of once-private information into public hands might breach confidentiality agreements between lenders and issuers and, more impor-tantly, could lead to illegal trading. The mar-ket has contended with these issues through: • Traders. To insulate themselves from violat-
ing regulations, some dealers and buyside firms have set up their trading desks on the public side of the wall. Consequently, trad-ers, salespeople, and analysts do not receive private information even if somewhere else in the institution the private data are avail-able. This is the same technique that invest-ment banks have used from time immemorial to separate their private invest-ment banking activities from their public trading and sales activities.
• Underwriters. As mentioned above, in most primary syndications, arrangers will pre-pare a public version of an information memo that is scrubbed of private informa-tion like projections. These memos will be distributed to accounts that are on the pub-lic side of the wall. In addition, underwrit-ers will ask public accounts to attend a
public version of the bank meeting and dis-tribute to these accounts only scrubbed financial information.
• Buy-side accounts. On the buy side there are firms that operate on either side of the public-private fence. Accounts that operate on the private side receive all confidential materials and agree to not trade in public securities of the issuers for which they get private information. These groups are often part of wider investment complexes that do have public funds and portfolios but, via Chinese walls, are sealed from these parts of the firms. There are also accounts that are public. These firms take only public IMs and public materials and, therefore, retain the option to trade in the public securities markets even when an issuer for which they own a loan is involved. This can be tricky to pull off in practice because in the case of an amendment the lender could be called on to approve or decline in the absence of any real information. Or, the account could either designate one per-son who is on the private side of the wall to sign off on amendments or empower its trustee or the loan arranger to do so. But it’s a complex proposition.
• Vendors. Vendors of loan data, news, and prices also face many challenges in manag-ing the flow of public and private informa-tion. In general, the vendors operate under the freedom of the press provision of the U.S. Constitution’s First Amendment and report on information in a way that any-one can simultaneously receive it—for a price of course. Therefore, the information is essentially made public in a way that doesn’t deliberately disadvantage any party, whether it’s a news story discussing the progress of an amendment or an acquisi-tion, or it’s a price change reported by a mark-to-market service. This, of course, doesn’t deal with the underlying issue that someone who is a party to confidential information is making it available via the press or prices to a broader audience.Another way in which participants deal
with the public-versus-private issue is to ask counterparties to sign indemnity (“big-boy”) letters acknowledging that there may be information they are not privy to and they are agreeing to make the trade in any case. They are, effectively, big boys and will accept the risks.

A Primer For The European Syndicated Loan Market
www.standardandpoors.com12
Credit Risk: An OverviewPricing a loan requires arrangers to evaluate the risk inherent in a loan and to gauge investor appetite for that risk. The principal credit risk factors that banks and institu-tional investors contend with in buying loans are default risk and loss-given-default risk. Among the primary ways that accounts judge these risks are ratings, credit statistics, indus-try sector trends, management strength, and sponsor. All of these, together, tell a story about the deal.
Brief descriptions of the major risk factors follow.
Default risk
Default risk is simply the likelihood of a borrower’s being unable to pay interest or principal on time. It is based on the issuer’s financial condition, industry segment, and conditions in that industry and economic variables and intangibles, such as company management. Default risk is most visibly expressed by a public rating from Standard & Poor’s Ratings Services or another ratings agency. These ratings range from ‘AAA’ for the most creditworthy loans to ‘CCC’ for the least. The market is divided, roughly, into two segments: investment grade (loans rated ‘BBB-’ or higher) and leveraged (bor-rowers rated ‘BB+’ or lower). Default risk, of course, varies widely within each of these broad segments.
In the U.S., public loan ratings are a de facto requirement for issuers that wish to tap the leveraged loan market, which, as noted above, is now dominated by institutional investors. Unlike banks, which typically have large credit departments and adhere to inter-nal rating scales, fund managers rely on agency ratings to bracket risk and explain the overall risk of their portfolios to their own investors.
The European market is less transparent because public ratings are not commonly required to get a deal syndicated. This is a by-product of the bank dominance of the investor market as well as the strong relation-ship that exists between lenders and sponsors. Investors rely on their own understanding of default risk and their own assessment of the credit, rather than relying on independent credit analysis. CLO managers need ratings on the credits they invest in, to comply with their internal tests, but they usually obtain
private “credit estimates” from ratings agen-cies, rather than full public ratings.
It is important to note that default risk is much harder to quantify in Europe than in the U.S. because distressed transactions tend to privately restructure rather than publicly default. Due to the nature of the U.S. bank-ruptcy courts, their transparency and focus on restructuring versus liquidation, both borrow-ers and lenders are comfortable with public defaults. In Europe, both parties are subject to the vagaries of the array of bankruptcy regimes; as a result, they are more likely to come to a private restructuring and the influ-ence and support provided by sponsors in these events cannot be underestimated.
Up until the end of 2008, ratings in Europe were still primarily private, but as of December 2008, Standard and Poor’s will no longer give credit estimates on deals where the debt is worth more than E750 million, signaling a shift toward a greater role for public ratings in Europe.
Loss-given-default risk
Loss-given-default risk measures how severe a loss the lender would incur in the event of default. Investors assess this risk based on the collateral (if any) backing the loan as well as the amount of any priority debt and other claims that may affect the likely level of recov-eries. Lenders will also look to covenants to provide a way of coming back to the table early—that is, before other creditors—and renegotiating the terms of a loan if the issuer fails to meet financial targets. Investment-grade loans are, in most cases, senior unsecured instruments with loosely drawn covenants that apply only at incurrence, that is, only if an issuer makes an acquisition or issues debt. As a result, loss given default may be no different from risk incurred by other senior unsecured creditors. Leveraged loans, by contrast, are, in virtually all cases, senior secured instruments with tightly drawn maintenance covenants, i.e., covenants that are measured at the end of each quarter whether or not the issuer carries out any additional fund raising. Loan holders, therefore, almost always are first in line among prepetition creditors and, in many cases, are able to renegotiate with the issuer before the loan becomes severely impaired. It is no sur-prise, then, that loan investors historically fare much better than other creditors on a loss-given-default basis.

Standard & Poor’s ● A Guide To The European Loan Market� January 2010 13
Credit statistics
Investors use credit statistics to help calibrate both default risk and loss-given-default risk. These statistics include a broad array of financial data, including credit ratios measur-ing leverage (debt to capitalization and debt to EBITDA) and coverage (EBITDA to inter-est, EBITDA to debt service, operating cash flow to fixed charges). Of course, the ratios investors use to judge credit risk vary by industry. In addition to looking at trailing and pro forma ratios, investors look at man-agement’s projections and the assumptions behind these projections to see if the issuer’s game plan will allow it to pay its debt com-fortably. There are ratios that are most geared to assessing default risk. These include leverage and coverage. Then there are ratios that are suited for evaluating loss-given-default risk. These include collateral cover-age, or the value of the collateral underlying the loan relative to the size of the loan. The ratio of senior secured loans to junior debt in the capital structure is also used. Logically, the likely severity of loss-given-default for a loan increases with the size of the loan as a percentage of the overall debt structure. After all, if an issuer defaults on E100 million of debt, of which E10 million is in the form of senior secured loans, the loans are more likely to be fully covered in bankruptcy than if the loan totals E90 million
Industry sector
Industry is a factor, because sectors, natu-rally, go in and out of favor. At times, defen-sive loans (like consumer products) can be more appealing in a time of economic uncer-tainty, whereas cyclical borrowers (like chemicals or autos) can be more appealing during an economic upswing. The European market is not as industry diversified as the U.S. market, and is primarily dominated by a handful of industries such as cable, telecom, services, and chemicals.
Syndicating A Loan By FacilityMost loans are structured and syndicated to accommodate the two primary syndicated lender constituencies: banks (domestic and foreign) and institutional investors (primarily structured finance vehicles, mutual funds, and insurance companies). As such, leveraged loans consist of two parts:
• Pro rata debt consists of the revolving credit and amortizing term loan (TLa), which are packaged together and, usually, syndicated to banks. In some loans, how-ever, institutional investors take pieces of the TLa and, less often, the revolving credit, as a way to secure a larger institu-tional term loan allocation. Why are these tranches called “pro rata?” Because arrang-ers historically syndicated revolving credit and TLas on a pro rata basis to banks and finance companies.
• Institutional debt consists of term loans structured specifically for institutional investors, although there are also some banks that buy institutional term loans, especially in Europe. (European structures usually include two bullet term loans, called a TLb and a TLc.) These tranches include first-lien TLb and TLc facilities, second-lien loans, as well as rare prefunded letters of credit. Traditionally, institutional tranches were referred to as TLbs because they were bullet payments and lined up behind TLas. With institutional investors playing an
ever-larger role, by 2006 many executions were structured as simply revolving credit/institutional term loans, with the TLa falling by the wayside.
The mechanism of structural flex allows arrangers to adapt the overall distribution of debt between first lien, second lien, and mez-zanine to current market conditions. Under highly liquid market conditions, arrangers can structurally “flex” the deal by moving debt from the more expensive tranches, such as mezzanine, to less expensive tranches, like second or first lien. Likewise, in more diffi-cult times, arrangers can do the opposite and move debt from first lien into second lien and second lien into mezzanine to complete syndication of the debt.
Pricing A Loan In The Primary MarketAs mentioned earlier, pricing loans in the U.S. is a capital market negotiation that bal-ances the needs and interests of the different players in the market at the given time. Institutional investor pricing is a straightfor-ward exercise based on simple risk/return consideration and market technicals. Pricing a loan for the U.S. bank market, however, is more complex. Indeed, banks often invest in

A Primer For The European Syndicated Loan Market
www.standardandpoors.com14
loans for more than pure spread income--they are also driven by the overall profitabil-ity of the issuer relationship, including noncredit revenue sources. U.S. pricing also takes into account other market technicals, such as supply relative to demand. If there are a lot of dollars chasing little product, then, naturally, issuers will be able to com-mand lower spreads. If, however, the oppo-site is true, then spreads will need to increase for loans to clear the market.
Pricing loans in Europe is a simpler, but less efficient, process because pricing is not as flexible and market-driven as it is in the U.S. For many years, the European market had a well-established pricing “standard” where most deals started out. The pro rata tranches usually began general syndication at Euribor + 225. The institutional tranches were each usually priced up by about 50 bps so the TLb was at Euribor + 275 and the TLc at Euribor + 325.
Until the market turned in July 2007, a rapidly decreasing number of deals opened at the old “standard” levels, and these were mainly more difficult or less liquid credits. The majority of mainstream deals launched at the slightly lower level of Euribor + 200/250/300, in response to heavy demand for assets. However, once the market slowed down, the opening spread level on deals began to rise back up to, as well as above, the old “standard” levels.
During the credit crunch of 2008/2009, opening spreads increased to between Euribor + 400-500 across the TLa, TLb, and TLc, in response to the higher return requirements of investors.
Market flex language has also played a big part in adjusting spreads to market liquidity levels. Over the past few years, Europe adopted the U.S. practice of using market flex language to adapt pricing during general syn-dication a little more to market conditions. Until the liquidity crunch, the vast majority of flexes were downward, allowing borrow-ers to take advantage of the current hyper-liq-uid market conditions by reducing pricing and only a handful of upward flexes had occurred to make transactions struggling in syndication more appealing to investors. However, once the market turned bearish, market flex language allowed arrangers to upward flex pricing in an effort to reengage reluctant investors.
Types Of Syndicated Loan FacilitiesThere are four main types of syndicated loan facilities: • A revolving credit (within which are
options for swingline loans, multicurrency-borrowing, competitive-bid options, term-out, and evergreen extensions);
• A term loan; • An LOC; and • An acquisition or equipment line (a
delayed-draw term loan).A revolving credit line allows borrowers
to draw down, repay, and reborrow as often as necessary. The facility acts much like a corporate credit card, except that borrowers are charged an annual commitment fee on unused amounts, which drives up the over-all cost of borrowing (the facility fee). In the U.S., many revolvers to speculative-grade issuers are asset-based and thus tied to borrowing-base lending formulas that limit borrowings to a certain percentage of collateral, most often receivables and inven-tory. In Europe, revolvers are primarily des-ignated to fund working capital or capital expenditures (capex). There are a number of options that can be offered within a revolving credit line: • A swingline is a small, overnight borrowing
line, typically provided by the agent. • A multicurrency line may allow the bor-
rower to borrow in several currencies.• A term-out will allow the borrower to con-
vert borrowings into a term loan at a given conversion date. This, again, is usually a feature of investment-grade loans. Under the option, borrowers may take what is outstanding under the facility and pay it off according to a predetermined repay-ment schedule. Often the spreads ratchet up if the term-out option is exercised.
• An evergreen is an option for theborrower—with consent of the syndicate group—to extend the facility each year for an additional year. A term loan is simply an installment loan,
such as a loan one would use to buy a car. The borrower may draw on the loan during a short commitment period and repays it based on either a scheduled series of repayments or a one-time lump-sum payment at maturity (bullet payment). There are two principal types of term loans:
Standard & Poor’s ● A Guide To The European Loan Market� January 2010 15
• An amortizing term loan (A-term loans, or TLa) is a term loan with a progressive repayment schedule that typically runs six years or less. These loans are normally syn-dicated to banks along with revolving cred-its as part of a larger syndication. In the U.S., A-term loans have become increas-ingly rare over the years as issuers bypassed the bank market and tapped institutional investors for all or most of their funded loans. Recently, the European market has seen an increase in number of transactions without the A-term loan as the presence of institutional investors has risen.
• An institutional term loan (B-term, C-term, or D-term loans) is a term-loan facility with a portion carved out for nonbank, institu-tional investors. These loans become more common as the institutional loan investor base grows. These loans are priced higher than amortizing term loans because they have longer maturities and bullet repayment schedules. This institutional category also includes second-lien loans and “covenant-lite” loans, which are described below.LOCs differ, but, simply put, they are guar-
antees provided by the bank group to pay off debt or obligations if the borrower cannot.
Acquisition/equipment lines (delayed-draw term loans) are credits that may be drawn down for a given period to purchase specified assets or equipment or to make acquisitions. The issuer pays a fee during the commitment period (a ticking fee). The lines are then repaid over a specified period (the term-out period). Repaid amounts may not be reborrowed.
Second-Lien LoansSecond-lien loans are another classic example of a U.S. import to the Europe leveraged loan market. This asset class came to Europe in 2004, but its U.S. history goes back to the mid-1990s. These facilities fell out of favor after the Russian debt crisis caused investors to adopt a more cautious tone. But after default rates fell precipitously in 2003, arrangers rolled out second-lien facilities to help finance issuers struggling with liquidity problems. By 2005, the market had accepted second-lien loans to finance a wide array of transactions, including acquisitions and recapitalizations.
However, second lien never served as res-cue financing in Europe. By the time it reached this side of the Atlantic, it joined the
ranks of mezzanine as a financing alternative for private equity backed transactions, including buyouts and recapitalizations and for a time it became almost an intrinsic part of an LBO financing.
Although they are really just another type of syndicated loan facility, second-lien loans are rather more complex. As their name implies, the claims on collateral of second-lien loans stand behind those of first-lien loans but ahead of bonds and mezzanine. Unlike the U.S. (where second-lien loans also typically have less restrictive covenant pack-ages in which maintenance covenant levels are set wider than the first-lien loans), European second-lien credits share the same covenant package as first-lien facilities.
Due to its secondary ranking in the priority line, second-lien deals carry a spread pre-mium over its first-lien counterparts. For example, while the TLb/TLc tranches have an average spread of anywhere from Euribor + 275 to Euribor + 325, the average second lien is priced in the Euribor + 500 area. But pric-ing varies widely depending on the complex-ity and riskiness of the underlying credit.
Second-lien loans became much less com-mon in 2008, and all but disappeared from the market in 2009, as investor appetite for these tranches evaporated.
Mezzanine LoansA mezzanine loan is a subordinated instru-ment that carries second-ranking security or third-ranking security if the capital structure also includes second lien. Historically, mezza-nine has been a financing option of choice for small transactions, while the high-yield bond market provided subordinated financing for large deals. However, mezzanine has extended its reach to include large deals, becoming a staple of LBO financings ranging in size from E10 million to E1 billion.
Mezzanine is popular with private equity groups because unlike public high-yield bonds, it is a private instrument, syndicated to a group of lenders ranging from traditional shops that specialize in mezzanine to new investors, such as hedge funds. In addition to being subordinated debt, mezzanine includes a number of unique features. The interest consists of a cash and PIK margin above a base rate. Due to its secondary or tertiary position in the priority line, the total margin is considerably higher than on senior bank

A Primer For The European Syndicated Loan Market
www.standardandpoors.com16
loans, ranging anywhere from Euribor + 700 to Euribor + 1,100 depending on the tranche’s size and credit quality, and on the level of appetite for mezzanine.
In addition to spread, mezzanine has tra-ditionally included warrants to provide lend-ers an unlimited upside potential should the issuer perform well. Deals with warrants carry lower spreads than those without them. Mezzanine often has a non-call provi-sion, for one to three years, plus prepayment penalties at 102 bps and 101 bps in the sub-sequent years. This also appeals to private equity groups because when they decide to exit the company it will be cheaper to repay mezzanine than high-yield bonds, which have longer non-call periods.
This instrument carries the same financial covenants as senior bank loans. Some facilities have identical covenant levels as the first ranking debt while others include a “haircut.” Haircut refers to how much looser the mezza-nine covenants are compared with senior debt. Usually this number is around 10%.
The standard mezzanine standstill periods are either 60/90/120 days or 90/120/150 days for mezzanine payment defaults/finan-cial covenant defaults/other mezzanine defaults, respectively.
During the 2008/2009 credit crunch, mez-zanine tranches were less common in LBO structures as mezzanine funds sought much higher spreads—in the mid- to high teens— on these tranches to compensate for losses on restructured deals. Private equity subse-quently switched to all-senior structures where possible.
Covenant-Lite LoansLike second-lien loans, covenant-lite loans are really just another type of syndicated loan facility. But they also are sufficiently different to warrant their own section in this primer.
At the most basic level, covenant-lite loans are loans that have bond-like financial incur-rence covenants rather than traditional main-tenance covenants that are normally part and parcel of a loan agreement.
Incurrence covenants generally require that if an issuer takes an action (paying a divi-dend, making an acquisition, issuing more debt), it would need to still be in compliance. So, for instance, an issuer that has an incur-rence test that limits its debt to 5x cash flow would only be able to take on more debt if,
on a pro forma basis, it was still within this constraint. If, not then it would have breeched the covenant and be in technical default on the loan. If, on the other hand, an issuer found itself above this 5x threshold simply because its earnings had deteriorated, it would not violate the covenant.
Maintenance covenants are far more restrictive. This is because they require an issuer to meet certain financial tests every quarter whether or not it takes an action. So, in the case above, had the 5x leverage maximum been a maintenance rather than incurrence test, the issuer would need to pass it each quarter and would be in viola-tion if either its earnings eroded or its debt level increased. For lenders, clearly, mainte-nance tests are preferable because it allows them to take action earlier if an issuer expe-riences financial distress. What’s more, the lenders may be able to wrest some conces-sions from an issuer that is in violation of covenants (a fee, incremental spread, or additional collateral) in exchange for a waiver.
Conversely, issuers prefer incurrence cove-nants precisely because they are less strin-gent. Covenant-lite loans, therefore, thrive only in the hottest markets when the supply/demand equation is tilted persuasively in favor of issuers.
Covenant-lite loans made only a brief appearance in the European market, and disappeared with the credit crunch.
Toggle FacilitiesToggle facilities are primarily a by-product of hyper-liquid markets. They provide issu-ers with a “pay if you want” feature that allows them to switch off any cash-pay ele-ment and convert all spread to PIK without consulting the lending group. The toggle fea-ture has appeared on second-lien as well as mezzanine facilities.
Cross-Border LoansCross-border loans are transactions that are syndicated simultaneously into multiple markets. The most common cross-border transaction is one that is sold to both U.S. and European investors. However, cross-bor-ders can also be transactions sold in Asia and the U.S., Asia and Europe, or even Asia, the U.S., and Europe.

Standard & Poor’s ● A Guide To The European Loan Market� January 2010 17
The tranches that make up a cross-border loan are denominated in currencies to match the markets that they are being sold to. Thus, the U.S. portion of a cross-border will be denominated in U.S. dollars and the European portion will be denominated in euros.
For a cross-border transaction to be viable, the issuer must have operations in all of the markets that it is selling debt to. For exam-ple, a traditionally U.S. issuer, such as HCA, must also have assets and/or business in Europe to support a euro tranche sold to European investors.
Lender TitlesLender titles in Europe reflect either the banks’ position in the arrangement and underwriting of the transaction or their administrative role. The MLA designation remains the most significant lender title for the bank (or banks) providing the primary arrangement and initial underwriting, and receiving the majority of fees. As the loan market has grown and matured, however, the array of other lender, or “co-agent,” titles has proliferated.
The co-agents are designated during the sub-underwriting phase. The primary co-agent title is joint lead arranger (JLA). The JLAs make the largest underwriting commit-ments and, in turn, receive the largest fees. Co-agent titles assigned during general syndi-cation include arranger, co-arranger, and lead manager. These co-agent titles have become largely ceremonial, routinely awarded for what amounts to no more than large retail commitments in exchange for upfront fees.
The primary administrative title is that of bookrunner (or joint bookrunner when there is more than one bank involved). The book-runner role is almost always assigned to the MLA(s) and it takes on the administrative tasks generally associated with the adminis-trative agent and syndication in the U.S.
The other administrative titles seen regu-larly in the European market are the facility agent and security agent.
The facility agent administers the syndi-cate, keeping track of syndicate members’ commitments, repayments, secondary trades, and also handling alterations to documenta-tion via waivers.
The security agent oversees the manage-ment of the underlying security, particularly with regards to the intercreditor agreement
and guarantees. This role occurs primarily only in the case of complex security packages.
Secondary SalesSecondary sales occur after the loan is closed and allocated, when investors are free to trade the paper. Loan sales are structured as either assignments or participations, with investors usually trading through dealer desks at the large underwriting banks.
The secondary market in Europe is rela-tively nascent, especially when compared with that in the U.S. Bank lenders typically do not trade in secondary, but the influx of institutional investors in 2005-2007 drove rapid growth in secondary activity, amid hyper liquid conditions. In mid-2007, that secondary liquidity contracted once again, and the market re–mained highly illiquid throughout 2008 and 2009.
Assignments
In an assignment, the assignee becomes a direct signatory to the loan and receives inter-est and principal payments directly from the administrative agent.
Assignments typically require the consent of the borrower and agent. In the U.S., con-sent may be withheld only if a reasonable objection is made and the borrower fre-quently loses its right to consent in the event of default. In Europe, the issuer consent, or more realistically sponsor consent, is not sub-ject to a reasonable standard and remains in place regardless of default status.
The loan document usually sets a mini-mum assignment amount, usually E2.5million to E5.0 million for pro rata commit-ments. As the institutional market grew, administrative agents started to break out specific assignment minimums for institu-tional tranches. Where there are separate institutional assignment minimums, they range from E1.0 million to E2.5 million.
Participations
A participation is an agreement between an existing lender and a participant. As the name implies, it means the buyer is taking a participating interest in the existing lender’s commitment.
The lender remains the official holder of the loan, with the participant owning the rights to the amount purchased. Consents,

A Primer For The European Syndicated Loan Market
www.standardandpoors.com18
fees, or minimums are almost never required. The participant has the right to vote only on material changes in the loan document (rate, term, and collateral). Nonmaterial changes do not require approval of participants. A participation can be a riskier way of purchas-ing a loan, because, if a lender becomes insol-vent or defaults, the participant does not have a direct claim on the loan. In this case, the participant then becomes a creditor of the lender and often must wait for claims to be sorted out to collect on its participation.
Sub-participations are also a mechanism for transferring paper in Europe. In the case of a sub-participation, the participant has no right to vote as its position in the lending group is only based on its agreement with the lender of record.
Loan DerivativesLoan credit default swaps
Traditionally, accounts bought and sold loans in the cash market through assign-ments and participations. Aside from that, there was little synthetic activity outside over-the-counter total rate of return swaps. By 2007, however, the market for syntheti-cally trading loans was budding.
Loan credit default swaps (LCDS) are stan-dard derivatives that have secured loans as reference instruments. In June 2006, The International Settlement and Dealers Association issued a standard trade confirma-tion for LCDS contracts.
Like all credit default swaps (CDS), an LCDS is basically an insurance contract. The seller is paid a spread in exchange for agree-ing to buy at par, or a prenegotiated price, a loan if that loan defaults. An LCDS enables participants to synthetically buy a loan by going short the CDS or to sell the loan by going long the CDS. Theoretically, then, a loanholder can hedge a position either directly (by buying CDS protection on that specific name) or indirectly (by buying protection on a comparable name or basket of names).
Moreover, unlike the cash markets, which are long-only markets for obvious reasons, the CDS market provides a way for investors to short a loan. To do so, the investor would buy protection on a loan that it doesn’t hold. If the loan subsequently defaults, the buyer of protection should be able to purchase the loan in the secondary market at a discount and then deliver it at par to the counterparty from
which it bought the LCDS contract. For instance, say an account buys five-year protec-tion for a given loan, for which it pays 250 bps per year. Then in year two the loan goes into default and the market price falls to 80% of par. The buyer of the protection can then buy the loan at 80 and deliver to the counter-part at 100, a 20-point pickup. Or instead of physical delivery, some buyers of protection may prefer a cash settlement in which the dif-ference between the current market price and the delivery price is determined by polling dealers or using a third-party pricing service. Cash settlement could also be used if there’s not enough paper to physically settle all LCDS contracts on a particular loan.
LCDS auctions generally take place after the declaration of a credit event. To kick off the auction process, the LevX index (see next section) market makers must provide two pieces of public information to notify admin-istrators of a credit event, which includes fail-ure to pay, bankruptcy, or a restructuring. The next step is to poll LevX market makers to decide whether to hold an auction process to determine the settlement price for LCDS contracts. The default form of settlement is by the physical delivery of the reference obli-gation, but there is an option to cash-settle instead, at a price determined by the auction.
LevX and LCDX
Introduced in 2006, the LevX is an index of 75 senior or 45 subordinated (second- or third-lien) LCDS obligations that participants can trade. The index provides a straightfor-ward way for participants to take long or short positions on a broad basket of loans, as well as to hedge their exposure to the market.
The equivalent in the U.S. market is the LCDX, which is an index of 100 LCDS obli-gations. The LCDX is administered by Markit Partners, and is an over-the-counter product.
These indices are designed to be reset every six months, with participants able to trade each vintage of the index that is still active. The index will be set at an initial spread based on the reference instruments and trade on a price basis.
According to the primer posted by Markit (http://www.markit.com/information/affilia-tions/lcdx/alertParagraphs/01/document/LCDX%20Primer.pdf), “the two events that would trigger a payout from the buyer (pro-tection seller) of the index are bankruptcy or

Standard & Poor’s ● A Guide To The European Loan Market� January 2010 19
failure to pay a scheduled payment on any debt (after a grace period), for any of the constituents of the index.”
All documentation for the index is posted at: http://www.markit.com/information/affili-ations/lcdx/alertParagraphs/01/document/LCDX%20Primer.pdf.
Total rate of return swaps
This is the oldest way for participants to pur-chase loans synthetically. And, in reality, a total rate of return swap (TRS) is little more than buying a loan on margin. In simple terms, under a TRS program a participant buys the income stream created by a loan from a counterparty, usually a dealer. The partici-pant puts down some percentage as collateral, say 10%, and borrows the rest from the dealer. Then the participant receives the spread of the loan less the financial cost plus base rate on its collateral account. If the reference loan defaults, the participant is obligated to buy it at par or cash settle the loss based on a mark-to-market price or an auction price.
Here is how the economics of a TRS work, in simple terms. A participant buys via TRS a E10 million position in a loan paying Euribor + 250. To affect the purchase, the participant puts E1 million in a collateral account and pays Euribor + 50 on the balance (meaning leverage of 9 to 1). Thus, the participant would receive:• Euribor + 250 on the amount in the collat-
eral account of E1 million, plus• 200 bps (Euribor + 250 less the borrowing
cost of Euribor + 50) on the remaining amount of E9 million.The resulting income is LIBOR + 250 times
E1 million plus 200 bps times E9 million. Based on the participants’ collateral amount—or equity contribution—of E1 million, the return is LIBOR + 2020. If Euribor is 5%, the return is 25.5%. Of course, this is not a risk-free proposition. If the issuer defaults and the value of the loan goes to 70 cents on the euro, the participant will lose E3 million. And, if the loan does not default but is marked down for whatever reason—market spreads widen, it is downgraded, its financial condition deterio-rates—the participant stands to lose the differ-ence between par and the current market price when the TRS expires. Or, in an extreme case, the value declines below the value in the collateral account and the participant is hit with a margin call.
Pricing TermsRates
Bank loans usually offer borrowers different interest-rate options. Several of these options allow borrowers to lock in a given rate for one month to one year. Pricing on many loans is tied to performance grids, which adjust pricing by one or more financial crite-ria. Pricing is typically tied to ratings in investment-grade loans and to financial ratios in leveraged loans. Syndication pricing options are either a broad Euribor rate or a local currency base option:• The Euribor option is so called because,
with this option, the interest on borrowings is set at a spread over Euribor for a period of one month to one year. The correspond-ing Euribor rate is used to set pricing. Bor–rowings cannot be prepaid without penalty.
• Local currency options. Facilities can fund in a number of currencies other than the euro, particularly the U.S. dollar and the British pound. U.S. dollar- and sterling-denominated tranches will generally use their respective LIBORs as the base rate. Tranches denominated in other local cur-rencies, such as the Swiss franc or the Swedish krona, can float over a local money market base rate, but usually also provide a further option to fund in a more common currency such as the euro or the U.S. dollar and will thus use the relevant base rate.
Fees
There are various fees associated with loans and the multiple phases of syndication.
An arranger fee is the fee paid by the issuer to the arranger for the service it provides in underwriting and arranging the debt. This will be a one-time, upfront payment.
An upfront fee or retail fee is a fee paid by the arranger/s to a lender. These fees will typically be tiered according to the size of the commitment, with co-arrangers receiving a larger fee for providing senior support in syndication, scaling down through to the smallest tickets earning the smallest fee. These are one-time fees, usually paid on a lender’s final allocation.
In recent years, bank lenders have been paid upfront fees, but funds have been asked to commit without fees. To make a deal more attractive to funds, arrangers can offer an original issue discount (OID), whereby the

A Primer For The European Syndicated Loan Market
www.standardandpoors.com20
fund is sold the paper at a discount to par. The OID will vary according to demand for the deal.
A commitment fee is a fee paid to lenders on undrawn amounts, under a revolving credit or a term loan before draw-down. On term loans, this fee is sometimes referred to as a “ticking” fee.
A facility fee, which is paid on a facility’s entire committed amount, regardless of usage.
A usage fee is a fee paid when the utiliza-tion of a revolving credit falls below a certain minimum. These fees are applied mainly to investment-grade loans and generally call for fees based on the utilization under a revolv-ing credit. In some cases, the fees are for high use and, in some cases, for low use. Often, either the facility fee or the spread will be adjusted higher or lower based on a preset usage level.
A prepayment fee is a feature generally associated with institutional term loans. This fee is seen mainly in weak markets as an inducement to institutional investors. Typical prepayment fees will be set on a sliding scale; for instance, 2% in year one and 1% in year two. The fee may be applied to all repay-ments under a loan or “soft” repayments, those made from a refinancing or at the dis-cretion of the issuer (as opposed to hard repayments made from excess cash flow or asset sales).
An administrative agent fee is the annual fee typically paid to administer the loan (including to distribute interest payments to the syndication group, to update lender lists, and to manage borrowings). For secured loans (particularly those backed by receiv-ables and inventory), the agent often collects a collateral monitoring fee, to ensure that the promised collateral is in place.
An LOC fee can be any one of several types. The most common—a fee for standby or financial LOCs—guarantees that lenders will support various corporate activities. Because these LOCs are considered “bor-rowed funds” under capital guidelines, the fee is typically the same as the Euribor margin. Fees for commercial LOCs (those supporting inventory or trade) are usually lower, because in these cases actual collateral is submitted). The LOC is usually issued by a fronting bank (usually the agent) and syndicated to the lender group on a pro rata basis. The group receives the LOC fee on their respective shares, while the fronting bank receives an
issuing (or fronting, or facing) fee for issuing and administering the LOC. This fee is almost always 12.5 bps to 25 bps (0.125% to 0.25%) of the LOC commitment.
An original issue discount (OID) is yet another term imported from the bond mar-ket. The OID the discount from par at loan is offered in the new issue market as a spread enhancement. A loan may be issued at 99 to pay par. The OID in this case is said to be 100 bps, or 1 point.
OIDs and upfront fees have many similari-ties but are, in fact, structurally different. From the perspective of the lender, actually, there is no difference. But for the issuer and arrangers, the distinction is far more than semantics.
Upfront fees are generally paid from the arrangers underwriting fee as an incentive to bring lenders into the deal. An issuer may pay the arranger 2% of the deal and the arranger, to rally investors, may then pay a quarter of this amount, or 0.50%, to lender group. Upfront fees are more issuer friendly and, thus, are staples of better market conditions.
An OID, however, is generally borne by the issuer, above and beyond the arrangement fee. So if there were a 1% OID, the arranger would receive its 2% fee but the issuer would only receive 99 cents for every dollar of loan sold. An OID is a better deal for the arranger and, therefore, is generally seen in more chal-lenging markets.
Voting Rights Amendments or changes to a loan agreement must be approved by a certain percentage of lenders. Most loan agreements have three lev-els of approval: required-lender level, full vote, and supermajority:• The “required-lenders” level, usually just a
simple majority, is used for approval of nonmaterial amendments and waivers or changes affecting one facility within a deal.
• A full vote of all lenders, including partici-pants, is required to approve material changes such as RATS (rate, amortization, term, and security; or collateral) rights, but, as described below, there are occasions when changes in amortization and collat-eral may be approved by a lower percent-age of lenders (a supermajority).
• A supermajority is typically 67% to 80% of lenders and is sometimes required for certain material changes such as changes in

Standard & Poor’s ● A Guide To The European Loan Market� January 2010 21
amortization (in-term repayments) and release of collateral. Used periodically in the U.S. in the mid-1990s, these provisions fell out of favor by the late 1990s. In Europe it is still commonly seen for mate-rial changes, simply known as “majority.”
• The “Yank The Bank” clause provides for the replacement of a minority nonconsent-ing lender where the majority of lenders are in agreement. This is a uniquely European term and is generally only seen in LBO transactions.
• The “You Snooze, You Lose” clause excludes from the final calculation any lender who fails to reply in a timely fashion to an amendment request.
CovenantsLoan agreements have a series of restrictions that dictate, to varying degrees, how borrow-ers can operate and carry themselves finan-cially. For instance, one covenant may require the borrower to maintain its existing fiscal-year end. Another may prohibit it from tak-ing on new debt. Most agreements also have financial compliance covenants, for example, that a borrower must maintain a prescribed level of equity, which, if not maintained, gives banks the right to terminate the agreement or push the borrower into default. The size of the covenant package increases in proportion to a borrower’s financial risk. Agreements to investment-grade companies are usually thin and simple. Agreements to leveraged borrow-ers are often much more onerous.
The three primary types of loan covenants are affirmative, negative, and financial.
Affirmative covenants state what action the borrower must take to comply with the loan, such as that it must maintain insurance. These covenants are usually boilerplate and require a borrower to pay the bank interest and fees, maintain insurance, pay taxes, and so forth.
Negative covenants limit the borrower’s activities in some way, such as regarding new investments. Negative covenants, which are highly structured and customized to a bor-rower’s specific condition, can limit the type and amount of investments, new debt, liens, asset sales, acquisitions, and guarantees.
Financial covenants enforce minimum financial performance measures against the borrower, such as that he must maintain a higher level of current assets than of current
liabilities. The presence of these maintenance covenants--so called because the issuer must maintain quarterly compliance or suffer a technical default on the loan agreement—is a critical difference between loans and bonds.
As a borrower’s risk increases, financial covenants in the loan agreement become more tightly wound and extensive. In general, there are five types of financial covenants—coverage, leverage, current ratio, tangible net worth, and maximum capital expenditures:• A coverage covenant requires the borrower
to maintain a minimum level of cash flow or earnings, relative to specified expenses, most often interest, debt service (interest and repayments), fixed charges (debt ser-vice, capital expenditures, and/or rent).
• A leverage covenant sets a maximum level of debt, relative to either equity or cash flow, with the debt-to-cash-flow level being far more common.
• A current-ratio covenant requires that the borrower maintain a minimum ratio of current assets (cash, marketable securities, accounts receivable, and inventories) to current liabilities (accounts payable, short-term debt of less than one year), but sometimes a “quick ratio,” in which inventories are excluded from the numera-tor, is substituted.
• A tangible-net-worth (TNW) covenant requires that the borrower have a mini-mum level of TNW (net worth less intangi-ble assets, such as goodwill, intellectual assets, excess value paid for acquired com-panies), often with a build-up provision, which increases the minimum by a percent-age of net income or equity issuance.
• A maximum-capital-expenditures covenant requires that the borrower limit capital expenditures (purchases of property, plant, and equipment) to a certain amount, which may be increased by some percentage of cash flow or equity issuance, but often allowing the borrower to carry forward unused amounts from one year to the next.Some transactions include terms geared to
diminish the impact of covenant testing: • A mulligan essentially allows the borrower
a “do-over” on the covenant tests. If, for example, a company does not comply with its covenants for one quarter but is back in line the following quarter, the previous quarter is disregarded as if it never happened.

A Primer For The European Syndicated Loan Market
www.standardandpoors.com22
• An equity cure allows issuers to fix a cove-nant violation—exceeding the maximum debt to EBITDA test for instance—by mak-ing an equity contribution. These provi-sions are generally found in private equity-backed deals, giving the sponsor the right, but not the obligation, to inject equity and cure a violation without having to request a waiver or amendment. Some agreements do not limit the number of equity cures, while others cap the number to, say, one per year or two over the life of the loan, with the exact details negotiated for each deal. Bull markets tend to bring more generous equity cures as part of looser overall documentation, while in bear markets documentation is tighter and equity cures are less easily available.
Mandatory prepayments
Leveraged loans usually require a borrower to prepay with proceeds of excess cash flow, asset sales, debt issuance, or equity issuance.
Excess cash flow is typically defined as cash flow after all cash expenses, required dividends, debt repayments, capital expendi-tures, and changes in working capital. The typical percentage required is 50% to 75%.
Asset sales are defined as net proceeds of asset sales, normally excluding receivables or inventories. The typical percentage required is 100%.
Debt issuance is defined as net proceeds from debt issuance. The typical percentage required is 100%.
Equity issuance is defined as the net pro-ceeds of equity issuance. The typical percent-age required is 50% to 100%.
Often, repayments from excess cash flow and equity issuance are waived or relaxed if the issuer meets a preset financial hurdle, most often structured as a debt/EBITDA test.
Change of control
Invariably, one of the events of default in a credit agreement is a change of issuer control.
For both investment-grade and leveraged issuers, an event of default in a credit agree-ment will be triggered by a merger, an acqui-sition of the issuer, some substantial purchase of the issuer’s equity by a third party, or a change in the majority of the board of direc-tors. For sponsor-backed leveraged issuers, the sponsor’s lowering its stake below a pre-set amount can also trip this clause.
The one exception to a change in control being a default trigger is in the case of a transferable recapitalization. In this situa-tion, the documentation regarding a buyout allows the sponsor to sell the target acquisi-tion to an accepted list of other sponsors without triggering a change of control. The outstanding debt is transferred to the new sponsor without requiring repayment to the original lenders.
SecurityCollateral
In the leveraged market, collateral usually includes all the tangible and intangible assets of the borrower and, in some cases, specific assets that back a loan.
Virtually all leveraged loans and some weaker investment-grade credits are backed by pledges of collateral. In the asset-based market, for instance, that typically takes the form of inventories and receivables, with the amount of the loan tied to a formula based on the value of these assets. A common rule is that an issuer can borrow against 50% of inventory and 80% of receivables. Naturally, there are loans backed by certain equipment, real estate, and other property.
Inter-creditor agreements and cross-guarantees
European borrowers tend to have more com-plex corporate structures than U.S. firms due to the multijurisdictional nature of the Eurozone, as well as the prevalence of private equity management. As a result, intercreditor agreements and cross-guarantees are signifi-cant parts of ensuring lender rights regarding a loan transaction particularly with regards to underperformance or default.
The intercreditor agreement is an agree-ment to subordination and stipulates the pri-ority of repayment to all lenders, senior and subordinated, in the case of default. It applies to lenders across borders and codifies their positions in the absence of intervention from individual bankruptcy courts.
Similarly, cross-guarantees ensure that the varied operating units associated with a bor-rower guarantee its assets as collateral. Thus, should one part trigger a default, all the associated companies will be equally responsible and their assets will be available for repayment.
The fixed and floating liens are another type of guarantee from operating units of

Standard & Poor’s ● A Guide To The European Loan Market� January 2010 23
the borrower. This type of guarantee bal-ances the need of the borrower to have the ability to actively manage its business with regards to acquiring and disposing of assets with that of the lender to have claim to those assets in the case of underperformance or default. The terms of this guarantee essentially allow the borrower to dispose of assets without consent (thus the floating aspect). However, the proceeds must go through certain channels, including certain designated accounts, so that the borrower has the right to freeze those assets (fixing them) under certain circumstances.
Springing liens/collateral release
Some loans have provisions that borrowers that sit on the cusp of investment-grade and speculative- grade must either attach collat-eral or release it if the issuer’s rating changes.
A ‘BBB’ or ‘BBB-’ issuer may be able to convince lenders to provide unsecured financ-ing, but lenders may demand springing liens if the issuer’s credit quality deteriorates. Often, an issuer’s rating being lowered to ‘BB+’ or exceeding its predetermined leverage level will trigger this provision. Likewise, lenders may demand collateral from a strong, speculative-grade issuer, but will offer to release under certain circumstances, such as if the issuer gains an investment-grade rating.
Asset-Based LendingMost of the information above refers to “cash flow” loans, loans that may be secured by col-lateral, but are repaid by cash flow. Asset-based lending is a distinct segment of the loan market. These loans are secured by specific assets and usually governed by a borrowing formula (or a “borrowing base”). The most common type of asset-based loans are receiv-ables and/or inventory lines. These are revolv-ing credits that have a maximum borrowing limit, say E100 million, but also have a cap based on the value of an issuer’s pledged receivables and inventories. Usually, the receivables are pledged and the issuer may borrow against 80%, give or take. Inventories are also often pledged to secure borrowings. However, because they are obviously less liq-uid than receivables, lender advance rates are less generous. Indeed, the borrowing base for inventories is typically in the 50% to 65% range. In addition, the borrowing base may be further divided into subcategories—for
instance, 50% of work-in-process inventory and 65% of finished goods inventory.
In many receivables-based facilities, issuers are required to place receivables in a “lock box.” That means that the bank lends against the receivable, takes possession of it, and then collects it to pay down the loan.
In addition, asset-based lending is often done based on specific equipment, real estate, car fleets, and an unlimited number of other assets.
Default And Restructuring There are two primary types of loan defaults: technical defaults and the much more serious payment defaults. Technical defaults occur when the issuer violates a provision of the loan agreement. For instance, if an issuer does not meet a financial covenant test or fails to provide lenders with financial infor-mation or some other violation that doesn’t involve payments.
When this occurs, the lenders can acceler-ate the loan and force the issuer into bank-ruptcy. That is the most extreme measure and rarely employed. In many cases, the issuer and lenders are able to agree on an amendment that waives the violation in exchange for a fee, spread increase, and/ or tighter terms.
A payment default is a more serious matter. As the term implies, this type of default occurs when a company misses either an interest or principal payment. There is often a pre-set period of time, say 30 days, during which an issuer can cure a default (the “cure period”). After that, the lenders can choose to either provide a forbearance agreement that gives the issuer some breathing room or take appropriate action, up to and including accelerating, or calling, the loan.
If the lenders accelerate, the company will generally declare bankruptcy. In this case, juris-dictional issues abound in the European loan market as most borrowers have operations in a multitude of countries. Additionally, each juris-diction may treat lender seniority differently.
Amend-To-ExtendThis technique allows an issuer to push out part of its loan maturities through an amend-ment, rather than a full refinancing. Amend-to-extend transactions appeared in 2009 as borrowers struggled to push out maturities.

A Primer For The European Syndicated Loan Market
www.standardandpoors.com24
Amend-to-extend allows them to do this without requiring a full refinancing.
First the borrower must obtain consent to roll existing loans into longer-dated paper. The new debt is typically pari passu with the existing loan, but matures later and therefore carries a higher margin. The second phase is the conversion, in which lenders can exchange existing loans for new loans. The issuer is left with two tranches: (1) the legacy paper at the initial price and maturity and (2) the new facility at a wider spread.
Sub-Par Loan BuybacksThis is another technique that grew out of the bear market that began in 2007. Performing paper fell to levels not seen before in the loan market, with many trading south of 70. This created an opportunity for borrowers with the financial wherewithal and the covenant headroom to repurchase loans via a tender, or in the open market, at prices below par. In some instances, sponsors also bought back debt, either quietly behind the scenes or via an auction, as an efficient way to put money to work to delever the business in question. Typically, the debt would be retired, losing voting rights.
Loan Math—The Art Of Spread CalculationCalculating loan yields or spreads is not straightforward. Unlike most bonds, which have long no-call periods and high-call premi-ums, most loans can be prepaid at any time, typically without prepayment fees. And, even in cases where prepayment fees apply, they are rarely more than 2% in year one and 1% in year two. Therefore, affixing a spread-to-maturity or a spread-to-worst on loans is lit-tle more than a theoretical calculation.
This is because an issuer’s behavior is unpredictable. It may repay a loan early because a more compelling financial opportu-nity presents itself or because the issuer is acquired or because it is making an acquisi-tion and needs additional financing. Traders and investors will often speak of loan spreads, therefore, as a spread to a theoretical call. For example, European leveraged loans, on average, between 1997 and 2004 had a 15-month average life. Thus, if you buy a loan with a spread of 250 bps at a price of 101, you might assume your spread-to-expected-life as the 250 bps less the amor-tized 100 bps premium or Euribor + 170. Conversely if you bought the same loan at 99, the spread-to-expect life would be Euribor + 330. l

Standard & Poor’s ● A Guide To The European Loan Market� January 2010 25
Glossary
Arranger fee. The fee paid by the issuer tothe arranger for arranging and underwriting a loan.
Asset sales prepayment. The prepayment required as a result of the net proceeds of asset sales, normally excluding receivables or inventories. The typical percentage required is 100%.
Assignment minimum. The amount that the lender can assign to a different lender. It ranges from E1 million to E5 million.
Axe sheets. These are sheets with lists ofsecondary bids and offers for loans that dealers send to accounts. Axes are simply price indications.
Bank book (information memo). This document, prepared by the arranging bank, describes the transaction’s terms. The bank book, or IM, typically will include an executive summary, investment considerations, a list of terms and conditions, an industry overview, and a finan-cial model. Because loans are not securities, this will be a confidential offering made only to qualified banks and accredited investors.
Break price. Price on the facility at the moment it goes free to trade in the secondary market once allocations are made or how much investors are willing to pay for this deal if they would like to hold it. When the market is strong and the transaction is well received, the break price generally will be above par.
Buyback. In a buyback, a sponsor or com-pany will opportunistically buy back the company’s debt out of the secondary market, typically taking advantage of depressed sec-ondary prices. The issuer might use surplus cash off its balance sheet or the sponsor might use its own equity to purchase the debt. LMA Loan Market Association guide-lines suggest the company should tender for its debt via a transparent auction process, as well as suggesting measures to reduce the risk of a conflict of interests resulting from the sponsor owning debt and equity. Although buybacks reduce the company’s debt burden, they are often contentious, especially if done using surplus cash rather than equity, and in some cases lenders refuse to sign waivers to give their permission.
BWIC. An acronym for “bids wanted in com-petition.” It’s really just a fancy way of describing a secondary auction of loans or bonds. Typically an account will offer up a portfolio of facilities via a dealer. The dealer will then put out a BWIC, asking potential buyers to submit for individual names or the entire portfolio. The dealer will then collate the bids and award each facility to the highest bidder.
Circled. When a loan or bond is full subscribed at a given price it is said to be circled. After that, the loan or bond moves to allocation and funding.
Commitment fee. A fee paid on unused portion of the facility that ranges from 50 to 75 bps. For example, the company might have a E100 million revolving credit, but it only needs to draw E20 million; it must pay a fee on the remaining E80 million to compensate the lenders for keeping this money available.
Corporate LBO. A buyout of a company by a private equity firm from a corporation. It’s also called corporate divestiture.
Covenant-lite. Loans that have bond-like financial incurrence covenants rather than traditional maintenance covenants that are normally part and parcel of a loan agreement.
Cover bid. The level that a dealer agrees to essentially underwrite a BWIC or an auction. The dealer, to win the business, may give an account a cover bid, effectively putting a floor on the auction price.
Credit statistics. Financial ratios, such as leverage ratio, interest coverage ratio, etc.
Cross border. A transaction syndicated to both U.S. and European investors.
Deal size. Total amount of bank debt raised for the transaction.
Default rate. Calculated by either number of loans or principal amount. The formula is similar. For default rate by number of loans: the number of loans that default over a given 12-month period divided by the number of loans outstanding at the beginning of that period. For default rate by principal amount: the amount of loans that default over a 12-month period divided by the total amount outstanding at the beginning of the period. Standard & Poor’s defines a default for the

A Primer For The European Syndicated Loan Market
www.standardandpoors.com26
purposes of calculating default rates as a loan that is either:• Rated ’D’ by Standard & Poor’s, • Made to an issuer that has filed
for bankruptcy, • In payment default on interest or
principal, or • Restructured in such a way as to create a
material loss to the lender.
Default. There are two primary types of loan defaults, technical defaults and the much more serious payment defaults. Technical defaults occur when the issuer violates a pro-vision of the loan agreement. For instance, if an issuer doesn’t meet a financial covenant test or fails to provide lenders with financial information or some other violation that doesn’t involve payments. A payment default, as the name implies, happens when a company misses either an interest or prin-cipal payment. There is often a preset period, say 30 days, during which an issuer can cure a default (the “cure” or “grace” period). After that, the lenders can take appropriate action, up to and including accelerating, or calling, the loan.
Disintermediation. Disintermediation refers to the process whereby banks are replaced (or disintermediated) by institutional investors.
Distressed loans. In the loan market, loans traded at less than 80 cents on the dollar were traditionally considered distressed, although in 2007-2008 some performing loans traded in the 80s and below due to technical rather than fundamental weakness. In the bond market, the common definition is a spread of 1,000 bps or more. In the loan market, however, calculating spreads is an elusive art (see above) and therefore a more pedestrian price measure is used.
EBITDA. Earnings before interest, taxes, depreciation, and amortization. This is often used as a proxy for cash flow.
Equity contribution. How much money the sponsor put in to finance the transaction. Calculated as the sponsor’s equity amount divided by total transaction amount.
Equity cure. These provisions allow issuers to fix a covenant violation—exceeding the maximum debt to EBITDA test for instance—by making an equity contribution. These provisions are generally found in pri-
vate equity-backed deals, giving the sponsor the right, but not the obligation, to inject equity and cure a violation without having to request a waiver or amendment. Some agreements do not limit the number of equity cures, while others cap the number to, maybe one per year or two over the life of the loan, with the exact details negotiated for each deal. Bull markets tend to bring more generous equity cures as part of looser overall documentation, while in bear mar-kets documentation is tighter and equity cures are less easily available.
Equity issuance prepayment. The prepayment required as a result of the net proceeds of equity issuance. The typical percentage required is 50% to 100%.
Excess cash flow prepayment. The prepayment required as a result of excess cash flow which is typically defined as cash flow after all cash expenses, required dividends, debt repay-ments, capital expenditures and changes in working capital. The typical percentage required is 50% to 75%.
Financial covenant. Financial covenants enforce minimum financial performance measures against the borrower, for instance to maintain a higher level of current assets than current liabilities. As a borrower’s risk increases, these covenants become more restrictive and extensive.
First-lien debt. Senior debt that holds the first priority on security.
Flex. Margin flex language allows the arranger to change spreads during syndication to adjust pricing to current liquidity levels. To entice more investors into buying the credit, spreads will be raised, or “flexed up.” When liquidity is high and demand outstrips supply, the spread will be decreased, or “reverse flexed.” A structural flex occurs when the arranger adjusts the size of tranches during syndication to reflect current liquidity levels. As a result, during highly liquid times, an arranger may move debt from the more expensive tranches, such as mezzanine, to cheaper tranches, such as second lien or first lien.
Forward calendar. A list of loans or bonds that have been announced but not yet launched via a general syndication bank meeting. In the U.S., this is a list of loans or

Standard & Poor’s ● A Guide To The European Loan Market� January 2010 27
bonds that have been announced but not yet closed, including both instruments that are yet to come to market as well as those that are actively being sold but have yet to be cir-cled.
Haircut. In relationship to financial covenants, this refers to the looser maintenance cove-nants set for mezzanine tranches compared with senior credit.
Implied ratings (credit estimates or shadow rating). Credit opinions that are not available publicly on Standard & Poor’s RatingsDirect and other public sources. Implied ratings are not backed by the borrowers. CLO arrangers request the ratings agencies to issue an implied rating to ensure that the portfolio maintains certain agreed standards. For example, a CLO should not have more than 5% of rated debt in the ‘CCC’ category.
Institutional facilities. These tranches are sold primarily to institutional investors. They tra-ditionally have had a bullet repayment with no amortization, a maturity of eight to nine years, and a spread of Euribor + 250 to 325. The TLb can have a pricing grid with fewer step downs than pro rata. The TLc usually does not have a pricing grid.
Interest coverage. EBITDA to interest.
LBO (European version). Any transaction in which the issuer is owned by a private equity firm (sponsor). It includes a buyout of a com-pany by a sponsor, a follow-on acquisition, a dividend to the sponsor, refinancing, etc.
LBO (U.S. version). A subset of the above, but includes only buyouts of a company by a sponsor. Excludes recaps, refinancings, and follow-on acquisitions.
LevX/LCDX. LevX Senior is an index of 75 senior LCDS obligations, and LevX Sub an index of 45 subordinated (second- or third-lien) LCDS obligations, that participants can trade. The U.S. equivalent is LCDX. The indices provide a straightforward way for participants to take long or short positions on a broad basket of loans as well as to hedge their exposure to the market.
Leverage ratio or debt/EBITDA. Many bank books use net debt to EBITDA, which is (debt minus cash) to EBITDA.
Leveraged loans. Defining a leveraged loan is a discussion of long standing in the loan
market. Some participants use a spread cut-off: i.e., any loan with a spread of Euribor + 125 or Euribor + 150 or higher qualifies. Others use rating criteria: i.e., any loan rated ‘BB+’ or lower qualifies. But what of loans that are not rated? At Standard & Poor’s Leveraged Commentary & Data, we have developed a more complex definition. We include a loan in the leveraged universe if it is rated ‘BB+’ or lower or it is not rated or rated ‘BBB-‘ or higher but has (1) a spread of Euribor + 125 or higher and (2) is secured by a first or second lien. Under this definition, a loan rated ‘BB+’ that has a spread of Euribor + 75 would qualify, but a nonrated loan with the same spread would not. It is hardly a perfect definition, but one that Standard & Poor’s thinks best captures the spirit of loan market participants when they talk about leveraged loans.
Loan credit default swaps (LCDS). Standard derivatives that have secured loans as reference instruments.
Loss given default. A measure of how much creditors lose when an issuer defaults. The loss will vary depending on creditor class and the enterprise value of the business when it defaults. Naturally, all things being equal, secured creditors will lose less than unsecured creditors. Likewise, senior creditors will loss less than subordinated creditors. Calculating loss given default is tricky business. Some practitioners express loss as a nominal per-centage of principal or a percentage of princi-pal plus accrued interest. Others use a present value calculation using an estimated discount rate, typically 15% to 25%, demanded by distressed investors. This can also be expressed as (1-Recovery Rate).
Maintenance capex. The minimum amount the company has to spend to keep its assets in shape. If the company cannot maintain its assets, those assets will not continue generat-ing the same level of revenues.
Mandatory prepayment. Leveraged loans usu-ally require a borrower to prepay the loans with proceeds of excess cash flow, asset sales, debt issuance, or equity issuance.
Mezzanine. A subordinated instrument that carries second-ranking security or, if the capital structure also includes second lien, third-ranking security.

A Primer For The European Syndicated Loan Market
www.standardandpoors.com28
Mulligan. A clause that essentially allows the borrower a “do-over” on the covenant tests. If, for example, a sponsor does not comply with its covenants for one quarter but is back in line the following quarter, the previous quarter is disregarded as if it never happened.
Original issue discount (OID). A way of remu-nerating primary lenders, usually institutional investors, by offering them a discount to par. Varies according to demand for the deal.
Non-call. During the non-call period, borrow-ers are obligated to pay a fee to lenders if they repay the debt during the stated non-call period. Generally, the fee is 2% in the first year and 1% in subsequent years.
OWIC. This stands for “offers wanted in com-petition” and is effectively a BWIC in reverse. Instead of seeking bids, a dealer is asked to buy a portfolio of paper and solicits potential sellers for the best offer.
P2P (public to private). A buyout of a publicly listed company by a private equity firm result-ing in its delisting from the stock exchange.
Paramount outstanding. This is the amount of institutional bank loans issued previously and still outstanding at the particular point in time and is tracked by the U.S. and European leveraged loan indexes.
Prepayment fee. Fees paid by the issuer if the debt is repaid before maturity.
Pricing grid (aka margin ratchet). A set of financial measures that allows the issuer to pay lower interest on the facilities. For exam-ple, if the issuer’s debt to EBITDA is less than 3x, pricing is Euribor + 275; if such ratio decreases to 2.5x, pricing is Eurobor + 250.
Primary price (institutional). Reflects how much investors pay for a facility if they buy it in the primary syndication. Primary price is par unless accompanied by an upfront fee. When the market is strong, institutional paper is issued without upfront fees.
Printing a deal. Refers to the price or spread at which the deal syndicates.
Pro forma financials. Financials that include the “side effects” of the current transaction. For example, in case of an acquisition, pro forma EBITDA will reflect the combined EBITDA of the two companies plus synergies from their merger. For an LBO, pro forma
EBITDA could include cost savings generated by headcount reductions. Often pro forma financials covers the last 12 months. We also track “estimated” (full fiscal current year) and “projected year one” (first full year after the current year).
Pro rata. Facilities sold to banks (revolving credit, TLa, acquisition facility, capex facil-ity). These tranches generally have a gradual amortization until maturity (except for the revolver) and a maturity of six to seven years. They will usually carry a spread of Euribor + 200 and greater and might have two to four step-downs based on a pricing grid.
Pro rata spread. Average spread of revolving credit and TLa tranches (which are usually the same).
Public ratings. Ratings that are availablepublicly on RatingsDirect and other public sources.
Purchase price multiple. Purchase price paid to acquire the company divided by its EBITDA.
Recap/dividend. Capital structure shift in which additional debt is raised to finance a cash payment to the owners (sponsor, in case of a private company and general public, in case of a listed company). Some part of the new debt may also be used to refinance existing debt.
Recap/equity infusion. Capital structure shift in which the sponsor injects new equity into the company, usually to refinance existing debt.
Recap/stock repurchase. Capital structure shift in which additional debt is raised to repur-chase shares from the owners (sponsor, in case of a private company and general public, in case of a listed company). Stock repur-chase can be in the form of shareholder loan repayment. Some part of the new debt may also be used to refinance existing debt. For research purposes, dividend and stock repur-chase are considered the same thing because both reflect a payment to the sponsor.
Recapitalization. A shift in the issuer’s capi-tal structure between debt and equity. Types of recap include: dividend, stock repurchase, equity infusion.
Recovery. Recovery is the opposite of loss given default—it is the amount a creditor recovers, rather than loses, in a given default.

Standard & Poor’s ● A Guide To The European Loan Market� January 2010 29
Refinancing. A transaction in which new debt replaces existing debt of the company and only the debt portion of the capital structure is affected.
Relative value. This can refer to the relative return or spread between (1) various instru-ments of the same issuer, comparing for instance the loan spread with that of a bond; (2) loans or bonds of issuers that are similarly rated and/or in the same sector, comparing for instance the loan spread of one ‘BB’ rated healthcare company with that of another; and (3) spreads between markets, comparing for instance the spread on offer in the loan mar-ket with that of high-yield or corporate bonds. Relative value is a way of uncovering undervalued, or overvalued, assets.
Reverse-flex. Spread decrease during syndica-tion when facilities are oversubscribed to the point where a spread reduction will not dam-age the arranger’s ability to syndicate the facil-ities. A sign of demand outstripping supply.
Revolving credit. A facility that allows bor-rowers to draw down, repay, and reborrow as often as necessary. The facility acts much like a corporate credit card, except that bor-rowers are charged an annual commitment fee on unused amounts, which drives up the overall cost of borrowing (the facility fee).
Rich/cheap. A loan that is “rich” is trading at a spread that is low compared with other similarly rated loans in the same sector. Conversely, something that is “cheap” means it is trading at a spread that is high compared with its peer group. That is, you can buy it relatively cheaply.
Rollover equity. Reinvesting funds contributed to the company under previous ownership into a “new” company under new ownership.
Running the books (or bookrunner). Generally the loan arranger is said to be “running the books,” i.e., preparing documentation and syndicating and administering the loan.
Second lien. Loan that has second-priority interest on security. Subordinated to senior loans (TLa, TLb, TLc, etc.), but senior to mezzanine, high-yield, PIK notes, and equity. They are floating-rate-instrument-like senior loans, priced at roughly 200 to 300 bps higher than senior loans. Second liens are more expensive to prepay than senior debt since many second liens have prepayment
penalties in the first two years. Their matu-rity is usually one-half to one year longer than the TLc.
Secondary LBO. A buy-out of a company by one private equity firm from another private equity firm.
Senior leverage ratio (senior debt to EBITDA). Many bank books use net senior debt to EBITDA, which is (senior debt minus cash) to EBITDA.
Senior loans. These loans have the highest seniority in the issuer’s capital structure, i.e., obligations are contractually paid before sub-ordinated securities. They have a stated matu-rity of six to nine years, but are fully prepayable at any time and prepayment pen-alties are rare. They are floating rate and priced based on a spread over Euribor or LIBOR. They have maintenance-based finan-cial covenants, usually calculated quarterly, and there is no equity kicker to debtholders.
Shareholder loan. Sponsors’ frequently con-tribute equity in the form of a deeply dis-counted bond that pays paid-in-kind interest. An equity-like instrument that is subordi-nated to senior and subordinated debt.
Sources of proceeds. Sources used to finance the transaction (i.e., bank debt, mezzanine, high yield, and equity).
Split rating. When a loan is rated differently by Moody’s and Standard & Poor’s such that the rating comes out as a “three B” or a “five B”. “Three B” means ‘B’ (‘B-‘, ‘B’, or ‘B+’) by one agency and ‘BB’ (‘BB-‘, ‘BB’, or ‘BB+’) by another (if you count all the B’s you’ll get three). “Five B” means ‘BB’ by one agency and ‘BBB’ by another.
Sponsored (volume, issuance, etc.). Any type of transaction whereby a private equity group owns the issuer. Same thing as the European definition of LBO.
Spread. Interest paid on top of a “risk-free” rate, i.e. Euribor (for Euro deals) or LIBOR (for U.S. dollar- or sterling-denominated deals).
Spread to maturity/spread to call. The spread to maturity adjusts the value of the spread over base rate for any nonpar price, over the life of the loan. The spread to call calculates the same, except that the time horizon is a more realistic estimation of the actual life of these

A Primer For The European Syndicated Loan Market
www.standardandpoors.com30
instruments, which are usually fully prepay-able without penalty at any time.
Staple financing. Staple financing—or staple- on financing—is a financing agreement “stapled on” to an acquisition, typically by the M&A advisor. So, if a private equity firm is working with an investment bank to acquire an asset, that bank, or a group of banks, may provide a staple financing to ensure that the firm has the wherewithal to complete the deal. Because the staple financ-ing provides guidelines on both structure and leverage, it typically forms the basis for the eventual financing that is negotiated by the auction winner, and the staple provider will usually serve as one of the arrangers of the financing, along with the lenders that were backing the buyer.
Subordinated debt. Debt that has subordi-nated claim on security and payments behind senior debt or has no security at all. Types of subordinated debt are mezzanine, public high yield, and PIK notes (which have certain quasi-equity characteristics).
Term loan. This facility is simply an install-ment loan, such as a loan one would use to buy a car. The borrower may draw on the loan during a short commitment period and repays it based on either a scheduled series of repayments or a one-time lump-sum pay-ment at maturity (bullet payment).
Toggle facilities. This feature provides issuers with a “pay if you want” feature that allows them to switch off any cash-pay element and convert all spread to PIK without consulting the lending group.
Total rate of return swaps (TRS). Under a TRS program, a participant buys the income stream created by a loan from a counter-party on margin. Then the participant receives the spread of the loan less the finan-cial cost plus base rate on its collateral account. If the reference loan defaults, the participant is obligated to buy it at par or cash settle the loss based on a markto-market price or an auction price.
Transaction size. Total amount of all debt and all equity raised for the transaction.
Transferable recapitalization. Buy-out in which the sponsor has the right to sell the targeted acquisition to another sponsor with-out triggering a change of control.
Upfront fee. Fee paid by the arranger to lend-ers joining the syndicate, tiered so that larger commitments earn larger fees.
Vendor note (aka seller note). A type of financ-ing provided by the seller of the company. An equity-like instrument that is subordinate to senior and subordinated debt.
Volume. Sum of all leveraged loans raised (first and second lien) within the given period; new debt raised only. Therefore, if a deal is an amendment to the previous credit and no new debt is raised, this will be excluded. All amounts are converted to Euros using the exchange rate either (1) pro-vided in the bank book, or (2) spot rate on the date of the deal’s bank meeting (our proxy for a launch date).
Warrants (on mezzanine). Gives the mezza-nine lenders the right to purchase equity from the issuer at a specific price. Warrants potentially provide unlimited upside to lenders if the company does really well. However, deals that carry warrants have lower pricing.
Weighted average institutional spread. Average spread of TLb and TLc tranches weighted by the size of each tranche, i.e. [TLb spread times TLb size/(TLb plus TLc size)] + [TLc spread times TLc size/ (TLb plus TLl size)].
Weighted average bid. A price at which an investor is willing to buy a loan, weighted by the par amount outstanding. By definition, larger deals will have a stronger influence on the average.
Yank The Bank. This clause provides for the replacement of a minority nonconsenting lender where the majority of lenders are in agreement.
You Snooze, You Lose. This clause excludes from the final calculation any lender who fails to reply in a timely fashion to an amendment request. l
Standard & Poor’s ● A Guide To The European Loan Market� January 2010 31
Loans Limp Along, High-Yield Strides
Out As Europe Moves Into Recovery
Mode In 2009
With many banks forced to slash their lever-aged loan books and collateralized loan obli-gations hands tied, it is still not clear how that recovery is going to take place and what shape the market will take in the coming years.
Through 2009, the flow of new leveraged loan business has been thin, restricted to small clubs put together among relationship banks, frequently drawn from existing syndicates. Arrangers have been reluctant to underwrite, making it harder for private equity sponsors to bid aggressively for desirable targets.
But the high-yield market has enjoyed what players hope will prove to be a turn-around year. Low interest rates have fuelled demand for the fixed-income product, and this has allowed borrowers to use the high-yield mar-ket to refinance existing debt. A mix of cross-over and true high-yield issuers have tapped into investors’ keen demand, which has given rise to hopes that high-yield will use this opportunity to establish itself as a reliable alternative to leveraged loans.
Two other key trends have shaped 2009. On a cheerful note, there has been a huge rally in secondary-market prices. Earlier in the year, buyers scented opportunities to make excellent returns on downtrodden, but strong, credits. As the rally continued, the
appetite for risk broadened, outweighing sup-ply, and the entire market traded up.
But for portfolio managers and investors of every variety, 2009 has been less about the rally or the high-yield resurgence, and more about restructuring. They have been fighting to keep borrowers on track amid the global recession. This has included urgent situations where a heavily-leveraged borrower’s EBITDA has collapsed and insolvency looms, to covenant resets for less-stressed companies.
Thin On The GroundAlthough the year has brought more stable conditions for the global financial markets than 2008’s rocky ride, 2009 has offered slim pickings in terms of new leveraged loan financing.
Through to the end of October, Standard & Poor’s Leveraged Commentary & Data (LCD) tracked only 29 leveraged deals, raising €13.1 billion. Of this, an €8.9 billion block came from a single deal—Heidelberg Cement’s restructuring. Even with this, 2009 has been the thinnest year for new issuance since 1998, when LCD began tracking the market.
Leveraged buy-outs (LBO), which have traditionally been the dominant forum for
Activity in the European leveraged debt market in 2009 took
the form of secondary trading, restructuring distressed cred-
its, and new high-yield issuance—in short, in all areas except pri-
mary issuance of leveraged loans. After the shocks of late 2008,
when the Lehman crisis caused the entire financial system to shud-
der, the loan market has a very long way to go to recovery, both in
terms of its reputation as well as simply in terms of activity levels.
Ruth McGavin London (44) 20-7176-3924
Marina Lukatsky New York (1) 212-438-2709

Loans Limp Along, High-Yield Strides Out As Europe Moves Into Recovery Mode In 2009
www.standardandpoors.com32
new leveraged loans, have been scarce. Depressed valuations meant few sellers, while sponsors faced difficulties in securing loan financing. From the beginning of 2009 up through the end of October there were 16 LBOs that generated only €2.7 billion of senior debt. In the first 10 months of 2008, by comparison, €47.8 billion of paper hit the market from 100 transactions, while in 2007 volume was a massive €128.7 billion from 251 deals.
In tune with the conservative mood, spon-sors have found there is much less leverage available this year. The average leverage mul-tiples for 2009 through October stood at 3.4x senior, 4.2x total, down from 4.1x senior, 5.2x total in 2008. This is also, of course, a huge contraction from the 5.3x
senior, 6.1x total averages set in 2007 (see chart 1). In addition, sponsors have been required to put in much large amounts of their own money.
Some have even opted for 100% equity acquisitions, in the hope of being able to refi-nance out into the debt markets again at some point in the future. But for the rest, sponsors cut an average cheque of 55.9% of the capital structure.
Not only have 2009 deals been few in number and small in size, but they have also, with barely an exception, been put together on a club basis between banks that either have relationships with the company, or with the sponsor in the case of LBOs. In many cases, banks that were existing lenders to the company in question were asked to roll into
2001 2002 2003 2004 2005 2006 2007 2008 Jan.-Oct.2009
0
1
2
3
4
5
6
7
(x)
First lien/EBITDA Second lien/EBITDA Other debt/EBITDA
Chart 1 Annual Pro Forma Debt/EBITDA Ratios*
3Q 2
009
1Q 2
004
2Q 2
004
3Q 2
004
4Q 2
004
1Q 2
005
2Q 2
005
3Q 2
005
4Q 2
005
1Q 2
006
2Q 2
006
3Q 2
006
4Q 2
006
1Q 2
007
2Q 2
007
3Q 2
007
4Q 2
007
1Q 2
008
2Q 2
008
3Q 2
008
4Q 2
008
1Q 2
009
2Q 2
009150
200
250
300
350
400
450
500
(Spread over Eurobar)
Pro rata Institutional
Chart 2 Weighted Average Spreads

Standard & Poor’s ● A Guide To The European Loan Market� January 2010 33
new facilities, typically gaining a margin uplift in return for their continued support.
The first 10 months of the year set an aver-age spread of the Euro Interbank Offered Rate (E) + 388 basis points on pro rata and E + 452 on institutional tranches of senior debt. This is comfortably above the E + 252 and E + 337 set, respectively, in 2008, and a world away from the E + 208 and E + 265 average readings from 2007 (see chart 2).
But even late in the year, it was hard to say what “on-market” pricing really was, since deals were priced individually according to size, sector, and the willingness of banks to support the transaction. There was simply not enough dealflow, nor any real bench-mark primary loan issuance, to say where margins had shaken out after 2008’s turmoil.
On this individual basis, arrangers were willing to co-ordinate bank-club syndicates. But they shied away from underwriting new deals, due to the uncertain depth of market liquidity for new transactions.
The club route is by far the safest and has allowed deals to get done, but on the whole it meant that activity was confined to small sit-uations. It also changed the way sponsors could compete during auctions. Rather than searching around for the arranger that was willing to underwrite the most aggressive debt package, sponsors had to learn to make do with one staple financing that typically used all the available liquidity and left no room for discussion.
Despite their limitations, bank clubs kept the market alive—just barely—during the year, but by the fourth quarter market play-ers were hoping that underwriting appetite would improve into 2010 and that deal sizes would start to increase.
Bring Back The FundsOne part of the primary market that was almost entirely absent during 2009 is the institutional-investor base. Having reached a position of great power in the boom market, making up 57% of primary syndication in 2007, this year institutional investors were missing from primary syndication.
CLO managers were busy working through problem credits and were unable to raise new vehicles, while non-CLOs focused their buy-ing power—such as it was—on the secondary market opportunities that were so rich, at least in the first half of the year.
Without this investor base, new deals relied on banks, who themselves were coping with internal constraints on lending, political pres-sure to keep their noses clean, and coping with rigorous Basel II capital requirements in a declining credit environment.
But into the fourth quarter, institutional investors, including CLOs, had started to amass cash and began to look around for ways to put it to work. This trend was stron-ger in the U.S. market, where the institutional investor base is deep and varied, but even in Europe a trickle of scheduled and unsched-uled repayments (including some from bond issuance, mergers and acquisitions, and buy-backs from performing and nonperforming credits) began to mount up.
Over the course of the year repayments have been very thin. From January through October 2009, a total of €3.1 billion was repaid out of the S&P European Leveraged Loan Index (ELLI), including only one full repayment. By comparison, a total of €5.4 billion was repaid during 2008 and €34.5 billion during 2007.
The gradual build-up of cash within the fund world gave some hope that in 2010 the
1Q 2004 3Q 2004 1Q 2005 3Q 2005 1Q 2006 3Q 2006 1Q 2007 3Q 2007 1Q 2008 3Q 2008 1Q 2009 3Q 200950
60
70
80
90
100
110
Chart 3 S&P European Leveraged Loan Index—Average Bid

Loans Limp Along, High-Yield Strides Out As Europe Moves Into Recovery Mode In 2009
www.standardandpoors.com34
European market would gradually recover some of its depth, allowing for slightly larger deals, underwritten rather than clubbed, and sold to a mix of investors rather than to banks only. Indeed, by the fourth quarter, the calls for new product to feed hungry funds were getting louder.
Trading Up, Up, UpOne of the key drivers of fund appetite—and more importantly of the improvement in overall market sentiment during 2009—was the secondary market’s extraordinary perfor-mance (see charts 3 and 4).
Extraordinary is certainly the right word. The 2008 post-Lehman crash in loan prices was a long way beyond the worst expectations of even the most fearful or fanciful market par-ticipant. The average bid of LCD’s European Institutional Flow Names dropped to a hideous low 60.23% of par at year-end- 2008, while the average bid of the broad market composite did not bottom out until late March when it scraped down to 56.31% of par.
But 2009’s rally has also been well beyond the ordinary. The flow names gained more than 30 points during the first 10 months of the year to end October at 92.91% of par, while the ELLI returned a record-busting 38.82% over the same period, based on huge market value gains.
During the first quarter, only the strongest names were rallying, but into the second quarter a swathe of assets, including some underperformers, gained ground as investors hunted for yield. The opportunities to make
money have been tremendous for trading desks and mark-to-market buyers. CLOs also felt the benefit of the rally, as more assets have been lifted back within buying range above the 80-85% of par mark, and assets rated ‘CCC’ assets also rallied, lessening the pain inflicted by overflowing ‘CCC’ buckets.
Indeed, the ‘CCC’ assets within the ELLI rallied most aggressively during the summer, relative to the ‘BB’ and ‘B’ rating categories, indicating that buyers were jumping on the chance to extract excellent value from the most risky assets.
By the autumn, the rally had squeezed much of the value out of the secondary mar-ket, and paper was scarce. The yield to maturity on the flow names had tightened to E + 502 by the end of October, from E + 1,536 at the beginning of January. This helped drive investors’ attention back towards the primary market, in search of new investment opportunities.
High Hopes For High-YieldOne of the anxieties for leveraged companies is the question of how to refinance outstand-ing debt. On the assumption that neither the bank nor fund market will recover sufficient appetite for leveraged debt to refinance all of the outstanding paper within the required time frame, many borrowers will in due course face the problem of how to meet pay-ments on maturing debt.
This problem is not so acute in Europe as it is in the U.S., since so much of the out-standing European paper was put in place in
1Q 2
004
2Q 2
004
3Q 2
004
4Q 2
004
1Q 2
005
2Q 2
005
3Q 2
005
4Q 2
005
1Q 2
006
2Q 2
006
3Q 2
006
4Q 2
006
1Q 2
007
2Q 2
007
3Q 2
007
4Q 2
007
1Q 2
008
2Q 2
008
3Q 2
008
4Q 2
008
1Q 2
009
2Q 2
009
3Q 2
009
3ME
10/3
0/20
09
(10)
(5)
0
5
10
15
200
(%)
Chart 4 S&P European Leveraged Loan Index—Total Return

Standard & Poor’s ● A Guide To The European Loan Market� January 2010 35
2006 and 2007 with seven- to nine-year maturities. But for some borrowers, includ-ing nonsponsor leveraged corporates, the problem is more immediate, and lenders to certain credits were asked to roll into longer-dated tranches with higher margins.
During the year, the high-yield bond mar-ket emerged as an invaluable refinancing route. This trend developed rapidly in the U.S., and fed across into Europe. By the fourth quarter there were high hopes that high-yield issuance was going to boom in 2010 not only for refinancings but also--in-vestors hoped—for new business.
Two powerful drivers opened the way for high-yield. First, the stalling of the leveraged loan engine has left companies to seriously consider other financing options. Secondly,
low interest rates drove investors toward the fixed-income products.
On top of this, issuers themselves needed the product. Although leveraged merger and acquisition activity was feeble during much of the year, the need for refinancing meant there was a call for high-yield.
During the first 10 months of the year, €14.3 billion in paper was raised in the high-yield market from 33 deals (see chart 5). (All but €189 million of this was fixed rate.) Out of this, general refinancing accounted for 48%, and a further 14% specifically went for for refinancing bank debt.
One popular play that developed during the year was to replace senior secured loans with senior secured bonds that were longer-dated but pari passu in terms of security.
1Q 2
006
2Q 2
006
3Q 2
006
4Q 2
006
1Q 2
007
2Q 2
007
3Q 2
007
4Q 2
007
1Q 2
008
2Q 2
008
3Q 2
008
4Q 2
008
1Q 2
009
2Q 2
009
3Q 2
009
3ME
10/3
0/20
09
0102030405060708090
100
( il.)€ b
Leveraged loans Mezzanine High-yield bonds
Chart 5 European Leveraged Finance New-Issue Volume
2004 2005 2006 2007 2008 Jan.-Oct. 20090
1020
3040
50
60
7080
90
(No.)
Defaults Restructurings
Chart 6 Distressed Credits—Number Of Defaults Vs. Restructurings

Loans Limp Along, High-Yield Strides Out As Europe Moves Into Recovery Mode In 2009
www.standardandpoors.com36
Lenders showed a willingness to consent to having bonds rank alongside them, because it brought them a repayment at par.
Into the fourth quarter, strong demand from investors compressed spreads and made the market all the more attractive for other potential issuers, including some new-comers. High-yield desks within banks were in celebratory mood.
But a question mark remained over the role high-yield would play in new capital-raising for acquisitions in the year ahead. Some were confident that the bond market was set to establish itself as a viable alternative source of funding, while others questioned how easy it would be for would-be borrowers to handle the reporting requirements in what has tradi-tionally been a much more private market environment than the U.S.
A Distressed YearBut away from the loan clubs, secondary rally, and high-yield resurgence, 2009 was in essence a year for dealing with distressed credits.
The global recession took a heavy toll on over-leveraged companies, and investors felt the strain as the queue of businesses needing to restructure their balance sheets lengthened. Lenders had to get to grips with the implica-tions of Europe’s varied legal systems, and hastily had to turn theoretical knowledge into practical negotiating skill to get the best result out of a nasty situation.
In late 2008 and 2009’s first quarter, there was a series of sudden collapses as compa-nies destocked and borrowers rapidly crashed into covenants and failed to make interest payments.
In the first half of the year, LCD tracked 61 distressed issuers, including default or entering a restructuring process (see chart 6). This rate appeared to ease off in the second half, but, nevertheless LCD’s implied distress rate stood at 8.1% at the end of October, up from 6.3% at the end of June, and 2.2% at the start of 2009.
During negotiations that were often highly-charged and drawn-out, sharp differences emerged as to what different investors regarded as a good result.
On one side, many banks and CLOs argued in favour of light haircuts to the exist-ing debt and instead preferred to cut margins or accept payment-in-kind margins to pre-serve as much debt as possible in the capital
structure. On the other side, mark-to-market funds and nonpar buyers including distressed funds argued in favour of reducing debt steeply but retaining a good margin, and making up for the pain of the debt write-down through the upside in equity.
This argument played out, in various forms, across numerous situations. The power often lay in the hands of whichever parties could contribute additional cash to solve a liquidity problem, but in other cases investors built up blocking stakes via second-ary trading. In a small number of instances, courts decided the matter—but out-of-court settlements were popular, even if it took time and trouble to reach an agreement.
During the year, the volume and sudden-ness of defaults and heavy restructurings started to slacken, and the number of lighter restructurings and covenant amendments began to pick up by comparison.
But these covenant amendments were also a battleground in some cases, as investors demanded better terms in exchange for their leniency, and as syndicate members argued among themselves about whether to allow a reset or push for a full restructuring.
Various trends emerged through the year in the distressed forum, including the use of debt buybacks that saw the sponsor or com-pany buying debt up below par, either qui-etly behind the scenes or via an open auction process. Sponsors favored this as an efficient way to inject new money and bring about deleveraging.
Including debt buybacks for performing companies, a total of €1.1 billion debt was tendered during the year in Europe.
These restructurings and resets dominated most of the year, and it was only in the fourth quarter that market players really began to think about moving forward again.
There appeared to be decent appetite for new paper, but little product with which to test the depth of this demand, and there was also a slowing in the bad-news flow that helped lift sentiment. Added to this, the U.S. returned to GDP growth, allowing investors to hope that European countries would follow suit.
These factors gave investors reason to believe that deal flow would improve in 2010, in turn giving them a better chance of freeing up capital and raising new funds to restart a virtuous circle and get the market moving again. l

Standard & Poor’s ● A Guide To The European Loan Market� January 2010 37
Since the end of 2008 and the beginning of 2009, the unprecedented fiscal and monetary support that authorities provided has given key support to the major industrialized economies in Europe and the U.S. and their systemically important banks. This support has gradually improved the funding options for (initially) more highly rated companies, but it has also engendered a more supportive stance from the lender community when faced with potential covenant issues for more highly levered credits.
Specifically, lenders, for the near term at least, are placing the greatest emphasis on short-term cash generation and the ability to service interest payments even where there are clearly longer term refinancing issues that they must still address. This has led to a slow-down in the rising default rate since the end of the first quarter.
In our view, improving visibility and con-fidence in the economic outlook, short-term interest rates at historical lows, and a desire on behalf of lenders to minimize debt write-downs, suggests that under our baseline sce-nario the corporate speculative-grade default rate would fall to 8.7% at the end of 2010. This would be a material improvement over 2009. However, we anticipate that the shal-
low recovery will limit top-line growth in most sectors, capacity utilization will take several years to recover to 2006-2007 levels and, therefore, internally generated cash flow won’t be able to pay down enough debt to prevent a debt restructuring in the next two or three years for many companies. In our view, this will ensure that the default rate, while declining, will likely remain somewhat higher than the long-term average of 4.5% for longer than we might normally expect over the course of a more typical economic cycle.
Marking the default experience in the European leveraged finance market during the first three quarters of 2009 were:• We revised the headline default rate (by
number) for the 12 months to Sept. 30, 2009 up to 13.8% from the preliminary 13.1% that we published on Nov. 4.
• 101 European speculative-grade companies in our data sets defaulted over the past 12 months on E71.1 billion of outstanding drawn debt, of which 23 companies defaulted in the third quarter with out-standing debt of E12.8 billion.
• The equivalent default rate by value at the end of the third quarter was 9.9%,
The number of defaults in 2009 to the end of September was
the highest on record, with 101 corporate defaults for specu-
lative-grade companies in Western Europe. This translates into
a revised trailing 12-month default rate of 13.8%. That period
reflects the full 12 months of fallout from the Lehman Brothers
collapse in September 2008. Companies that had severe liquidity
issues and few, if any, external funding options available almost
immediately felt the recession’s impact.
Western European Leveraged Loan
Defaults Should Have Peaked In Q3
2009, But Only Gradually Fall In 2010
Paul Watters London (44) 20-7176-3542
Alexandra Krief Paris (33) 1-4420-7308

www.standardandpoors.com38
Western European Leveraged Loan Defaults Should Have Peaked In Q3 2009, But Only Gradually Fall In 2010
up from a revised 8.3% at the end of the second quarter.
• We anticipate that the third quarter will most likely represent the peak in the trail-ing 12-month speculative-grade corporate default rate, with the default rate by num-ber slipping back below 12% at the end of 2009. This would place the 2009 full-year outcome within the 11.7% (base case) and 14.7% (downside case) range that we pro-jected for the end of the year back in early April (see “Leveraged Buyouts Are Fuelling Surging Defaults in Western Europe,” pub-lished April 8, 2009, on Ratings Direct).
• Under our base case scenario for year-end 2010, we project that the default rate could
fall further to 8.7%. This would corre-spond to 55 companies defaulting. When evaluating the defaults, we use
European corporate data that combines both speculative-grade industrial credits publicly rated by Standard & Poor’s with companies that are leveraged loan issuers where Standard & Poor’s provides privat credit estimates.
Default Rate Increases To A Revised 13.8%As of Sept. 30, 2009, Standard & Poor’s had identified 101 defaults over the previous 12 months, which is more than six times the 16 defaults that we saw in the 12 months ended
—Private credit estimates— —Public speculative-grade ratings— TTM default TTM default TTM default Number¶ Defaults rate (%) Number¶ Defaults rate (%) rate combined
2003 180 5 2.8 111 5 4.5 3.4
2004 263 4 1.5 126 2 1.6 1.5
2005 334 5 1.5 147 2 1.4 1.5
2006 461 8 1.7 152 4 2.6 2.0
2007 567 8 1.4 152 3 2.0 1.5
2008 609 35 5.7 146 5 3.4 5.3
Q408 609 23 5.7 146 4 3.4 5.3
Q109 604 25 9.8 146 5 6.9 9.2
Q209 598 20 12.4 146 1 7.6 11.4
Q309 589 18 14.6 144 5 10.4 13.8
*Europe = EU plus Iceland, Norway, and Switzerland. ¶Average number in database over period. TTM—Trailing 12 months.Source: Standard & Poor’s.
Western European Public And Private Speculative-Grade Default*Table 1
Company Country Industry Default date
Akerys Holdings S.A. France Real estate February 10, 2009
Castle HoldCo 4 Cayman Islands Real estate February 17, 2009
Bite Finance International B.V. Lithuania Telecommunications March 19, 2009
Sensata Technologies B.V. Netherlands Aerospace/automotive/capital goods/metal March 31, 2009
NXP B.V. (A) Netherlands High technology/computers/office equipment April 2, 2009
Thomson S.A. France Consumer/service sector May 7, 2009
Safilo SpA Italy Consumer/service sector July 3, 2009
CEVA Group PLC Netherlands Transportation July 20, 2009
Treofan Holdings GmbH Germany Health care/chemicals July 29, 2009
ESCADA AG Germany Consumer/service sector August 14, 2009
Head N.V. Netherlands Leisure time/media August 14, 2009
*Western Europe = EU plus Iceland, Norway, and Switzerland.Source: Standard & Poor’s GFIR: “Global Bond Markets’ Weakest Links And Monthly Default Rates,” published Dec. 4, 2009.
Western European Publicly Rated Corporate Defaults Through Sept. 2009*Table 2

Standard & Poor’s ● A Guide To The European Loan Market� January 2010 39
Sept. 30, 2008. This breaks down into 86 defaults (see table 1) in our private credit esti-mate portfolio and 15 publicly rated indus-trial sub-investment grade issuers, of which 11 occurred in 2009 (see table 2).
The trailing 12-month default rate (by number) to the end of September 2009 was 13.8%, higher than the 11.4% default rate at end Q2 2009 and more than double the 5.3% rate at the end of December 2008 (see chart 1). Of note, the default rate within our private credit estimate portfolio, at 14.6% at the end of September 2009, remains significantly higher than the equiva-lent 10.4% rate for those publicly rated companies that defaulted in the same period. Essentially, this reflects the higher average level of credit risk for smaller, more highly leveraged companies (mainly LBOs), where institutional investors have requested private credit estimates.
The total outstanding debt held by these defaulting companies before default was
E71.07 billion in the 12 months to Sept. 30, 2009. This compares with only E5.66 bil-lion in the comparable prior year period to Sept. 30, 2008.
Default Rate By Value Was 9.9% At The End Of September 2009 The 12-month default rate by value, combin-ing both public ratings and private credit esti-mates, stood at 9.9% at the end of September 2009 compared with 8.3% at the end of June 2009 and 4.5% at the end of December 2008 (see table 3).
For the first time during this cycle the default rate by value for those companies for which we provided private credit estimates is almost as high as the equivalent default rate for publicly rated companies. This reflects not only the higher number of defaults in the pri-vate credit estimate portfolio but also the increasing number of large private companies that have defaulted.
—Private credit estimates— —Public speculative-grade ratings— 12-month 12-month 12-month No. of Value default No. of Value default default rate defaults (bil. ) rate (%) defaults (bil. ) rate (%) % combined
Fourth-quarter 2008 23 7.45 3.3 4 19.98 5.6 4.5
First-quarter 2009 25 8.73 5.0 5 3.35 6.5 5.8
Second-quarter 2009 20 10.50 7.8 1 8.23 8.8 8.3
Third-quarter 2009 18 7.96 9.8 5 4.86 10.0 9.9
*Europe = EU plus Iceland, Norway, and Switzerland.Source: Standard & Poor’s.
Western European Public And Private Speculative-Grade Defaults (By Value)*Table 3
2003 2004 2005 2006 2007 2008 Q408¶ Q109¶ Q209¶ Q309¶0
2
4
6
8
10
12
14
16
(%)
Private credit estimates Public speculative-grade ratingsCombined
Chart 1 Western European Speculative-Grade Default Rate*

www.standardandpoors.com40
The average drawn debt outstanding for the private credit estimate companies in the third quarter was E442 million, up from E349 million in the first quarter. Similarly, the average outstanding debt amount for those publicly rated speculative-grade com-panies that defaulted decreased to E971 mil-lion in the third quarter from E1.63 billion in the first quarter.
Eight private companies defaulted with more than E1 billion of outstanding debt in the first nine months of 2009, of which four occurred in the second quarter and three in the third.
We derive outstanding debt at default from the latest financial data available before default.
Breakdown Of European Defaults By Sector Six sectors contributed just over 70% of the defaults seen in 2009 and the level of defaults has been worse (apart from retail/restaurants) than we would expect by the their 57% sec-tor weight in the overall combined portfolio
of private credit estimates and public ratings (see table 4).
The third quarter saw a sharp fall in the number of defaults in the automotive and homebuilders/real estate sectors, mainly reflecting the severity of the early cycle impact during late 2008 and early 2009. Even so, automotive contributed almost 10% of all 2009 defaults and has the highest default rate relative to their 5.4% sector weight in our combined portfolio.
In 2009, the healthcare sector stands out for its defensive quality as reflected in only two defaults through the end of September 2009, although telecommunications (1.4%) and oil and gas also had relatively few defaults relative to their sector weights.
Germany, Spain, And Italy Contributed Disproportionately To Default LevelThe six larger countries in Europe account for almost 82% of the companies by number in our combined speculative-grade dataset. Of those, Germany (17 2009 defaults), Spain
First- Third- % 2009 Sector weight (Combined datasets) 2003 2004 2005 2006 2007 2008 half 2009 quarter 2009 defaults (% Sept. 2009)
Media and entertainment 2 1 0 2 2 5 9 3 16.2 15.2
Chemicals, packaging, and environmental services 0 0 1 1 1 7 4 5 12.2 8.1
Business equipment and services 0 0 0 0 1 1 4 4 10.8 9.3
Homebuilders/real estate 0 0 0 0 0 7 7 1 10.8 8.0
Retail/restaurants 1 0 4 0 1 4 6 2 10.8 10.5
Automotive 0 1 0 5 2 4 7 0 9.5 5.4
Consumer products 1 1 0 2 2 5 3 2 6.8 8.5
Capital goods 0 1 0 0 1 1 2 2 5.4 6.7
High technology 1 0 0 1 0 1 2 1 4.1 2.6
Metals, mining, and steel 0 0 0 0 1 0 2 1 4.1 1.8
Transportation 1 0 1 0 0 2 2 1 4.1 5.3
Healthcare 0 1 1 1 0 2 1 1 2.7 8.6
Paper and forest products 0 0 0 0 0 0 1 0 1.4 0.9
Telecommunications 1 0 0 0 0 1 1 0 1.4 3.9
Aerospace and defense 0 0 0 0 0 0 0 0 0.0 1.1
Oil and gas, exploration and production 1 0 0 0 0 0 0 0 0.0 2.6
Utility 1 1 0 0 0 0 0 0 0.0 0.5
Total 9 6 7 12 11 40 51 23 100.0 100.0
*Europe = EU plus Iceland, Norway, and Switzerland. Source: Standard & Poor’s.
Defaults Of Western European Speculative-Grade Companies By Sector*Table 4
Western European Leveraged Loan Defaults Should Have Peaked In Q3 2009, But Only Gradually Fall In 2010

Standard & Poor’s ● A Guide To The European Loan Market� January 2010 41
(eight), and Italy (six) have fared relatively poorly in 2009, with more defaults than their country weights would suggest (see table 5). Germany has suffered due to the importance of manufacturing and exports to its industrial base, with the automotive sector hit particu-larly badly. The economic downturn in Spain and the lack of domestic funding avenues appear to have severely hurt leveraged cor-porate companies across a range of sectors. There is little discernable pattern to the defaults seen in Italy in terms of sector con-centration, company size, or timing of default, although it is clear that all but one defaulted due to missing a payment.
Conversely, the number of defaulted credits in France is notably low, continuing the pat-tern seen in 2008. This is due partly to the low concentration of LBOs in the industrial equipment, automotive, and building and development segments. In addition, French consumers fared better than their more indebted counterparts in countries like the U.K., Spain, and Ireland, for instance.
This compares with 2008, when France had only four (10%) of the 40 speculative-grade corporate defaults in Western Europe, compared with the U.K.’s 14 (35%; the most), followed by Germany with 6 (15%).
The Netherlands and Spain each had three defaults (8%), while Italy suffered only two.
Missing Payments Remains The Most Common Driver Of Default By type of default, missing a payment (usu-ally interest rather than principal) continues to be the commonest reason for default, causing 46% of defaults in 2009 so far (see chart 2).
A variation on a missed payment is when a company enters into a standstill arrangement with its lender group in response to say a breach or potential breach of covenants to allow enough time to commission a restruc-turing plan. When a lender defers or waives an interest or principal payment under such an arrangement, Standard & Poor’s criteria defines that as a default. In Europe, we have classified 24% of 2009 defaults in this way. Notably, the frequency of standstill agree-ments subsequently leading to a default fell sharply in the third quarter to only 9% per-haps due to improving management confi-dence in business forecasts, as well as lenders being more amenable to waiving or resetting covenants in response to moderate short-term underperformance issues.
Country weight (Combined data sets) Total % 2009 defaults (% Sept. 2009)
Germany 17 23.0 16.7
U.K. 13 17.6 25.1
France 9 12.2 19.9
Netherlands 8 10.8 9.2
Spain 8 10.8 6.5
Italy 6 8.1 4.3
Sweden 3 4.1 3.2
Belgium 2 2.7 2.2
Switzerland 2 2.7 2.0
Greece 1 1.4 1.1
Hungary 1 1.4 0.8
Ireland 1 1.4 1.3
Lithuania 1 1.4 0.4
Luxembourg 1 1.4 1.1
Norway 1 1.4 1.1
Total 74 100.0
*Through Sept. 2009. Europe = EU plus Iceland, Norway, and Switzerland. Source: Standard & Poor’s.
Defaults Of Western European Speculative-Grade Companies By Country*Table 5

www.standardandpoors.com42
Debt restructurings for distressed compa-nies where payments are deferred or maturi-ties extended, debt is exchanged for equity, or where distressed exchange offers or debt buy-backs occur at discounts to par caused almost a quarter of defaults seen year to date and a higher 30% in the third quarter. Five of the 17 restructurings that we categorized as defaults related to distressed exchange offers for publicly rated companies.
The Scope Of Standard & Poor’s European Leveraged Finance Market DatabaseTo arrive at the conclusions in this report, we have regrouped our corporate ratings involv-ing regular interaction with companies’ man-agement teams into 17 standard industry classifications. We have similarly regrouped our private credit estimates, which are estab-lished on the basis of information provided by third parties. Credit estimates are, for the most part, used in assessing the asset pools of collat-eralized loan obligations. On Sept. 30, 2009, Standard & Poor’s speculative-grade universe in Western Europe consisted of 145 public rat-ings on discrete groups or companies and 578
credit estimates. Geographically, these spread across the 27 countries that make up the EU, plus Iceland, Norway, and Switzerland.
Standard & Poor’s Definition Of DefaultStandard & Poor’s records a default when a company fails to make a payment of princi-pal or interest, files for bankruptcy, or experi-ences a restructuring that meets certain conditions including exchange offers that we view as distressed. The first two categories are usually fairly straightforward and include standstill agreements where lenders agree to waive or defer interest or principal payments without adequate compensation. In Europe, restructurings appear to be becoming a more frequent cause of default and we anticipate that this will continue over the next couple of years as and when lenders accede that a bal-ance sheet restructuring is necessary. The cir-cumstances where a distressed exchange offer translates into an event of default are clearly articulated in an S&P General Criteria article “Rating Implications Of Exchange Offers And Similar Restructurings, Update,” pub-lished May 12, 2009. l
Filing (7%)
Standstill (24%)
Restructuring (23%)
Payment (46%)
Chart 2 Public And Private Defaults By CauseThroughThird-Quarter 2009
Western European Leveraged Loan Defaults Should Have Peaked In Q3 2009, But Only Gradually Fall In 2010

Standard & Poor’s ● A Guide To The European Loan Market� January 2010 43
The recession is proving particularly worrisome for leveraged
buyout companies in Europe, in our opinion. We see that the
earnings growth that sponsors hoped to use to pay down debt is
not materializing, and, in the current economic climate, investors
are forcing restructurings instead of covenant waivers or refinanc-
ings. This mismatch between the expectations of 2005-2007 and the
realities of 2008-2009 is thrown into sharp relief by Standard &
Poor’s Ratings Services’ latest survey of leveraged loan perfor-
mance, which finds companies falling further behind their EBITDA
projections as they wrestle with often unsustainable levels of debt.
Overall, the performance of European spec-ulative-grade companies that have been through a leveraged buy-out (LBO) has been significantly below their initial forecasts for the year-end 2008. In our latest study of LBO performance, 45% of companies were more than 10% behind forecast on EBITDA at the end of 2008, compared with 31% at the end of 2007 (see article “Credit Conditions Deteriorate For Private Equity-Owned And Leveraged Companies In Europe,” published Dec. 10, 2008,on RatingsDirect.)
Since early 2008, in an effort to shed some light on prevailing trends in the European leveraged finance market, Standard & Poor’s has been tracking the performance of a sample from its private credit estimate portfolio of European lever-aged loans, composed primarily of specula-tive-grade loans backing private-equity buyouts. Information on the specific perfor-mance of leveraged loans is difficult to obtain, as the majority are not publicly rated
(according to Standard & Poor’s LCD, only 6.6% by transaction count and 10.8% by volume were publicly rated in 2008). The results featured in this report are based on data collected from 90 companies across 13 sectors on which we provide credit esti-mates. We have also used some data from our portfolio of publicly-rated speculative-grade companies for comparative purposes.
When the results of our first study were published in February 2008, year-end 2007 figures showed that 56% of the sample was behind the companies’ original EBITDA forecasts (see article “European Private Equity Deals Display Wide Disparity In Performance; More Than Half Lag EBITDA Forecasts”, published Feb. 12, 2008 on RatingsDirect). That figure has now sharply increased to 69%. This will come as no sur-prise to the market, as default figures for 2008 and 2009 have spiked to a recently revised 11.0% trailing 12-month rate in Europe, based on Standard & Poor’s pub-licly rated companies and those with credit
LBO Performance In Europe
Falls Behind Expectations
As Recession Bites
Taron Wade London (44) 20-7176-3661
Alexandra Krief Paris (33) 1-4420-7308
Paul Watters, CFA London (44) 20-7176-3542
David Gillmor London (44) 20-7176-3673

LBO Performance In Europe Falls Behind Expectations As Recession Bites
www.standardandpoors.com44
estimates outstanding (see article “Leveraged Loan Defaults Continue To Climb In Western Europe As The Slowdown Exposes Structural Weaknesses,” published Sept. 9, 2009 on RatingsDirect). We see that when debt for these transactions was marketed to investors during the boom years of 2005-2007, transactions were structured and sold on the basis of solid growth prospects, whether they were first-time LBOs, secondary or tertiary buyouts, or recapitalizations. We therefore believe that a shortfall in sales and EBITDA growth will have serious implications for covenant compliance and the ability to refinance an overleveraged balance sheet.
Performance Variance Continues To WidenCompanies were 6.9% behind their median EBITDA projections at the end of 2008. This data has a very wide variation, with a stan-dard deviation of 20.5% (see chart 1). The variation in performance has increased con-siderably compared with year-end 2007. Then, companies were only 1.8% behind median EBITDA projections and the standard deviation was 16.2%. There was also a wide variance across industry sectors at the end of 2008. For the worst-performing sectors, such as health care, chemicals, and packaging, underperformance ranges from 15%-17% behind forecasts.
> 10%behind plan
5%-10%behind plan
0-5%behind plan
0-5%ahead of plan
5%-10%ahead of plan
> 10%ahead of plan
05
101520253035404550
(%)
2008 versus 2007
*Does not include all data from defaulted companies due to lack of information for year-end.© Standard & Poor’s 2009.
Year-end 2007 Year-end 2008
S134263C_02.cdr
Chart 2 Median EBITDA Performance RelativeTo Projections*
Sales EBITDA Debt(10)
0
10
20
30
40
50
(%)
2007 versus 2008
© Standard & Poor’s 2009.
Standard deviation 2007 Standard deviation 20082007 2008
Chart 1 Median Performance RelativeTo Initial Projections From Last Financing

Standard & Poor’s ● A Guide To The European Loan Market� January 2010 45
Many companies in our study were experi-encing severe underperformance by the end of 2008, with 45% more than 10% behind fore-cast EBITDA (see charts 2 and 3). This trend is reflected in the increase in defaults in 2008. Of our sample, 11 companies, or 12.2%, have experienced a payment default, filed for insol-vency, or are undergoing a restructuring. The median EBITDA performance for these com-panies was 29% behind the original forecast at year-end 2008, while the median sales figure was down 18.6%. And 18 companies (20%), including those that have defaulted, have either breached covenants or asked lenders for a waiver or amendment to covenants. This compares with the last update of our study in December 2008, when 12.5% of companies in the study had covenant-related problems.
Operating Performance In Some Sectors Has Been Particularly PoorThe majority of companies in our study are now experiencing a deterioration in operating performance and the predictability of future demand—particularly in sectors such as real estate and home building—remains low. Budgets prepared in 2008 now look optimis-tic, we believe, and have been reforecast to levels lower than the actual figures recorded in 2008. What’s more, there is evidence that these 2009 budgets are still being revised downward as management teams grapple with uncertain future demand.
Suppliers to major manufacturers, mean-while, are suffering from the effects of destocking as consumer demand falls. In the fourth quarter of 2008 and the first quarter of 2009, wholesalers and retailers avoided placing new stock orders as they tried to shift existing inventory. Auto suppliers, in particu-lar, suffered greatly as the automakers cut back their stock orders in line with the col-lapse in auto sales. We understand that some stock reordering is now occurring, but suppli-ers are still suffering the effects of previous quarters. By contrast, food retailers, along with other retailers, are in a better position, as they have more flexibility to cut costs, in our view. They also have a shorter working capital cycle. Although demand in general has fallen—particularly for luxury goods and dis-cretionary items—we believe that most retail-ers can survive on smaller margins in the near term. Chemicals companies, on the other hand, have been hit hard by falling demand because their high fixed-cost bases cannot be adjusted quickly. This was exacerbated by ris-ing raw material prices in 2008.
For example, BorsodChem, a chemical company in Europe, is going through a restructuring with its lenders, according to reports from S&P LCD. It has been hit by falling demand in the industries that use its products, which include construction, auto-motive, and furniture companies. Borsod-Chem recently put in place new management and has started to cut costs, LCD said, but has been overtaken by the speed of the slow-
Greater than 50%behind plan (2)
40%-50%behind plan (4)
30%-40%behind plan (3)
20%-30%behind plan (9)
10%-20%behind plan (19)
0
10
20
30
40
50
60
(%)
Year-end 2008
*Does not include all data from defaulted companies due to some missing information for year-end 2008.© Standard & Poor’s 2009.
Chart 3 Distribution Of Companies MoreThan 10% Behind Median
EBITDA Projections*
S134263C_03.cdr

LBO Performance In Europe Falls Behind Expectations As Recession Bites
www.standardandpoors.com46
down. (We are citing BorsodChem as an example known in the market, but Standard & Poor’s does not disclose any of the LBO companies included in our study, or any of the companies on which we maintain credit estimates).
Sales at a number of companies appear to have grown rapidly from year-end 2007 to year-end 2008. However, closer inspection reveals that this is mostly due to acquisitions, which can also increase debt levels at the same time. Meanwhile, companies with high fixed-cost bases were not able to adjust quickly to a sharp drop in demand. Others had high levels of capital expenditure (capex) and were not able to increase EBITDA quickly enough to compensate for this.
As an example, another LBO in Europe, food-retail business Service Select Partners (SSP), has now defaulted through a missed interest payment, according to LCD. Lenders have been concerned about the company’s lack of EBITDA growth since March 2009. According to LCD, lenders were worried about SSP’s drive to increase the number of outlets it operates, and the accompanying high capex spend, since they did not see EBITDA growing in line with the expansion of the business.
In an effort to deleverage their balance sheets, some of the companies in our sample have received equity injections from their spon-sors, since increases in profitability have not been sufficient to decrease their ratio of debt to EBITDA.
Cable and telecoms Business equipment Industrials Food retail Retail(20)
(15)
(10)
(5)
0
5
10
(%)
Year-end 2007 versus 2008
© Standard & Poor’s 2009.
2007 2008
S134263C_04.cdr
Chart 4 Best-Performing Sectors (Median EBITDA Versus Projection)
Health care Chemicals Packaging Publishing Autos Building Food products(20)
(15)
(10)
(5)
0
5
10
(%)
Year-end 2007 versus 2008
© Standard & Poor’s 2009.
2007 2008
S134263C_05.cdr
Chart 5 Worst-Performing Sectors (Median EBITDA Versus Projection)

Standard & Poor’s ● A Guide To The European Loan Market� January 2010 47
Not all sectors posted a decline in their EBITDA performance relative to that pro-jected at the end of 2008. Cable and telecom-munications, business equipment, industrials, food retail, and general retail generally per-formed according to plan. Two of these, busi-ness equipment and industrials, even improved their performance relative to that at year-end 2007 (see chart 4). The worst per-forming sectors were health care, chemicals, packaging, publishing, autos, building, and food products (see chart 5).
Deleveraging Is Not Possible Without EBITDA GrowthLeveraged buyouts are typically intended to expand a company sufficiently to generate enough cash to begin to repay debt, as well as reduce its leverage ratios. When sponsors purchase these companies, they usually show potential investors detailed proposals for how they plan to accomplish this, including specific projections for sales, EBITDA, and absolute debt levels. This presupposes that companies will be able to pay back debt using earnings growth. However, as our data show, in the majority of cases, the sponsors’ planned earnings growth did not materialize. This has resulted in absolute debt levels rela-tive to forecast increasing in 2008 from 2007. At the end of 2008, average debt levels were 11.4% higher than originally planned. A year earlier, the figure was 6.6%. The averages are much higher than the median figures for this data as the standard devia-tions increased dramatically to 41.9% from 20.1% (see chart 1).
We have seen that the typical LBO strategy of cutting costs and increasing profitability and cash flow to pay back debt can work well for companies that are traditionally able to
sustain high amounts of leverage. However, in the push to find suitable transactions, compa-nies that were cyclical or needed high levels of capex, for example, in our view took on unsustainable levels of debt. Headline figures generally focus on the bigger transactions with high absolute leverage, such as VNU World Directories, now called Truvo Subsidiary Corp. (CCC+/Negative/—), or Alliance Boots (not rated). That said, there were many smaller transactions with lower debt multiples that were to prove unsustain-able, and these also contribute to the high rate of defaults.
Cash Flow Protection Measures Appear WeakThe weakness of the average cash flow pro-tection measures—EBITDA to net interest, funds from operations (FFO) to net debt, and debt to EBITDA—of the companies in our study is a direct result of lower-than-expected EBITDA growth. In most cases, where lever-age has shot up substantially, the cause was an absolute decline in EBITDA as a result, we believe, of the weakening economic environ-ment. Some companies were able to improve their working capital or cut capex to improve their cash flow or leverage ratios. However, we see that very few companies are delever-aging through true growth in profitability and cash flow.
The average EBITDA-to-net-interest multi-ple for the companies in our study is 2.2x, while FFO to net debt is 10%. These are close to the average metrics for a company with a credit estimate of single-b in the sam-ple. Average leverage (net debt to EBITDA) of 7.6x is slightly higher than the average level (6.5x) for a ‘b’ credit estimate in the sample (see table 1).
(Most recent credit estimate review)
No. of companies Credit estimate EBITDA/net interest (x) FFO/net debt (%) Debt to EBITDA (x)
4 BB- 3.7 19.3 3.7
12 B+ 3.1 16.3 4.1
34 B 2.2 8.9 6.5
22 B- 1.8 4.7 9.1
FFO—Funds from operations.
Average Credit Metrics Of Credit Estimates In Our LBO Performance Study
(‘BB-’ To ‘B-’ Categories)
Table 1

LBO Performance In Europe Falls Behind Expectations As Recession Bites
www.standardandpoors.com48
The credit metrics for the companies in our study are, on average, slightly worse than those for our publicly rated portfolio. But in the speculative-grade category, companies that pursue a public rating generally have a higher rating than those without a public rat-ing. As an example, for the companies in our study with credit estimates ranging from ‘bb-’ to ‘b-’, only 6% are at the ‘bb-’ level. The equivalent figure in our publicly rated portfo-lio is 28%. Similar ly, of the companies in our study within that range, only 17% have a credit estimate of ‘b+’. For our publicly rated speculative-grade portfolio, that figure is 36%. (See tables 1 and 2.)
In general, in our opinion, the credit qual-ity of companies in our sample has fallen significantly since we first published the results of our study in early 2008. The num-ber of credit estimates at ‘b-’ and ‘ccc+’-to-default both grew, while the number of credit estimates at ‘bb’, ‘b+’, and ‘b’ declined (see chart 6).
Covenant Breaches Can Quickly Lead To DefaultsIn our opinion, the majority of reported cov-enant breaches in 2008 were technical. What we see as very aggressive plans to deleverage through EBITDA growth meant that compa-nies breached covenants even if their operat-ing performance was healthy. Now, however, most breaches no longer fit in this category. Rather, they are triggered by true operating difficulties. We see that in many cases this results in liquidity problems for manage-ment, because companies are usually unable to rely on undrawn revolving credit facilities when in breach.
Waivers and resets, which were relatively easy and quick to agree on in early 2008, have become harder to obtain. As a conse-quence, toward the end of 2008 and through-out 2009, covenant breaches have often led more quickly to defaults. In the second half of 2008, the average time from a financial covenant breach to a payment default, dis-
‘BB’ (5, 4)* ‘B+’ (20, 12) ‘B’ (46, 34) ‘B-’ (17, 22) ‘CCC+’to default (2, 12)
0
10
20
30
40
50
60
(%)
February 2008 versus July 2009
*Number of credits in each category (2008, 2009).© Standard & Poor’s 2009.
Feb. 2008 July 2009
Chart 6 Distribution Of Credit Estimates Included In Our Study
Fiscal year-end 2008
No. of companies Rating EBITDA/net interest (x) FFO/net debt (%) Debt to EBITDA (x)
27 BB- 5.7 32.1 4.3
35 B+ 3.7 15.8 4.7
20 B 2.0 11.1 5.6
14 B- 1.6 4.2 8.7
FFO—Funds from operations.
Average Credit Metrics Of Companies Publicly Rated By S&P
(‘BB-’ To ‘B-’ Categories)
Table 2

Standard & Poor’s ● A Guide To The European Loan Market� January 2010 49
tressed debt exchange, or restructuring con-tracted to 2.0 months from 7.5 months in the first half of the year.
Of the transactions included in the study, 56% were syndicated in 2007, 36% in 2006, and 7% in 2005 or earlier. Transactions from 2006 and 2007 are suffering from underper-formance due to aggressive growth projec-tions, in our view. Default rates have risen substantially in 2009 and we believe that the peak in Europe may occur later in 2009 as the full 12 months of trading following the bankruptcy of Lehman Brothers translates into a higher level of defaults. This will, in our view, cause more companies to breach covenants and force them into standstills and restructuring negotiations with lenders.
Could More Conservative Structures Bring Greater Stability?Looking forward, we aim to focus our atten-tion on whether such restructurings address
the fundamental problems faced by compa-nies that are in default. We believe that many companies, sponsors, and lenders are simply buying time: By extending term loan A maturities, converting cash interest pay-ments to payments-in-kind (or taking advan-tage of lower interest rates), and taking out any balance-sheet solvency tests to avoid taking painful write-offs now, in the hope that the economic outlook, and therefore valuations, will eventually improve.
In our view, the leveraged finance market in Europe is truly being tested in this current recession, mainly because it differs so funda-mentally from the nascent market that existed in 2003, before the influx of capital that expanded the capacity for borrowers to raise record amounts of debt. To enable the market to recover and attract capital again, we believe that new and restructured transac-tions will need to revert to more conservative structures, with lower leverage, tighter docu-mentation, and greater investor protection. l
www.standardandpoors.com50
Is History Repeating Itself In The
European High-Yield Market?
Standard & Poor’s Ratings Services believes that there is no replacement for fundamental credit analysis and that investors are best served by understanding the nature and risks of their investments, including their probabil-ity of default and the recovery potential for speculative-grade debt in case the worst hap-pens, in order to determine whether the pric-ing on offer is commensurate with the risk. We believe investor understanding is vital if the European high-yield bond market is to develop into a mature and liquid capital mar-ket, with a stable infrastructure for pricing and trading risk.
However, amid calls for market discipline, not least from banking chiefs, the reality appears somewhat different. Standard & Poor’s believes that the lack of returns in money markets and investment-grade bonds may be prompting new investors to enter the European high-yield market, compressing spreads as volumes remain low. This market data may suggest that investors may not fully be factoring credit risk into their investment decisions, given the tight pricing of new issu-ance and the reemergence of creditor-unfriendly transaction terms.
In July 2009, Standard & Poor’s predicted that refinancing needs would drive European companies toward the high-yield bond mar-
ket because traditional sources of leveraged funding—bank loans and collateralized loan obligation proceeds—have not been as readily available as in the past (see “Refinancing Needs Drive Leveraged Companies In Europe Toward The High-Yield Bond Market,” pub-lished July 29, 2009, on Ratings Direct). Although 74% of all issuance in the European leveraged finance market in the third quarter of 2009 came from high-yield bonds, according to Standard & Poor’s Leveraged Commentary and Data (LCD), volumes still remain relatively low, compared with the period before the market dislocation. In 2006 there was just over E30 billion of issuance, which fell to zero in 2008. For 2009 year-to-date, according to data from Standard & Poor’s and Dealogic, high-yield borrowers have issued E17 billion in bonds, close to the E19 billion borrowed in 2007 before the mar-ket came to a halt in the middle of the year, (see chart 1).
There has been strong demand for these high-yield volumes, as shown by recent heav-ily oversubscribed transactions, such as HeidelbergCement AG’s (B+/Positive/B) E2.5 billion bond offering and Germany’s Evonik Industries’ (not rated) E750 million 7% notes. Both bonds trade above par in the secondary market, like investment-grade bonds, accord-
We Believe That Investor Understanding Is Vital For Market Development
Are memories in the capital markets getting shorter? The
global markets have just experienced one of the worst
liquidity and credit dislocations since the Great Depression yet it
appears that in some cases investors are not exercising sufficient
discipline in regard to speculative-grade debt transactions. If so,
the market may be at risk of repeating past mistakes.
Taron Wade London (44) (44) 20-7176-3661
David Gillmor London (44) 20-7176-3673
Paul Drake London (44) 20-7176-7207
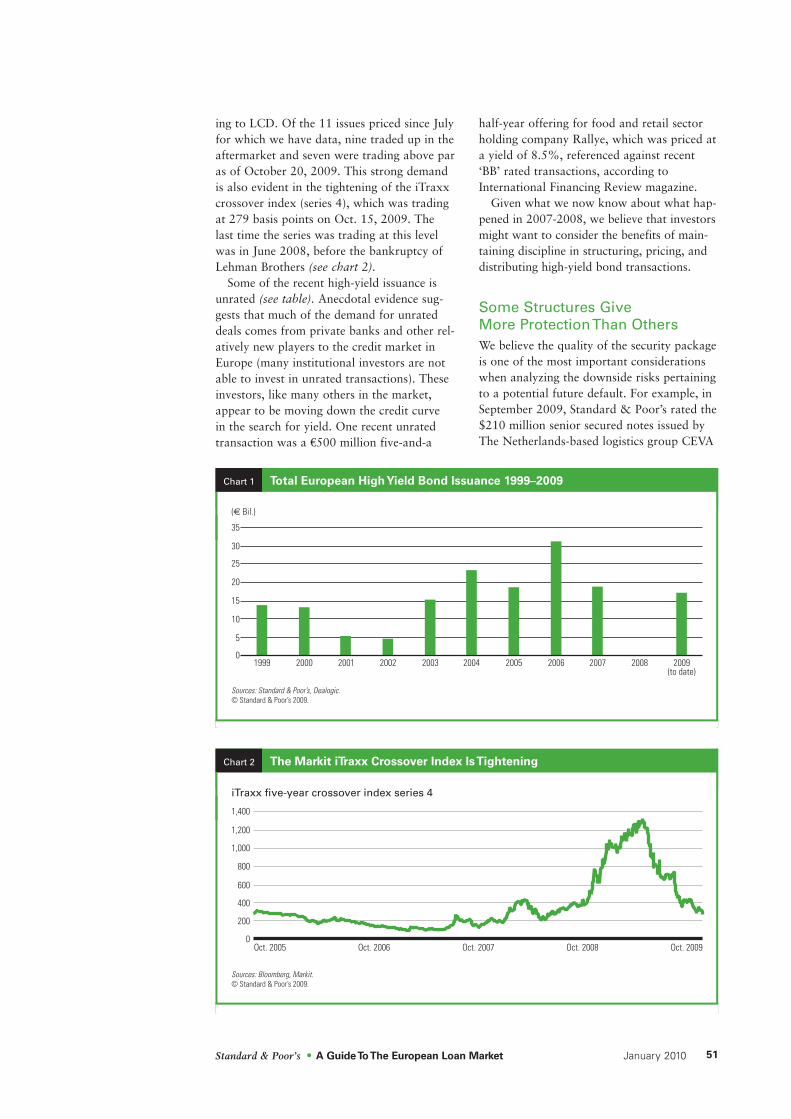
Standard & Poor’s ● A Guide To The European Loan Market� January 2010 51
ing to LCD. Of the 11 issues priced since July for which we have data, nine traded up in the aftermarket and seven were trading above par as of October 20, 2009. This strong demand is also evident in the tightening of the iTraxx crossover index (series 4), which was trading at 279 basis points on Oct. 15, 2009. The last time the series was trading at this level was in June 2008, before the bankruptcy of Lehman Brothers (see chart 2).
Some of the recent high-yield issuance is unrated (see table). Anecdotal evidence sug-gests that much of the demand for unrated deals comes from private banks and other rel-atively new players to the credit market in Europe (many institutional investors are not able to invest in unrated transactions). These investors, like many others in the market, appear to be moving down the credit curve in the search for yield. One recent unrated transaction was a E500 million five-and-a
half-year offering for food and retail sector holding company Rallye, which was priced at a yield of 8.5%, referenced against recent ‘BB’ rated transactions, according to International Financing Review magazine.
Given what we now know about what hap-pened in 2007-2008, we believe that investors might want to consider the benefits of main-taining discipline in structuring, pricing, and distributing high-yield bond transactions.
Some Structures Give More Protection Than OthersWe believe the quality of the security package is one of the most important considerations when analyzing the downside risks pertaining to a potential future default. For example, in September 2009, Standard & Poor’s rated the $210 million senior secured notes issued by The Netherlands-based logistics group CEVA
1999 2000 2001 2002 2003 2004 2005 2006 2007 2008 2009(to date)
0
5
10
15
20
25
30
35
( Bil.)€
Chart 1 Total European HighYield Bond Issuance 1999–2009
iTraxx five-year crossover index series 4
0
200
400
600
800
1,000
1,200
1,400
Oct. 2005 Oct. 2006 Oct. 2007 Oct. 2008 Oct. 2009
Chart 2 The Markit iTraxx Crossover Index IsTightening

Is History Repeating Itself In The European High-Yield Market?
www.standardandpoors.com52
Group PLC (CCC+/Stable/—) two notches below the existing debt due to a perceived weakness in the security package. Although these notes have the same guarantee structure and security as the company’s existing senior secured credit facilities, we assigned a recov-ery rating of ‘5’ (indicating our expectation of 10%-30% recovery in the event of a default) to the new notes, compared with ‘2’ (70%-90% recovery) on the existing bank facilities, reflecting our assessment of the new notes only having a second-ranking claim on a noncomprehensive security package. The recovery ratings assume that the security available to the secured debtholders of the existing bank facilities is taken from the assets and share pledges of entities that gener-ate about 60% of CEVA’s EBITDA. Since these assets do not give full coverage to the senior first-lien lenders, the new secured lend-ers would need to share the limited residual value (which comes from the unpledged assets) on a pari passu basis with the existing secured lenders, the second-lien lenders and the unsecured noteholders.
This is in contrast with other senior secured bonds that have been issued in recent months by speculative-grade companies. An example of this is Ardagh Glass Holdings Ltd. (B+/Stable/—), which in June 2009 issued E300 million of senior secured notes due 2016 to extend its maturities. The com-
pany used the proceeds to repay a portion of its senior secured debt due 2014 and also repay its revolving credit facility due 2014. The new bond ranks pari passu with the existing senior debt, with, in our view, imma-terial differences in the security package.
Additionally, we see some variation between the covenant packages for investors in senior secured bonds and those of the bank lenders at the same ranking. Although these creditors may rank pari passu, if the senior lenders have maintenance covenants while the high-yield bond investors have financial incurrence covenants and there is a covenant breach, the bond investors will sit beside the loan investors in a passive position, since they have no actual power to negotiate new terms. Therefore, unlike bondholders, the bank investors would be in a position to negotiate better terms for themselves to reflect the increased risk.
Debt issued at the holding company level is another related risk, due to structural sub-ordination. Generally, investors are better protected if debt is issued at the operating company level rather than at the holding company level. This is because such debt is closer to the physical assets of the company, usually giving the debtholders of the operat-ing company a stronger claim on those assets, compared with creditors holding debt of the holding company. An example of a recent
Term Corporate Issue Recovery Recovery Coupon PriceIssuer Size Date (years) credit rating* rating* rating* prospects (%) (%)¶ (par value)¶
Wind Telecomunicazioni SpA €1.2 bil. July 1 8 BB-/Stable/— BB- 4 30–50 11.75 96.271
Wind Telecomunicazioni SpA $2 bil. July 1 8 BB-/Stable/— BB- 4 30–50 11.75 97.492
Virgin Media (add-on) $600 mil. July 16 7 B+/Stable/— B 5 10–30 9.50 98.662
ISS Global A/S§ €525 mil. July 16 5 BB-/Stable/— B 6 0–10 11.00 100.00
Fraport AG €800 mil. Sept. 1 10 N.A. N.A. N.A. N.A. 5.25 99.83
Fiat Finance & Trade Ltd. €1.2 bil. Sept. 8 5 BB+/Neg/B BB+ 3 50–70 7.63 99.498
Rallye SA €500 mil. Sept. 18 7 N.A. N.A. N.A. N.A. 7.63 99.605
Central European Media Enterprises Ltd. €240 mil. Sept. 23 7 B/Negative/— B N.A. N.A. 11.63 102.75
Lagardare €1.0 bil. Sept. 24 5 N.A. N.A. N.A. N.A. 4.88 99.74
Wendel €300 mil. Sept. 28 5 BB/Negative/B N.A. N.A. N.A. 4.88 85.04
Renault S.A. €750 mil. Sept. 29 5 BB/Stable/B BB 3 50–70 6.00 99.475
Evonik Industries AG €750 mil. Oct. 6 5 N.A. N.A. N.A. N.A. 7.00 99.489
Gruppo Campari €350 mil. Oct. 8 7 N.A. N.A. N.A. N.A. 5.38 99.43
*Standard & Poor’s Ratings Services’ ratings. ¶Bloomberg and Standard & Poor’s Leveraged Commentary & Data. §On July 16, 2009, we raised the issue ratings to ‘B’ from ‘B-’ and the recovery rating to 5 (10%-30% recovery). N.A.—Not applicable.
Speculative-Grade European Corporates’ High-Yield Bond Issues July 1, 2009–Oct. 11, 2009

Standard & Poor’s ● A Guide To The European Loan Market� January 2010 53
issue by a holding company is that by unrated Evonik Industries. Its operating com-pany is Evonik Degussa GmbH (BB/Stable/B), which holds the chemical operations of the wider Evonik group.
Bond Covenants Are Not Always Effective For High-Yield DebtWe observe that bond covenants have not been particularly strong for unsecured high-yield debt. In fact, their generally weak nature may often mean it is quite feasible for companies to raise additional debt with a higher priority ranking. For example, many investors in unsecured bonds will rely on neg-ative pledge language. However, Standard & Poor’s recovery rating analysis factors in the potential for unsecured bank lenders to take and perfect security, despite the existence of a negative pledge on the path to default. This would put the unsecured high-yield bond lenders, who originally ranked pari passu, in a markedly inferior position, resulting in the risk of very substantial dilution of recovery prospects in the event of a payment default.
This is what happened in the case of HeidelbergCement AG. When we assigned a recovery rating of ‘5’ to the senior unsecured bonds in November 2008, we assumed that prior to default, based on stronger documen-tation for the acquisition loan, HeidelbergCement would be able to renego-tiate its acquisition loan terms with lenders. Accordingly, we assumed that the acquisition
loan would be extended and could be senior or secured at the point of default. In July 2009, HeidelbergCement issued new E8.7 billion syndicated bank facilities benefiting from extensive share pledges and guarantees, which we believed effectively subordinated the claims of existing bondholders.
Should Investors Be Looking At Rigorous Risk Assessment?In order to foster the development of a robust, sophisticated, and liquid capital mar-ket for high-yield issuers in Europe follow-ing the recent credit dislocation, we believe that certain minimum market standards to support a disciplined approach to risk assessment would benefit investors. However, because of an extremely competi-tive market for new issues, we observe that financial intermediaries are incentivized to accept only minimal disclosure standards on borrowers in the capital market—as long as those intermediaries are not putting their own capital at risk for the duration of the transaction. This means that, in the absence of regulatory intervention, it is up to the end-investors to exercise caution and demand protection.
Related Research“Criteria Guidelines For Recovery Ratings On Global Industrials Issuers’ Speculative-Grade Debt,” Aug. 10, 2009. l

www.standardandpoors.com54
Charting The Evolution Of
Post-Default Recovery Prospects
At U.K.-Based Countrywide
As default rates rise in Europe, our recovery ratings will be tested. Investors will compare our recovery expectations and the underlying default scenario analysis with actual recover-ies and events. In fact, defaults by specula-tive-grade companies are accelerating, with a rate of 10.2% in the 12 months to the end of June 2009, up from 5.3% at the end of 2008. We expect that the number of defaults will rise substantially in 2009. Our current esti-mate for defaults in our universe of specula-tive-grade companies with corporate and recovery ratings, as well as credit estimates outstanding, is 11.7%-14.7%.
One of the European companies that defaulted in 2009 was Castle HoldCo 4 (rated D/—/— on May 8, 2009), the holding company for U.K.-based real-estate services provider Countrywide PLC. The company’s revenues were hit by a downturn in the U.K. economy and the dislocation in the housing market. Although the company made efforts to streamline costs, this provided little benefit because of the severity in the drop in trading and the company’s highly leveraged financial profile. Standard & Poor’s first assigned a corporate credit rating and recovery ratings to Countrywide’s debt in April 2007, near the peak of the credit bubble. At that time, we
estimated recovery expectations for the senior secured bonds of 30%-50%. This is signifi-cantly lower than the average recovery pros-pects for senior secured debt in Europe.
Our Recovery Ratings On Countrywide Reflected Poor Recovery Prospects For Some LendersWe initially assigned a recovery rating of ‘1’ to the group’s proposed senior secured £100 million revolving credit facility (RCF), reflect-ing our expectation of a very high (90%-100%) recovery of principal and pre-petition interest in the event of a payment default. We assigned a recovery rating of ‘4’ to the pro-posed £470 million senior secured floating-rate notes due 2014, reflecting our expectation of an average (30%-50%) recov-ery of principal and pre-petition interest in the event of a payment default. At the time the transaction was funded, we did not assign a recovery rating to the group’s £170 million senior unsecured notes due 2015. However, in March 2008, when we expanded our recovery ratings to all unsecured speculative-grade debt issuance, we assigned a recovery rating of ‘6’ reflecting our expectation of neg-
As Default Rates Rise, Recovery Ratings Face A Stiff Test
Standard & Poor’s Rating Services’ recovery ratings provide
our opinion on the estimated recovery potential for debt
instruments. We use a fundamental, scenario-based analysis of
what we see as the factors most likely to precipitate a payment
default, followed by our assessment of the value that would be
available to repay creditors.
Marc Lewis London (44) 20-7176-7069
Taron Wade London (44) 20-7176-3661
Abigail Klimovich London (44) 20-7176-3554

Standard & Poor’s ● A Guide To The European Loan Market� January 2010 55
ligible recovery of principal and pre-petition interest in the event of a payment default. All three of the recovery ratings remained the same from first assignment to default.
Although the recovery rating on the RCF was indicative of our expectation of a very high recovery, the recovery rating of ‘4’ on the £470 million senior secured notes was well below our average recovery expectations of about 70% in Europe for other senior secured debt.
Our Methodology Identified Two Unusual And Negative Elements In Countrywide’s Debt StructureStandard & Poor’s methodology for recovery analysis falls into three broad steps: identify-ing the major business risks and simulating a path to default; valuing the enterprise at default; and constructing the waterfall of pay-ments according to the security structure, intercreditor arrangements, and insolvency regime to determine recovery to different classes of debtholder.
In many cases, the security structure and waterfall of payments remains relatively static over time. In the case of Countrywide the main elements of the structure were as follows:• Three classes of debt: superpriority RCF,
senior secured debt, and senior notes; • The comprehensive security package pro-
vided to the senior secured debtholders, including share pledges, asset security, and intercompany guarantees. Very limited secu-rity was provided to the holders of senior notes, although the senior notes benefitted from a comprehensive guarantee package.
• A clear waterfall, supported by an inter-creditor agreement ensuring that recoveries were distributed to the RCF ahead of the secured notes, which in turn ranked ahead of the senior notes.
• Supportive insolvency regimes for secured creditors with the UK being the main coun-try of operation. Unusual features in the Countrywide trans-
action included a payment-in-kind (PIK) ‘tog-gle’ option granted to lenders on a £100 million tranche of the senior secured notes. This option allowed the issuer to pay interest in cash or PIK form at its discretion until 2011. Thereafter this tranche was to revert to cash interest only. The second unusual feature was the provision of a sizeable RCF relative to the working capital needs of the company.
We viewed these features, along with the absence of financial maintenance covenants, as broadly supportive of credit quality by providing additional flexibility to the group. However, from a recovery perspective, we viewed these features as negative: we believed they could potentially adversely affect the valuation of the business and the amount of debt claims outstanding by the time of default. We believed that the ability to pay interest in kind and the availability of the RCF created the potential for lower profit-ability at default. This is because Country–wide’s financial performance would be able to deteriorate more severely than might oth-erwise be the case if the company had a higher interest burden or more constrained liquidity. Indeed, our default scenario at inception, incorporating the risk of a severe housing market downturn, highlighted that the company was likely to achieve break-even EBITDA at best by the time of a default.
Low profitability at default and our view of poor medium-term growth prospects also translated into a lower stressed valuation, reducing recovery prospects for lenders. This was further compounded by the superpriority status of the RCF, which pushed secured bondholders down the waterfall, making them more vulnerable to losses, in our opinion.
Initial recovery rating Actual Amount Seniority (% recovery expectation) recovery Comments
£100 mil. Revolving credit facility 1 (90%-100%) 100% Fully repaid.
£470 mil. (split between Senior secured 4 (30%-50%) 37%* Lenders agreed to convert their debt into 35% of the cash and toggle tranches) floating-rate notes newly restructured company and new senior secured notes issued with a face value of £175 million.
£170 mil. Senior notes 6 (0%-10%) 0% Holders will swap their debt for 5% in new equity.
*Nil value attributed to equity.
Castle HoldCo 4 (Countrywide) Actual Recoveries Versus ExpectedTable 1

Charting The Evolution OfPost-Default Recovery ProspectsAt U.K.-Based Countrywide
www.standardandpoors.com56
Countrywide Underwent A Scheme Of Arrangement RestructuringOn Feb. 17, 2009, Standard & Poor’s Ratings Services lowered to ‘SD’ from ‘CCC’ its long-term corporate credit rating on Countrywide, following the group’s failure to honor its cou-pon payment due under its senior secured notes and its proposed scheme of arrangement. We lowered the corporate credit rating to ‘SD’ and not ‘D’ because we understood, based on information received, that the company had not defaulted on other financial commitments. However, on May 8, 2009, we lowered the rating to ‘D’ following court approval for the proposed scheme of arrangement. The scheme allowed the company to reduce its debt through a lender write-down alongside an injection of £112.5 million of fresh equity. The company’s debt burden was reduced to £175.0 million, including the repayment in full of its RCF. We consider this to represent recovery of 37% for the senior secured lenders (see table 1). As per our general criteria, we consider the completion of a distressed exchange offer–-in-cluding through a scheme of arrangement-–as equivalent to a default (for more information, see article “General Criteria: Rating Implications Of Exchange Offers And Similar Restructurings, Update,” published on May 12, 2009, on RatingsDirect).
These schemes are popular for both lenders and companies because they allow the various parties with economic interest to achieve a compromise. The schemes can preserve value because they are typically put in place before a company runs out of cash and a payment default occurs. Furthermore, they avoid a lengthy bankruptcy process that can affect the trading side of the business by undermining creditor confidence. However, some lenders
can get lower recoveries through this process than they would otherwise receive as only 75% of creditors need to give approval, so those with smaller economic interests are at risk of being squeezed out.
We Revised Our Default Scenario For Countrywide Several Times In Response To Market ConditionsThe variable elements of our recovery analy-sis included our default scenario, which we revised as market conditions changed (although our recovery ratings remained the same). Our initial analysis highlighted that, by the time of default, the company’s EBITDA might be negative. This was largely a result of the potential severe revenue decline under our default scenario in the event of a significant weakening in the housing market. This created a challenge for valuing a busi-ness where EBITDA multiples are typically used as benchmarks for valuation. In order to overcome this, we forecast profitability for-ward past our hypothetical point of default to what we considered would be an ‘average’ level of profitability across the cycle. We used this level of EBITDA for the terminal valua-tion in our discounted cash flow model and as the benchmark for our market multiple analysis. Table 2 shows how these variables evolved over time.
Given our assessment of Countrywide’s strong market position, well-respected brands, and established branch network across the U.K., we believed the company would be more likely to default due to high leverage than because of a fundamental busi-ness problem. Because of this we also believed that the company would be valued as a going concern following any default.
Corporate April 2007 Nov. 2007 Nov. 2008 Feb. 2009 credit rating to Nov. 2007 to Nov. 2008 to Feb. 2009 to May 2009 May 2009
Rationale for B/Stable/— B/Negative/— CCC/Negative/— SD D change
View that the housing Countrywide’s worsening Countrywide failed to Countrywide received court market slowdown was liquidity position during honor its coupon payment approval for the noteholders’ becoming increasingly the first nine months of due under its senior proposed scheme of pronounced and the credit 2008, and our expectation secured notes and arrangement. environment during the that this position would noteholders proposed a summer of 2007 had progressively deteriorate scheme of arrangement. resulted in a reduced over the next 12 months pipeline of business as transaction volumes for Countrywide. remained at depressed levels.
Castle HoldCo 4 (Countrywide) Progression Of Corporate Credit Rating From Assignment To DefaultTable 2

Standard & Poor’s ● A Guide To The European Loan Market� January 2010 57
As table 2 highlights, the changes in our default scenario mirrored the more severe weakening in the outlook for the housing market as well as a worsening in Countrywide’s liquidity position. In November 2007, we revised the outlook on the ‘B’ rating on Countrywide to negative from stable. This change resulted from our view that the housing market slowdown was becoming increasingly pronounced and the credit environment during the summer of 2007 had resulted in a reduced pipeline of business for Countrywide.
The negative outlook remained until November 2008 and our initial recovery assumptions were unchanged through this first outlook transition. We first revised our default scenario in May 2008, when we increased our estimate of the severity of the decline in the company’s revenues. We made further moderate revisions to our default-case assumptions in August 2008, but also low-
ered the valuation multiple to reflect the weaker long-term outlook. Thereafter, we maintained our recovery assumptions throughout the subsequent corporate credit rating changes (see tables 2 and 3). l
Related Research• Castle HoldCo 4 (Countrywide) Long-
Term Rating Lowered To ‘D’ On Court Approval For Scheme Of Arrangement, May 8, 2009.
• Castle HoldCo 4 (Countrywide) L-T Rating Cut To ‘SD’ On Missed Coupon Payment, Feb. 17, 2009.
• Castle HoldCo 4 (Countrywide) L-T Rating Cut To ‘CCC’ On Liquidity Concerns; Outlook Negative, Nov. 4, 2008.
• Castle Holdco 4 (Countrywide) Outlook To Neg On Tougher Market Conditions; ‘B’ CCR Affirmed, Nov. 15, 2007.
April 2007 to May 2008 May 2008 to Aug. 2008 Aug. 2008 to May 2009
Hypothetical default scenario i) 30% decline in revenues over three Revised assumptions: 45% decline in Revised assumptions: >50% decline in years as a result of the housing market revenues by default in 2010 compared revenues by default in 2009 compared downturn; ii) Deteriorating gross with 2007. to 2007 margins as operating costs adjusted with a time-lag; iii) Interest rate increases on variable-rate debt; iv) PIK interest being paid on the £100 million toggle notes from 2008 until default.
Default year forecast 2010 2010 2009
EBITDA at default Nil Nil Nil
EBITDA for terminal valuation £62 million £53 mil. £55 mil.
Stressed EV £370 mil. £320 mil. £275 mil.
EV multiple of terminal valuation 6.0x 6.0x 5.0x
RCF recovery rating 1 (90%-100%) 1 (90%-100%) 1 (90%-100%)
Senior secured recovery rating 4 (30%-50%) 4 (30%-50%) 4 (30%-50%)
Senior notes recovery rating N/A 6 (0%-10%) 6 (0%-10%)
EV—Enterprise value. RCF—Revolving credit facility. PIK—Payment-in-kind. N/A—Not applicable.
Castle HoldCo 4 (Countrywide) Progression Of Recovery Rating From Assignment To DefaultTable 3

www.standardandpoors.com58
Key ContactsKey Contacts
London
Marketing and Syndication LiaisonPaul DrakeManaging Director, European Loan & Recovery [email protected] WadeSenior Research Analyst, European Leveraged Finance and Recovery [email protected]
Loan and Recovery Rating AnalyticsDavid GillmorSenior Director, European Leveraged Finance and Recovery Group [email protected] WattersHead of European Corporate [email protected] LewisDirector, European Leveraged Finance and Recovery [email protected]
New York
Loan & Recovery Rating AnalyticsWilliam ChewManaging Director, Loan & Recovery Rating [email protected] MowatDirector, Loan & Recovery Rating [email protected]
Kenneth PfeilDirector, Loan & Recovery Rating [email protected] WilkinsonDirector, Loan & Recovery Rating [email protected]
Standard & Poor’s Leveraged Data & Commentary
New YorkSteven MillerManaging [email protected] PolenbergVice President001-212-438-2717robert_polenberg@standardandpoors.comMarina LukatskyAssociate001-212-438-2709marina_lukatsky@standardanpoors.com
LondonSucheet GupteAssociate [email protected] ShmulensonSenior [email protected] Maria CiniManager, [email protected]

The opinions expressed in commentaries by Standard & Poor’s Leveraged Commentary & Data, a business unit of Standard & Poor’s that is separate and distinct from Standard & Poor’s other business units, are solely their own. These opinions and data are based on publicly available information from sources believed to be accurate and reliable. Standard & Poor’s Leveraged Commentary & Data does not have access to non-public information obtained by our credit rating analysts, who treat all non-public information provided by issuers during the credit rating process as confidential. Standard & Poor’s credit rating analysts do not disclose this information to Leveraged Commentary & Data or to any other employees or divisions of Standard & Poor’s.
Copyright © 2010 Standard & Poor’s, a division of The McGraw-Hill Companies, Inc. All rights reserved.STANDARD & POOR’S is a registered trademark of The McGraw-Hill Companies, Inc.
To learn more, contact Marc Auerbach at [email protected] or 212.438.2703, or visit www.LCDcomps.com.
For coverage of the leveraged loan market, no source can match Standard & Poor’s Leveraged Commentary & Data. The choice of buy-side firms and top investment banks, we provide real-time leveraged market news throughout the day, as well as insightful daily and weekly commentary. We also offer valuable primary loan data through the only industry-wide proprietary database of leveraged loan information memoranda (“bankbooks”). Whether you’re looking to win mandates, price and structure loans, comp new-issue deals, or identify trading opportunities, Standard & Poor’s Leveraged Commentary & Data delivers the information you need.
Get it all from Standard & Poor’sLeveraged Commentary & Data:
The leveraged loan market news and data you need.
And insightful analysis that puts it into perspective.

www.standardandpoors.com
Standard & Poor’s55 Water StreetNew York, NY 10041
A Guide To The European Loan Market
January 2010