A Guide to Building a Metrics-Driven Organization
12
A HURWITZ WHITE PAPER A Guide to Building a Metrics-Driven Organization Sponsored by PivotLink Fern Halper, Ph.D Partner, Hurwitz & Associates
Transcript of A Guide to Building a Metrics-Driven Organization

A Hurwitz wHite PAPer
A Guide to Building a Metrics-Driven Organization
Sponsored by PivotLink
Fern Halper, Ph.DPartner, Hurwitz & Associates
A Hurwitz wHite PAPer
Page 2A Guide to Building a Metrics-Driven Organization
A Guide to Building a Metrics-Driven Organization
Introduction
In today’s competitive marketplace, businesses need relevant, actionable, and timely data to support decision making. All too often, however, companies fall into what Hurwitz & Associates refers to as the “reporting trap.” This happens when organizations, especially as they embark on a Business Intelligence (BI) strategy, to believe “the more data the better” and create large numbers of reports in an attempt to get to that “relevant, actionable, and timely data” and better understand their business. They are surprised when they find out that this is often not effective. Why? It is a two part problem. First, companies frequently utilize multiple BI solutions (e.g. spreadsheets, database queries, packaged software) to generate these reports. The result is that business analysts or IT employees end up producing numerous reports, across many business units that contain copious data, but don’t necessarily provide the right information for decision-making. In addition, BI solutions often simply present data, but don’t provide an analysis framework for making decisions. What companies need is a unified set of actionable measures that are associated with their core business processes.
Hurwitz & Associates recommends that companies shift the way they utilize data for decision-making to include metrics as an important part of the equation. In this paper we examine the importance of metrics and how they can help companies make better decisions. We first examine what metrics are and provide a framework for metrics development. We then provide short case studies which showcase three companies that have transitioned to a metrics-based approach and describe what they have learned from the move.
Getting Started Building a Metrics-Driven Organization
Hurwitz & Associates defines a business metric as a measurement that is quantifiable and relates to a business activity. Metrics need to be clear, objective, measurable, transparent, insightful, and actionable. When properly defined, these metrics should relate to each other and tell a story. In other words, they should be orchestrated in such a way that they provide a framework for analysis. A good way to test the importance of a metric is to ensure that it links to a value driver for the company. Examples of metrics include lead conversion rates, pipeline velocity, customer retention rates, or employee attrition rates. Industry studies1 across various business processes have illustrated that companies that utilize metrics are more successful. For example, one study indicated that the timely, effective use of sales metrics by mid sized companies resulted in increased revenue and a higher sales close rate2.
All too often … companies fall into what Hurwitz & Associates refers to as the “reporting trap.”

A Hurwitz wHite PAPer
Page 3A Guide to Building a Metrics-Driven Organization
… a KPI can be deconstructed into a series of metrics tied to these business processes.
Figure 1, below provides a framework for understanding metrics. The framework is divided into two parts. The left side of the figure is an analytical framework that provides a useful way of thinking about metrics. The right hand side of the figure is a process framework, which addresses how to develop and deploy these metrics.
Analytic Framework
From an analytic perspective, corporate strategic goals are used to develop high-level metrics called key performance indicators or KPIs. Typical KPIs are revenue, customer satisfaction, or other important business drivers. These KPIs, in turn, are influenced by business unit metrics, which reflect a business process. For example, a KPI for a transportation company is “percent on-time delivery.” On-time delivery might involve several business processes including warehousing, inventory management, and scheduling. The idea is that a KPI can be deconstructed into a series of metrics tied to these business processes. A wireless telecommunications team might decide that what is known as “% churn” is an important metric because it is linked to corporate profitability and there appears to be a high rate of churn at the company but no one knows why. The team needs to understand which processes are part of this metric. These might include maintenance (time to repair), customer service (dropped calls, or time to respond to call), or billing (error rates on bills). Therefore, while there might be one KPI called % churn, it is composed of a number of different metrics that reflect business processes.
Page 4A Guide to Building a Metrics-Driven Organization
These metrics also need be top down and bottom up in nature. This means that there is a way to drill down deeper to the data that feeds the metrics and that the metrics also feed other metrics that are more top level in nature. Since some metrics may span functions in a department or span departments in a business unit, the data to populate the metrics may come from different systems (or manual processes) across a company. The number of systems may be as small as one or two, or much larger. The systems may include internally facing systems (e.g. Enterprise Resource Planning) as well as those that are externally facing (e.g. ecommerce).
Ideally, KPI development begins with enterprise-level goals and objectives. But the reality is that in many companies don’t have corporation-wide goals. Often, corporate KPI development is an evolutionary process. Typically, divisions and business units develop metrics that then grow in importance and ultimately fuel a corporate level initiative.
Process Framework
From a process perspective, developing metrics usually starts with understanding corporate or business unit goals and objectives. Sometimes an executive, such as the CFO or COO, will see the need to start measuring business processes or outcomes and will assemble a team to help do so. Another scenario is that one or more operational people in an organization will see the need for metrics and assemble a team or a steering committee to help formulate a metrics strategy for their particular business unit. This might be driven by a new market opportunity or the need to better manage a business process. This group will identify an executive sponsor, often providing some sort of business case or rationale for the metrics project that is business focused. Executive sponsorship is a good idea because it can help to ensure that the initiative has support. Once the group is established, it determines an entry point. If a company or organization has its goals defined, but hasn’t put a program in place, it often makes sense to start with one area such as sales or marketing and grow from there.
Next, the team develops the business metrics. These metrics need to be clear and actionable. Since part of the definition process also involves understanding where to get the data to feed the metrics the team needs to understand the systems that produce the data as well as the data itself. It is also important to understand how often users will need these metrics. Once a day? Once a week? The timing of the data needs to support this.
Many companies will utilize the BI solutions that are already in place as a foundation for the metrics strategy and this is fine if it can meet the requirements. The team also needs to think about how to present the information (see “Requirements for a Solution” below for more information).
Metrics Process Framework:
• DevelopStrategy
• DevelopMetrics
• DeployMetrics
• CulturalChange
• Monitor&RefineMetrics
A Hurwitz wHite PAPer
Page 5A Guide to Building a Metrics-Driven Organization
Once the metrics are defined and data sources and types are determined, the next step is deploying the solution. If a company has bought into the concept of metrics, but does not have the IT staff to help implement it, then it may make sense to partner with a provider to help build the system. There are a number of providers that offer solutions on a company’s own premises, or in the
A Hurwitz wHite PAPer
Requirements for a Solution
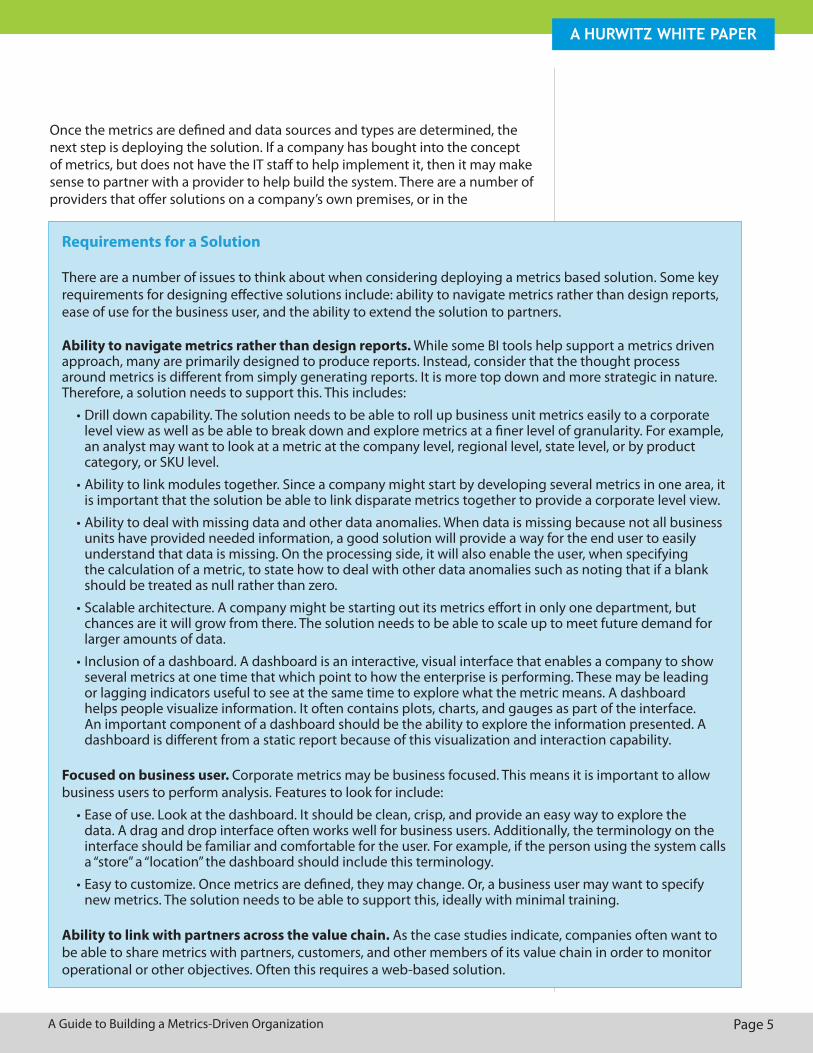
There are a number of issues to think about when considering deploying a metrics based solution. Some key requirements for designing effective solutions include: ability to navigate metrics rather than design reports, ease of use for the business user, and the ability to extend the solution to partners.
Ability to navigate metrics rather than design reports. While some BI tools help support a metrics driven approach, many are primarily designed to produce reports. Instead, consider that the thought process around metrics is different from simply generating reports. It is more top down and more strategic in nature. Therefore, a solution needs to support this. This includes:
•Drilldowncapability.Thesolutionneedstobeabletorollupbusinessunitmetricseasilytoacorporatelevel view as well as be able to break down and explore metrics at a finer level of granularity. For example, an analyst may want to look at a metric at the company level, regional level, state level, or by product category, or SKU level.
•Abilitytolinkmodulestogether.Sinceacompanymightstartbydevelopingseveralmetricsinonearea,itis important that the solution be able to link disparate metrics together to provide a corporate level view.
•Abilitytodealwithmissingdataandotherdataanomalies.Whendataismissingbecausenotallbusinessunits have provided needed information, a good solution will provide a way for the end user to easily understand that data is missing. On the processing side, it will also enable the user, when specifying the calculation of a metric, to state how to deal with other data anomalies such as noting that if a blank should be treated as null rather than zero.
•Scalablearchitecture.Acompanymightbestartingoutitsmetricseffortinonlyonedepartment,butchances are it will grow from there. The solution needs to be able to scale up to meet future demand for larger amounts of data.
•Inclusionofadashboard.Adashboardisaninteractive,visualinterfacethatenablesacompanytoshowseveral metrics at one time that which point to how the enterprise is performing. These may be leading or lagging indicators useful to see at the same time to explore what the metric means. A dashboard helps people visualize information. It often contains plots, charts, and gauges as part of the interface. An important component of a dashboard should be the ability to explore the information presented. A dashboard is different from a static report because of this visualization and interaction capability.
Focused on business user. Corporate metrics may be business focused. This means it is important to allow business users to perform analysis. Features to look for include:
•Easeofuse.Lookatthedashboard.Itshouldbeclean,crisp,andprovideaneasywaytoexplorethedata. A drag and drop interface often works well for business users. Additionally, the terminology on the interface should be familiar and comfortable for the user. For example, if the person using the system calls a “store” a “location” the dashboard should include this terminology.
•Easytocustomize.Oncemetricsaredefined,theymaychange.Or,abusinessusermaywanttospecifynew metrics. The solution needs to be able to support this, ideally with minimal training.
Ability to link with partners across the value chain. As the case studies indicate, companies often want to be able to share metrics with partners, customers, and other members of its value chain in order to monitor operational or other objectives. Often this requires a web-based solution.

Page 6A Guide to Building a Metrics-Driven Organization
cloud. Some companies find that cloud solutions are easier to start with and faster to deploy. A few cloud providers even have pre-built metrics across different functional areas that can provide a useful starting point. Of course, the on or off premises decision will depend on a company’s particular circumstances.
A metrics driven approach often requires some changes in how a company does business. So, concurrent with deploying the solution, the company will need to prepare for some cultural change. The team needs to ask, what is the corporate culture? How well will employees adapt to change? Where will the resistance be? How do we overcome this resistance? This may be as simple as training people to use a metrics dashboard or it may require more support and a specific motivation system.
Finally, once the metrics are in place, it is important not only to monitor them, but also to refine them, as needed. Companies often find that the way a metric was originally defined needs to be changed. The system needs to be able to support this (see “Requirements for a Solution” box, page 5, for more information).
Case Studies
Below are profiles of three companies: A leading global logistics provider; Timbuk2, a pioneer in messenger bags; and Distribution Market Advantage, a national foodservice distribution system. While the motivation behind developing metrics varies somewhat among these businesses, all have the following in common: each had a great deal of data that was difficult to organize so that they could see the larger picture and make more effective business decisions and compete successfully. They all needed to dig deeper into their metrics to obtain a granular level view as well. All three of these companies did this through implementing a well-developed metrics program.
Global Logistics Company: Competing with metrics
Sometimes a company’s reputation can depend on its ability to calculate a metric in a timely manner. The operations team at a leading transportation provider realized it had a problem. In its post sales service/parts management business, it had contracts with numerous companies to forward critical stock to service premium customers when needed. A 2- to 5-hour delivery window is common in this kind of contract. In order to accomplish this nationally, the company had contracted out to many different size warehouses across the country to store the parts it delivered. Yet, it was using spreadsheets and Access databases to assemble a key metric—on time delivery—and it could take days to put it together. This meant that the company had no information to use when a customer said a delivery was late. It also meant that a customer knew there was a problem before the company did. According to Douglas Ingram, Manager of Process Engineering, “With a lack of substantive data, if there was one miss for one critical part that meant that every issue could be escalated.” Ingram knew
A Hurwitz wHite PAPer
… once the metrics are in place, it is important not onlytomonitorthem,butalsotorefinethem…

A Hurwitz wHite PAPer
Page 7A Guide to Building a Metrics-Driven Organization
it was time to take the steering wheel back and assemble a set of metrics that could be continuously monitored in order to help the organization compete more effectively. He was able to get a complete metrics project off the ground by framing it in business terms and gaining support from executives to deploy these metrics.
The first part of defining the company’s metrics strategy was relatively straightforward because it had already committed to specific metrics with customers as part of the contract process. These included standard transportation/warehouse metrics such as on time performance and inventory accuracy. One challenge, however, was that the data to populate these metrics came from many sources. In fact, ninety percent of the data came from the ERP systems in the network of warehouses where the parts were stored for delivery. These systems varied in sophistication. Ingram’s team decided that rather than try to build and manage the needed infrastructure, it was more cost effective and timely to outsource this part of the project. Additionally, since the operations team had no business intelligence solution in place, they decided to work with a BI cloud provider who could deliver the information infrastructure, data gathering, and platform for analysis and metrics. The provider helped to create a solution where the company could utilize data from more than one hundred different operating environments and still have meaningful input to feed the metrics. The company could also use the platform to help analyze for network optimization.
Over the course of several months, the company was able to implement the standard metrics and this helped provide it with the information it needed to successfully manage its contracts. With this data, the account managers could work with customers more effectively and establish their expertise in supply chain, which helped to improve customer satisfaction. It was also able to manage its costs more effectively. For example, prior to implementing the system, the company knew its overall costs, but didn’t understand the cost/performance of particular suppliers at various levels of granularity. Now, according to Ingram, the organization can, “understand that we may have X cost with Y carrier but the trade off is poor performance or vice versa with other carriers.”
The team has now moved onto the next phase of its metrics strategy, which involves processing data every hour to understand certain key metrics that tie to profitability. This includes determining how long every part of the process takes and even looking at profitability by order, if necessary. It has assembled some high level KPIs as well as lower level metrics to feed these KPIs. These include average time to process orders, volume flows, and processing time by agent. The goal is to be able to identify bad trends almost immediately. How was the team able to gain executive support for this effort? According to Ingram, “Operations leadership bought into the process because the problem was framed in terms of what analytics can do for business in terms of a key business issue which is profitability.” The team sold the project by focusing on the cost of a non-value added manual approach (the current way things were being done) versus a
… prior to implementing thesystem,thecompanyknewitsoverallcosts,butdidn’t understand the cost/performance of particular suppliersatvariouslevelsofgranularity.

A Hurwitz wHite PAPer
Page 8A Guide to Building a Metrics-Driven Organization
“Software as a Service” (SaaS) approach. They also looked at other value drivers such as the ability to have a clear rate audit process and better book keeping. Some best practices are:
•Startwiththeendinmind.Inthiscasethebusinessgoalwastobeprofitableand make money. Ingram sold the project by enabling the company to see what taking control of its data could do for them. And, since the leadership had already “overdosed on technology”, this meant that the problem needed to be framed in dollars and cents.
•Developtherightthoughtprocess.Itiskeytothinkanalyticallyaboutmetrics. Ingram knew that daily operations needed to run by the numbers, and he needed to critically determine what metrics made the most sense and what processes and data would feed these metrics.
•ConsideraSaaSsolution.Ingramknewthattheteamdidnothavethetimeto get capital budgets approved to build an in-house system. Nor did it want to. Therefore, it went with a SaaS model, which had the right price point and helped to move it away from corporate bureaucracy.
Timbuk2: Starting with one metricMonitoring and tracking key metrics is critical when a company grows precipitously. Timbuk2 (www.timbuk2.com), a manufacturer of messenger bags, luggage, backpacks, and assorted accessories had grown significantly from 2000 to 2006. By 2006, it was servicing seven channels, sourcing raw and finished goods internationally, and had a fairly complex supply chain. It was placing take at once orders, orders with three month lead times, and preseason orders. The company had no onsite IT group and the team was using complex spreadsheets and SQL views to perform its analysis. The process was simply too manual and too complex. Forecasting was done in Excel. The company would take information from wholesale orders that would be entered into its ERP system, extract order data using SQL, and put it into spreadsheets. Each channel manager would then produce a SKU level forecast by month. Next, operations would take an order file of known demand and marry this together with the planned demand from the spreadsheets and roll that up to get a monthly picture of what each SKU in inventory needed to be. This information would be sent to the factory. According to Charles Schweiger, a business analyst at Timbuk2, the company “always knew it needed something better, especially when it came to answering the question of when and how much of product and inventory will be available?”
Timbuk2 needed an instrument to better manage its inventory turns. The reason was two-fold. First, it wanted to optimize its inventory across all of its channels, while still meeting customer demand. Second, it wanted to better service its customers and distributors. The company knew it needed a cloud-based solution because it did not have an IT staff on hand. With the help of its service provider, Schweiger pulled apart the SQL views from the company’s ERP system, saw what data was in the fields and then replicated that in its new BI tool. Now the company has a highly accurate picture of inventory out to 120 days. The
AccordingtoCharlesSchweiger,abusinessanalystatTimbuk2,thecompany“alwaysknewitneeded something better, especiallywhenitcametoanswering the question of when and how much of productandinventorywillbeavailable?”

A Hurwitz wHite PAPer
Page 9A Guide to Building a Metrics-Driven Organization
company can now ask questions such as, “How many SKUs have ten days or less of inventory?” And, now that the company has visibility into its inventory, it has opened the system up to wholesale distributors via a web-based interface. Distributors can place orders directly but only for products that are available. Or they can change their requested ship date to coincide with when products are available. In this way, the company now has confidence that it can deliver orders in full. Better information into the hands of channels, managers, and external sales representatives.
With the right information infrastructure in place, Timbuk2 began to develop a metrics strategy to help make better decisions. In developing the strategy, the company started with its overall goals, which are to 1) increase top line and 2) increase profitability. The first metric the company has put in place is, “On-time fill rate.” This is a key metric for the company because it does not want to fill shipments late or not in total. The company now measures this metric on a monthly basis. With the granular nature of its new BI platform, the company has been able to refine this metric. Initially, the company noticed that the metric was higher in some months than other months. After drilling down into the metric, it saw that there were variables feeding it that were out of its control. For example, in servicing very small businesses there are often multiple little steps from distribution center to carrier that the company has no jurisdiction over. With its new BI solution in place, it can refine the metric accordingly.
The company is currently in the process of developing more metrics. Its philosophy is that metrics are gauges by which, for example, sales can be graded on performance and likewise a focal point of operations to reduce cost by way of enhancing supply chain efficiency. Some best practices that the company has learned so far include:
•Noonefunctionalgroupisisolated.Itisimportantforacompanytomakeit clear that each metric is interrelated with other metrics. In Timbuk2’s case, for example, on-time fill rate is connected with other on-time metrics, shelf accuracy, and so on. Additionally, once a department understands this, it is important for each of them to own the metrics.
•Bigpictureview.Associatedwiththebestpracticeaboveisthenotionthatpeople need to understand the big picture process. This will ensure that a person, in isolation, does not act blindly without critically thinking through how a decision might affect the rest of the process.
•Diligenceregardingdata.Itiscriticalthatacompanyunderstanditsdataand how it affects the ultimate piece of information (e.g. on time fill rate). For example, if one person does not update a purchase order then there won’t necessarily be good data about inventory.
DMA- Evolving to a 360 degree view Visibility into complex supply chains is extremely important for good decision-making. Distribution Market Advantage (DMA) is a marketing cooperative which was formed in 1988 by twelve private independent food service distributors
No one functional group is isolated. It is important foracompanytomakeit clear that each metric is interrelated with other metrics.

A Hurwitz wHite PAPer
A Guide to Building a Metrics-Driven Organization Page 10
looking to supply large national chains. In its role as a national distributor, DMA is the content aggregator that sits in the middle of this supply chain and operates as an order and information exchange between distributors and customers. Today, the company has distribution agreements totaling over $3 billion for the supply of food and associated products to multi-unit restaurant and institutional operators in the United States and Canada. According to Jim Szatkowski, VP of Technical and Data Services, in 2005, the company responded to its customers’ requests for near real time visibility into product movement and inventory levels in order to ensure decision support. To do this, the company invested in a cloud-based BI solution providing self-service application analytics and dashboards for its customers. This service has evolved into what the company now calls the “240 degree view”; a metrics based approach which is used to measure customers and the DMA distributors. In the near future, it will be adding manufacturers into the mix to provide a 360-degree view.
How did this metrics evolution occur? DMA’s data comes from customer invoice transactions through its multiple distribution warehouses. The data is stored in its own data warehouse. DMA does the heavy lifting to ensure that a product like Heinz ketchup that may be classified differently by different distributors is cross-referenced appropriately. The cloud solution provides what Szatkowski refers to as a “blank canvas” for customers to develop dashboard views and reports of critical information. This supply chain visibility also enables customers to understand spend, product movement, and verify prices of their manufacturer contracts. This is all in the customer’s own language. For example, if a chain operator wants to understand the difference in food costs between markets, they can easily look at the product purchases for each market side by side to pin point problem areas. This enables the operator to identify problems at a granular level and take effective action.
Several years ago, DMA, together with its customers, realized that it needed to transition to a metrics based view of its information because the amount of data was becoming overwhelming. This metrics view includes a KPI scorecard that provides customer and distributor focused metrics. The process of developing these metrics starts with understanding customer goals and objectives. DMA assembles a cross-functional team which performs a gap analysis to determine what these metrics should be. Currently, the metrics focus on driving cost out of the supply chain and driving efficiency into it. Customer-centric metrics supporting this goal include deliveries, frequency per week, plus extra deliveries. Distributor related metrics include mispicks, damaged cases, as well as total error rates.
The metrics are available at different levels of detail. For instance, a customer can look at extra deliveries from distributors at the company level, warehouse level, or even at a store within a warehouse. DMA has found that utilizing these kinds of metrics is helping customers to obtain deep supply chain visibility in a way that clearly maps to their goals and objectives. Customers have reaped the benefit of this metrics-driven approach because it helps them make better business decisions, negotiate more effectively with manufacturers, and deal with compliance.
ThecloudsolutionprovideswhatSzatkowskirefers to as a “blank canvas”forcustomerstodevelopdashboardviewsand reports of critical information.

A Hurwitz wHite PAPer
Page 11A Guide to Building a Metrics-Driven Organization
What has made DMA successful in its metrics quest? Best practices include the following:
•Stayfocusedoncustomerneeds.Inthiscase,thecustomerneedwastodrivedown costs and inefficiencies in the supply chain. DMA helped its customers define metrics that reflected this.
•Don’tlosesightoftheimportanceofdata.DMAdoesalotofworktomakesure that its data meets its integrity requirements. It is important for a company to understand its data and how granular the information needs to be in order to be effective.
•Don’tbeafraidtoletserviceprovidersprovideinnovation.DMAisarelativelysmall organization, with 21 people. It knew that in order to be innovative it needed to outsource its technology. Currently it uses a number of providers to help with various operations. This has helped it succeed.
•Focusonareaswheremetricsareneededtomakethebusinessmoresuccessful. DMA, together with its customers performed a gap analysis to understand the kinds of metrics its customers required. It started with a few high level metrics and made sure it had the data, at the right level of granularity to populate these metrics.
Conclusion
As the case studies illustrate, there are several factors that are critical for success in developing and deploying metrics. First, metrics must be value focused. In other words, they need to be important to company and its customers. A hundred different metrics will not help a company successfully make decisions if they are the wrong metrics. Second, metrics should interrelate to one another, providing a big picture view with granularity to support a deeper dive analysis. Finally, the right information infrastructure needs to be in place to support and populate these metrics.
While the concept of metrics is not new, many businesses are still in the early stages of developing a metrics strategy. Hurwitz & Associates believes that metrics will continue to grow in importance. As the amount and type of information available to companies continues to increase, it will not be feasible to simply produce many reports to help drive decisions. Rather, effective businesses decision-making will evolve to include a set of carefully identified metrics that can help drive action.
Sponsored by: PivotLink provides on-demand business intelligence solutions that allow the entire value chain to collaborate on a single, powerful analytical platform. PivotLink’s award-winning solutions put affordable, secure and easy-to-use analytic tools into the hands of line of business users, freeing IT to focus on strategic business initiatives Visit www.pivotlink.com
Footnotes1 E.g. McKinsey & Company (2008), MESA International (2006), Aberdeen Group(2008)2 CSO Insights (2010)
CriticalSuccessFactorsforDeployingMetrics:
•Metricsmustbevaluefocused
•Metricsshouldprovideabigpictureview
•Therightinformationinfrastructure needs to be in place

About Hurwitz & Associates
Hurwitz & Associates is a consulting, market research and analyst firm that focuses on how technology solutions solve real world business problems. The firm’s research concentrates on disruptive technologies, such as Cloud Computing, Service Oriented Architecture and Web 2.0, Service Management, Information Management, and Social and Collaborative Computing. We help our customers understand how these technologies are reshaping the market and how they can apply them to meet business objectives. The team provides direct customer research, competitive analysis, actionable strategic advice, and thought leadership. Additional information on Hurwitz & Associates can be found at www. hurwitz.com.
© Copyright 2010, Hurwitz & Associates
All rights reserved. No part of this publication may be reproduced or stored in a retrieval system or transmitted in any form or by any means, without the prior written permission of the copyright holder. Hurwitz & Associates is the sole copyright owner of this publication. All trademarks herein are the property of their respective owners.
233NeedhamStreet•Newton,MA02464•Tel:6174541030w w w . h u r w i t z . c o m175HighlandAvenue,3rdFloor•Needham,MA02494•Tel:617-597-1724