A Grain of Truth: The Nineteenth-Century Corn … Grain of Truth: The Nineteenth-Century Corn...
17
! A Grain of Truth: The Nineteenth-Century Corn Averages By WRAY VAMPLEW T HE initial use of the corn averages was to regulate Britain's external grain trade, but during the nineteenth century other functions were added. Many landlords began to use them as the basis of corn rents; from 1837 they were widely utilized in the calculation of tithe commuta- tion payments; and in the 1880s they were acknowledged as a 'public official record of the average prices of [an] important article of working class consumption'. 2 Historians, too, have made use of the averages for several purposes, among them that of assessing the 1Where not otherwise stated the statistical data for this paper were obtained from PR.O Corn Office Papers, MAF 10/25-7, 298-301, 368-9, the London Gazette, and the Journal of the Statistical Society. I am grateful for research assistance from Joyce MacMillan and Margaret Williamson, for financial assistance from the University of Edinburgh and the Hinders University of South Australia, and for comments on an earlier version of the paper from my colleagues at Flinders. ZSelect Committee on the Corn Averages (BPP 1888, X), QQ 22-5, 33. In the twentieth century cereals deficiency payments were also based on the averages. 3A H Imlah, Economic Elements in tile Pax Britannica, Cambridge, Mass, 1958, p 31; J R. T Hughes, Fluctuations in Trade, Industry and Finance 1850-1860, Oxford, 1960, p 61. 4S Fairlie, 'Ttie Corn Laws and British Wheat Production, 1829-76', Econ Hist Rev, 2nd ser, XXII, 1969; E L Jones, 'The Changing Basis of English Agricultural Prosperity, 1853-73', Ag Hist Rev, X, 1962, p 111; D Grigg, Tile Agricultural Revohtion in South Lincolnshire, Cambridge, 1966, pp 157-8; M Olson and C C Harris, 'Free Trade in Corn: A Statistical Study of the Prices and Production of Wheat in Great Britain from 1873 to 1914', QuarterlyJour Economics, LXXIII, 1959. s W S Jevons, 'On the Variations of Prices and the Value of the Currency Since 1782', Jour Stat Soc, xxvIII, 1865; A Sauerbeck, 'Prices of Commodities and the Precious Metals', .]our Stat Soc, XLIX, 1886; R" S Tucker, 'R.eal Wages of Artisans in London 1729-1935', [our American Statistical Association, XXXI, 1930; A D (~ayer, W W R.ostow and A J Schwartz, The Growth and Fluctuations of the British Economy, 1790-1850, Oxford, 1953, I, pp 460- 84; E H Phelps Brown and S V Hopkins, 'Seven Centuries of the Prices of Consumables Compared with Builders' Wage-R.ates', Economica, XXIII, 1956. value of British corn imports, 3 to estimate and examine domestic wheat production, 4 to form consumer price indices, 5 as indicators of the state of the harvests, 6 as guides to social unrest, 7 and, of course, simply as a record of agricultural prices. 8 Unhappily, such use has tended either to ignore or to play down the concern of contemporaries as to the validity of the figures. 9 Apart from the recent work of Adrian, who discusses the reliability of the averages with respect to markets in East• Anglia, we have to go back almost half a century, to the monographs of Fay and Barnes, to find any detailed discussion of the calculation of the averages, and even these are not wholly satisfactory because of limitations on the time period covered, and a failure to realize the full implications of the statistical procedures adopted.l ° The intention of this 6 R" C O Matthews, A Study in Trade-Cycle History: Economic Fluctuations in Great Britain, 1833-42, Cambridge, 1954, pp 30, 34. 7 W W R.ostow, British Economy of the Nineteenth Century, Oxford, 1963, pp 124-5. 8eg J D Chambers and G E Mingay, The Agricultural Revolu- tion 1750-1880, 1966, passim; B R. Mitchell and P Deane, Abstract of British Historical Statistics, Cambridge, 1962, pp 488-9; T W Fletcher, 'The Great Depression of English Agriculture 1873-1896, Econ Hist Rev, 2nd ser, XIII,I 1960-61. 9 Of the works cited in the previous footnoteg only three authors commented on the accuracy of the statistics. Olson and Harris acknowledged that the annual prices which they used were unweighted averages, but carried on regardless; Matthews considered that the figures for the quantities sold were 'notoriously unreliable' as proxies for production; Fairlie agreed that they had deficiencies but felt that they were reasonable indicators of trends and fluctuations. No author went into detail on the validity of the raw data. 10C R. Fay, The Corn Laws and Social England, Cambridge, 1932; D G Barnes, A History of the English Corn Laws 1660-1846, i930; L Adrian, 'The Nineteenth Century Gazette Corn R.etums From East Anglian Markets',Jour Hist Geog, III, 1977, pp 217-36. Before this article went to press the author was unaware of the index of sales returns produced by Susan Fairlie and published in
Transcript of A Grain of Truth: The Nineteenth-Century Corn … Grain of Truth: The Nineteenth-Century Corn...
!
A Grain of Truth: The Nineteenth-Century Corn Averages
By W R A Y VAMPLEW
T HE initial use of the corn averages was to regulate Britain's external grain trade, but during the nineteenth
century other functions were added. Many landlords began to use them as the basis of corn rents; from 1837 they were widely utilized in the calculation of tithe commuta- tion payments; and in the 1880s they were acknowledged as a 'public official record of the average prices of [an] important article of working class consumption'. 2 Historians, too, have made use of the averages for several purposes, among them that of assessing the
1Where not otherwise stated the statistical data for this paper were obtained from PR.O Corn Office Papers, MAF 10/25-7, 298-301, 368-9, the London Gazette, and the
Journal of the Statistical Society. I am grateful for research assistance from Joyce MacMillan and Margaret Williamson, for financial assistance from the University of Edinburgh and the Hinders University of South Australia, and for comments on an earlier version of the paper from my colleagues at Flinders.
ZSelect Committee on the Corn Averages (BPP 1888, X), QQ 22-5, 33. In the twentieth century cereals deficiency payments were also based on the averages.
3A H Imlah, Economic Elements in tile Pax Britannica, Cambridge, Mass, 1958, p 31; J R. T Hughes, Fluctuations in Trade, Industry and Finance 1850-1860, Oxford, 1960, p 61.
4S Fairlie, 'Ttie Corn Laws and British Wheat Production, 1829-76', Econ Hist Rev, 2nd ser, XXII, 1969; E L Jones, 'The Changing Basis of English Agricultural Prosperity, 1853-73', Ag Hist Rev, X, 1962, p 111; D Grigg, Tile Agricultural Revohtion in South Lincolnshire, Cambridge, 1966, pp 157-8; M Olson and C C Harris, 'Free Trade in Corn: A Statistical Study of the Prices and Production of Wheat in Great Britain from 1873 to 1914', QuarterlyJour Economics, LXXIII, 1959.
s W S Jevons, 'On the Variations of Prices and the Value of the Currency Since 1782', Jour Stat Soc, xxvII I , 1865; A Sauerbeck, 'Prices of Commodities and the Precious Metals', .]our Stat Soc, XLIX, 1886; R" S Tucker, 'R.eal Wages of Artisans in London 1729-1935', [our American Statistical Association, XXXI, 1930; A D (~ayer, W W R.ostow and A J Schwartz, The Growth and Fluctuations of the British Economy, 1790-1850, Oxford, 1953, I, pp 460- 84; E H Phelps Brown and S V Hopkins, 'Seven Centuries of the Prices of Consumables Compared with Builders' Wage-R.ates', Economica, XXIII, 1956.
value of British corn imports, 3 to estimate and examine domestic wheat production, 4 to form consumer price indices, 5 as indicators of the state of the harvests, 6 as guides to social unrest, 7 and, of course, simply as a record of agricultural prices. 8 Unhappily, such use has tended either to ignore or to play down the concern of contemporaries as to the validity of the figures. 9 Apart from the recent work of Adrian, who discusses the reliability of the averages with respect to markets in East• Anglia, we have to go back almost half a century, to the monographs of Fay and Barnes, to find any detailed discussion of the calculation of the averages, and even these are not wholly satisfactory because of limitations on the time period covered, and a failure to realize the full implications of the statistical procedures adopted.l ° The intention of this
6 R" C O Matthews, A Study in Trade-Cycle History: Economic Fluctuations in Great Britain, 1833-42, Cambridge, 1954, pp 30, 34.
7 W W R.ostow, British Economy of the Nineteenth Century, Oxford, 1963, pp 124-5.
8 eg J D Chambers and G E Mingay, The Agricultural Revolu- tion 1750-1880, 1966, passim; B R. Mitchell and P Deane, Abstract of British Historical Statistics, Cambridge, 1962, pp 488-9; T W Fletcher, 'The Great Depression of English Agriculture 1873-1896, Econ Hist Rev, 2nd ser, XIII,I 1960-61.
9 Of the works cited in the previous footnoteg only three authors commented on the accuracy of the statistics. Olson and Harris acknowledged that the annual prices which they used were unweighted averages, but carried on regardless; Matthews considered that the figures for the quantities sold were 'notoriously unreliable' as proxies for production; Fairlie agreed that they had deficiencies but felt that they were reasonable indicators of trends and fluctuations. No author went into detail on the validity of the raw data.
10 C R. Fay, The Corn Laws and Social England, Cambridge, 1932; D G Barnes, A History of the English Corn Laws 1660-1846, i930; L Adrian, 'The Nineteenth Century Gazette Corn R.etums From East Anglian Markets',Jour Hist Geog, III, 1977, pp 217-36. Before this article went to press the author was unaware of the index of sales returns produced by Susan Fairlie and published in

_i:ikl) ̧ ¸I:? i 15 '̧ ̧
2 THE AGRICULTURAL
paper is to extend the critique of Fay, Barnes and Adrian, to assess whether or not the corn averages were statistically sound, and to provide historians with a revised price series and an index of production for wheat, oats and barley.
I The origins of the corn averages lay in the government's efforts to operate its Corn Laws. u If the market price at home was to determine the level of import duties and export bounties then some method of obtain- ing that price had to be devised. The revealed deficiencies of merely relying on 'expert' opinion paved the way for the production of an official register of grain prices. Initially, responsibility for its compilation was placed upon JPs in a few selected counties, but the legislation proved ineffectual. Greater success was obtained with an Act of 1781, which required an Inspector of Corn Returns to publish Mark Lane (London) corn prices weekly in the London Gazette. Eight years later data collection was extended to all mari- time counties, but imperfections in the legis- lation led to a codifying and consolidating statue in 1791 by which inspectors in selected towns in each of twelve English maritime districts had to produce weekly average grain prices for their particular markets. These prices were used to calculate averages for each district which were then made the basis for controlling imports into that district. A ludicrous position was thus created in which one maritime district could have its ports closed against foreign grain while another allowed importation. Reaction to this situa- tion induced legislation in 1804, which abandoned provincialism and required the
Industrialisierut g ,rod 'Europiiische Wirtshaft' im 19 Jahrhundert: ein tagungsbericht, Ver6ffentlichungen der Historischen Kommission z'u Berlin, Band 46, Walter de Gruyter, Berlin, 1976, pp 91-6.
n This section is based on S.C. on Petitions Relating to Agri- cuhural Distress (BPP 1820, II), S.C. on Corn Averages (BPP 1888, X), particularly the Second Report and the evidence of R Giffen, Controller of the Corn Returns; Fay, op cit, pp 62-7, Barnes, op cit, pp 41-67.
HISTORY REVIEW
central Receiver of the Corn Returns to calculate a national average price by which all ports would be governed. 12
Before 1821 the price for the first maritime/ district, which comprised the counties off Essex, Kent and Sussex, was determined ex- clusively by dealings in the Mark Lane Corn Exchange. Here an inspector had been appointed by the proprietors of the Exchange, and all corn factors were required, under a penalty of £,50, to submit to him a weekly written account of the price and quantity of every sale of home-grown corn made by them, the names of the buyers, and details of the weights and measures utilized. The inspector was required to convert all weights and measures into Winchester bushels and to calculate a district average price by dividing the total receipts by the total quantity of sales. For the other eleven maritime districts local magistrates appointed inspectors for each of the designated towns. All dealers in corn, including millers, maltsters, merchants, factors, and agents, were bound, under a £10 penalty, to supply them with weekly written accounts of the price, quantity, and weights and measures of all transactions. A town average price was then calculated in the same way as for Mark Lane and transmitted to the Receiver of the Corn Returns in London, who used the information to produce the district and national figures. 13
Practice and prescription, however, did not coincide. Complaints of fraud and manipula- tion led to the appointment of a Select Com- mittee whose report in 1820 maintained that 'with the exceptions of the returns taken at 1z Strictly it was not initially a national average. Scotland's
external corn trade was to be controlled by the aggregate average of four Scottish districts, but in 1805, following the failure of this average to allow imports without pro- hibitory high duties at a time when Glasgow, Paisley and Greenock faced almost famine prices, Parliament acceded to requests that Scotland should come under the control of the English averages, which were generally higher than their Scottish counterparts. Ireland was classed as a foreign country till 1806, after which there was free trade in corn between Britain and Ireland and Ireland's foreign corn trade also became regulated by the English averages. Fay, op cit, pp 63-4.
13S.C. on Petitions, etc., Report, pp 3-5.
; ' . j . .
NINETEENTH-CENTURY CORN AVERAGES
the Corn Exchange, the greatest neglect and inattention has universally prevailed'.14 Even at Mark Lane there were omissions, for although the corn factors generally obeyed the injunction of the statute, purchases made from grain growers, shippers and agents were not within the inspector's province. Never- theless, there is no reason to suspect that the grain sold by the factors would not be repre- sentative of other dealings at Mark Lane, and, as there was only this market to consider when calculating the district average, the omission would not cause weighting prob- lems. More important an omission was the exclusion of the major towns of Essex, Sussex and Kent from the first district's average, for grain sold in these towns was not necessarily similar to that of Mark Lane, where dealings tended to be in the higher quality corn of the counties and where price would also reflect the higher transport charges involved, is
Outside London the Committee found 'universal neglect' and serious under- registration as evidenced by the many examples of low and nil returns. Possibly low figures occurred because dealers did not record sales made on non-market days or sales contracted outside the market place, both of which were common provincial practices especially where the growers sold their corn directly to the millers and merchants. 16 More- over, it must be remembered that sales of foreign corn would not be registered as the corn averages dealt solely with the native product. Nevertheless, it is difficult to believe that these explanations could account for such instances in 1819 as the returns from Plymouth, which include weeks in which only seven quarters and three quarters were sold; or those from Bristol, a city with forty corn dealers and factors, which included weeks with sales of only twenty-five and thirty-nine quarters, and one week in which
14 lbid, p 5. is Ibid, p 6. i 16 Ibid: Evidence, pp 16, 50; Fay, op cit, p 65.
no sales at all took l~lace; 17 or, worst of all, the astonishing and alarming figures from Manchester, Macclesfield and Stockport which suggested that not one grain of British corn was sold there throughout the whole year! Clearly many inspectors were not doing their duty. Outside Mark Lane they were all part- time officials, combining the post with a variety of occupations including, at Bodmin, a barber who sent his wife to obtain the information, is Perhaps they were not paid enough to ensure diligence: they received five shillings a return in contrast to the Mark Lane inspector's annual salary of£200, x9
Possibly the neglect of the inspectors was encouraged by the weighting system used in calculating the district and national averages. No account was taken of the varying sales volumes in the different markets. Each town in a district was allotted the same weight in the district average, and each district was given equal weight in the national average. Since price alone thus could influence the averages it may well be that the inspectors saw no necessity to ascertain correct figures for sales volumes as long as the prices were reasonably accurate: and an impression of the going rate for corn could have been obtained without detailed form-filling and time- consuming calculation.
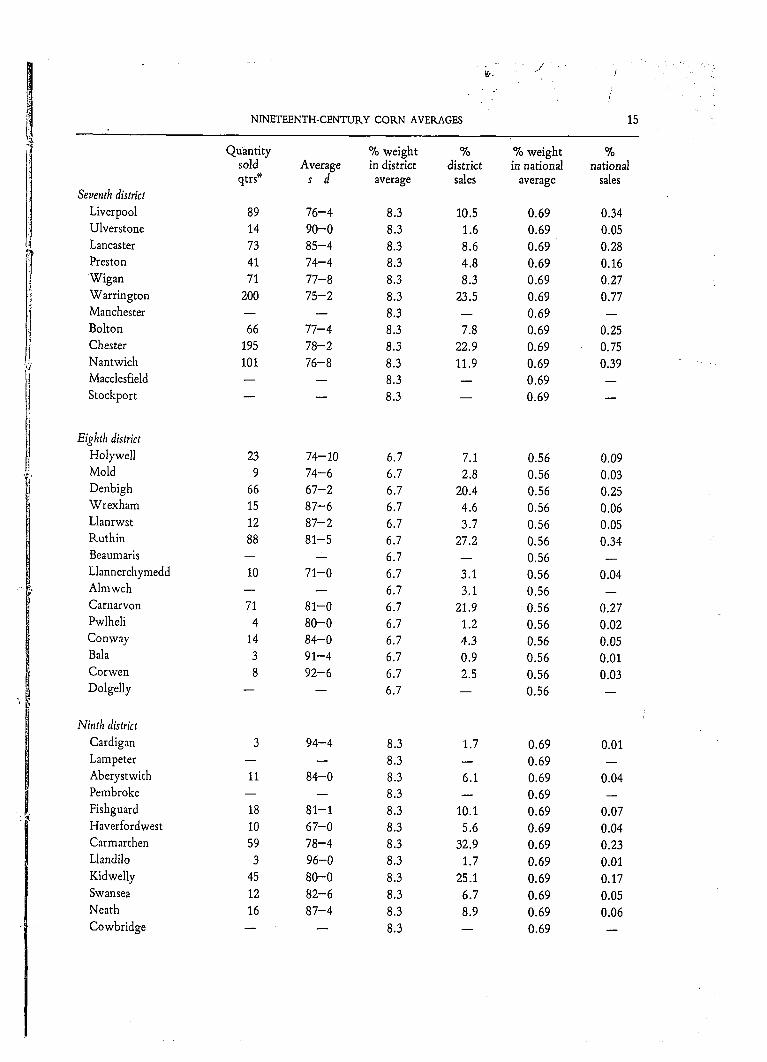
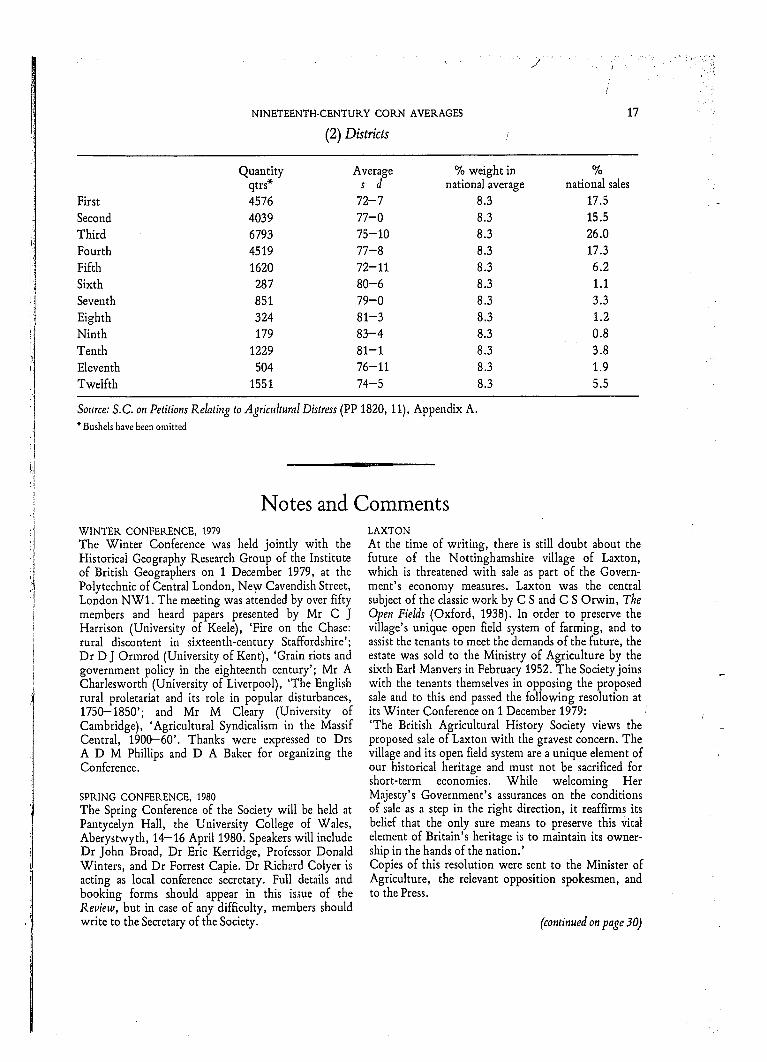
The inequities in the weighting procedure also produced a statisticaUy incorrect average. Data in the appendix to this article shows the weights assigned to the various towns in the calculation of the district and national averages in the week ending 16 January 1819. 2o It can be seen that there were some wide disparities between these weights and
17The inspector at Bristol acknowledged that his returns bore little 'resemblance to the whole of the transactions which have actually taken place within the city'. S.C. on Petitions, etc., Evidence, p 37.
18 Ibid, p 24. 10 Ibid: Report, pp 3-5. In 1821 the local magistrates were
empowered to give whatever they thought to be a fit and reasonable sum' providing that it did not exceed £30 per annum: I & 2 Geo. I V c 87.
2°The year was chosen because detailed data are gathered together in the S.C. on Petitions, etc., Appendix. The week was chosen randomly.
m

4 THE AGRICULTURAL
the actual percentage of sales recorded in the towns. The sixth district, which registered sales of only 287 quarters of wheat at an average price of 80s 6d, had the same weight- ing in the national average as Mark Lane where 4576 quarters were sold at an average of 72s 7d. Within that sixth district, Burton, with recorded sales totalling a mere one quarter and one bushel at 85s 4d a quarter, was weighted exactly the same as Cocker- mouth which had the largest sales in the district, 120 quarters, at the lowest price 73s 4d. In the national average Burton's meagre transactions had twice as much in- fluence as the third district's Fakenham, which.that week had sales of 3030 quarters, second only to Mark Lane in its turnover. The absurdities are almost endless. Within the third district, Fakenham, Norwich and Lynn had total sales of 6028 quarters, but as a group were weighted only the same in the national average as the eighth district's Pwlheli, Bah and Corwen, where transactions totalled all of fifteen quarters. We also find that the ten markets outside London with the largest sales had the same influence on the national average as the eleven with the lowest sales (excluding nil returns), despite their respective totals being a massive 10,379 quarters and a mere sixty-one quarters.
The tendency of the official weighting system was to inflate the national average price above one produced by weighting prices according to sales volume in each market. Essentially this was due to the weight allotted to the districts in the computation of the national average. In the particular week cited above, rank-order correlations between the volume of sales and lowness of price within districts were-.61, - .41, - . 10, +.39, +.71, +.27, +.26, +.58, +.34, -.24, and -.24, whereas a similar calculation between districts revealed a strong positive correlation of .73. 21 21There are correlations for only eleven districts as the
London market, Mark Lane, was classed as a district on its own. Why the inter- and intra-regional correlations differed is not easy to explain. Larger markets might have been expected to have lower prices because of organiza- tional efficiencies and quantity discounts. Possibly within
HISTORY REVIEW
Thus allowing low sales/high price districts equal weight with high sales/low price ones was bound to inflate the national average, in this instance by is 7d above a price given b y weighting the local ~iverages according to ~ sales volumes. A fuller discussion of the significance of the error emanating from the weighting procedures will be found else- where, 22 but it will be apparent to the reader that a Corn Law which offered protection at a price determined by the averages would in practice cease that protection when the actual market price would be below that specified in the legislation. Thus the ports could be open to foreign grain when the government did not intend them to be. This actually occurred for oats in February 1818 and August 1820.
Allegations were made to the Select Com- mittee that fraud had been practised. Amidst a generality of assumptions and beliefs two specific instances were cited: one at Mark Lane, the other at Liverpool. It was argued that, in an attempt to influence the London average, fictitious sales of wheat had been recorded in the six weeks preceding 15 November 1818: evidence for this lay in the corn factors' circulars which quoted prices bearing little resemblance to the Corn Exchange returns. At Liverpool the laxity of the inspector allowed speculative holders of British corn to return 2300 quarters of wheat at 50s when the true market price was 69- 70s, 2000 quarters of oats at 18s (true market price 23-24s), 1000 quarters of beans at 35s (48-50s), and 500 quarters of peas at 38s (48-51s). Fortunately the figures excited suspicion on the part of the central Receiver, and as he used his powers to omit the Liver- pool data from the national calculation the
some districts these factors may have been offset by quality differences or by grain from lower-priced areas being resold in the larger markets. Transport costs between districts in the pre-railway era would make inter-regional sales less feasible, though against this is the fact that even in the 1830s Mark Lane acted as an entrep6t between the surplus and deficit areas. J Wilson, Influence of the Corn Laws as Affecting All Classes of the Community and Particularly the Landed Interests, Edinburgh, 1839, p 12.
22 W Vamplew, 'The Protection of English Cereal Producers: The Corn Laws Re-assessed', Econ Hist Rev, forthcoming.

• " 1 ' , ' . " " . , , i
NINETEENTH-CENTURY CORN AVERAGES
attempt to lower the general average conse- quently failed. Failure seems to have been the fortune of all attempted frauds: at least the considered opinion of the Committee was that in no case of alleged fraud had the perpe- trators succeeded in their desire to open or shut the ports, z3
For those who wished to raise the average there was little need to resort to illegalities as the weighting procedure made it possible to work the averages quite legally. Indeed, allowing small sales to carry as much, and sometimes more, influence than large sales on the national average was an open invitation to manipulation. It was a not uncommon
practice to send agents to purchase relatively inconsiderable amounts at inflated prices in the smaller markets, z4 The temptation to work the averages was strengthened by the 1815 Corn Law which allowed foreign wheat freely into the country for the three months following any quarter day on which the average price for the preceding six weeks had been at or over 80s a quarter, zs As the average production cost of much British wheat at this time was higher than that of foreign produce, zs there was an incentive for dealers to raise the average so as to make profits on the cheaper foreign grain, for even when prices fell back below the 80s mark wheat could still be imported until the position was 23 Ibid: Report, pp 6-7, Evidence, pp 28, 54-5. There is one
alleged successful fraud before 1828 but it is not clear whether or not this was before 1821. S.C. on Agricultural Distress (BPP 1836, VIII), Q 8163. The grain involved in this case was rye, of which such small quantities were sold as to render manipulation much easier than with other grains. In 1828-29, the first harvest year for which full information is calculable, average recorded weekly sales of wheat were 48,494 quarters, oats 44,037, barley 32,299, beans 5826, peas 1492, and rye only 689.
24 S.C. on Petitions, etc., Evidence, p 42; Hansard (Commons), 2nd ser, IV, 941, 26 Feb 1821. The inflationary mechanism could have been a genuine reflection of increased demand pressure on scarce local supplies or dealers simply could have offered more than the going rate. The latter procedure would have been easier to arrange than when dealers wished to reduce the averages as both buyers and sellers would be happy with the high prices.
ZSThere was similar legislation for other gr~ins. For rye, beans and peas the prohibitory level was 50s a quarter, for barley 40s and for oats 27s.
26 S.C. on Petitions, etc., Report, p 7.
reviewed next quarter day. z7 Two corn factors giving evidence to the Committee were convinced that perhaps £400 to £500 could fix the ports, especially in the August quarter, though neither said that it had actually been done. z8
II The Select Committee's investigations led to two measures in 1821 designed to solve the twin problem of weighting and manipulation. First, when calculating the national average the Central Receiver was required to weight each market according to its sales volume. Additionally, in an effort to render the average more representative of actual market experi- ence, the number of towns entering into the calculation was increased from 139 to 148. A further two towns were added in 1827. When the sliding scale Corn Law was introduced in 1828 the opportunity was taken to revise the list of towns with twenty-one of the smaller markets, mostly Welsh, being replaced by towns mainly from inland areas, z9 This meant that for the first time major consumption centres such as Derby, Nottingham, Leicester, and Birmingham were allowed to affect the national average.
The adoption of the sliding scale possibly increased the temptation to work the averages for now the duty could alter weekly and at any price level, though, of course, the fact that each town was given its due weight in the calculation of the average lessened the influence of fraud, manipulation or mis- recording at any particular market. Allega- tions of malpractice continued to be made, 27 A provision in the law did allow that if the price fell below
the prohibitory level in the first six weeks following the opening of the ports access would be refused to grain from any of the near European ports between the Eyder and the Bidassoa for the last six weeks of that quarter. This clause was actually applied to wheat in September 1818.
28S.C. on Petitions, etc., R.eport, p 7. ZgR.eturns were also taken for several Irish and Scottish
towns but as an experiment only, and they were not used for calculating the average. In 1832 the collection of these returns was abandoned as an economy measure. At the time it was argued that the quantities involved would have been too small to influence the average significantly. S.C. on State of Agriculture (BPP 1837, V), QQ 319-23.
I
I
I
6 THE AGRICULTURAL
though as before most of these were in general rather than specific terms, 3° and again most attempts at fraud appear to have been unsuccessful. 31 Whether sufficient dealers could get together to manipulate the market is debatable, though at least one contemporary economist believed that the internal market was too competitive for this to happen. 32 Nevertheless, there does seem to be some substance in one widespread allegation that combinations of dealers in the large corn markets of London, Leeds and Wakefield had unduly raised the averages in the early 1840s.33
Although Peel believed that fraud was neither as widespread nor as effective as was sometimes alleged, he took steps in 1842 to reduce even that level. The number of towns contributing to the average was increased from 150 to 290 with the intention of including all English and Welsh towns of importance. The official view was that the extended coverage made little difference to the average price, 34 but certainly by increasing the volume of sales entering into the calcula- tion 3s it further reduced the significance of any particular market: eg ten random samples for each of the three years prior to the change showed that the percentage of total sales taking place in London, Leeds and Wakefield ranged from 21.0 to 25.8 with a median of
30 See, eg the sweeping but unsubstantiated claims in J Car- michael, Review of the Evidence Taken Before the Select Committee of the House of Commons on Agricultural Distress (1836); 'The Corn Laws', Blackwood's Edinburgh Magazine LI, March 1842; S.C. on Agricultural Statistics (BPP 1854/ 55, VIII), Appendix D.
31 S.C. on Agricuhural Distress (BPP 1836, VIII), QQ 6249- 51, 9597; S.C. on Agriculture (BPP 1833, V), QQ 4664. The Central Receiver of the Corn Returns claimed that there was only one instance of known fraud between 1828 and 1834. Adrian, loc cit, p 222.
32 R Torrens, An Essay on the External Corn Trade, Edin- burgh, 1829, p 16.
33 Fay, op cit, pp 170-1. a4Statement of the Deputy Receiver of theCorn Returns.
S.C. on Agricuhural Statistics (BPP 1854-55, VIII), Q 868. 35 In the period 1842-49 the inclusion of the extra towns
increased the volume of wheat entering into the calculation by 30 per cent, barley by 32 per cent and oats by 12 per cent. Calculated from data in Accounts Relating to Wheat, Barley, Oats, etc. (BPP 1850, LII), p 20.
HISTORY REVIEW
23.3 whereas a similar sample after the legisla- tion yielded a range of 11.0 to 15.2 and a median of 12.8. Secondly, the duties of the inspectors in the new towns, and in the established ones on the death or retirement of the incumbent, were added to the work of the local exciseman. It was hoped that the employment of public officials directly res- ponsible to the government would offer greater security from both fraud and inertia, along with a reduction in the costs of data collection; 36 though it was later suggested that the general quality of the inspectorate did not improve as the excisemen were not specialists in the corn trade - - but neither was the Bodmin barber - - nor resident in an area long enough to obtain local unofficial in- formation. 37 Finally, in the belief that 'the great and only effectual security against fraud in the averages is to take away the temptation to commit it', the sliding scale was revised so that variations in price brought less steep and less irregular changes in duty. 38 Later, the repeal of the Corn Laws removed the tempta- tion altogether.
III Further complaints in the 1870s and 1880s about the accuracy of the averages led to another Parliamentary inquiry, this one charged with assessing whether they were still a fit basis for the calculation of tithe com- mutation payments. 39 Three major issues were raised: a suggestion that the decline in the sales figures for wheat reflected a growing inefficiency on the part of the corn inspectors; the possibility of errors emanating from in- adequate market coverage; and the likelihood that the average was inflated by the inclusion of resales of grain, the increased consumption of corn on the farm, and confusion in the
3~ S.C. on Agric,dtural Statistics, Appendix D. 37 Ibid: Q 861, Appendix D. 38 Peel's speech of 9 February 1842, quoted in Fay, op cit,
p 171. 39S.C. on the Corn Averages (BPP 1888, X).
j !
NINETEENTH-CENTURY CORN AVERAGES
conversion of customary measures to imperial ones .4O
Clearly there were deficiencies on the part of the inspectorate and the investigating Committee was persuaded that it should call for increased vigilance by the inspectors. 41 Even Giffen, the Controller of the Corn Returns, though generally satisfied with the performance of his inspectors, admitted that there were problems in some towns, notably Exeter, Hereford and Colchester. 42 Certainly, in some markets, the volume of corn returned was directly related to the energy expended by the inspectors, and there appears to have been general laxity in asking for returns of corn sold away from the market. 43 The problem was not one of evasion or manipulation but of neglect and inertia: dealers, particularly those involved in several markets, saw no point in going out of their way to make returns which, now that the Corn Laws had gone, they felt had practical significance only for farmers and the Church. 44 Nevertheless, some critics appear to have been ignorant of the fact that only British corn had to be returned. Increasingly foreign grain was entering into British diets, and sales of this had no direct part in the averages; thus it is feasible that the declining returns of quantities sold merely reflected the declining acreage under wheat.4s The quality of the inspectors may have accentuated the problem but they were not at its root.
There is little validity in the allegation that the omission of the smaller markets from the calculations led to false national averages. The weighting system would not allow small figures sufficient influence to distort the average: indeed when the number of towns was reduced from 290 to 150 in 1864 it was 401bid: R Giffen, 'The Gazette Average Prices of Corn'
.]our Star Soc, XLII, 1879. 41 S.C. on the Corn Averages (BPP 1888, X), 2nd Report, vii. 42 Ibid: Q 4217. 43 Ibid: QQ 587-8,632. 44 lbid: QQ 229,514, 1014-18. 4SGiffen, loc cit, p 710. Official figures for acreage under
wheat are 1869 3.7 m, 1879 2.9 m and 1889 2.4 m; imports of wheat for the same years were 37.6 m cwts, 59.6 m and 58.6 m. Mitchell and Deane, op ci~:, pp 78, 98.
7
'ascertained that no/difference would have been made in the returns for some time pre- vious'. 4e Nevertheless, in response to criticism of inadequate coverage, t henumber was raised to 187 in 1883 and to 196 in 1890.
Perhaps more significance can be attributed to the increased proportion of grain which was consumed on the farm. The rising incomes of the working class had so reduced the market for inferior grain that it had become more profitable to turn such lower quality corn into meat and milk by feeding it to live- stock. 47 The dual problem here is, first, to ascertain what quantity of production remained on the farm and, secondly, the effect which this had on the official average price.• The agrarian statistician, Major Craigie, reckoned that only 10 per cent of wheat, but much more of other grains, was consumed on the farm and another authority thought that, on the whole, 10-15 per cent of corn did not go to market. 48 It is not clear, however, that the average price was much higher than it would otherwise have been, for, although everyone accepted that inferior grain did not go to market and thus, according to one authority, kept the market price 5 per cent too high 49 most forgot that the very best corn, that used for seed, also frequently did not go, and this would have raised the average market price, s° Until evidence comes to light showing what the increased proportion of non- marketed inferior grain was, it is by no means clear that the average was unduly inflated.
In contrast to the corn which never entered into the official records, other grain was double or even treble-counted because of resales, the proportion of which had increased through changes in the structure of the grain trade. In the early nineteenth century millers and maltsters were to be found at all the little markets, but now intermediaries did thepur- chasing here and then resold to the millers and
48 Giffen, loc cit, p 711. 47S.C. on the Corn Averages, Q 990, Appendix 6. 48 Ibid: QQ 2015, 3209. 49 Ibid: Q 1088. so Ibid: QQ 2195, 2201, 2204.
8 THE AGRICULTURAL HISTORY REVIEW
p:
the maltsters at the larger markets. 51 It was argued that resales should not be allowed to influence tithe payments as they had no bearing on farm incomes, but the relevant Acts specified that all sales must be included in order to obtain a true idea of the current market price. There had been no debate about the inclusion of resales when the Tithe Com- mutation Bill had passed through Parliament, though, to be fair, there were less resales then. s2 Possibly resales did inflate prices - - most likely resales would be at higher than lower prices - - but there is little that can be done, for there is no way in which resold corn can be distinguished from that being sold for the first time.
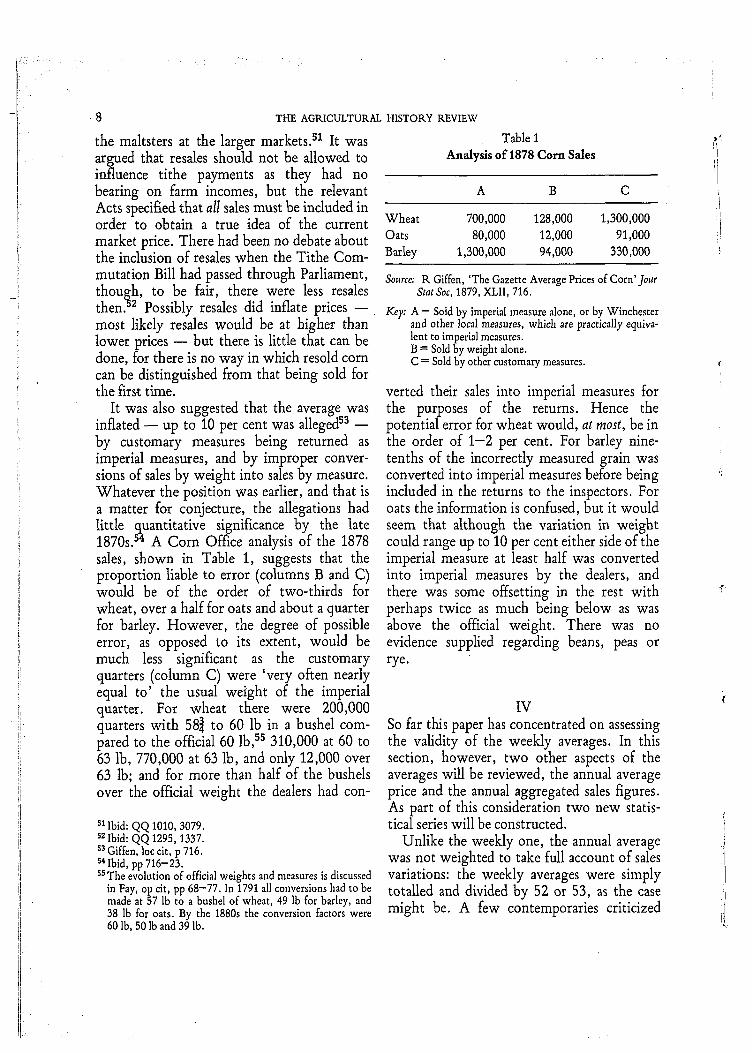
It was also suggested that the average was inflated - - up to 10 per cent was alleged s3 - - by customary measures being returned as imperial measures, and by improper conver- sions of sales by weight into sales by measure. Whatever the position was earlier, and that is a matter for conjecture, the allegations had little quantitative significance by the late 1870s. s4 A Corn Office analysis of the 1878 sales, shown in Table 1, suggests that the proportion liable to error (columns B and C) would be of the order of two-thirds for wheat, over a half for oats and about a quarter for barley. However, the degree of possible error, as opposed to its extent, would be much less significant as the customary quarters (column C) were 'very often nearly equal to' the usual weight of the imperial quarter. For wheat there were 200,000 quarters with 58~ to 60 lb in a bushel com- pared to the official 60 lb, ss 310,000 at 60 to 63 lb, 770,000 at 63 lb, and only 12,000 over 63 lb; and for more than half of the bushels over the official weight the dealers had con-
sl Ibid: QQ 1010, 3079. sz Ibid: QQ 1295, 1337. ss Giffen, loc cit, p 716. 5~ Ibid, pp 716-23. SSThe evolution of official weights and measures is discussed
in Fay, op cit, pp 68-77. In 1791 all conversions had to be made at 57 lb to a bushel of wheat, 49 lb for barley, and 38 lb for oats. By the 1880s the conversion factors were 60 lb, 50 lb and 39 lb.
Table 1
Analys i s o f 1878 C o r n Sales
A B C
Whea t 700,000 128,000 1,300,000
Oats 80,000 12,000 91,000
Barley 1,300,000 94,000 330,000
Source: R Giffen, 'The Gazette Average Prices of Corn' Jour Star Soc, 1879, XLII, 716.
Key: A - Sold by imperial measure alone, or by Winchester and other local measures, which are practically equiva- lent to imperial measures. B = Sold by weight alone. C = Sold by other customary measures.
vertecl their sales into imperial measures for the purposes of the returns. Hence the potential error for wheat would, at most, be in the order of 1-2 per cent. For barley nine- tenths of the incorrectly measured grain was converted into imperial measures before being included in the returns to the inspectors. For oats the information is confused, but it would seem that although the variation in weight could range up to 10 per cent either side of the imperial measure at least half was converted into imperial measures by the dealers, and there was some offsetting in the rest with perhaps twice as much being below as was above the official weight. There was no evidence supplied regarding beans, peas or r y e .
IV So far this paper has concentrated on assessing the validity of the weekly averages. In this section, however, two other aspects of the averages will be reviewed, the annual average price and the annual aggregated sales figures. As part of this consideration two new statis- tical series will be constructed.
Unlike the weekly one, the annual average was not weighted to take full account of sales variations: the weekly averages were simply totalled and divided by 52 or 53, as the case might be. A few contemporaries criticized
:1
r
I i]
NINETEENTH-CENTURY CORN AVERAGES
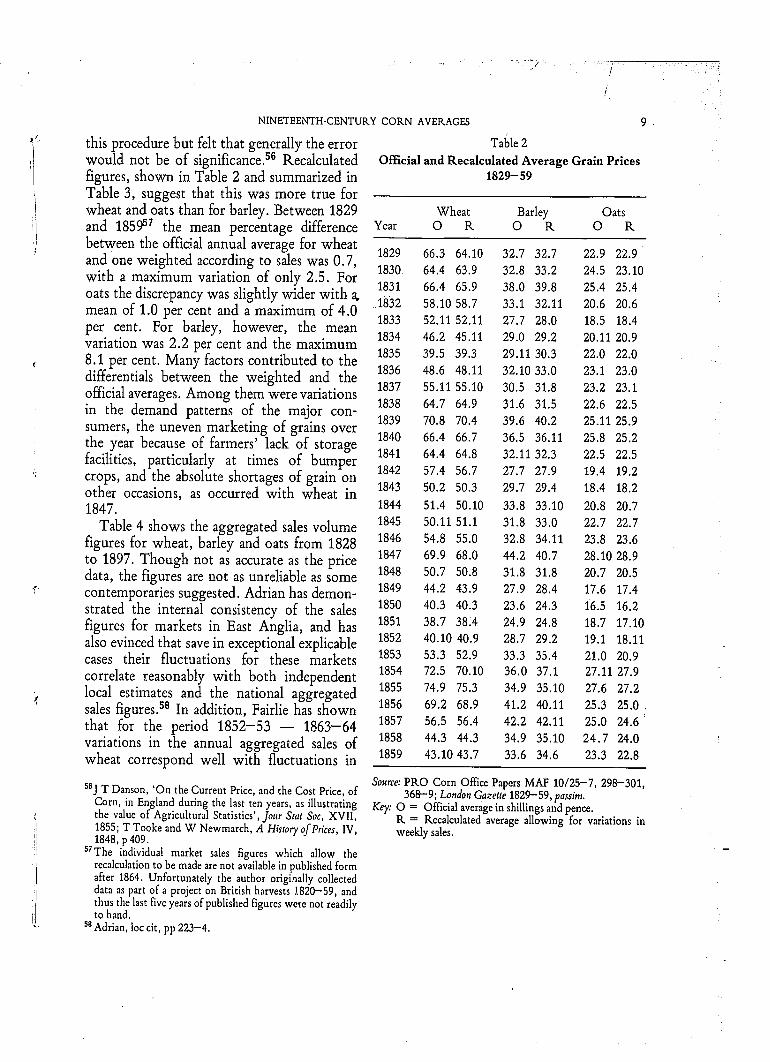
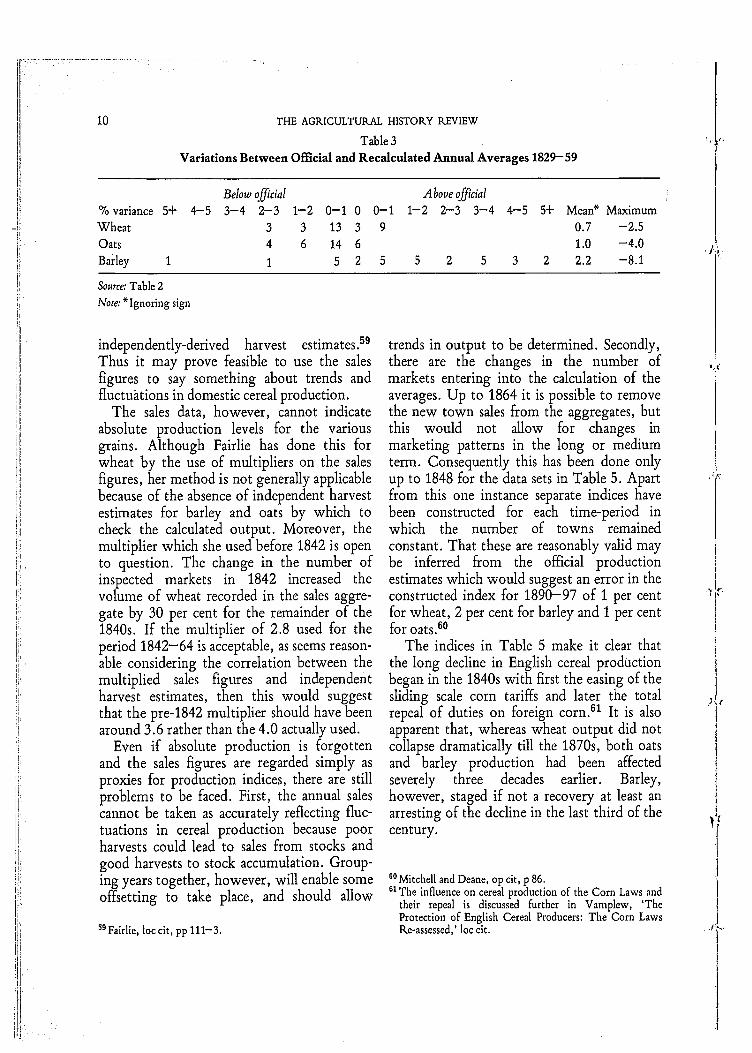
this procedure but felt that generally the error would not be of significance. 86 Recalculated figures, shown in Table 2 and summarized in Table 3, suggest that this was more true for wheat and oats than for barley. Between 1829 and 185987 the mean percentage difference Year
between the official annual average for wheat 1829 and one weighted according to sales was 0.7, 1830 with a maximum variation of only 2.5. For 1831
oats the discrepancy was slightly wider with a. 1832 mean of 1.0 per cent and a maximum of 4.0
1833 per cent. For barley, however, the mean variation was 2.2 per cent and the maximum 1834 8.1 per cent. Many factors contributed to the 1835 differentials between the weighted and the 1836 official averages. Among them were variations 1837
1838 in the demand patterns of the major con- 1839 sumers, the uneven marketing of grains over
the year because of farmers' lack of storage 1840 1841 facilities, particularly at times of bumper 1842
crops, and the absolute shortages of grain on other occasions, as occurred with wheat in 1843 1847. 1844
Table 4 shows the aggregated sales volume 1845 figures for wheat, barley and oats from 1828 1846 to 1897. Though not as accurate as the price 1847 data, the figures are not as unreliable as some 1848 contemporaries suggested. Adrian has demon- 1849 strated the internal consistency of the sales 1850 figures for markets in East Anglia, and has 1851 also evinced that save in exceptional explicable 1852 cases their fluctuations for these markets 1853 correlate reasonably with both independent 1854 local estimates and the national aggregated 1855 sales figures. 88 In addition, Fairlie has shown 1856 that for the period 1852-53 - - 1863-64 1857 variations in the annual aggregated sales of 1858 wheat correspond well with fluctuations in 1859
s6j T Damon, 'On the Current Price, and the Cost Price, of Corn, in England during the last ten years, as illustrating the value of Agricultural Statistics',.]our Star Soc, XVII, 1855; T Tooke and W Newmarch, A History of Prices, IV, 1848, p 409.
ST The individual market sales figures which allow the recalculation to be made are not available in published form after 1864. Unfortunately the author originally collected data as part of a project on British harvests 1820--59, and thus the last five years of published figures were not readily to hand.
ss Adrian, loc cit, pp 223-4.
9
Tal~le 2
Official and Recalculated Average Grain Prices 1 8 2 9 - 5 9
Wheat Barley Oats O R O R O tk
66.3 64.10 32.7 32.7 22.9 22.9 64.4 63.9 32.8 33.2 24.5 23.10 66.4 65.9 38.0 39.8 25.4 25.4 58.1058.7 33.1 32.11 20.6 20.6 52.11 52.11 27.7 28.0 18.5 18.4 46.2 45.11 29.0 29.2 20.11 20.9 39.5 39.3 29.11 30.3 22.0 22.0 48.6 48.11 32.1033.0 23.1 23.0 55.11 55.10 30.5 31.8 23.2 23.1 64.7 64.9 31.6 31.5 22.6 22.5 70.8 70.4 39.6 40.2 25.11 25.9 66.4 66.7 36.5 36.11 25.8 25.2 64.4 64.8 32.11 32.3 22.5 22.5 57.4 56.7 27.7 27.9 19.4 19.2 50.2 50.3 29.7 29.4 18.4 18.2
51.4 50.10 33.8 33.10 20.8 20.7 50.11 51.1 31.8 33.0 22.7 22.7 54.8 55.0 32.8 34.11 23.8 23.6 69.9 68.0 44.2 40.7 28.10 28.9 50.7 50.8 31.8 31.8 20.7 20.5 44.2 43.9 27.9 28.4 17.6 17.4 40.3 40.3 23.6 24.3 16.5 16.2 38.7 38~4 24.9 24.8 18.7 17.10 40.10 40.9 28.7 29.2 19.1 18.11 53.3 52.9 33.3 35.4 21.0 20.9 72.5 70.10 36.0 37.1 27.11 27.9 74.9 75.3 34.9 35.10 27.6 27.2 69.2 68.9 41.2 40.11 25.3 2 5 . 0 56.5 56.4 42.2 42.11 25.0 24.6 44.3 44.3 34.9 35.10 24.7 24.0 43.1043.7 33.6 34.6 23.3 22.8
Source: PRO Corn Office Papers MAF 10/25-7, 298-301, 368-9; London Gazette 1829-59, passim.
Key: O = Official average in shillings and pence. R = Recalculated average allowing for variations in weekly sales.
l . . . . . . : . . . . ; -
10 THE AGRICULTURAL HISTORY REVIEW
Table 3 Variations Between Oflleial and Recalculated Annual Averages 1829-59
Below official Above official % variance 5+ 4-5 3-4 2-3 1-2 0-1 0 0-1 1-2 2-3 3-4 Wheat 3 3 13 3 9 Oats 4 6 14 6 Barley 1 1 5 2 5 5 2 5
So,¢rce: Table 2
4-5 5+ Mean* Maximum 0.7 -2.5 1.0 -4.0
3 2 2.2 -8.1 ,],,
Note: * Ignoring sign
J!i
dl i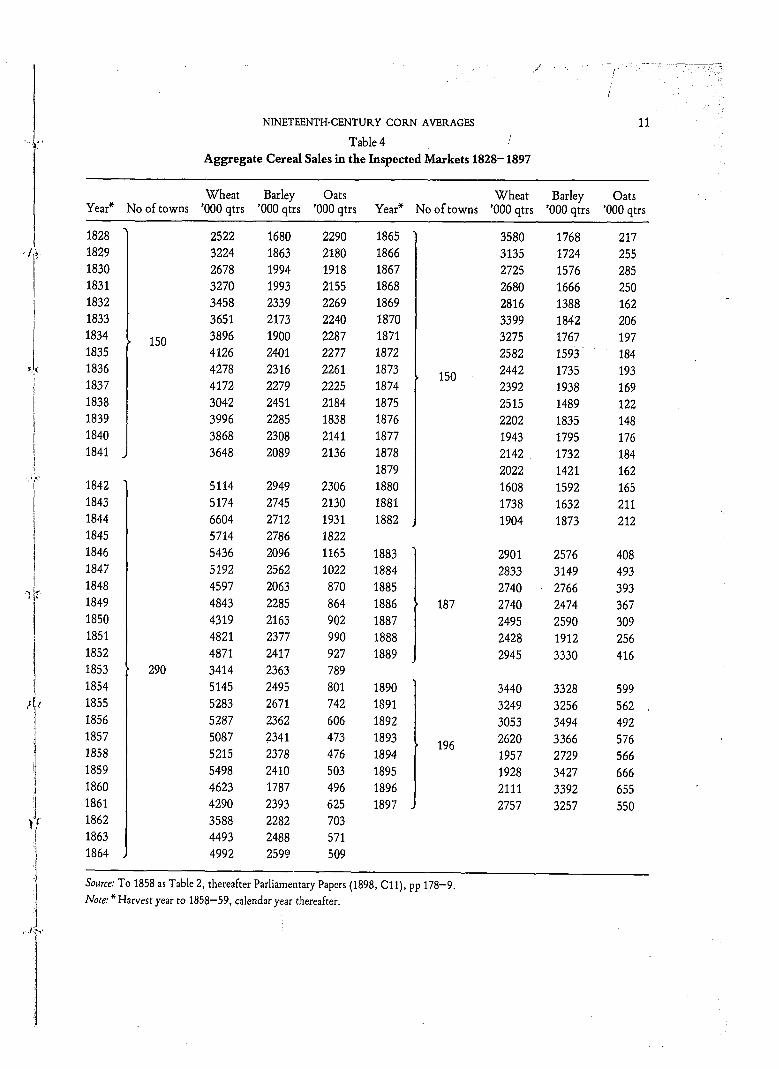
;fl 1
NINETEENTH-CENTURY CORN AVERAGES
Table 4 .~ Aggregate Cereal Sales in the Inspected Markets 1828-1897
11
Wheat Barley Oats Wheat Barley Oats Year* Nooftowns '000qtrs '000qtrs '000qtrs Year* Nooftowns '000 qtrs '000qtrs '000qtrs
1828 1829 1830 1831 1832 1833 1834 1835 1836 1837 1838 1839 1840 1841
1 150
l
290
2522 1680 2290 1865 3224 1863 2180 1866 2678 1994 1918 1867 3270 1993 2155 1868 3458 2339 2269 1869 3651 2173 2240 1870 3896 1900 2287 1871 4126 2401 2277 1872 4278 2316 2261 1873 4172 2279 2225 1874 3042 2451 2184 1875 3996 2285 1838 1876 3868 2308 2141 1877 3648 2089 2136 1878
1879 5114 2949 2306 1880 5174 2745 2130 1881 6604 2712 1931 1882 5714 2786 1822 5436 2096 1165 1883 5192 2562 1022 1884 4597 2063 870 1885 4843 2285 864 1886 4319 2163 902 1887 4821 2377 990 1888 4871 2417 927 1889 3414 2363 789 5145 2495 801 1890 5283 2671 742 1891 5287 2362 606 1892 5087 2341 473 1893 5215 2378 476 1894 5498 2410 503 1895 4623 1787 496 1896 4290 2393 625 1897 3588 2282 703 4493 2488 571 4992 2599 509
150
187
196
3580 1768 217 3135 1724 255 2725 1576 285 2680 1666 250 2816 1388 162 3399 1842 206 3275 1767 197 2582 1593 184 2442 1735 193 2392 1938 169 2515 1489 122 2202 1835 148 1943 1795 176 2142. 1732 184 2022 1421 162 1608 1592 165 1738 1632 211 1904 1873 212
2901 2576 408 2833 3149 493 2740 2766 393 2740 2474 367 2495 2590 309 2428 1912 256 2945 3330 416
3440 3328 599 3249 3256 562 3053 3494 492 2620 3366 576 1957 2729 566 1928 3427 666 2111 3392 655 2757 3257 550
1842 1843 1844 1845 1846 1847 1848 1849 1850 1851 1852 1853 1854 1855 1856 1857 1858 1859 1860 1861 1862 1863 1864
Source: To 1858 as Table 2, thereafter Parliamentary Papers (1898, Cll), pp 178-9. Note: * Harvest year to 1858-59, calendar year thereafter.
i
t ! i . ¸ , : : • . • - • . . . . .
12 THE AGKICULTURAL
Table 5 Index to Cereal Sales
Wheat Barley Oats
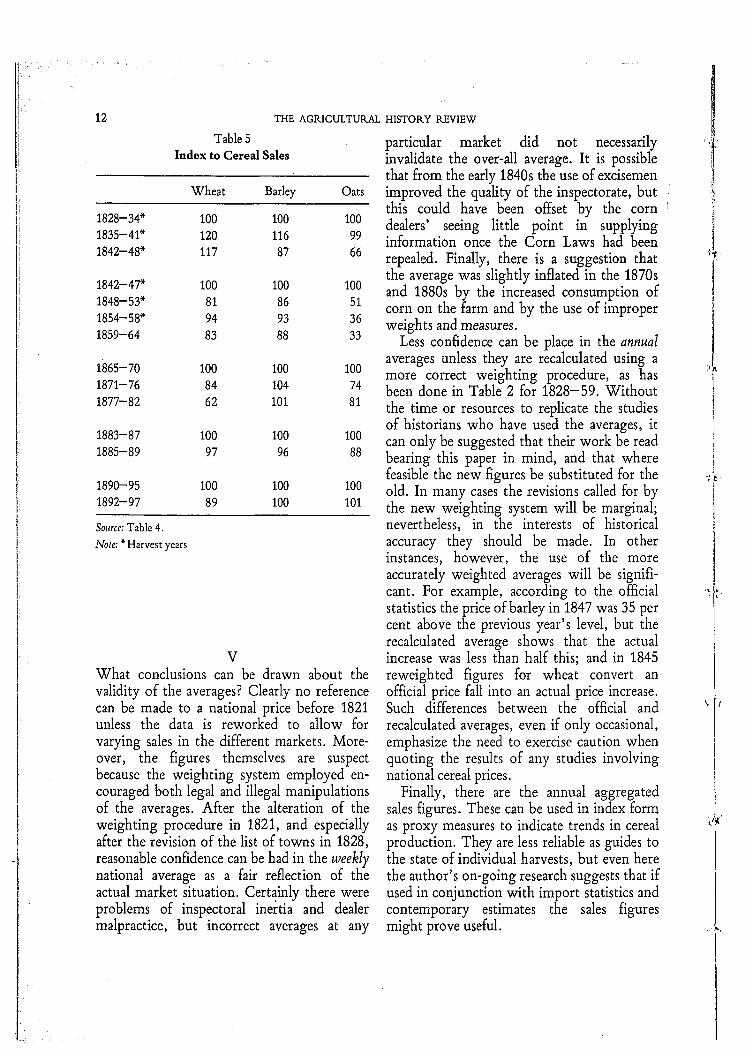
1828-34" 100 100 100 1835-41" 120 116 99 1842-48" 117 87 66
1842-47" 100 100 100 1848-53" 81 86 51 1854-58" 94 93 36 1859-64 83 88 33
1865-70 100 100 100 1871-76 84 104 74 1877-82 62 101 81
1883-87 100 100 100 1885"89 97 96 88
1890--95 100 100 100 1892-97 89 100 101
Source: Table 4. Note: * Harvest years
V What conclusions can be drawn about the validity of the averages? Clearly no reference can be made to a national price before 1821 unless the data is reworked to allow for varying sales in the different markets. More- over, the figures themselves are suspect because the weighting system employed en- couraged both legal and illegal manipulations of the averages. After the alteration of the weighting procedure in 1821, and especially after the revision of the list of towns in 1828, reasonable confidence can be had in the weekly national average as a fair reflection of the actual market situation. Certainly there were problems of inspectoral inertia and dealer malpractice, but incorrect averages at any
HISTORY REVIEW
particular market did not necessarily invalidate the over-all average. It is possible that from the early 1840s the use of excisemen improved the quality of the inspectorate, but this could have been offset by the corn dealers' seeing little point in supplying information once the Corn Laws had been repealed. Finally, there is a suggestion that the average was slightly inflated in the 1870s and 1880s by the increased consumption of corn on the farm and by the use of improper weights and measures.
Less confidence can be place in the annual averages unless they are recalculated using a more correct weighting procedure, as has been done in Table 2 for 1828-59. Without the time or resources to replicate the studies of historians who have used the averages, it can only be suggested that their work be read bearing this paper in mind, and that where feasible the new figures be substituted for the old. In many cases the revisions called for by the new weighting system will be marginal; nevertheless, in the interests of historical accuracy they should be made. In other instances, however, the use of the more accurately weighted averages will be signifi- cant. For example, according to the official statistics the price of barley in 1847 was 35 per cent above the previous year's level, but the recalculated average shows that the actual increase was less than half this; and in 1845 reweighted figures for wheat convert an official price fall into an actual price increase. Such differences between the official and recalculated averages, even if only occasional, emphasize the need to exercise caution when quoting the results of any studies involving national cereal prices.
Finally, there are the annual aggregated sales figures. These can be used in index form as proxy measures to indicate trends in cereal production. They are less reliable as guides to the state of individual harvests, but even here the author's on-going research suggests that if used in conjunction with import statistics and contemporary estimates the sales figures might prove useful.
I
~T"
L

q:
[ ,
NINETEENTH-CENTURY CORN AVERAGES
The corn averages are imperfect statistics. Nevertheless, if used with care they can throw light on cereal prices and production in nineteenth-century England. They cannot be dismissed as readily as they were by Henry Francis Moore, an agricultural journalist,
13 /
who in his evidence to the Select Committee on the Corn Averages claimed that 'they are not worth the paper that they are written on ' .62
8zS.C. on Corn Averages (BPP 1888, X) Q 1121.
Appendix The Weighting System for Wheat 1819
(week ending 16 January)
(1) Towns
First district London (Mark Lane)
Quantity % weight % sold Average in district district qtrs ~ s d average sales
% weight in national
average
% national
sales
Third district Norwich 1739 77-11 8.3 25.6 0.69 6.65 Yarmouth 340 77-7 8.3 5.0 0.69 1.30 Lynn 1268 75-7 8.3 18.7 0.69 4.85 Thetford 50 76--0 8.3 0.7 0.69 0.19 Watton 10 73-0 8.3 0.1 0.69 0.04 Wymondham 76 76-0 8.3 1.1 0.69 0.29 East Dereham 10 74-0 8.3 0.1 0.69 0.04 Harleston 39 77-1 8.3 0.6 0.69 0.15 Holt 60 76-0 8.3 0.9 0.69 0.23 Aylesham 82 76-5 8.3 1.2 0.69 0.31 Fakenham 3030 74-8 8.3 44.6 0.69 11.59 Walsingham 87 76-4 8.3 1.3 0.69 0.33
Second district Ipswich 626 78-0 8.3 15.5 0.69 2.40 Woodhridge 515 76-11 8.3 12.8 0.69 1.97 Sudbury 317 78-10 8.3 7.8 0.69 1.21 Hadhigh 609 82-10 8.3 15.1 0.69 2.33 Stow Market 274 76-11 8.3 6.8 0.69 1.05 Bury 297 76-4 8.3 7.4 0.69 1.14 Beccles 103 78-0 8.3 2.6 0.69 0.39 Bungay 94 75-7 8.3 2.3 0.69 0.36 Lowestoft 135 76-0 8.3 3.3 0.69 0.52 Cambridge 634 77-4 8.3 15.7 0.69 2.43 Ely 64 71-7 8.3 1.6 0.69 0.24 Wisbeach 367 75- 8 8.3 9.1 0.69 1.40
4576 72-7 100.0 100.0 8.33 17.51

14 THE AGRICULTURAL HISTORY REVIEW
Quantity sold qtrs ~
% weight Average in district
s d average
% district
sales
% weight in national
average
% national
sales Fourth district
Lincoln 452 80-0 6.7 10.0 0.56 1.73 Gainsborough 391 81-6 6.7 8.7 0.56 1.50 Glamford Briggs 273 78-4 6.7 6.0 0.56 1.04 Louth 357 79-0 6.7 7.9 0.56 1.37 Boston 482 76-1 6.7 10.7 0.56 1.84 Sleaford 70 82-3 6.7 1.5 0.56 0.27 Stamford 702 80-1 6.7 15.5 0.56 2.69 Spalding 17 74-0 6.7 0.4 0.56 0.07 York 141 79-6 6.7 3.1 0.56 0.54 Bridlington 16 77-0 6.7 0.4 0.56 0.06 Bever!ey 447 74-7 6.7 9.9 0.56 1.71 Howden 172 78-0 6.7 3.8 0.56 0.69 Hull 651 73-11 6.7 14.4 0.56 2.49 Whitby 122 79-0 6.7 2.7 0.56 0.47 New Malton 226 72-10 6.7 5.0 0.56 0.86
Fifth district Durham 99 73-10 8.3 6.1 0.69 0.38 Stockton 81 75-6 8.3 5.0 0.69 0.31 Darlington 79 78-0 8.3 4.8 0.69 0.30 Sunderland 31 72- 2 8.3 1.9 0.69 0.12 Barnard Castle 68 78- 5 8.3 4.1 0.69 0.26 Wolsingham 45 80-0 8.3 2.8 0.69 0.17 Belford 48 64-0 8.3 3.0 0.69 0.18 Hexham 28 76-0 8.3 1.7 0.69 0.11 Newcastle 605 74-2 8.3 37.3 0.69 2.31
Morpeth 172 70-4 8.3 10.6 0.69 0.66 Alnwick 129 67-4 8.3 8.0 0.69 0.49 Berwick 230 64-11 8.3 14.2 0.69 0.88
SiXth district Carlisle 21 77-4 16.7 7.3 1.39 0.08 Whitehaven 36 80-0 16.7 12.5 1.39 0.14 Cockermouth 120 73-4 16.7 41.8 1.39 0.46 Penrith 90 81-2 16.7 31.4 1.39 0.34 Appleby 18 86-0 16.7 6.3 1.39 0.07 Burton 1 85-4 16.7 0.3 1.39 - -
NINETEENTH-CENTURY C O R N AVERAGES
/
/
15
" ' ~i
' i
Seventh district Liverpool
Ulverstone
Lancaster Preston
Wigan
Warrington
Manchester
Bolton
Chester
Nantwich
Macclesfield
Stockport
Quantity % weight % sold Average in district district qtrs* s d average sales
89 76-4 8.3 10.5
14 90-0 8.3 1.6
73 85-4 8.3 8.6
41 74-4 8.3 4.8
71 77-8 8.3 8.3
200 75-2 8.3 23.5
- - - - 8 . 3 - -
6 6 77-4 8.3 7.8 195 78-2 8.3 22.9
101 76-8 8.3 11.9
- - - - 8 . 3 - -
- - - - 8 . 3 - -
% weight in national
average
0.69
0.69
0.69
0.69
0.69
0.69
0.69
0.69
0.69
0.69
0.69
0.69
%
national sales
0.34
0.05
0.28
0.16
0.27
0.77
0.25
0.75
0.39
Eighth district Holywell 23 74-10 6.7 7.1 0.56 0.09
Mold 9 74-6 6.7 2.8 0.56 0.03 Denbigh 66 67-2 6.7 20.4 0.56 0.25
Wrexham 15 87-6 6.7 4.6 0.56 0.06
Llanrwst 12 87-2 6.7 3.7 0.56 0.05
Ruthin 88 81-5 6.7 27.2 0.56 0.34 Beaumaris - - - - 6.7 - - 0.56 - -
Llannerchymedd 10 71-0 6.7 3.1 0.56 0.04
Almwch - - - - 6.7 3.1 0.56 - -
Carnarvon 71 81-0 6.7 21.9 0.56 0.27 Pwlheli 4 80 -0 6.7 1.2 0.56 0.02
Conway 14 84-0 6.7 4.3 0.56 0.05
Bala 3 91-4 6.7 0.9 0.56 0.01 Corwen 8 92-6 6.7 2.5 0.56 0.03 Dolgelly - - - - 6.7 - - 0.56 - -
Ninth district Cardigan 3 94-4 8.3 1.7 0.69 0.01 Lampeter - - - - 8.3 - - 0.69 - -
Aberystwith 11 84-0 8.3 6.1 0.69 0.04 Pembroke - - - - 8.3 - - 0.69 - -
Fishguard 18 81-1 8.3 10.1 0.69 0.07 Haverfordwest 10 67-0 8.3 5.6 0.69 0.04
Carmarthen 59 78-4 8.3 32.9 0.69 0.23
Llandilo 3 96-0 8.3 1.7 0.69 0.01
Kidwelly 45 80-0 8.3 25.1 0.69 0.17
Swansea 12 82-6 8.3 6.7 0.69 0.05
Neath 16 87-4 8.3 8.9 0.69 0.06 Cowbridge - - - - 8.3 - - 0.69 - -

il 16 THE AGRICULTURAL HISTORY REVIEW
Quantity % weight % % weight. % sold Average in district district in national national
Tenth district qtrs* s d average sales average sales
Gloucester 79 80-2 6.7 6.4 0.56 0.30 Cirencester 225 85-0 6.7 18.3 0.56 0.86 Tetbury 79 77-6 6.7 6.4 0.56 0.30 Stow on Wold 60 85-0 6.7 4.9 0.56 0.23 Tewkesbury 16 80-8 6.7 1.3 0.56 0.06 Bristol 225 76-4 6.7 18.3 0.56 0.86 Taunton 180 77-3 6.7 14.6 0.56 0.69 Welis 40 78-0 6.7 3.3 0.56 0.15 Bridgewater 34 81-6 6.7 2.8 0.56 0.13 Frome 11 83-5 6.7 0.9 0.56 0.04 Chard 199 77-2 6.7 16.2 0.56 0.76 Monmouth 50 81-4 6.7 4.1 0.56 0.19 Abergavenny 9 92-0 6.7 0.7 0.56 0.03 Chepstow 8 71-11 6.7 0.7 0.56 0.03 Pontypool 11 89-6 6.7 0.9 0.56 0.04
Eleventh district Exeter 258 80-4 8.3 51.2 0.69 0.99 Barnstaple 64 73-4 8.3 12.7 0.69 0.24 Plymouth 16 76-0 8.3 3.2 0.69 0.06 Torness 14 72-10 8.3 2.8 0.69 0.05 Tavistock 44 81-11 8.3 8.7 0.69 0.17 Kingsbridge 15 75-9 8.3 3.0 0.69 0.06 Truro 19 77-4 8.3 3.8 0.69 0.07 Bodmin 21 74-8 8.3 4.2 0.69 0.08 Launceston 7 74-0 8.3 1.4 0.69 0.03 P,,edruth 11 80-0 8.3 2.2 0.69 0.04 Helstone 18 79-10 8.3 3.6 0.69 0.07 St Austell 14 77-4 8.3 2.8 0.69 0.05
Twelfth district Blandford 23 74-8 6.7 1.5 0.56 0.09 Bridport 159 75-0 6.7 10.3 0.56 0.61 Dorchester 130 71-5 6.7 8.4 0.56 0.50 Sherborne 31 77-9 6.7 2.0 0.56 0.12 Shaston 62 78-10 6.7 4.0 0.56 0.24 Wareham 54 74-2 6.7 3.5 0.56 0.21 Winchester 150 76-6 6.7 9.7 0.56 0.57 Andover 67 80-7 6.7 4.3 0.56 0.26 Basingstoke 237 78-3 6.7 15.3 0.56 0.91 Fareham 255 75-0 6.7 16.4 0.56 0.98 Havant 44 69-10 6.7 2.8 0.56 0.17 Newport 159 73-0 6.7 10.3 0.56 0.61 P.ingwood 89 76-8 6.7 5.7 0.56 0.34 Southampton 6 64-0 6.7 0.4 0.56 0.02 Portsmouth 82 71-2 6.7 5.3 0.56 0.31
t " " , '"-;
NINETEENTH-CENTURY CORN AVERAGES
(2) Districts
17
Quantity Average % weight in % qtrs* s d national average national sales
First 4576 72-7 8.3 17.5 Second 4039 77-0 8.3 15.5 Third 6793 75-10 8.3 26.0 Fourth 4519 77-8 8.3 17.3 Fifth 1620 72-11 8.3 6.2 Sixth 287 80-6 8.3 1.1 Seventh 851 79-0 8.3 3.3 Eighth 324 81-3 8.3 1.2 Ninth 179 83-4 8.3 0.8 Tenth 1229 81-1 8.3 3.8 Eleventh 504 76-11 8.3 1.9 Twelfth 1551 74-5 8.3 5.5
Source: S.C. on Petitions Relating to Agricuhural Distress (PP 1820, 11), Appendix A. * Bushels have been omitted
Notes and Comments WINTER CONFERENCE, 1979 The Winter Conference was held jointly with the Historical Geography Research Group of the Institute of British Geographers on 1 December 1979, at the Polytechnic of Central London, New Cavendish Street, London NW1. The meeting was attended by over fifty members and heard papers presented by Mr C J Harrison (University of Keele), 'Fire on the Chase: rural discontent in sixteenth-century Staffordshire'; Dr D J Ormrod (University of Kent), 'Grain riots and government policy in the eighteenth century'; Mr A Charlesworth (University of Liverpool), 'The English rural proletariat and its role in popular disturbances, 1750--1850'; and Mr M Cleary (University of Cambridge), 'Agricultural Syndicalism in the Massif Central, 1900-60'. Thanks were expressed to Drs A D M Phillips and D A Baker for organizing the Conference.
SPRING CONFERENCE, 1980 The Spring Conference of the Society will be held at Pantycelyn Hall, the University College of Wales, Aberystwyth, 14-16 April 1980. Speakers will include Dr John Broad, Dr Eric Kerridge, Professor Donald Winters, and Dr Forrest Capie. Dr tLichrrd Colyer is acting as local conference secretary. Full details and booking forms should appear in this is.~ue of the Review, but in case of any difficulty, members should write to the Secretary of the Society.
LAXTON At the time of writing, there is still doubt about the future of the Nottinghamshire village of Laxton, which is threatened with sale as part of the Govern- ment's economy measures. Laxton was the central subject of the classic work by C S and C S Orwin, The Open Fields (Oxford, 1938). In order to preserve the village's unique open field system of farming, and to assist the tenants to meet the demands of the future, the estate was sold to the Ministry of Agriculture by the sixth Earl Manvers in February 1952. The Society joins with the tenants themselves in opposing the proposed sale and to this end passed the following resolution at its Winter Conference on 1 December 1979: 'The British Agricultural History Society views the proposed sale of Laxton with the gravest concern. The village and its open field system are a unique element of our historical heritage and must not be sacrificed for short-term economies. While welcoming Her Majesty's Government's assurances on the conditions of sale as a step in the right direction, it reaffirms its belief that the only sure means to preserve this vital element of Britain's heritage is to maintain its owner- ship in the hands of the nation.' Copies of this resolution were sent to the Minister of Agriculture, the relevant opposition spokesmen, and to the Press.
(continued on page 30)
?