A Global Measure of Perceived Stress - Semantic …...The PSS showed adequate reliability and, as...
13
A Global Measure of Perceived Stress Author(s): Sheldon Cohen, Tom Kamarck and Robin Mermelstein Reviewed work(s): Source: Journal of Health and Social Behavior, Vol. 24, No. 4 (Dec., 1983), pp. 385-396 Published by: American Sociological Association Stable URL: http://www.jstor.org/stable/2136404 . Accessed: 24/10/2012 13:12 Your use of the JSTOR archive indicates your acceptance of the Terms & Conditions of Use, available at . http://www.jstor.org/page/info/about/policies/terms.jsp . JSTOR is a not-for-profit service that helps scholars, researchers, and students discover, use, and build upon a wide range of content in a trusted digital archive. We use information technology and tools to increase productivity and facilitate new forms of scholarship. For more information about JSTOR, please contact [email protected]. . American Sociological Association is collaborating with JSTOR to digitize, preserve and extend access to Journal of Health and Social Behavior. http://www.jstor.org
Transcript of A Global Measure of Perceived Stress - Semantic …...The PSS showed adequate reliability and, as...
A Global Measure of Perceived StressAuthor(s): Sheldon Cohen, Tom Kamarck and Robin MermelsteinReviewed work(s):Source: Journal of Health and Social Behavior, Vol. 24, No. 4 (Dec., 1983), pp. 385-396Published by: American Sociological AssociationStable URL: http://www.jstor.org/stable/2136404 .Accessed: 24/10/2012 13:12
Your use of the JSTOR archive indicates your acceptance of the Terms & Conditions of Use, available at .http://www.jstor.org/page/info/about/policies/terms.jsp
.JSTOR is a not-for-profit service that helps scholars, researchers, and students discover, use, and build upon a wide range ofcontent in a trusted digital archive. We use information technology and tools to increase productivity and facilitate new formsof scholarship. For more information about JSTOR, please contact [email protected].
.
American Sociological Association is collaborating with JSTOR to digitize, preserve and extend access toJournal of Health and Social Behavior.
http://www.jstor.org

A GLOBAL MEASURE OF PERCEIVED STRESS 385
Richardson, Jean, and Julie Solis 1982 "Place of death of Hispanic cancer patients
in Los Angeles County." Unpublished manuscript.
Stoddard, Sandol 1978 The Hospice Movement. Briarcliff Manor,
New York: Stein and Publishers. Valle, R., and L. Mendoza
1978 The Elder Latino. San Diego, CA: Cam- panile Press.
Wiggins, Jerry S. 1973 Personality and Prediction: Principles of
Personality Assessment. Reading, MA: Addison-Wesley Publishing Co.
Wilder Foundation 1981 Care for the Dying: A Study of the Need for
Hospice in Ramsey County, Minnesota. A report to the Northwest Area Foundation from the Amherst H. Wilder Foundation, 355 Washington St., St. Paul, MN.
A Global Measure of Perceived Stress
SHELDON COHEN Carnegie-Mellon University
TOM KAMARCK University of Oregon
ROBIN MERMELSTEIN University of Oregon
Journal of Health and Social Behavior 1983, Vol. 24 (December):385-396
This paper presents evidence from three samples, two of college students and one of partici- pants in a community smoking-cessation program, for the reliability and validity of a 14-item instrument, the Perceived Stress Scale (PSS), designed to measure the degree to which situations in one's life are appraised as stressful. The PSS showed adequate reliability and, as predicted, was correlated with life-event scores, depressive and physical symptomatology, utilization of health services, social anxiety, and smoking-reduction maintenance. In all com- parisons, the PSS was a better predictor of the outcome in question than were life-event scores. When compared to a depressive symptomatology scale, the PSS was found to measure a different and independently predictive construct. Additional data indicate adequate reliability and validity of a four-item version of the PSS for telephone interviews. The PSS is suggested for examining the role of nonspecific appraised stress in the etiology of disease and behavioral disorders and as an outcome measure of experienced levels of stress.
It is a common assumption among health researchers that the impact of "objectively" stressful events is, to some degree, determined
Research reported in this paper was supported by grants from the National Science Foundation (BNS 7923453) and the Heart, Lung and Blood Institute (HL 29547). The authors are indebted to Edward Lichtenstein and Karen McIntyre for their collab- oration on the smoking cessation project; the staff of University of Oregon dormitory housing for their cooperation in securing Student Sample I; Pam Birell for her cooperation in obtaining class participants for Sample II; and to Susan Fiske, Lew Goldberg, Ed- ward Lichtenstein, Karen Matthews, Michael Scheier, and Tom Wills for comments on earlier drafts of this manuscript.
Address communications to: Sheldon Cohen, De- partment of Psychology, Carnegie-Mellon Univer- sity, Pittsburgh, PA 15206.
-by one's perceptions of their stressfulness, e.g., see Lazarus (1966, 1977). Surprisingly, this theoretical perspective has not been ac- companied by development of psychometri- cally valid measures of perceived stress. This article discusses the limitations of objective and subjective measures of stress used in the assessment of both global and event-specific stress levels. It argues that a psychometrically sound global measure of perceived stress could provide valuable additional information about the relationship between stress and pathology. Data are presented on the psychometric properties of the Perceived Stress Scale (PSS), an instrument developed in response to these issues. The PSS measures the degree to which situations in one's life are appraised as stressful.
386 JOURNAL OF HEALTH AND SOCIAL BEHAVIOR
Research on the role of psychosocial and environmental stressors as risk factors in both physical and psychological illness has typically employed relatively objective stressor mea- sures. This work includes studies of the effects of specific stressful events, such as unem- ployment (Cobb and Kasl, 1977; Dooley and Catalano, 1980; Gore, 1978), bereavement (Stroebe et al., 1982), and exposure to intense levels of noise (Cohen and Weinstein, 1981) and high levels of population density (Sundstrom, 1978). In addition, there is an abundant literature on the cumulative effect of objective stressful life events (Dohrenwend and Dohrenwend, 1974, 1981). In these studies, various versions of life-event scales (original scale developed by Holmes and Rahe, 1967) are used to produce a cumulative stress score. These scores are usually based on either the number of events that have occurred within the specified temporal framework (in most cases, six to 12 months) or on a sum of event weights that are based on judges' ratings of the diffi- culty of adjusting to these events.
There are some clear advantages to objective measures of stressful events. First, such mea- sures permit an estimate of the increased risk for disease associated with the occurrence of easily identifiable events. Second, the mea- surement procedure is often simple, e.g., did this event occur during the last six months?, and in many cases, persons experiencing a particular event can be identified without the necessity of asking them about the occurrence of the event, e.g., persons living in noise- impacted communities. Third, these measure- ment techniques minimize the chance of vari- ous subjective biases in the perceptions and reporting of events.
On the other hand, the use of objective mea- sures of stress implies that events are, in and of themselves, the precipitating cause of pathol- ogy and illness behavior. This implication is counter to the view that persons actively inter- act with their environments, appraising poten- tially threatening or challenging events in the light of available coping resources (Lazarus, 1966, 1977). From this latter perspective, stressor effects are assumed to occur only when both (a) the situation is appraised as threatening or otherwise demanding and (b) in- sufficient resources are available to cope with the situation. The argument is that the causal
"event" is the cognitively mediated emotional response to the objective event, not the objec- tive event itself (Lazarus, 1977; Mason, 1971). An important part of this view is that this re- sponse is not based solely on the intensity or any other inherent quality of the event, but rather is dependent on personal and contextual factors as well.
The assumed centrality of the cognitive ap- praisal process suggests the desirability of measuring perceived stress as opposed or in addition to objective stress. For example, comparison of the predictive validities of ob- jective and subjective measures could help to clarify the role of the appraisal process in the relationship between objective stressors and illness. Perceived stress scales could also be used in conjunction with objective scales in an effort to determine whether factors such as social support (Pearlin et al., 1981), hardiness (Kobasa, 1979), and locus of control (Johnson and Sarason, 1979) protect people from the pathogenic effects of stressful events by alter- ing stressor appraisal or by altering the process or processes by which appraised stress results in physiological or behavioral disorders (Gore, 1981). Finally, perceived stress can be viewed as an outcome variable-measuring the experi- enced level of stress as a function of objective stressful events, coping processes, personality factors, etc.
Previous work has employed a number of approaches to assess both global and event- specific levels of perceived stress. For exam- ple, several investigators have modified life- event scales in an attempt to measure global perceived stress. The modification involved asking respondents to rate the stressfulness or impact of each experienced event. In general, life-stress scores based on self-ratings of event stressfulness are better predictors of health- related outcomes than are scores derived from either a simple counting of events (unit- weighting) or normative adjustment ratings (Sarason et al., 1978; Vinokur and Selzer, 1975). However, the increases in predictability provided by these ratings are small. It is noteworthy that any increase in predictability of a weighted event score over a simple count of events is likely to be small since alternative weighting schemes yield composite scores that are substantially correlated with the event count (Lei and Skinner, 1980). In short, cal-
A GLOBAL MEASURE OF PERCEIVED STRESS 387
culating global perceived stress levels on the basis of reactions to individual events assumes that perceived stress levels are very highly cor- related with the number of reported events. Other weaknesses of global perceived stress scales that are based on a specific list of events include an insensitivity to chronic stress from ongoing life circumstances, to stress from events occurring in the lives of close friends and family, from expectations concerning fu- ture events, and from events not listed on the scale.
Subjective measures of response to specific stressors have also been widely used, e.g., measures of perceived occupational stress (Kahn et al., 1964). There are, however, some practical and, theoretical limitations of mea- sures of specific stressors. Practically, it is dif- ficult and time-consuming to adequately de- velop and psychometrically validate an indi- vidual measure every time a new stressor is studied. Theoretically, there is an issue of whether measures of perceived response to a specific stressor really assess a person's evalu- ations of that stressor. There is, in fact, evi- dence that people often misattribute their feelings of stress to a particular source when that stress is actually due to another source (Gochman, 1979; Keating, 1979; Worchel, 1978; Worchel and Teddlie, 1976). Another problem with measures of response to specific stressors is that such measures imply the inde- pendence of that event in the precipitation of disease. However, it is likely that the illness process is affected by a person's global stress level, not just by his/her response to a particu- lar event.
The above discussion indicates the de- sirability of developing an instrument to mea- sure a global level of perceived stress. This article presents data on the Perceived Stress Scale, a 14-item measure of the degree to which situations in one's life are appraised as stressful. PSS items were designed to tap the degree to which respondents found their lives unpredictable, uncontrollable, and overload- ing. These three issues have been repeatedly found to be central components of the experi- ence of stress (Averill, 1973; Cohen, 1978; Glass and Singer, 1972; Lazarus, 1966, 1977; Seligman, 1975). The scale also includes a number of direct queries about current levels of experienced stress. The PSS is an econom-
ical scale that can be administered in only a few minutes and is easy to score. Because levels of appraised stress should be influenced by daily hassles, major events, and changes in coping resources, the predictive validity of the PSS is expected to fall off rapidly after four to eight weeks.
Evidence is presented from three samples-two of college students and one of a more heterogeneous community group-for the concurrent and predictive validities and the internal and test-retest reliabilities of the new scale. The paper also examines the relative predictive validity of the PSS and two life- event instruments. Our premise is that the PSS should provide a better predictor of health out- comes than does a global measure of objective stressors, such as life-event scales. This should occur because a perceived stress instrument provides a more direct measure of the level of stress experienced by the respondent. Presum- ably, it is this level of appraised stress, not the objective occurrence of the events, that deter- mines one's response to a stressor(s) (Lazarus, 1966, 1977). Also, the new measure is more global than life-event scales. That is, it is sen- sitive to chronic stress deriving from ongoing life circumstances, to stress from expectations concerning future events, to stress from events not listed on a particular life-events scale, and to reactions to the specific events included on any scale.
METHODS
Validation data were collected in three sam- ples - two consisting of college students and one consisting of a more heterogeneous group enrolled in a smoking-cessation program. The samples and assessment procedures are de- scribed below.
Perceived Stress Scale (PSS)
The 14 items of the PSS are presented in Appendix A. PSS scores are obtained by re- versing the scores on the seven positive items, e.g., 0=4, 1=3, 2=2, etc., and then summing across all 14 items. Items 4, 5, 6, 7, 9, 10, and 13 are the positively stated items. The PSS was designed for use with commu-
nity samples with at least a junior high school
388 JOURNAL OF HEALTH AND SOCIAL BEHAVIOR
education. The items are easy to understand and the response alternatives are simple to grasp. Moreover, as noted above, the ques- tions are quite general in nature and hence relatively free of content specific to any sub- population group.
The data reported in this article are from somewhat restricted samples, in that they are younger, more educated, and contain fewer minority members than the general population. In light of the generality of scale content and simplicity of language and response alterna- tives, we feel that data from representative samples of the general population would not differ significantly from those reported below.
College Student Sample I
The respondents were 332 (121 male, 209 female, two with sex not specified) freshman college students living in dormitories at the University of Oregon. The mean age of the sample was 19.01 with a standard deviation of 2.75. All respondents gave written consent allowing access to their student health center records.
Measures. Respondents completed five scales: one measured life events; another so- cial anxiety; a third depressive symp- tomatology, fourth, physical symptomatology; and finally perceived stress (the PSS). All in- struments were completed during a one and one-half hour session.
A modified version of the College Student Life-Event Scale (CSLES) was used as a mea- sure of stressful life events; the original scale was developed by Levine and Perkins (1980). This scale is composed of 99 items that repre- sent events that fall into 14 different categories characterizing the adjustment demands of col- lege students, e.g., academic affairs, male- female relationships, and family matters. Nine items dealing with health-related issues were not used in calculating life-stress scores be- cause of the possibility that these items were measuring the same thing as items in the symptom checklists. Analyses including the unused items indicated that their exclusion did not affect the results reported below.
-
Respondents were asked to indicate whether each event had occurred during the last year. They were asked to rate the impact of events
that had occurred on a scale ranging from -3 (extremely negative) to +3 (extremely posi- tive), the format used by Sarason et al. (1978). Separate scores were generated based on self- rated impact and unweighted events. The un- weighted score was the total number of life events checked. The score based on impact ratings was the summed impact of checked events. The impact score is not a pure measure of the occurrence of objective events, but rather takes into account the respondents' per- ceptions of the events.
The Center for Epidemiologic Studies De- pression Scale (CES-D) was employed as a measure of current level of depressive symp- tomatology (Radloff, 1977). Twenty items, each representing a state characteristic or not characteristic of a depressed person, are rated on a four-point scale to indicate the frequency of their occurrence during the last week. Re- sponse options range from "rarely or none of the time" to "most or all of the time."
Physical symptomatology was measured by the Cohen-Hoberman Inventory of Physical Symptoms (CHIPS). The CHIPS is a list of 39 common physical symptoms (Cohen and Hoberman, 1983). Items were carefully selected to exclude symptoms of an obviously psychological nature, e.g., felt nervous or de- pressed. The scale, however, is primarily made up of symptoms, such as headache, back ache, acid stomach, that have been traditionally viewed as psychosomatic. Each item is rated for the degree to which that problem bothered or distressed the individual during the past two weeks. Items are rated on five-point scale from "not at all" to "extremely." The CHIPS has been found to have adequate reliability and to predict use of student health services in the seven-week period following completion of the scale (r = .29 and .22 in independent samples).
The Social Avoidance and Distress Scale (SADS) was used to measure social anxiety (Watson and Friend, 1969). This 28-item true-false scale taps both the desire to avoid others (social avoidance) and the experience of distress in social interactions (social distress).
Utilization of the student health center was also monitored. All university students are re- quired to pay a fee that provides for outpatient medical care. The physicians at the student health center routinely fill out a standardized form describing the problem(s) for which the
A GLOBAL MEASURE OF PERCEIVED STRESS 389
student was treated at each visit. The form is based on the International Classification of Diseases, 9th Revision (Commission on Profes- sional and Hospital Activities, 1980) and allows each visit to be classified as illness-related (codes 001-779), injury- and poisoning-related (codes 800-999), or "other" (V codes), e.g., receive prophylactic vaccination.
For each student, the number of visits in each of the three categories was recorded. Up to three symptoms or problems could be checked for any individual visit. If the prob- lems were all in the same category, only one visit was recorded for that category. If the problems were in different categories, a sepa- rate visit was recorded for each of the pertinent categories. When total visits (collapsing over categories) were calculated, each visit was counted as one, irrespective of whether there was a single problem or a number of problems in different categories. Both the number of ill- ness visits and the number of total visits are analyzed in this report.
The number of visits was calculated for each of two independent time blocks: the 44 days preceding the testing session and the 46 days following the testing session. The initial 44-day period was used as an indicator of the base-rate of visits.
College Student Sample II
Respondents in the second sample were 114 members of a class in introductory personality psychology (53 females, 60 males, and one with sex not specified) who received class credit for participating in the study. The mean age of the sample was 20.75 with a standard deviation of 4.41. These students completed the same five questionnaires as those in the previous study during a one and one-half hour session during the second week of the Spring Quarter. For this sample, the data on health services utiliza- tion were divided into the 90 days preceding the testing session and the 46 days following the testing session. The 90-day period was used as an indicator of the base-rate of visits.
Smoking-Cessation Sample
Subjects. Subjects were 27 males and 37 fe- males participating in a smoking-cessation pro- gram run by the University of Oregon Smok-
ing-Control Program. Participants were solic- ited through newspaper, television, and radio advertisements. To qualify for participation in the program, subjects either had to be married or living with a partner. The mean age of the subjects was 38.4 years (s = 11.57). Thirty- seven percent of the sample made over $25,000 per year, and 74 percent had formal education beyond high school. They had been smoking for an average of 20.9 years (s = 11.82). Only three of the participants were students; all of these were graduate students, 25 to 31 years old. The mean self-monitored baseline smoking rate was 25.6 cigarets a day.
Treatment. Treatment groups met for six consecutive weekly sessions lasting approx- imately two hours each. The target quitting date occurred on the fourth session. Interven- tion strategies included behavioral self- management techniques, nicotine-fading, and a cognitive-behavioral relapse prevention pro- gram. Overall, 64 percent (N = 41) of the sub- jects were abstinent at the end of treatment.
Measures. During a pretreatment testing session, subjects completed a life-event scale, a physical-symptom checklist (CHIPS), and the PSS. The life-event scale consisted of 71 normatively negative events chosen from the Unpleasant Events Schedule (Lewinsohn and Talkington, 1979). This scale replaced the one used with student samples because it provided an item pool appropriate to the community population. Subjects identify the events that have happened to them in the last six months and rate the impact of each event on a seven- point scale, ranging from extremely negative to extremely positive. As in the college student samples, both the number of events and the event-impact scores were analyzed.
Subjects completed the PSS and the CHIPS prior to the first treatment session and at the end of the six-week treatment. Both tests were administered in the same manner as with the college student samples, except that with the group of smokers, a one-week time frame was used for the CHIPS.
RESULTS
Means, Variance and Reliability Estimates
Mean scores on the PSS for the complete samples (males and females combined) were

390 JOURNAL OF HEALTH AND SOCIAL BEHAVIOR
23.18 and 23.67 in the student samples and 25.0 in the smoking-cessation sample. Standard de- viations were 7.31, 7.79, and 8.00, and ranges were 6 to 50, 5 to 44, and 7 to 47. Mean PSS scores for females were 23.57 and 25.71 in the student samples and 25.6 in the community sample. Standard deviations were 7.55, 6.20, and 8.24. Mean PSS scores for males were 22.38 and 21.73 in the student samples and 24.0 in the community sample. Standard deviations were 6.79, 8.42, and 7.80, respectively. Al- though the mean PSS score for females was slightly higher than the mean score for males in all three samples, this difference did not ap- proach statistical significance in any sample.
Age was unrelated to PSS in all three sam- ples. Since the age distribution in the college student samples was severely skewed, a cor- relation between the PSS and age was unlikely. The correlations between age and PSS were .04 and -.08 in the college samples and -.02 in the smoking-cessation sample.
Coefficient alpha reliability for the PSS was .84, .85, and .86 in each of the three samples. For a state measure, test-retest correlations should be much higher for short retest intervals than for longer ones. For the PSS, two inter- vals are available, two days and six weeks. The PSS was administered, on two occasions sepa- rated by two days, to 82 college students en- rolled in courses at the University of Oregon; when responding to the retest, the subjects were asked to strive for accuracy rather than for consistency across time. The test-retest correlation in this sample was .85, whereas the correlation was only .55 for the 64 subjects in the smoking study who were retested after six weeks.
Evidence for Concurrent and Predictive Validity
Separate correlations between the PSS and the validity criteria were calculated for males
and females in each sample. The relative mag- nitudes of the correlations for males and fe- males with each of the criteria were compared by transforming the correlations to z scores (Fisher's transformation) and dividing the dif- ference between the z scores by the standard error of the difference between the z coeffi- cients (cf. Guilford, 1965). None of the result- ing z scores were significantly different from 0 at the p < .05 level. Since there were no dif- ferences between males and females, only data for the entire sample are reported below.
Separate correlations between the PSS and validity criteria were also calculated for those below and above median age in the smoking cessation sample. These analyses seemed un- ncessary in the student samples, since 98 per- cent of the students were between 16 and 25 years old. The 31 persons in the "young" community group ranged from 22 to 35. The 33 persons in the "old" group ranged from 36 to 70. Correlations for young and old were com- pared with the same procedure described in the foregoing. Only one of these comparisons indi- cated a statistically significant difference at the p < .05 - actually p < .01 - level. Data on this comparison are presented in the appropri- ate section in the following and addressed in the discussion section.
Correlations between PSS and Life-Event Scores. Since perceived stress should gener- ally increase with increases in objective cumulative stress levels, the PSS should be related to the number of life events. Moreover, these correlations should be higher when the life-event scores are based on the self-rated impact of the events, since impact scores re- flect some of the same stressor appraisal mea- sured by the PSS. As apparent from Table 1, there is a small to moderate correlation be- tween number of life events and the PSS in all three samples. Moreover, in all but one case, that correlation increases when the scale score takes into account the respondent's perception
TABLE 1. Correlations between Life-Event Scores and PSS
Smoking-Cessation Study College Student College Student Beginning of End of
Sample I Sample II Treatment Treatment Number of Life Events .20* .17 .38* .39* Impact of Life Events .35* .24* .49* .33*
*p<.Ol.
A GLOBAL MEASURE OF PERCEIVED STRESS 391
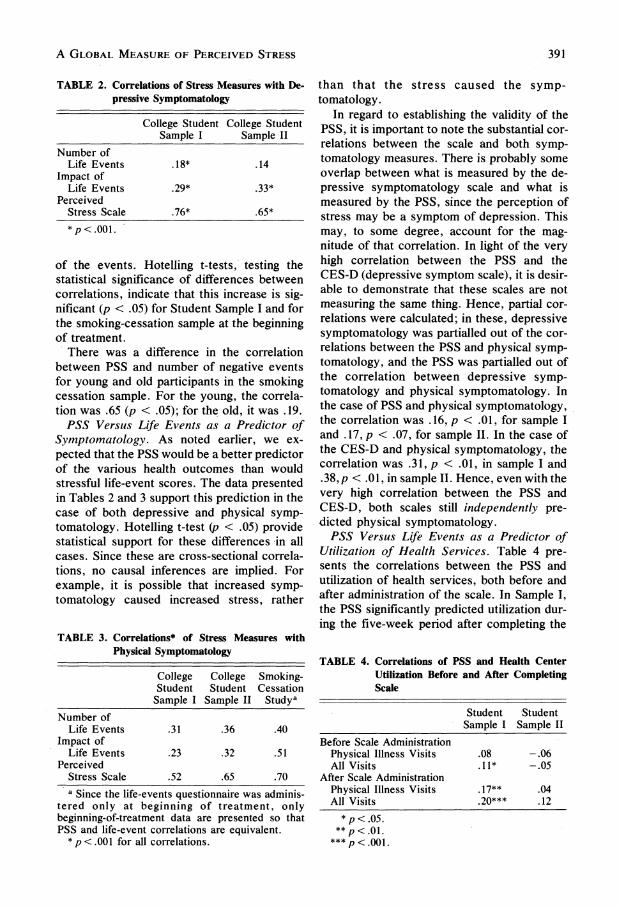
TABLE 2. Correlations of Stress Measures with De- pressive Symptomatology
College Student College Student Sample I Sample II
Number of Life Events .18* .14
Impact of Life Events .29* .33*
Perceived Stress Scale .76* .65* *p<.001.
of the events. Hotelling t-tests, testing the statistical significance of differences between correlations, indicate that this increase is sig- nificant (p < .05) for Student Sample I and for the smoking-cessation sample at the beginning of treatment.
There was a difference in the correlation between PSS and number of negative events for young and old participants in the smoking cessation sample. For the young, the correla- tion was .65 (p < .05); for the old, it was .19.
PSS Versus Life Events as a Predictor of Symptomatology. As noted earlier, we ex- pected that the PSS would be a better predictor of the various health outcomes than would stressful life-event scores. The data presented in Tables 2 and 3 support this prediction in the case of both depressive and physical symp- tomatology. Hotelling t-test (p < .05) provide statistical support for these differences in all cases. Since these are cross-sectional correla- tions, no causal inferences are implied. For example, it is possible that increased symp- tomatology caused increased stress, rather
TABLE 3. Correlations* of Stress Measures with Physical Symptomatology
College College Smoking- Student Student Cessation Sample I Sample II Studya
Number of Life Events .31 .36 .40
Impact of Life Events .23 .32 .51
Perceived Stress Scale .52 .65 .70 a Since the life-events questionnaire was adminis-
tered only at beginning of treatment, only beginning-of-treatment data are presented so that PSS and life-event correlations are equivalent.
* p <.001 for all correlations.
than that the stress caused the symp- tomatology.
In regard to establishing the validity of the PSS, it is important to note the substantial cor- relations between the scale and both symp- tomatology measures. There is probably some overlap between what is measured by the de- pressive symptomatology scale and what is measured by the PSS, since the perception of stress may be a symptom of depression. This may, to some degree, account for the mag- nitude of that correlation. In light of the very high correlation between the PSS and the CES-D (depressive symptom scale), it is desir- able to demonstrate that these scales are not measuring the same thing. Hence, partial cor- relations were calculated; in these, depressive symptomatology was partialled out of the cor- relations between the PSS and physical symp- tomatology, and the PSS was partialled out of the correlation between depressive symp- tomatology and physical symptomatology. In the case of PSS and physical symptomatology, the correlation was .16, p < .01, for sample I and .17, p < .07, for sample II. In the case of the CES-D and physical symptomatology, the correlation was .31, p < .01, in sample I and .38, p < .01, in sample II. Hence, even with the very high correlation between the PSS and CES-D, both scales still independently pre- dicted physical symptomatology.
PSS Versus Life Events as a Predictor of Utilization of Health Services. Table 4 pre- sents the correlations between the PSS and utilization of health services, both before and after administration of the scale. In Sample I, the PSS significantly predicted utilization dur- ing the five-week period after completing the
TABLE 4. Correlations of PSS and Health Center Utilization Before and After Completing Scale
Student Student Sample I Sample II
Before Scale Administration Physical Illness Visits .08 -.06 All Visits .11* -.05
After Scale Administration Physical Illness Visits .17** .04 All Visits .20*** .12
*p<.05. **p<.0l.
***p <.001.

392 JOURNAL OF HEALTH AND SOCIAL BEHAVIOR
scale. In Sample II, there was a nonsignificant correlation between the PSS and all visits after administration of the scale. Correlation be- tween the PSS and physical illness visits after administration of the scale, with before-ad- ministration visits partialled out, was .15, p < .007, for Sample I and -.02 for Sample II. Similar partial correlation for the PSS and all visits after administration, with all preadmin- istration visits partialled out, was .16, p < .01, for Sample I and .13 for Sample II. These cor- relations suggest that the PSS is predictive of changes in health center utilization. Correla- tions of life-event scores with utilization were not significant in both samples for both physi- cal illness and all visits; these correlations ranged from -.04 to +.03.
PSS Versus Life Events as a Predictor of Social Anxiety. Levels of perceived stress in college students, especially freshmen, should be related to their ability to become integrated into the university community. We would ex- pect that the poorer the integration, the greater the perceived stress. The social anxiety scale provides a trait measure that presumably taps difficulty in making friends and social contacts, i.e., the ability to integrate into the community.
In both student samples, increases in social anxiety were associated with increases in per- ceived stress (.37 and .48, p < .001 for both). Although number of life events was unrelated to social anxiety in both samples, there were small correlations between event impact and social anxiety (-.13, p < .02, -.26, p < .01). Again, these are cross-sectional data and no causal inferences are implied.
PSS and Smoking-Reduction Maintenance: The Four-Item Scale. To examine the role of the PSS as a predictor of maintenance of smoking-rate reduction, perceived stress level was also assessed one and three months fol- lowing treatment. Since posttreatment data were collected by telephone interview, a short version of the scale, consisting of the four items (numbers 2, 6, 7, and 14) that were cor- related most highly with the 14-item scale, was employed. The mean score on the four-item scale was 5.6 at one month and 5.9 at three months. Standard deviations were 3.6 and 4.0, and the scores ranged from 0 to 15 and 0 to 14. Mean PSS scores for males were 4.8 at one month and 5.9 at three, while mean scores for females were 6.2 and 5.9, respectively. The
coefficient alpha reliability estimate for the four-item PSS was .72. The test-retest reliabil- ity of the four-item scale over a two-month interval was .55.
The four-item scale at one month was corre- lated (.3 1, p < .01) with the average number of cigarettes smoked per day at one month; the latter information was from a self-report con- firmed with a carbon monoxide measure. Similarly, the four-item scale at three months was correlated (.37, p < .001) with smoking rate at three months. Finally, the short PSS scale at one month after treatment predicted smoking rate three months after treatment (.39, p < .001). In all cases, the greater the PSS score, the more cigarettes smoked. A number of partial correlations were calculated to clarify the nature of the relationship between the abridged version of the PSS and smoking rate. In the first partial correlation, the end-of- treatment PSS score and smoking rate were partialled out of the correlation between the four-item PSS and smoking rate at one month following treatment. The partial correlation was .29, p < .01. In the second correlation, the four-item PSS and smoking rate at one month following treatment were partialled out of the correlation between the four-item scale and smoking rate at three months. The partial cor- relation was .34, p < .01. These analyses indi- cate that changes-in perceived stress as mea- sured by the PSS are predictive of changes in smoking rate. Another partial correlation indi- cated that the abridged PSS predicted changes in smoking rate over a two-month period. Spe- cifically, a correlation of .26 (p < .05) was found when smoking rate at the one-month follow-up was partialled out of the correlation between the four-item PSS at one month and smoking rate at three months. These data sug- gest that the four-item scale provides a useful measure of perceived stress for use in tele- phone interviews and other situations where a very short scale is required.
DISCUSSION
The PSS has adequate internal and test- retest reliability and is correlated in the ex- pected manner with a range of self-report and behavioral criteria. Moreover, the PSS is more closely related to a life-event impact score,

A GLOBAL MEASURE OF PERCEIVED STRESS 393
which is to some degree based on the respon- dent's appraisal of the event, than to the more objective measure of the number of events oc- curring within a particular timespan. The PSS also proved to be a better predictor of health and health-related outcomes than either of the two life-event scales. Finally, the PSS, al- though highly correlated with depressive symptomatology, was found to measure a dif- ferent and independently predictive construct.
It is noteworthy that the level of correlation between the life-event scales and the symp- tomatological outcomes (.18 to .36 range) is equivalent to,'if not better than, similar corre- lations reported in the literature (cf. Rabkin and Struening, 1976; Tausig, 1982). Hence, the superior predictability of the PSS is not attrib- utable to psychometric weaknesses in the life- event scales that were employed or to idiosyn- cratic aspects of the samples under study. Moreover, from an absolute perspective, the PSS correlations with symptomatological mea- sures are quite high (.52 to .76). However, in the case of depressive symptomatology, the correlation may be somewhat inflated by the overlap in the operational definitions of per- ceived stress and of depressive symp- tomatology (cf. Dohrenwend et al., 1978; Gore, 1981).
In general, the relationships between PSS and the validity criteria were unaffected by sex or age. The one exception was the strong re- lationship between the PSS and number of life events for the young and the lack of such a relationship for the old. These data may reflect a difference in the role of life events in deter- mining stress levels for these two age groups. That is, other chronic stressors, expectations, etc. may be more important for the older re- spondents.
The PSS differs from life-event scales in a number of ways. First, the PSS asks about a shorter period, one month as opposed to the usual six to 12 months covered by typical life- event scales.1 It is worth noting that with a subjective scale, the shorter period should be sufficient since perceived stress during the last month should reflect any objective events that are still affecting respondents' stress levels.
A second difference between the PSS and a life-event scale is the period of time after ad- ministration that the scale provides predictions of health-related outcomes. Presumably, life-
event scales will be predictive over fairly long periods, such as several months to several years.2 We have examined the predictive ability of the PSS over four to 12 week periods after administration. These data suggest that the best predictions occur within a one- or two-month period. It is our feeling that as this period is lengthened, the predictive validity of the scale will fall. After all, perceived levels of stress should be influenced by daily hassles, major-events, and changes in the availability of coping resources, all of which are quite vari- able over a short period. In fact, test-retest reliability analyses indicate that test-retests in- volving a very short time (two days) result in fairly substantial correlations, whereas admin- istrations six weeks later produce more moder- ate test-retest correlations.
As mentioned earlier, the PSS can be used to determine whether "appraised" stress is an etiological (or risk) factor in behavioral dis- orders or disease. It can also be used to look more closely at the process by which various moderators of the objective stressor/pathology relationship operate. For example, we could determine whether social support protects one from the pathogenic effects of stressful events by altering the appraisal of those events or by altering the process by which appraised stress causes an illness outcome. This second kind of analysis, however, is limited to the degree that the PSS reflects responses to events outside of those measured by the objective event instru- ment. That is, it is limited to the degree that it is more global than the objective stressor mea- sure. Finally, the PSS can be used as an out- come variable, measuring people's experi- enced levels of stress as a function of objective stressful events, coping resources, personality factors, etc.
The four-item version of the PSS provides a useful tool when data must be collected over the phone. This scale makes repeated mea- sures of perceived stress in large samples feasible. It should be noted, however, that be- cause of the limited number of items, the abridged scale suffers in internal reliability and thus provides a less adequate approximation of perceived stress levels than the entire scale.
Although not tested in this study, the PSS may also provide an economical tool for as- sessing chronic stress level. Either the abridged version of the PSS or the complete
394 JOURNAL OF HEALTH AND SOCIAL BEHAVIOR
14-item scale could be used. Monthly adminis- trations of the scale could be summed or aver- aged, providing a reliable, i.e., based on more samples, measure of chronic stress, as well as a predictor that represents a longer term than the one-month period covered by the scale.
Two commonly used measures of nonspecific psychological distress, the nine- scale, 54-item PERI Demoralization Measure (Dohrenwend et al., 1980) and the 28-item General Health Questionnaire (Goldberg, 1972), include a number of items that are simi- lar to those in the PSS. These scales, however, are much broader in scope. They are designed as epidemiological measures of symp- tomatology, and both include a broad range of items tapping common psychiatric symptoms, such as hostility, diminished self-esteem, de- pression, and anxiety, as well as psychoso- matic complaints. Although appraised stress may be symptomatic of psychological disorder when viewed in combination with elevated scores on other psychiatric symptoms, it is our contention that the perception of stress itself, as assessed by the PSS, is not a measure of psychological symptomatology. This conten- tion is, in fact, supported by the data indicating
independent predictive validities of the PSS and a depressive symptomatology scale. Hence, the PSS can be viewed as assessing a state that places people at risk of, i.e., is an- tecedent to, clinical psychiatric disorder even though that state is also part of a diverse set of feelings and states that are characteristic of disorder.
In sum, the PSS is a brief and easy-to- administer measure of the degree to which situations in one's life are appraised as stress- ful. It has been proven to possess substantial reliability and validity; thus, it provides a potential tool for examining issues about the role of appraised stress levels in the etiology of disease and behavioral disorders.
NOTES
1. There are two recently developed life-event scales that assess events over a one-month pe- riod, the Hassle Scale (Kanner et al., 1981) and the Unpleasant Events Scale (Lewinsohn and Talkington, 1979).
2. Pearlin et al. (1981) have pointed out that there is no single time frame that is optional for observ- ing the effects of diverse life events. However, existing works, including the Pearlin et al. study, examine rather long periods.
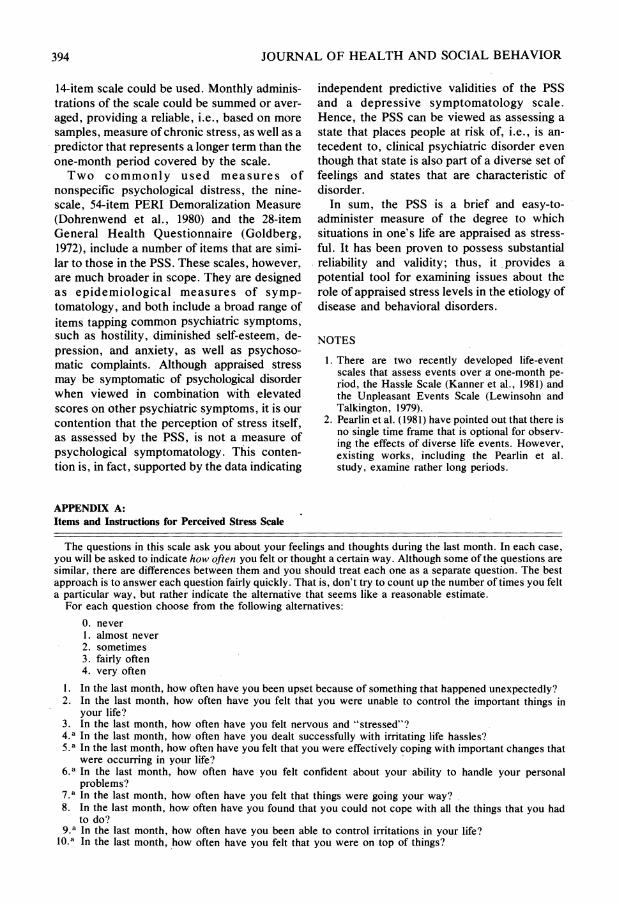
APPENDIX A: Items and Instructions for Perceived Stress Scale
The questions in this scale ask you about your feelings and thoughts during the last month. In each case, you will be asked to indicate how often you felt or thought a certain way. Although some of the questions are similar, there are differences between them and you should treat each one as a separate question. The best approach is to answer each question fairly quickly. That is, don't try to count up the number of times you felt a particular way, but rather indicate the alternative that seems like a reasonable estimate.
For each question choose from the following alternatives: 0. never 1. almost never 2. sometimes 3. fairly often 4. very often
1. In the last month, how often have you been upset because of something that happened unexpectedly? 2. In the last month, how often have you felt that you were unable to control the important things in
your life? 3. In the last month, how often have you felt nervous and "stressed"? 4*a In the last month, how often have you dealt successfully with irritating life hassles? 5.a In the last month, how often have you felt that you were effectively coping with important changes that
were occurring in your life? 6.a In the last month, how often have you felt confident about your ability to handle your personal
problems? 7.a In the last month, how often have you felt that things were going your way? 8. In the last month, how often have you found that you could not cope with all the things that you had
to do? 9.a In the last month, how often have you been able to control irritations in your life?
10.a In the last month, how often have you felt that you were on top of things?
A GLOBAL MEASURE OF PERCEIVED STRESS 395
APPENDIX A (Continued)
11. In the last month, how often have you been angered because of things that happened that were outside of your control?
12. In the last month, how often have you found yourself thinking about things that you have to accomplish? 13. aIn the last month, how often have you been able to control the way you spend your time? 14. In the last month, how often have you felt difficulties were piling up so high that you could not overcome
them? a Scored in the reverse direction.
REFERENCES
Averill, J. R. 1973 "Personal control over aversive stimuli and
its relationship to stress." Psychological Bulletin 80:286-303.
Cobb, Sidney, and Stanley V. Kasl 1977 Termination: The Consequences of Job
Loss. Report No. 76-1261. Cincinnati, OH: National Institute for Occupational Safety and Health, Behavioral and Motivational Factors Research.
Cohen, S. 1978 "Environmental load and the allocation of
attention." Pp. 1-29 in Andrew Baum, Jerome E. Singer, and Stuart Valins (eds.), Advances in Environmental Psychology, Vol. 1. Hillsdale, NJ: Erlbaum.
Cohen, S., and H. Hoberman 1983 "Positive events and social supports as
buffers of life change stress." Journal of Applied Social Psychology 13:99-125.
Cohen, S., and N. Weinstein 1981 "Nonauditory effects of noise on behavior
and health." Journal of Social Issues 37:36-70.
Commission on Professional and Hospital Activities 1980 International Classification of Diseases, 9th
rev., Clinical Modification ICD.9.CM, Vol. 1. Ann Arbor, MI: Commission on Profes- sional and Hospital Activities.
Dohrenwend, Barbara S., and Bruce P. Dohren- wend (eds.)
1974 Stressful Life Events: Their Nature and Ef- fects. New York: Wiley.
1981 Stressful Life Events and Their Contexts. New York: Prodist.
Dohrenwend, B. S., L. Krasnoff, A. R. Askenasy, and B. P. Dohrenwend
1978 "Exemplification of a method for scaling life events: The PERI Life Events Scale." Journal of Health and Social Behavior 19:205-29.
Dohrenwend, B. P., P. E. Shrout, G. Egri, and F. S. Mendelsohn
1980 "What psychiatric screening scales mea- sure in the general population: Part II: The components of demoralization by contrast with other dimensions of psychopathol- ogy." Archives of General Psychiatry 37:1229-36.
Dooley, D., and R. Catalano 1980 "Economic change as a cause of behavioral
disorder." Psychological Bulletin 87:450-68.
Glass, David C., and Jerome E. Singer 1972 Urban Stress: Experiments on Noise and
Social Stressors. New York: Academic Press.
Gochman, I. 1979 "Arousal, attribution and environmental
stress." Pp. 67-92 in Irwin G. Sarason and Charles D. Spielberger (eds.), Stress and Anxiety, Vol. 6. Washington: Hemisphere.
Goldberg, David P. 1972 The Detection of Psychiatric Illness by
Questionnaire. London: Oxford University Press.
Gore, S. 1978 "The effect of social support in moderating
the health consequences of unemploy- ment." Journal of Health and Social Be- havior 19:157-65.
1981 "Stress-buffering functions of social sup- ports: An appraisal and clarification of re- search models." Pp. 202-22 in Barbara S. Dohrenwend and Bruce P. Dohrenwend (eds.), Stressful Life Events and Their Contexts. New York: Prodist.
Guilford, Joy Paul 1965 Fundamental Statistics in Psychology and
Education. New York: McGraw-Hill. Holmes, T. H., and R. H. Rahe
1967 "The social adjustment scale." Journal of Psychosomatic Medicine 11:213-18.
Johnson, J. H., and I. G. Sarason 1979 "Moderator variables in life stress re-
search." Pp. 151-68 in Irwin G. Sarason and Charles D. Spielberger (eds.), Stress and Anxiety, Vol. 6. Washington: Hemisphere.
Kahn, Robert L., Donald M. Wolfe, Robert P. Quinn, J. Diedrick Snoek, and Robert A. Rosenthal
1964 Organizational Stress: Studies in Role Con- flict and Ambiguity. New York: Wiley.
Kanner, A. D., J. C. Coyne, C. Schaefer, and R. S. Lazarus
1981 "Comparison of two modes of stress mea- surement: Daily hassles and uplifts versus major life events." Journal of Behavioral Medicine 4:1-39.
Keating, J. 1979 "Environmental stressors misplaced em-
phasis." Pp. 55-66 in Irwin G. Sarason and Charles D. Spielberger (eds.), Stress and Anxiety, Vol. 6. Washington: Hemisphere.
396 JOURNAL OF HEALTH AND SOCIAL BEHAVIOR
Kobasa, S. C. 1979 "Stressful life events, personality, and
health: An inquiry into hardiness." Journal of Personality and Social Psychology 37:1-11.
Lazarus, Richard S. 1966 Psychological Stress and the Coping Pro-
cess. New York: McGraw-Hill. 1977 "Psychological stress and coping in adapta-
tion and illness." Pp. 14-26 in Z. J. Lipowski, Don R. Lipsi, and Peter C. Whybrow (eds.), Psychosomatic Medicine: Current Trends. New York: Oxford Uni- versity Press.
Lei, H., and H. A. Skinner 1980 "A psychometric study of life events and
social readjustment." Journal of Psychosomatic Research 24:57-65.
Levine, M., and D. V. Perkins 1980 "Tailor making life events scale." Pre-
sented at the meeting of the American Psy- chological Association, Montreal.
Lewinsohn, P. M., and J. Talkington 1979 "Studies on the measurement of unpleasant
events and relations with depression." Applied Psychological Measurement 3:83- 101.
Mason, J. W. 1971 "A re-evaluation of the concept of 'non-
specificity' in stress theory." Journal of Psychiatric Research 8:323-33.
Pearlin, L. I., M. A. Lieberman, E. G. Menaghan, and J. T. Mullan
1981 "The stress process." Journal of Health and Social Behavior 22:337-56.
Rabkin, J. G., and E. L. Struening 1976 "Life events, stress, and illness." Science
194:1013-20. Radloff, L.
1977 "The CES-D scale: A self-report depression scale for research in the general popula- tion." Applied Psychosocial Measurement 1:385-401.
Sarason, I. G., J. H. Johnson, and J. M. Siegel 1978 "Assessing the impact of life changes: De-
velopment of the life experiences survey." Journal of Consulting and Clinical Psychol- ogy 46:932-46.
Seligman, Martin E. P. 1975 Helplessness: On Depression, Develop-
ment and Death. San Francisco: W. H. Freeman.
Stroebe, W., M. S. Stroebe, K. J. Gergen, and M. Gergen
1982 "The effects of bereavement on mortality: A social psychological analysis." Pp. 527-61 in J. Richard Eiser (ed.), Social Psychology and Behavior Medicine. New York: Wiley.
Sundstrom, E. 1978 "Crowding as a sequential process: Review
of research on the effects of population density on humans." Pp. 32-116 in Andrew Baum and Yakov Epstein (eds.), Human Response to Crowding. Hillsdale, NJ: Erlbaum.
Tausig, M. 1982 "Measuring life events." Journal of Health
and Social Behavior 23:52-64. Vinokur, A., and M. L. Selzer
1975 "Desirable versus undesirable life events: Their relationship to stress and mental dis- tress." Journal of Personality and Social Psychology 32:329-77.
Watson, D., and F. Friend 1969 "Measurement of social-evaluative anxi-
ety." Journal of Consulting and Clinical Psychology 33:448-57.
Worchel, S. 1978 "Reducing crowding without increasing
space: Some applications of an attributional theory of crowding." Journal of Population 1:216-30.
Worchel, S., and C. Teddlie 1976 "The experience of crowding: A two factor
theory." Journal of Personality and Social Psychology 34:30-40.