A GIS-based DRASTIC model for assessing intrinsic ...
13
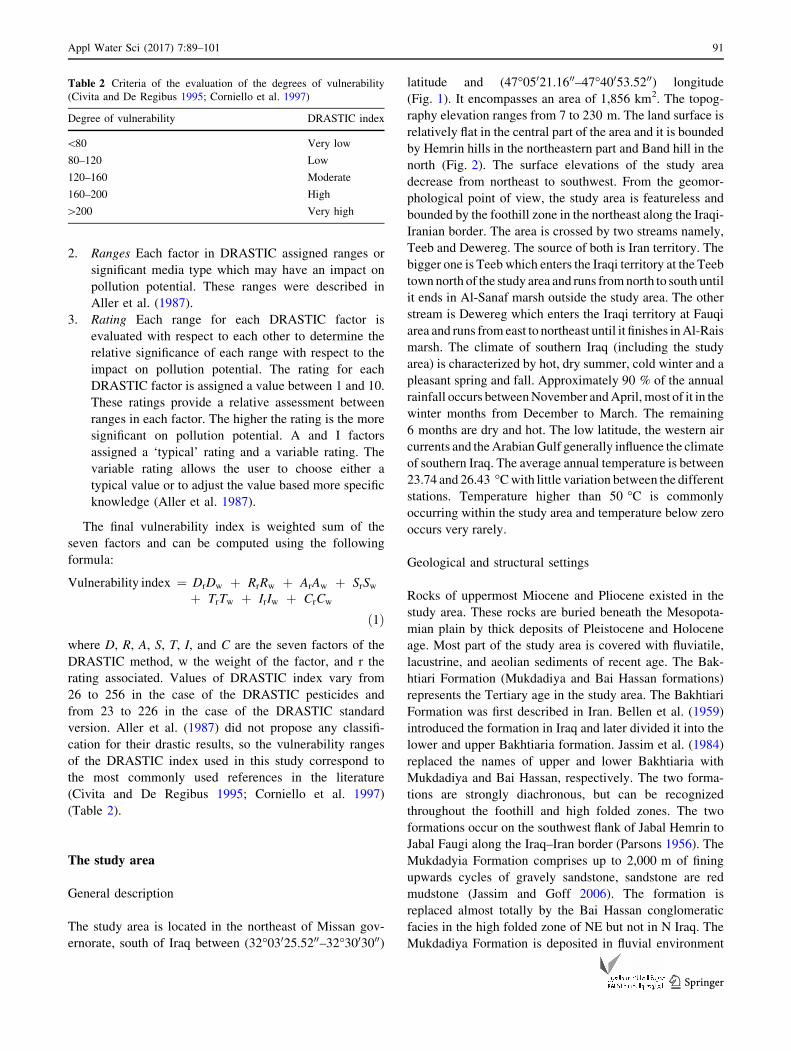
ORIGINAL ARTICLE A GIS-based DRASTIC model for assessing intrinsic groundwater vulnerability in northeastern Missan governorate, southern Iraq Alaa M. Al-Abadi • Ayser M. Al-Shamma’a • Mukdad H. Aljabbari Received: 26 March 2014 / Accepted: 1 July 2014 / Published online: 3 August 2014 Ó The Author(s) 2014. This article is published with open access at Springerlink.com Abstract In this study, intrinsic groundwater vulnerabil- ity for the shallow aquifer in northeastern Missan gover- norate, south of Iraq is evaluated using commonly used DRASTIC model in framework of GIS environment. Preparation of DRASTIC parameters is attained through gathering data from different sources including field sur- vey, geological and meteorological data, a digital elevation model DEM of the study area, archival database, and published research. The different data used to build DRASTIC model are arranged in a geospatial database using spatial analyst extension of ArcGIS 10.2 software. The obtained results related to the vulnerability to general contaminants show that the study area is characterized by two vulnerability zones: low and moderate. Ninety-four percentage (94 %) of the study area has a low class of groundwater vulnerability to contamination, whereas a total of (6 %) of the study area has moderate vulnerability. The pesticides DRASTIC index map shows that the study area is also characterized by two zones of vulnerability: low and moderate. The DRASTIC map of this version clearly shows that small percentage (13 %) of the study area has low vulnerability to contamination, and most parts have moderate vulnerability (about 87 %). The final results indicate that the aquifer system in the interested area is relatively protected from contamination on the groundwa- ter surface. To mitigate the contamination risks in the moderate vulnerability zones, a protective measure must be put before exploiting the aquifer and before comprehensive agricultural activities begin in the area. Keywords Vulnerability map DRASTIC model ArcGIS Missan governorate South of Iraq Introduction The term ‘‘vulnerability’’ is used to describe the degree to which human or environmental systems are likely to experience harm due to perturbation or stress, and can be identified for a specified system, hazard, or group of haz- ards (Popescu et al. 2008). In hydrogeology, vulnerability assessment typically describes the susceptibility of a par- ticular aquifer to contamination that can reduce the groundwater quality. The concept was first introduced in France by the end of the 1960s to create awareness of groundwater contamination (Vrba and Zaporozec 1994). No single standardized definition for groundwater vulner- ability exists; however, the concept describes the relative ease with which the groundwater resource could be con- taminated. The National Research Council (1993) defined it as the tendency or likelihood for contaminants to reach a specified position in the groundwater system after intro- duction at some location above the uppermost aquifer. Two terms are used to describe groundwater vulnerability: intrinsic and specific. Intrinsic vulnerability is the natural susceptibility to contamination based on the physical characteristics of the environment while specific vulnera- bility is defined as an accounting for the transport proper- ties of a particular contaminant or group of contaminants A. M. Al-Abadi (&) Geology Department, Science College, Basra University, Basra, Iraq e-mail: [email protected] A. M. Al-Shamma’a M. H. Aljabbari Geology Department, Science College, Baghdad University, Baghdad, Iraq e-mail: [email protected] M. H. Aljabbari e-mail: [email protected] 123 Appl Water Sci (2017) 7:89–101 DOI 10.1007/s13201-014-0221-7
Transcript of A GIS-based DRASTIC model for assessing intrinsic ...
ORIGINAL ARTICLE
A GIS-based DRASTIC model for assessing intrinsic groundwatervulnerability in northeastern Missan governorate, southern Iraq
Alaa M. Al-Abadi • Ayser M. Al-Shamma’a •
Mukdad H. Aljabbari
Received: 26 March 2014 / Accepted: 1 July 2014 / Published online: 3 August 2014
� The Author(s) 2014. This article is published with open access at Springerlink.com
Abstract In this study, intrinsic groundwater vulnerabil-
ity for the shallow aquifer in northeastern Missan gover-
norate, south of Iraq is evaluated using commonly used
DRASTIC model in framework of GIS environment.
Preparation of DRASTIC parameters is attained through
gathering data from different sources including field sur-
vey, geological and meteorological data, a digital elevation
model DEM of the study area, archival database, and
published research. The different data used to build
DRASTIC model are arranged in a geospatial database
using spatial analyst extension of ArcGIS 10.2 software.
The obtained results related to the vulnerability to general
contaminants show that the study area is characterized by
two vulnerability zones: low and moderate. Ninety-four
percentage (94 %) of the study area has a low class of
groundwater vulnerability to contamination, whereas a
total of (6 %) of the study area has moderate vulnerability.
The pesticides DRASTIC index map shows that the study
area is also characterized by two zones of vulnerability:
low and moderate. The DRASTIC map of this version
clearly shows that small percentage (13 %) of the study
area has low vulnerability to contamination, and most parts
have moderate vulnerability (about 87 %). The final results
indicate that the aquifer system in the interested area is
relatively protected from contamination on the groundwa-
ter surface. To mitigate the contamination risks in the
moderate vulnerability zones, a protective measure must be
put before exploiting the aquifer and before comprehensive
agricultural activities begin in the area.
Keywords Vulnerability map � DRASTIC model �ArcGIS � Missan governorate � South of Iraq
Introduction
The term ‘‘vulnerability’’ is used to describe the degree to
which human or environmental systems are likely to
experience harm due to perturbation or stress, and can be
identified for a specified system, hazard, or group of haz-
ards (Popescu et al. 2008). In hydrogeology, vulnerability
assessment typically describes the susceptibility of a par-
ticular aquifer to contamination that can reduce the
groundwater quality. The concept was first introduced in
France by the end of the 1960s to create awareness of
groundwater contamination (Vrba and Zaporozec 1994).
No single standardized definition for groundwater vulner-
ability exists; however, the concept describes the relative
ease with which the groundwater resource could be con-
taminated. The National Research Council (1993) defined
it as the tendency or likelihood for contaminants to reach a
specified position in the groundwater system after intro-
duction at some location above the uppermost aquifer. Two
terms are used to describe groundwater vulnerability:
intrinsic and specific. Intrinsic vulnerability is the natural
susceptibility to contamination based on the physical
characteristics of the environment while specific vulnera-
bility is defined as an accounting for the transport proper-
ties of a particular contaminant or group of contaminants
A. M. Al-Abadi (&)
Geology Department, Science College, Basra University, Basra,
Iraq
e-mail: [email protected]
A. M. Al-Shamma’a � M. H. Aljabbari
Geology Department, Science College, Baghdad University,
Baghdad, Iraq
e-mail: [email protected]
M. H. Aljabbari
e-mail: [email protected]
123
Appl Water Sci (2017) 7:89–101
DOI 10.1007/s13201-014-0221-7

through the subsurface (Jessica and Sonia 2009). The
evaluation of vulnerability is a means to gather complex
hydrogeological data in such a way that can be used by a
non-specialist people such as decision-makers. Vulnera-
bility assessment of groundwater aquifers provides a basis
for initially protective measures for important groundwater
resources and will normally be the first step in a ground-
water pollution hazard assessment and quality, when it
interest (Foster 1987). In recent years, vulnerability
assessment of groundwater aquifers considered as an
essential part for putting suitable plans to protect ground-
water aquifers around the world.
Many approaches have been developed for assessing
groundwater vulnerability and can be grouped into three
major categories (Tesoriero et al. 1998): (1) overly and
index methods; (2) methods employing process-based
simulation models; (3) statistical methods. In overly and
index methods, factors which are controlling movement
of pollutants from the ground surface into the saturated
zone (e.g., geology, soil, impact of vadose zone, etc.) are
mapped depending on existing and/or derived data. Sub-
jective numerical values (rating) are then assigned to each
factor based on its importance on controlling pollutants
movement. The rated maps are combined linearly to
produce final vulnerability map of an area. The ground-
water vulnerability evaluated by such methods is quali-
tative and relative. The main advantage of such methods
is that some of the factors controlling movement of pol-
lutants (e.g., net recharge and depth to groundwater table)
can be evaluated over large area, which makes them
suitable for regional scale assessment (Thapinta and Hu-
dak 2003). With the advent of GIS digital maps tech-
nology, adoption of such methods for creating
vulnerability maps is an easy task. Several overly and
index methods have been developed. The most common
one are: the DRASTIC system (Aller et al. 1987), the
GOD system (Foster 1987), The AVI rating system (Van
Stempvoort et al. 1993), the SINTACS method (Civita
1994), the German method (Von Hoyer and Sofner 1998),
the EPIK (Doerfliger and Zwahlen 1997), and the Irish
perspective (Daly et al. 2002). Process-based methods and
statistical methods are not commonly used for vulnera-
bility assessment because they are constrained by data
shortage, computational difficulty, and the expertise
required for implementing them.
The objective of this study is to evaluate intrinsic
vulnerability of the principal aquifer in northeastern
Missan governorate, south of Iraq for both general and
pesticides contaminants using the most popular DRAS-
TIC overlay and index method. Delineation of contam-
ination vulnerability zones is a very necessary step to
protect and efficient manage aquifer system within the
study area.
Description of DRASTIC system method
DRASTIC system is the most widely method used to
evaluate intrinsic vulnerability for a wide range of potential
contaminants. It is an overlay and index model designed to
produce vulnerability scores by combining several the-
matic maps. It was originally developed in USA under
cooperative agreement between the National Water Well
Association (NWWA) and the US Environmental Protec-
tion Agency (EPA) for detail hydrogeological evaluation of
pollution potential (Rundquist et al. 1991). The word
DRASTIC is acronym for most important factors within the
hydrogeological settings which control groundwater pol-
lution. Hydrogeological setting is a composite description
of all major geologic and hydrogeological factors which
affect the groundwater movement into, through, and out of
the area. These factors are: depth to water, net recharge,
aquifer media, soil media, topography (slope), impact of
vadose zone, and hydraulic conductivity. The DRASTIC
numerical ranking system contains three major parts:
weights, ranges, and ratings.
1. Weights Each DRASTIC factor is evaluated with
respect to each other to determine the relative impor-
tance of each factor. Each factor is assigned a relative
weight range of 1–5 (Table 1). The most significant
factor is allocated five; the least significant is allocated
one. DRASTIC has two weight classifications, one for
normal conditions (standard) and the other for condi-
tions with intense agricultural activity. The last one is
called pesticide DRASTIC index and represents a
specific case of DRASTIC index. The difference
between the two versions of DRATIC is in the
assignment of relative weights for the seven DRASTIC
factors. All other parts of the two indices are identical.
The application of pesticides when combined with
sensitive groundwater areas can impose a significant
impact of the water quality. Agricultural contaminants
such as pesticides will dissolve in the irrigation water
and infiltrate through the soil profile.
Table 1 Weights of the factors in the DRASTIC (standard and
Pesticides) (after Aller et al. 1987)
Factor DRASTIC version
Standard Pesticides
D: Depth to groundwater 5 5
R: Net recharge 4 4
A: Aquifer media 3 3
S: Soil media 2 5
T: Topography 1 3
I: Impact of vadose zone 5 4
C: Hydraulic conductivity of the aquifer 3 2
90 Appl Water Sci (2017) 7:89–101
123
2. Ranges Each factor in DRASTIC assigned ranges or
significant media type which may have an impact on
pollution potential. These ranges were described in
Aller et al. (1987).
3. Rating Each range for each DRASTIC factor is
evaluated with respect to each other to determine the
relative significance of each range with respect to the
impact on pollution potential. The rating for each
DRASTIC factor is assigned a value between 1 and 10.
These ratings provide a relative assessment between
ranges in each factor. The higher the rating is the more
significant on pollution potential. A and I factors
assigned a ‘typical’ rating and a variable rating. The
variable rating allows the user to choose either a
typical value or to adjust the value based more specific
knowledge (Aller et al. 1987).
The final vulnerability index is weighted sum of the
seven factors and can be computed using the following
formula:
Vulnerability index ¼ DrDw þ RrRw þ ArAw þ SrSwþ TrTw þ IrIw þ CrCw
ð1Þ
where D, R, A, S, T, I, and C are the seven factors of the
DRASTIC method, w the weight of the factor, and r the
rating associated. Values of DRASTIC index vary from
26 to 256 in the case of the DRASTIC pesticides and
from 23 to 226 in the case of the DRASTIC standard
version. Aller et al. (1987) did not propose any classifi-
cation for their drastic results, so the vulnerability ranges
of the DRASTIC index used in this study correspond to
the most commonly used references in the literature
(Civita and De Regibus 1995; Corniello et al. 1997)
(Table 2).
The study area
General description
The study area is located in the northeast of Missan gov-
ernorate, south of Iraq between (32�03025.5200–32�3003000)
latitude and (47�05021.1600–47�40053.5200) longitude
(Fig. 1). It encompasses an area of 1,856 km2. The topog-
raphy elevation ranges from 7 to 230 m. The land surface is
relatively flat in the central part of the area and it is bounded
by Hemrin hills in the northeastern part and Band hill in the
north (Fig. 2). The surface elevations of the study area
decrease from northeast to southwest. From the geomor-
phological point of view, the study area is featureless and
bounded by the foothill zone in the northeast along the Iraqi-
Iranian border. The area is crossed by two streams namely,
Teeb and Dewereg. The source of both is Iran territory. The
bigger one is Teeb which enters the Iraqi territory at the Teeb
town north of the study area and runs fromnorth to south until
it ends in Al-Sanaf marsh outside the study area. The other
stream is Dewereg which enters the Iraqi territory at Fauqi
area and runs from east to northeast until it finishes inAl-Rais
marsh. The climate of southern Iraq (including the study
area) is characterized by hot, dry summer, cold winter and a
pleasant spring and fall. Approximately 90 % of the annual
rainfall occurs betweenNovember andApril, most of it in the
winter months from December to March. The remaining
6 months are dry and hot. The low latitude, the western air
currents and theArabianGulf generally influence the climate
of southern Iraq. The average annual temperature is between
23.74 and 26.43 �Cwith little variation between the different
stations. Temperature higher than 50 �C is commonly
occurring within the study area and temperature below zero
occurs very rarely.
Geological and structural settings
Rocks of uppermost Miocene and Pliocene existed in the
study area. These rocks are buried beneath the Mesopota-
mian plain by thick deposits of Pleistocene and Holocene
age. Most part of the study area is covered with fluviatile,
lacustrine, and aeolian sediments of recent age. The Bak-
htiari Formation (Mukdadiya and Bai Hassan formations)
represents the Tertiary age in the study area. The Bakhtiari
Formation was first described in Iran. Bellen et al. (1959)
introduced the formation in Iraq and later divided it into the
lower and upper Bakhtiaria formation. Jassim et al. (1984)
replaced the names of upper and lower Bakhtiaria with
Mukdadiya and Bai Hassan, respectively. The two forma-
tions are strongly diachronous, but can be recognized
throughout the foothill and high folded zones. The two
formations occur on the southwest flank of Jabal Hemrin to
Jabal Faugi along the Iraq–Iran border (Parsons 1956). The
Mukdadyia Formation comprises up to 2,000 m of fining
upwards cycles of gravely sandstone, sandstone are red
mudstone (Jassim and Goff 2006). The formation is
replaced almost totally by the Bai Hassan conglomeratic
facies in the high folded zone of NE but not in N Iraq. The
Mukdadiya Formation is deposited in fluvial environment
Table 2 Criteria of the evaluation of the degrees of vulnerability
(Civita and De Regibus 1995; Corniello et al. 1997)
Degree of vulnerability DRASTIC index
\80 Very low
80–120 Low
120–160 Moderate
160–200 High
[200 Very high
Appl Water Sci (2017) 7:89–101 91
123

in a rapidly subsiding foredeep basin. The age of the
Bakhtiari Formation is Pliocene. The boundary between the
lower and upper Bakhtiari is merely a facies change and
arbitrarily assumed to be at the base of the first coarse
conglomerate. Most part of the study area is covered with
different types of Quaternary deposits mainly sand and
alluvium deposits of recent and Pleistocene age. The
Quaternary sediments are unconsolidated and usually finer
grained than the underlying Mukdadiya and Bai Hassan
Formations (Bellen et al. 1959; Naqib 1967; Al-Siddiki
1978). Alluvial fan, flood plain, depression fill, and aeolian
deposits are the major units of the Quaternary deposits in
the study area. Alluvial fans deposits comprise gravel, sand
and silty sand. These sediments form a strip along the
foothill zone. The maximum thickness of the alluvial
deposits may reach to 15 m. Poorly sorted coarse deposits
of cobbles and sometimes boulder occur in apical parts
passing into finer grained, better sorted layered fluvial
sediments. The outer rimes of the fans consist of sand and
silt. Gepcrete also developed on the surfaces of some fans.
Flood plain sediments comprise layers of silt-clay and clay
typically 10–20 cm, but sometimes up to 1 m thick.
Fig. 1 Location of the study
area
92 Appl Water Sci (2017) 7:89–101
123

Depression-filled deposits are generally reddish-brown fine
sand, silt and clayey silt. Three types of aeolian sediment
are currently found in the area: dust fill-out, mobile and
without clear forms and sand dunes. The dust is silty,
reddish-brown and calcareous (Khalaf et al. 1985 in Jassim
and Goff 2006). Figure 3 shows the geological map of the
study area. In general, The Quaternary deposits represent
about 72 % while Tertiary sediments extend over 28 %
(Fig. 4).
From tectonic point of view, Iraq can be divided into
three tectonically different areas: the Stable Shelf Zone
with major buried arches and antiforms but no surface
anticlines, the Unstable Shelf with surface anticlines, and
the Zagros Suture which comprises thrust sheets of radi-
olarian chert, igneous and metamorphic rocks (Jassim and
Goff 2006). The largest part of the study area lies within
the Mesopotamian Zone. The Mesopotamian Zone is the
easternmost unit of the stable shelf. It is bounded in the
NE by the folded ranges of pesh-i-kuh in the E, and
Hemrin and Makhul in the N. The zone was probably
uplifted during the Hercynian deformation, but it subsided
from late Permian time onwards. The study area contains
buried faulted structure below the Quaternary cover,
Separated by broad synclines (Buday and Jassim 1987).
The fold structures mainly trend NW–SE in the eastern
part of the zone and N–S in the southern part. Small
anticline folds are found between Al-Teeb and Shike Fars
areas in addition to another fold close to the Al-Swar hills
with NW–SE trend. This structure comprised Bazrgan oil
field.
Soil
Information on the type of soil is often needed as a basic
input in hydrologic evaluation. Mapping soil usually
involves delineating soil types that have identifiable char-
acteristics. The delineation is based on many factors such
as geomorphologic origin and conditions under which the
soil formed (Vieux 2004). A total of 20 samples of soil are
collected at a depth of about 75 cm below the surface after
removing the top soil cover. The soil samples are collected
in clean polyethylene containers and transported to soil
laboratory of civil engineering/Engineering College/Uni-
versity of Basra to carry out grain size analysis. The col-
lected soil samples of the study area are assigned texture
Fig. 2 Elevations (m) in the study area
Fig. 3 Geological map of the study area
Fig. 4 The age of exposed rocks in the study area
Appl Water Sci (2017) 7:89–101 93
123
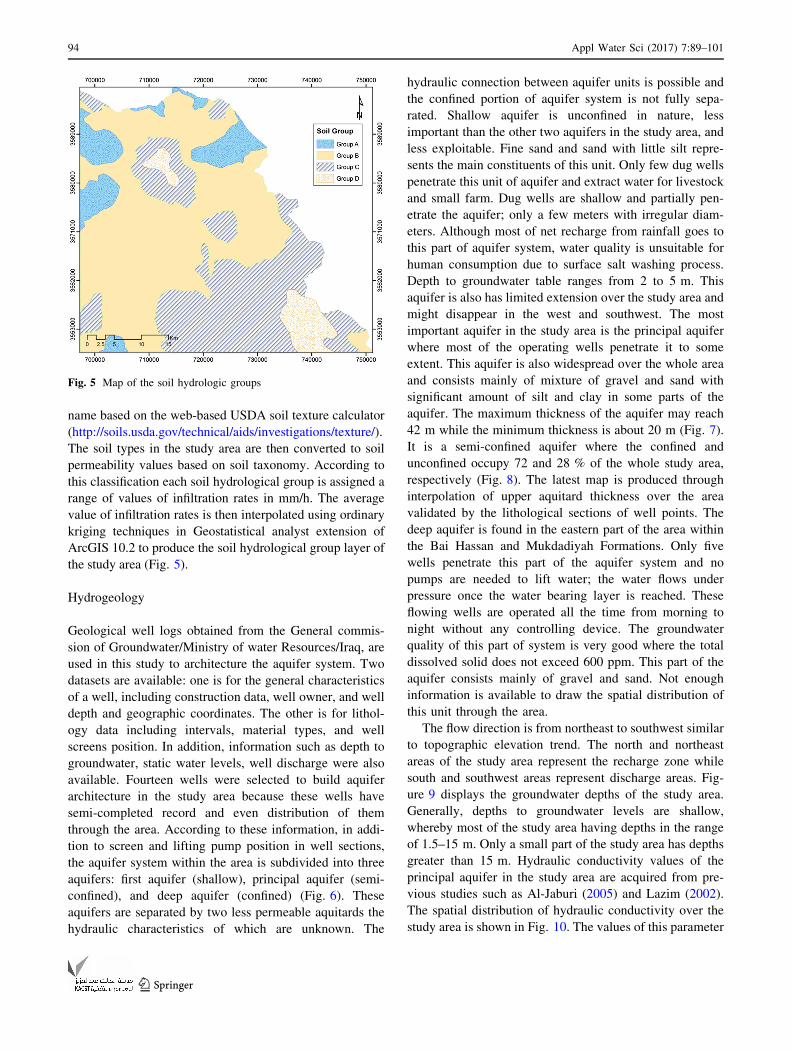
name based on the web-based USDA soil texture calculator
(http://soils.usda.gov/technical/aids/investigations/texture/).
The soil types in the study area are then converted to soil
permeability values based on soil taxonomy. According to
this classification each soil hydrological group is assigned a
range of values of infiltration rates in mm/h. The average
value of infiltration rates is then interpolated using ordinary
kriging techniques in Geostatistical analyst extension of
ArcGIS 10.2 to produce the soil hydrological group layer of
the study area (Fig. 5).
Hydrogeology
Geological well logs obtained from the General commis-
sion of Groundwater/Ministry of water Resources/Iraq, are
used in this study to architecture the aquifer system. Two
datasets are available: one is for the general characteristics
of a well, including construction data, well owner, and well
depth and geographic coordinates. The other is for lithol-
ogy data including intervals, material types, and well
screens position. In addition, information such as depth to
groundwater, static water levels, well discharge were also
available. Fourteen wells were selected to build aquifer
architecture in the study area because these wells have
semi-completed record and even distribution of them
through the area. According to these information, in addi-
tion to screen and lifting pump position in well sections,
the aquifer system within the area is subdivided into three
aquifers: first aquifer (shallow), principal aquifer (semi-
confined), and deep aquifer (confined) (Fig. 6). These
aquifers are separated by two less permeable aquitards the
hydraulic characteristics of which are unknown. The
hydraulic connection between aquifer units is possible and
the confined portion of aquifer system is not fully sepa-
rated. Shallow aquifer is unconfined in nature, less
important than the other two aquifers in the study area, and
less exploitable. Fine sand and sand with little silt repre-
sents the main constituents of this unit. Only few dug wells
penetrate this unit of aquifer and extract water for livestock
and small farm. Dug wells are shallow and partially pen-
etrate the aquifer; only a few meters with irregular diam-
eters. Although most of net recharge from rainfall goes to
this part of aquifer system, water quality is unsuitable for
human consumption due to surface salt washing process.
Depth to groundwater table ranges from 2 to 5 m. This
aquifer is also has limited extension over the study area and
might disappear in the west and southwest. The most
important aquifer in the study area is the principal aquifer
where most of the operating wells penetrate it to some
extent. This aquifer is also widespread over the whole area
and consists mainly of mixture of gravel and sand with
significant amount of silt and clay in some parts of the
aquifer. The maximum thickness of the aquifer may reach
42 m while the minimum thickness is about 20 m (Fig. 7).
It is a semi-confined aquifer where the confined and
unconfined occupy 72 and 28 % of the whole study area,
respectively (Fig. 8). The latest map is produced through
interpolation of upper aquitard thickness over the area
validated by the lithological sections of well points. The
deep aquifer is found in the eastern part of the area within
the Bai Hassan and Mukdadiyah Formations. Only five
wells penetrate this part of the aquifer system and no
pumps are needed to lift water; the water flows under
pressure once the water bearing layer is reached. These
flowing wells are operated all the time from morning to
night without any controlling device. The groundwater
quality of this part of system is very good where the total
dissolved solid does not exceed 600 ppm. This part of the
aquifer consists mainly of gravel and sand. Not enough
information is available to draw the spatial distribution of
this unit through the area.
The flow direction is from northeast to southwest similar
to topographic elevation trend. The north and northeast
areas of the study area represent the recharge zone while
south and southwest areas represent discharge areas. Fig-
ure 9 displays the groundwater depths of the study area.
Generally, depths to groundwater levels are shallow,
whereby most of the study area having depths in the range
of 1.5–15 m. Only a small part of the study area has depths
greater than 15 m. Hydraulic conductivity values of the
principal aquifer in the study area are acquired from pre-
vious studies such as Al-Jaburi (2005) and Lazim (2002).
The spatial distribution of hydraulic conductivity over the
study area is shown in Fig. 10. The values of this parameter
Fig. 5 Map of the soil hydrologic groups
94 Appl Water Sci (2017) 7:89–101
123

increase from south to north, reflecting the nature of the
sediments which changes from Quaternary to Tertiary.
Development of the DRASTIC vulnerability index
for the study area
Due to the presence of industrial and agricultural activities
in the study area, the standard and pesticides versions of
DRASTIC model are used in the present study for vul-
nerability assessment. The different data used to build
DRASTIC model are arranged in a geospatial database
using spatial analyst extension of ArcGIS 10.2 software.
The seven thematic layers are prepared as raster grid of cell
size 30 m (x, y) forming 1,826 and 1,641 columns and
rows, respectively. Table 3 shows the DRASTIC rating and
weighting values for the study area. The DRASTIC
parameters include the following features:
Fig. 6 A conceptual model of
the study area
Appl Water Sci (2017) 7:89–101 95
123

Depth to groundwater levels (D) The groundwater depth
for principal aquifer in the study area (Fig. 9) is reclassified
into four classes using reclassify command in spatial ana-
lyst with regard to DRASTIC rating system (Table 3;
Fig. 11a). The depth to groundwater is classified from three
(least effect on vulnerability) to nine (most effect on
vulnerability).
Net recharge (R) The amount of annual net recharge
calculated by mass chloride balance method for the prin-
cipal aquifer in the study area is less than 50 mm (Al-
Abadi 2011). An absolute value of one (Fig. 11b) is
assigned to rating value of this factor because of lack of
information concerning the spatial distribution of this
factor over the study area and the nature of confining
conditions of principal aquifer which overly partly by a
confining unit.
Aquifer media The main lithological constituents of the
principal aquifer in the study area are a mixture of gravel
and sand with significant amount of silt and clay, therefore
the rating value of this media is eight (Fig. 11c).
Soil media The hydrological soil groups of the study
area (Fig. 5) represent the soil capabilities to infiltrate
water applied where the infiltration capacity of soil
decreases from group A to D. According to this fact, the
soil media rating map are prepared and shown in
(Fig. 11d). These groups are assigned scores of 10, 8, 6, 4
Fig. 7 Principal aquifer thickness (m)
Fig. 8 Aquifer types in the study area
Fig. 9 Depths to groundwater level for the principal aquifer
Fig. 10 Spatial distribution of hydraulic conductivity (m/s)
96 Appl Water Sci (2017) 7:89–101
123

to reflect the ability of these groups to infiltrate water and
other constituents such as contaminants.
Topography (slope) The topography of the study area is
obtained from the DEM covering the study area. Slope
values (%) are then calculated from this map using the
spatial analyst tools in ArcGIS 10.2. The slope values are
rated based on the criteria of DRASTIC model with 10
being the lowest slope (Fig. 11e). Generally, the slope in
the study area is low and therefore increases the ground-
water vulnerability.
Impact of vadose zone (I) As mentioned before, the
principal aquifer in the study area is a semi-confined
aquifer where the confined part occupies about 72 % from
the study area and the remaining is the unconfined part.
The unsaturated zone in the confined part consists mainly
of silt and clay while the main constituents of vadose zone
of the unconfined part are sand and gravel. Therefore, the
vadose zone of the confined and unconfined parts is rated
eight and three depending on the criteria of DRASTIC
model (Fig. 11f).
Hydraulic conductivity (C) The hydraulic conductivity
map of the principal aquifer (Fig. 10) is reclassified
according to the criteria of DRASTIC model using
reclassify tool in spatial analyst extension of ArcGIS
environment (Fig. 11g).
The final vulnerability maps (standard and pesticides
DRASTIC versions) of the study area are calculated using
raster calculator in spatial analyst tool. The DRASTIC rating
from each input layer is multiplied by the weight for that
layer and summed to determine the DRASTIC index. The
resulted indices are classified according to Table 2 for
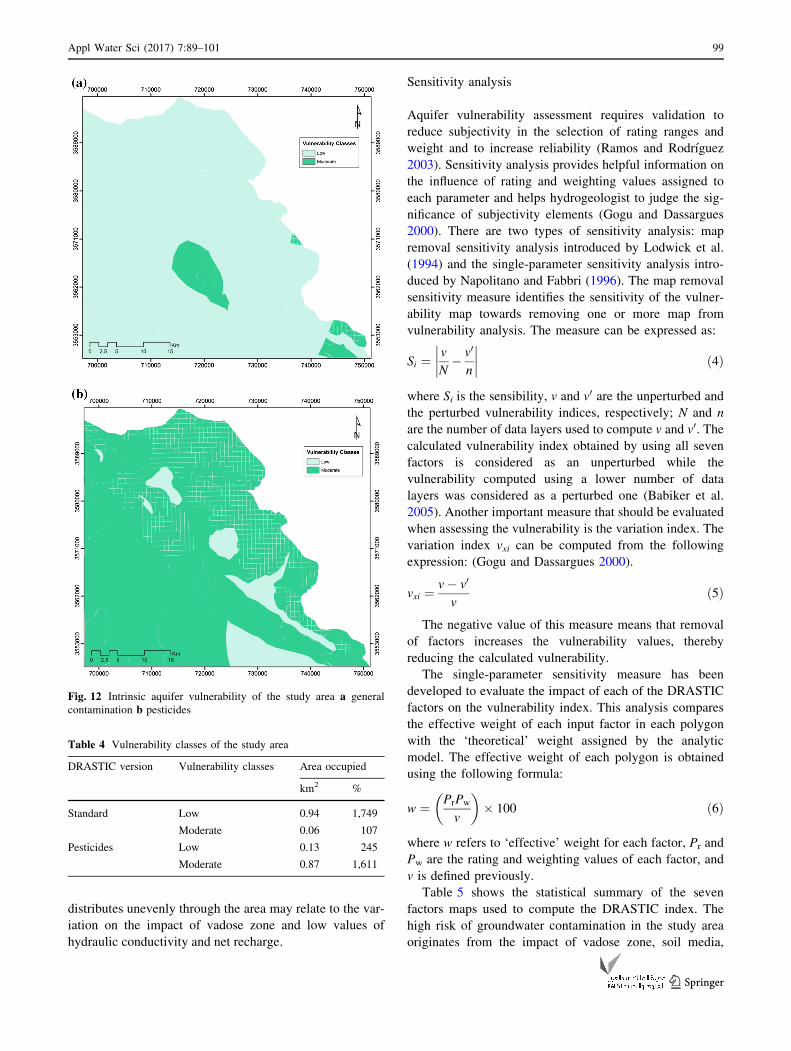
deriving the classes of vulnerability. Figure 12a reveals the
vulnerability classes for standard and pesticides DRASTIC,
respectively. Table 4 shows the areas occupied by each of
these classes for standard and pesticides versions of
DRASTIC model. The obtained results related to the vul-
nerability to general contaminants show that the study area is
characterized by two vulnerability zones: low and moderate.
The DRASTIC index ranges between 78 and 129. Table 4
shows that 94 % of the study area has a low class of
groundwater vulnerability to contamination, whereas a total
of 6 % of the study area has moderate vulnerability. A very
wide area (96 %) is locatedwithin the low vulnerability class
whichmay be attributed to the impact of vadose zone and the
low values of hydraulic conductivity of the aquifer. The
pesticides DRASTIC index map (Fig. 12b) shows that the
study area is also characterized by two zones of vulnerabil-
ity: low and moderate. The pesticides DRASTIC index
ranges between 83 and 154, which is higher than the standard
DRASTIC index. The resulted map of this version of
DRASTIC clearly shows that significant parts (84 %) of the
study area has moderate vulnerability to contamination, and
only small parts of the study area have low vulnerability to
pollution (about 16 %). The moderate vulnerability area
Table 3 DRASTIC rating and weight values for the study area
DRASTIC factors Range Rating Weight Total weight (rating 9 weight)
Standard Pesticides Standard Pesticides
Groundwater depth (m) 1.5–4.5 9 5 5 45 45
4.5–9 7 35 35
9–15 5 25 25
15–22 3 15 15
Net recharge (mm) \50 1 4 4 4 4
Aquifer media Sand and gravel 8 3 3 24 24
Soil group A 10 2 5 20 50
B 8 16 40
C 6 12 30
D 4 8 20
Topography (slope %) 0–2 10 1 3 10 30
2–6 9 9 27
6–12 5 5 15
[18 3 3 9
Impact of vadose zone Sand-gravel 8 5 4 40 32
Silt-clay 3 15 12
Hydraulic conductivity (m/d) 0–4.32 1 3 2 3 2
4.32–13 2 6 4
13–28.5 4 12 8
Appl Water Sci (2017) 7:89–101 97
123

Fig. 11 DRASTIC rating maps
98 Appl Water Sci (2017) 7:89–101
123
distributes unevenly through the area may relate to the var-
iation on the impact of vadose zone and low values of
hydraulic conductivity and net recharge.
Sensitivity analysis
Aquifer vulnerability assessment requires validation to
reduce subjectivity in the selection of rating ranges and
weight and to increase reliability (Ramos and Rodrıguez
2003). Sensitivity analysis provides helpful information on
the influence of rating and weighting values assigned to
each parameter and helps hydrogeologist to judge the sig-
nificance of subjectivity elements (Gogu and Dassargues
2000). There are two types of sensitivity analysis: map
removal sensitivity analysis introduced by Lodwick et al.
(1994) and the single-parameter sensitivity analysis intro-
duced by Napolitano and Fabbri (1996). The map removal
sensitivity measure identifies the sensitivity of the vulner-
ability map towards removing one or more map from
vulnerability analysis. The measure can be expressed as:
Si ¼v
N� v0
n
����
����
ð4Þ
where Si is the sensibility, v and v0 are the unperturbed and
the perturbed vulnerability indices, respectively; N and n
are the number of data layers used to compute v and v0. Thecalculated vulnerability index obtained by using all seven
factors is considered as an unperturbed while the
vulnerability computed using a lower number of data
layers was considered as a perturbed one (Babiker et al.
2005). Another important measure that should be evaluated
when assessing the vulnerability is the variation index. The
variation index vxi can be computed from the following
expression: (Gogu and Dassargues 2000).
vxi ¼v� v0
vð5Þ
The negative value of this measure means that removal
of factors increases the vulnerability values, thereby
reducing the calculated vulnerability.
The single-parameter sensitivity measure has been
developed to evaluate the impact of each of the DRASTIC
factors on the vulnerability index. This analysis compares
the effective weight of each input factor in each polygon
with the ‘theoretical’ weight assigned by the analytic
model. The effective weight of each polygon is obtained
using the following formula:
w ¼ PrPw
v
� �
� 100 ð6Þ
where w refers to ‘effective’ weight for each factor, Pr and
Pw are the rating and weighting values of each factor, and
v is defined previously.
Table 5 shows the statistical summary of the seven
factors maps used to compute the DRASTIC index. The
high risk of groundwater contamination in the study area
originates from the impact of vadose zone, soil media,
Fig. 12 Intrinsic aquifer vulnerability of the study area a general
contamination b pesticides
Table 4 Vulnerability classes of the study area
DRASTIC version Vulnerability classes Area occupied
km2 %
Standard Low 0.94 1,749
Moderate 0.06 107
Pesticides Low 0.13 245
Moderate 0.87 1,611
Appl Water Sci (2017) 7:89–101 99
123
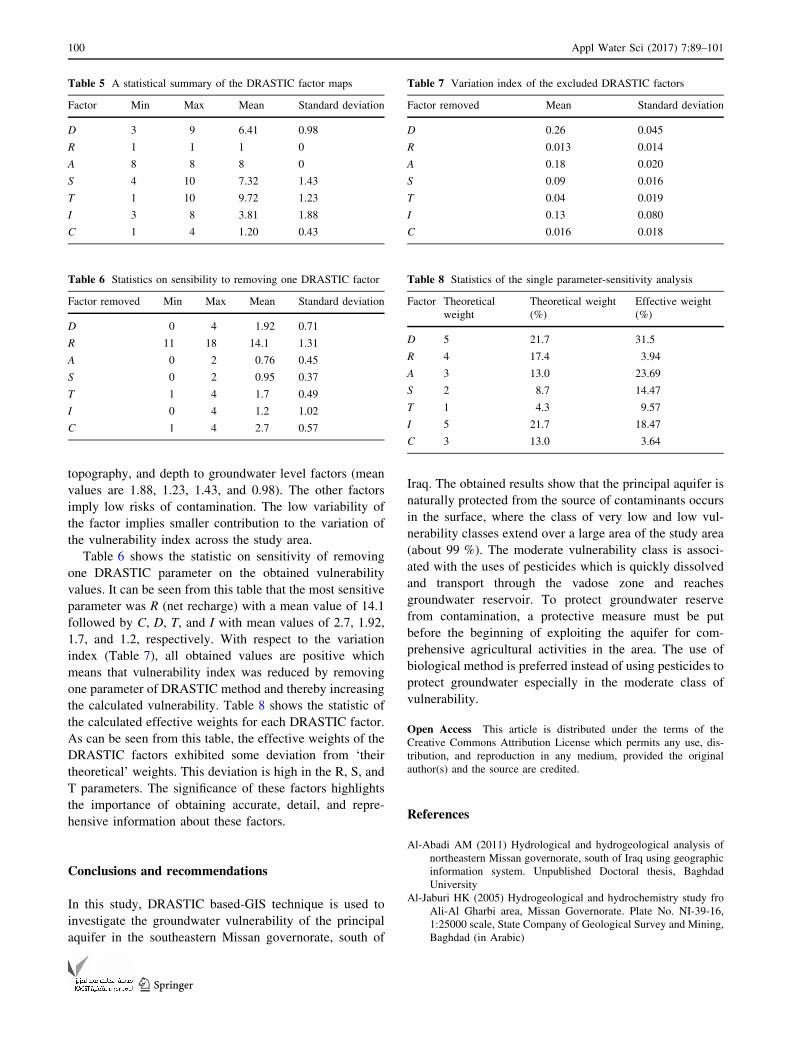
topography, and depth to groundwater level factors (mean
values are 1.88, 1.23, 1.43, and 0.98). The other factors
imply low risks of contamination. The low variability of
the factor implies smaller contribution to the variation of
the vulnerability index across the study area.
Table 6 shows the statistic on sensitivity of removing
one DRASTIC parameter on the obtained vulnerability
values. It can be seen from this table that the most sensitive
parameter was R (net recharge) with a mean value of 14.1
followed by C, D, T, and I with mean values of 2.7, 1.92,
1.7, and 1.2, respectively. With respect to the variation
index (Table 7), all obtained values are positive which
means that vulnerability index was reduced by removing
one parameter of DRASTIC method and thereby increasing
the calculated vulnerability. Table 8 shows the statistic of
the calculated effective weights for each DRASTIC factor.
As can be seen from this table, the effective weights of the
DRASTIC factors exhibited some deviation from ‘their
theoretical’ weights. This deviation is high in the R, S, and
T parameters. The significance of these factors highlights
the importance of obtaining accurate, detail, and repre-
hensive information about these factors.
Conclusions and recommendations
In this study, DRASTIC based-GIS technique is used to
investigate the groundwater vulnerability of the principal
aquifer in the southeastern Missan governorate, south of
Iraq. The obtained results show that the principal aquifer is
naturally protected from the source of contaminants occurs
in the surface, where the class of very low and low vul-
nerability classes extend over a large area of the study area
(about 99 %). The moderate vulnerability class is associ-
ated with the uses of pesticides which is quickly dissolved
and transport through the vadose zone and reaches
groundwater reservoir. To protect groundwater reserve
from contamination, a protective measure must be put
before the beginning of exploiting the aquifer for com-
prehensive agricultural activities in the area. The use of
biological method is preferred instead of using pesticides to
protect groundwater especially in the moderate class of
vulnerability.
Open Access This article is distributed under the terms of the
Creative Commons Attribution License which permits any use, dis-
tribution, and reproduction in any medium, provided the original
author(s) and the source are credited.
References
Al-Abadi AM (2011) Hydrological and hydrogeological analysis of
northeastern Missan governorate, south of Iraq using geographic
information system. Unpublished Doctoral thesis, Baghdad
University
Al-Jaburi HK (2005) Hydrogeological and hydrochemistry study fro
Ali-Al Gharbi area, Missan Governorate. Plate No. NI-39-16,
1:25000 scale, State Company of Geological Survey and Mining,
Baghdad (in Arabic)
Table 5 A statistical summary of the DRASTIC factor maps
Factor Min Max Mean Standard deviation
D 3 9 6.41 0.98
R 1 1 1 0
A 8 8 8 0
S 4 10 7.32 1.43
T 1 10 9.72 1.23
I 3 8 3.81 1.88
C 1 4 1.20 0.43
Table 6 Statistics on sensibility to removing one DRASTIC factor
Factor removed Min Max Mean Standard deviation
D 0 4 1.92 0.71
R 11 18 14.1 1.31
A 0 2 0.76 0.45
S 0 2 0.95 0.37
T 1 4 1.7 0.49
I 0 4 1.2 1.02
C 1 4 2.7 0.57
Table 7 Variation index of the excluded DRASTIC factors
Factor removed Mean Standard deviation
D 0.26 0.045
R 0.013 0.014
A 0.18 0.020
S 0.09 0.016
T 0.04 0.019
I 0.13 0.080
C 0.016 0.018
Table 8 Statistics of the single parameter-sensitivity analysis
Factor Theoretical
weight
Theoretical weight
(%)
Effective weight
(%)
D 5 21.7 31.5
R 4 17.4 3.94
A 3 13.0 23.69
S 2 8.7 14.47
T 1 4.3 9.57
I 5 21.7 18.47
C 3 13.0 3.64
100 Appl Water Sci (2017) 7:89–101
123

Aller L, Bennett T, Lehr J, Petty R, and Hackett G (1987) DRASTIC:
A standardized system for evaluation ground water pollution
potential using hydrogeological settings. National Water Well
Association, Dublin, Ohio and Environmental Protection
Agency, Ada, Ok.EPA-600/2-87-035
Al-Siddiki AA (1978) Subsurface geology of southeastern Iraq. In:
10th Arab Petroleum Congress, Tripoli, Libya
Babiker IS, Modamed AA, Hiyama T, Kato K (2005) A GIS-based
DRASTIC model for assessing aquifer vulnerability in Kakami-
gahara Heights, Gifu Prefecture, central Japan. Sci Total Environ
345:127–140
Bellen RCV, Dunnington HV, Wetzel R, and Morton D (1959)
LexiqueStratigraphique Internal Asie. Iraq. Intern. Geol. Conger.
Comm. Stratig, 3, Fasc. 10a
Buday T, Jassim SZ (1987) The regional geology of Iraq, vol. 2:
tectonism, magmatism, and metamorphism. Publication of
GEOSURV, Baghdad
Civita M (1994) La carte dellavulnerbilita deli aquiferiallinquina-
mento: teoria e pratica. PitagoraEditrica, Bologan, Italy (in
Italian)
Civita M, De Regibus C (1995) Sperimentazione di alcunemetdologie
per la valutazionedellavulnerabilitadegli aquifer. Q Geol Appl
Pitagora Bologna 3:63–71
Corniello A, Ducci D, Napolitano P (1997) Comparison between
parametric methods to evaluate aquifer pollution vulnerability
using GIS: an example in the Piana Company, Southern Italy. In:
Marinos P, Koukis G, Tsiambaos G, Stournaras G (eds)
Engineering Geology and the Environmental. Balkema, Rotter-
dam, pp 1721–1726
Daly D, Dassargues A, Drew D, Dunne S, Goldscheider N, Neales S,
Popescu CH, Zwahlen F (2002) Main concepts of the ‘‘European
Approach’’ for karst groundwater vulnerability and assessment
and mapping. Hydrogeol J 10(2):340–345
Doerfliger N, Zwahlen F (1997) EPIK: a new method for outlining of
protection areas in karstic environment. In: Gunay G, Johnson
AL (eds) International symposium and field seminar on ‘‘karst
waters and environmental impacts’’. Antalya, Turkey. Balkema,
Rotterdam, pp 117–123
Foster SSD (1987) In Vulnerability of soil and groundwater to
pollutions: proceedings and information. In: Van Duijvedbooden
W, van Waegeningh HG (eds) Fundamental concepts in aquifer
vulnerability pollution risk and protection strategy. TNO Com-
mittee on Hydrological Research, The Hague, pp 69–86
Gogu RC, Dassargues A (2000) Current trends and future challenges
in groundwater vulnerability assessment using overlay and index
methods. Environ Geol 39:549–559
Jassim SZ, Goff JC (2006) Geology of Iraq. Dolin, Prague and
Moravian Museum, Brno, Czech Republic
Jassim SZ, Karim SA, Basi M, Al-Mubarak MA, Munir J (1984) Final
report on the regional geology survey of Iraq, vol. 3, Stratig-
raphy. Manuscript report, Geological Survey of Iraq
Jessica EL, Sonia T (2009) Groundwater vulnerability assessments
and integrated water resource management. Watershed Manag
Bull 13(1):18–29
Khalaf F, Al-Kadi A, Al-Saleh S (1985) Mineralogical composition
and potential sources of dust fallout deposits in Kuwait. North
Arabian Gulf Sed Geol 42:255–278
Lazim SA (2002) The possibility of using groundwater formations
(Bai-Hassan and Mukdadiyah) in Bazurgan area-the economic
evaluation and suitability for human and industrial usage. Master
thesis, University of Baghdad, p 99
Lodwick WA, Monson W, Svoboda L (1994) Attribute error and
sensitivity analysis of map operations in geographical informa-
tion systems: suitability analysis. Int J Geogr Inf Syst
4(4):413–428
Napolitano P, Fabbri AG (1996) Single-parameter sensitivity analysis
for aquifer vulnerability assessment using DRASTIC and
SINTACS HydroGIS 96: application of geographical informa-
tion systems in hydrology and water resources management. In:
Proceedings of Vienna Conference. IAHS Pub. vol 325,
pp 559–566
Naqib KM (1967) Geology of the Arabian Peninsula, southeastern
Iraq. USGS Professional, Paper No. 560-G
National Research Council (1993) Ground water vulnerability
assessment, contamination potential under conditions of uncer-
tainty. National Academic Press, Washington DC
Parsons RM (1956) Ground-water resources of Iraq.Khanaqin-Jassan
area, vol 1. Development Board, Ministry of Development
Government of Iraq, Baghdad
Popescu IC, Gardin N, Brouyere S, Dassargues A (2008) Groundwa-
ter vulnerability assessment using physically-based modeling:
from challenges to pragmatic solutions. In ModelCARE 2007
proceedings, calibration and reliability in groundwater modeling.
Refsgaard JC, Kovar K, Haarder E, Nygaard E (eds), Den-
mark.IAHS Publication No. 320
Ramos JA, Rodrıguez R (2003) Aquifer vulnerability mapping in the
Turbio river valley, Mexico: a validation study. GefoısicaInter-
nacional 42(1):2002
Rundquist DC, Rodekohr DA, Peters AJ, Ehrman LDi, Murray G
(1991) Statewide groundwater-vulnerability assessment in
Nebraska using the DRASTIC/GIS model. Geocarto Int 2:51–58
Tesoriero AJ, Inkpen EL, Voss FD (1998) Assessing ground-water
vulnerability using logistic regression. In: Proceedings for the
source water assessment and protection 98 Conference, Dallas,
TX, pp 157–165
Thapinta A, Hudak PF (2003) Use of geographic information systems
for assessing groundwater pollution potential by pesticides in
Central Thailand. Enviro Int 29(1):87–93
Van Stempvoort D, Ewert D, Wassenaar L (1993) Aquifer vulner-
ability index: a GIS-compatible method for groundwater
vulnerability mapping. Can Water Resour J 18(1):25–37
Vieux BE (2004) Distributed Hydrologic Modeling Using GIS.Water
Science and Technology Library, vol 48. Kluwer Academic
Publishers, Norwell
Von Hoyer M, Sofner B (1998) Groundwater vulnerability mapping
in carbonate (karst) areas of Germany, Federal institute for
geosciences and natural resources, Archive no. 117854, Hano-
ver, Germany
Vrba I, Zaporozec A (1994) Guidebook on mapping ground-water
vulnerability. International Association of hydrogeologist, Heise,
Hannover. International Contributions to Hydrogeology No.16
Appl Water Sci (2017) 7:89–101 101
123