A Geographic Account of Economic, Health, and Educational ...
17
A Geographic Account of Economic, Health, and Educational Disparities in Hartford’s Sheff Region Casey D. Cobb a Abstract In the current study, I use geographic techniques to examine the distribution of key housing, eco- nomic, health, and educational indicators in metropolitan Hartford. I focus in particular on factors that bear upon the lives of children in this area, also known as the Sheff region—a reference to the long-standing Sheff v. O’Neill school desegregation lawsuit. The results reveal substantial disparities in the geographic distribution of important resources and outcomes across the racially and eco- nomically stratified region. Despite earnest school desegregation efforts, the opportunities, access, and resources available to children in municipalities across the metro Hartford region remain starkly different. Children of color living in central Connecticut’s poor urban communities are dispropor - tionately affected by a highly fragmented sociopolitical geography. Recommendations are made for more comprehensive, cross-sector policy interventions as well as regional collaboratives. Keywords Achievement gap, desegregation, inequity, Geographic Information Systems, geospatial analysis, education policy Substantial disparities persist in academic out- comes between students of color and white stu- dents in the United States. The 2017 results from the National Assessment of Educational Progress (NAEP), also referred to as the “Nation’s Report Card,” show white-Black and white-Hispanic av- erage scale score differences on 4th grade math and reading tests to be anywhere from .64 to 1 Source: U.S. Department of Education, Institute of Education Sciences, National Center for Education Statistics, National Assessment of Educational Progress (NAEP), 2017 Reading and Math Assessment. .86 standard deviations, with similar trends evi- dent in grades 8 and 12. 1 Performance gaps be- tween students of high and low socioeconomic a University of Connecticut Corresponding Author: Casey D. Cobb Neag School of Education University of Connecticut, Storrs, CT 06269 Email: [email protected] Cobb, Casey D. 2019. “A Geographic Account of Economic, Health, and Educational Disparities in Hartford’s Sheff Region.” Humboldt Journal of Social Relations 41: 82–98.
Transcript of A Geographic Account of Economic, Health, and Educational ...

A Geographic Account of Economic, Health, and Educational Disparities in Hartford’s Sheff Region
Casey D. Cobba
Abstract
In the current study, I use geographic techniques to examine the distribution of key housing, eco-nomic, health, and educational indicators in metropolitan Hartford. I focus in particular on factors that bear upon the lives of children in this area, also known as the Sheff region—a reference to the long-standing Sheff v. O’Neill school desegregation lawsuit. The results reveal substantial disparities in the geographic distribution of important resources and outcomes across the racially and eco-nomically stratified region. Despite earnest school desegregation efforts, the opportunities, access, and resources available to children in municipalities across the metro Hartford region remain starkly different. Children of color living in central Connecticut’s poor urban communities are dispropor-tionately affected by a highly fragmented sociopolitical geography. Recommendations are made for more comprehensive, cross-sector policy interventions as well as regional collaboratives.
Keywords
Achievement gap, desegregation, inequity, Geographic Information Systems, geospatial analysis, education policy
Substantial disparities persist in academic out-comes between students of color and white stu-dents in the United States. The 2017 results from the National Assessment of Educational Progress (NAEP), also referred to as the “Nation’s Report Card,” show white-Black and white-Hispanic av-erage scale score differences on 4th grade math and reading tests to be anywhere from .64 to
1 Source: U.S. Department of Education, Institute of Education Sciences, National Center for Education Statistics, National Assessment of Educational Progress (NAEP), 2017 Reading and Math Assessment.
.86 standard deviations, with similar trends evi-dent in grades 8 and 12.1 Performance gaps be-tween students of high and low socioeconomic
aUniversity of ConnecticutCorresponding Author: Casey D. Cobb Neag School of EducationUniversity of Connecticut, Storrs, CT 06269Email: [email protected]
Cobb, Casey D. 2019. “A Geographic Account of Economic, Health, and Educational Disparities in Hartford’s Sheff Region.” Humboldt Journal of Social Relations 41: 82–98.

85Disparities in the Sheff Region
status parallel these differences and are made more pronounced by school districts that vary in wealth (Owens, Reardon, & Jencks 2016). Un-equal educational resources, low quality schools, neighborhood poverty, and systemic racism are all named as possible contributors to the achievement gaps.
According to the NAEP, Connecticut has one of the largest racial achievement gaps in the country, and not too long ago had the nation’s highest achievement gap (Rabe Thomas 2013; Rabe Thomas & Kara 2018). In 1989, in response to inadequate educational resources for stu-dents in Hartford, Milo Sheff filed a legal com-plaint against the State of Connecticut on be-half of Hartford Public School students, the vast majority of whom were poor, Black, and Latino.2 Hartford and its surrounding suburbs repre-sent one of the most racially and economically segregated regions in the country (Dougherty 2018). The Sheff v. O’Neill lawsuit resulted in a court settlement agreement that called for spe-cific remedies to reduce the minority and eco-nomic isolation of Hartford students. The Sheff agreement authorized the construction of doz-ens of interdistrict magnet schools and the ex-pansion of a suburban-urban student transfer program (Sheff v. O’Neill 2003). Both programs were unique in that they promoted interdistrict cooperation through voluntary school choice, which invited students to cross district lines.3 To-day there are nearly 19,000 students from metro Hartford (mostly suburban students) who attend one of the 42 Sheff region magnets (Torre 2017). Among the 21,034 Hartford-resident minoritized students, 7,152 are enrolled in a magnet school
2 Sheff v. O’Neill, 238 Conn. 1, 678 A.2d 1267 (1996).3 Interdistrict school choice programs designed for a similar desegregative purpose are in operation in at least eight other metropolitan
areas, including St. Louis, Rochester, Boston, Omaha, and Minneapolis (Wells, Baldridge, Duran, Grzesikowski, Lofton, Roda, & White, 2009).
and another 2,171 attend a public school in the 32 surrounding suburban communities through the Open Choice program (Connecticut State Department of Education 2018).
Connecticut’s response to Sheff has achieved varying results. The Sheff settlement, now in its fourth phase, has substantially increased the number of Hartford students of color who attend a “reduced-isolation setting” from 11.1% in 2006 (Dougherty, Estevez, Wanzer, Tatem, Bell, Cobb, & Esposito 2006) to 46.1% in 2018 (Connecti-cut State Department of Education 2018). Some studies have found positive achievement effects for students enrolled in integrated settings such as Hartford’s interdistrict magnet schools (Bi-fulco, Cobb, & Bell 2009; Ellsworth 2013). Other accounts contend that Sheff has not worked to its potential or worked equally well for all stu-dents, most pointing to the limited opportuni-ties for Hartford students, such as caps on seats available in interdistrict magnets or Open Choice suburban schools (Rabe Thomas 2018). As an ex-ample, more than 3,000 Hartford students were waitlisted in the 2017 school choice lottery and roughly 11,000 remained in district schools that are critically under-resourced compared to their suburban neighbors (Torre 2017).
In Hartford, and hyper-segregated urban cities elsewhere, schools (and school desegregation programs) alone are not able to break the cycles of poverty or eliminate structural forms of rac-ism. Far more powerful and systemic forces bear upon the lives of disenfranchised children, start-ing with where they live. The present study rests upon the assumption that the “place and space” in which children grow up heavily influences their

86 Cobb C.D. 2019
opportunities to learn and access to resources. States are separated into counties, which are divided into cities and towns, which are divid-ed further into neighborhoods. These layers of geography impact children’s lives in a variety of ways, but most directly so at the local levels of governance. The impact is even more pro-nounced in states within New England that rely heavily on municipality-led governments. In the next section, I provide a brief review of the liter-ature on how various health, economic, housing, and social factors can bear upon the lives of chil-dren. I then offer an overview of the Connecticut and metro Hartford contexts, before turning to the present study’s aims, methods, and findings.
CONCEPTUAL FRAMEWORKThe current study assumes that neighborhoods can have profound short and long term influenc-es on its residents, particularly children (Samp-son, Morenoff, & Gannon-Rowley 2002). The deleterious effects of concentrated poverty on adolescents and academic outcomes are well es-tablished (Duncan & Raudenbush 2001; Leven-thal & Brooks-Gunn 2000). Communities isolated in intense poverty restrict opportunities for up-ward social and economic mobility. If high pover-ty communities limit life opportunities, then the opposite may be true. Chetty, Hendren, and Katz (2016) re-evaluated data on Baltimore’s Moving to Opportunity housing voucher program and found that children who grew up in “higher op-portunity areas” demonstrated significantly bet-ter life outcomes, including a higher chance of attending college, earning greater incomes, and a reduced likelihood of single parenthood.
Berliner (2009) acknowledged that schools cannot do it alone when trying to reverse the ill effects of high poverty conditions on children. Schools are not equipped to eradicate inequi-ties in health, opportunity, and academic out-comes. Berliner examined seven “out of school
factors” that influence student success. These included low birth weight and non-genetic pre-natal influences on children; inadequate medi-cal, dental, and vision care (often connected to availability of medical insurance); food instability; environmental pollutants; family relations and household stress; neighborhood characteristics; and extended learning time, such as preschool (Berliner 2009).
Like Berliner’s recognition of several out of school influences, my study considers the ele-ments of neighborhoods and municipalities as comprising a system (Tamas, Whitehorse, & Al-monte 2000). The elements of the system include housing, economic, health, and educational re-sources, which, taken together, constitute the so-cial living conditions under which children grow and develop.
HousingThe benefits of home ownership extend beyond personal pride and autonomy. The recent mort-gage lending crisis notwithstanding, home own-ership allows individuals and families to build financial equity and generate wealth (Retsinas & Belsky 2004; Turner & Luea 2009). Ownership can more readily lead to upward economic mobili-ty than renting. Middle to high-income families or families who benefit from intergeneration-al wealth, such as through estate transfers, are more likely to own a home. The opposite is the case for families in poverty who lack resources to access a mortgage. One of the advantages of home ownership, particularly for the middle and upper class, is that it offers greater opportunities to use existing wealth to live in—or move to—higher-resourced communities.
Beyond the benefits to individuals, communi-ties with higher proportions of owner-occupied homes (and appreciable home values) generate their own advantages that directly benefit their local schools—through tax revenue support.

87Disparities in the Sheff Region
Home values represent proxies for communi-ty and neighborhood wealth, as higher valua-tions are typically indicative of higher affluence and a larger tax base (Kenyon 2007). In a study of 217 school districts in New Jersey between 2002 and 2009, Mensah, Schoderbek, and Sahay (2013) found a significant, positive relationship between local property tax revenue and school test scores. This finding suggests that communi-ties that can generate higher local tax funds have a better chance of positively impacting student achievement. Other quasi-experimental studies (Black 1999; Clapp, Nanda, & Ross 2008) and a comprehensive review of the empirical literature (Nguyen-Hoang & Yinger 2011) reported similar strong relationships between home values and school quality.
Neighborhood PovertyThere is robust and ever growing evidence demonstrating the ill effects of poverty on stu-dent development and learning (Jencks & Mayer 1990; Reardon, Kalogrides, & Shores 2018; Samp-son, Morenoff, & Gannon-Rowley, 2002). Studies have confirmed negative effects on the forma-tion of infant brains (Cookson 2008), examined the relationship between neighborhood poverty and readiness to learn (Janus & Duku 2007), in-vestigated the effects of neighborhoods on child and adolescent outcomes (Leventhal & Brooks-Gunn 2000), as well as on verbal ability among African American children (Sampson, Sharkey, & Raudenbush 2008). High poverty communities, and the families and children within them, are at a severe disadvantage from the start.
HealthIncreasingly, studies are finding that inequities in student learning can be attributed to early childhood health maladies or undesirable envi-ronmental conditions (Fiscella & Kitzman 2009; Miranda, Kim, Reiter, Galeano, & Maxson 2009).
For example, health disparities have been exam-ined in relation to differences in school readiness (Currie 2005) and academic performance (Mi-chael, Merlo, Basch, Wentzel, & Wechsler 2015). Moreover, there is growing evidence of a direct link between high blood lead levels and cogni-tive function among young children (Canfield, Henderson, Cory-Slechta, Cox, Jusko, & Lanphear 2003; Miranda, Kim, Galeano, Paul, Hull, & Mor-gan 2007). Childhood asthma has been identified as one of the leading childhood diseases and also causes school absences (Basch 2011; Hsu, Qin, Beavers, & Mirabelli 2016). African American children are three times more likely to suffer from asthma than white children. A Washington, DC study revealed that visits to the emergency room for uncontrolled asthma attacks were ten times more likely among DC residents in low-income neighborhoods compared to more affluent DC communities (Children’s National Health System 2014). Lastly, access to appropriate healthcare and with adequate medical insurance is critical to early childhood development and cognitive function (Cohodes, Grossman, Kleiner, & Loven-heim 2014). Households in poverty exhibit low-er levels of usage and higher barriers to health care than more wealthy families (Gorman & Braverman 2008).
In the preceding paragraphs, I have attempted to describe key elements of a social system of living conditions and their effects on families and children. I shift next to provide an overview of the study’s setting—metro Hartford—and the great-er sociopolitical context in which it is situated.
THE CONNECTICUT CONTEXT, METRO HARTFORD, AND THE SHEFF REGIONConnecticut is the nation’s third smallest state in geographic area, but is carved up into 169 cit-ies and towns. Like other New England states, Connecticut is characterized by provincial gov-ernments and a political culture of strong local

88 Cobb C.D. 2019
control. Since 1909 school districts have been coterminous with Connecticut municipalities (Gooch 2003), which have starkly different com-munity resources, thus giving way to severe in-equalities in resources for children. Given Con-necticut’s significant disparities in wealth based on zip code and even census tract, the state has engendered the designation, “the two Connecti-cuts” (Phaneuf & Silber 2018).
Connecticut’s preference for local govern-ment control is of no small significance here. The boundaries that separate cities and towns in Connecticut are walls of inclusion and, ipso fac-to, also of exclusion. Each city and town has its own local government and most have their own schools, refuse/transfer stations, transportation services, parks and recreation departments, town or city managers, and zoning officials. Sharing of services across municipalities is limited, with ef-forts to regionalize and consolidate often facing strong opposition (Condon 2018). This has led to not only fiscal inefficiencies, but inequalities between municipalities. This provincialism per-petuates “the two Connecticuts,” separating the haves and have-nots along racial and economic lines. Nowhere is this more evident than in metro Hartford, which has experienced what has been considered “white flight” over the past several decades (Dougherty & Lassiter 2012).4
Metropolitan Hartford is constituted of the city of Hartford, its immediate neighbors to the west and east (i.e., the cities of West and East Hart-ford), and the contiguous suburbs that surround those cities. This study considers an even larger
4 Incidentally, Jack Dougherty and contributors at Trinity College have published a unique interactive map that demonstrates the change in home values over the past century in metro Hartford; specifically, home values were originally highest in Hartford and lowest in the rural outlying towns, but over that time period the scenario was effectively reversed.
5 The term exurb stems from Spectorsky’s (1955) description of “extra-urban” communities. Nelson and Dueker (1990), among others, have defined the exurbs as a ring of generally affluent communities beyond the suburbs that remain commuter towns for an urban area.
6 Source: 2013–2017 American Community Survey 5-Year Estimates.7 Source: District Profile and Performance Report for School Year 2016–17. Edsight.ct.gov.
group of cities and towns referred to as the Sheff region, which encompasses an outer ring of ex-urbs. The Sheff region implicates the 32 munici-palities that are called upon to participate in its school desegregation remedy. The entire region is approximately 800 square miles.5
The Sheff region is shown in Figure 1, which conveys population densities among residents 18 years and younger (darker shades indicating higher populations) as well as the percentage of white children residing within those boundaries (the larger the circles, the higher the percentage of white children). Hartford is the most populous municipality in the region with approximately 32,000 children, and also one of the more diverse. It has the highest percentages of children of col-or (91%), most of whom identify as Black (42%) and Latino (44%).6 Hartford’s percentage of for-eign-born child population is 6.3% and its adult foreign-born population is considerably higher at nearly 27%. Hartford Public Schools’ popula-tion of English language learners was 18.6% and nearly three-quarters (71.4%) of its student body was eligible for free or reduced-price lunch.7 In contrast, the suburbs of Hartford, especially those in the “outer ring” exurbs of the Sheff re-gion, are distinctly whiter and wealthier.
RESEARCH AIMSThe study is motivated by the continued racial and economic school segregation of metro Hart-ford, which is reflected by intense patterns of residential segregation along the same lines. Per-nicious racial achievement gaps persist among

89Disparities in the Sheff Region
children and—fairly or unfairly—schools are con-tinually asked to close these gaps. The present analysis uses a spatial lens to examine various social elements within a fragmented geography that may be contributing to these gaps. It was guided by the question: How do municipalities in a metropolitan area compare along a broad set of social conditions that impact child learning and development? Through the use of mapping techniques, I model the interrelation among eco-nomic, health, housing, and education factors that are all too often looked at in isolation from each other.
METHODS AND DATA SOURCESIn accordance with social epidemiology case analysis (Tate & Striley 2010), I examine the geo-graphic distribution of various forms of capital associated with children in metro Hartford. The model draws upon geospatial analysis conducted
by Jones, Harris, and Tate (2015), which examined residential segregation, education, and health disparities in metro St. Louis. My analysis draws on multiple sources, including data from the US Census, Connecticut Department of Public Health, Connecticut Office of Policy and Man-agement, and Connecticut State Department of Education. The present case study is intended to inform policies that bear upon children’s devel-opment by understanding community resources and conditions from a wide-ranging, geopoliti-cal perspective. The modeling explores the rela-tionships between and among various housing, health, economic, and educational indicators.
The social epidemiology case analysis relies heavily on a series of maps produced by geo-graphic information systems (GIS) software. I used ArcMap 10.6 to generate the maps, geo-code addresses, and join multiple databases to the spatial data (Environmental Systems Re-search Institute 2018). I began the mapping pro-cess by accessing a Connecticut “municipality” polygon shapefile from the UCONN Map and Geographic Information Center. Geographic coordinates underlie the polygons that repre-sent municipalities across Connecticut. From this state map, I created a smaller basemap of metro Hartford by selecting the relevant munic-ipalities. I also added a line shapefile to portray major highways in the area. Each map below was created using the same metro Hartford basemap and then adding geospatial data linked to the municipalities (polygons).
FINDINGS AND DISCUSSION
Housing and Property as a ResourceLocal tax revenue is critical to supporting Con-necticut’s public schools, with 56.3% of the state’s public education funding deriving from local sources (US Census Bureau 2018). Local property
Figure 1. Total Population of Children (18 and under) and Percent White Children in Connecticut’s Sheff Re-gion. Source: 2010 US Census.

90 Cobb C.D. 2019
taxes are the major source of revenue for mu-nicipalities in Connecticut. Figure 2a displays the tax bases across the Sheff region, as represented by the 2015–16 equalized net grand list per cap-ita, which is a measure of taxable property ex-cluding exemptions permitted by statute. Hart-ford and New Britain have the lowest tax base per capita in the region. Other poor cities such as East Hartford, Manchester, and Vernon, also have a relatively low tax foundation on which to raise funds for local schools. In contrast, affluent suburban towns such as Avon, Farmington, and Glastonbury have substantially larger tax bases. The main reason for the low tax base in Hart-ford, like other cities, is due to the presence of
8 It should be noted that Connecticut, like other states, offers state aid on a sliding scale to municipalities (based on community wealth and student needs) to support public schools. That is one reason why Hartford’s 2018 average per pupil expenditure ($19,616) is above the state average ($16,988). (Source: ctschoolfinance.org)
hospitals, universities and colleges, an airport, a trash-to-energy plant, and various state office buildings in the state’s capital that make no local tax payments (Phineuf & Silber 2018).8
Figure 2b presents equalized mill rates against the backdrop of median home values in the Sheff region. In Connecticut, the mill rate represents the tax rate assessed on taxable property, where one mill is equal to 1/1000 of a dollar. In other words, mill rates are the amount of tax payable per $1,000 of value for a given property. Thus, a mill rate of 30 would mean that a house with an assessed value of $200,000 would require the owner to pay $6,000 in annual property taxes. The “equalized” mill rate represents a statewide adjustment for the different times in which mu-nicipalities conduct re-valuations of property; revaluations occur on a set schedule established by the state.
Unsurprisingly, the median home values show a similar distribution across the region as the equalized tax base (Figure 2a). The 2016 median home value in Hartford ($159,100) is nearly half that of adjacent West Hartford ($318,800). Figure 2b geographically illustrates the inverse relation-ship (r = -.50) between median home value and mill rate. That is, municipalities with low median home values have high mill rates, and vice ver-sa. These data indicate that citizens in property poor cities and towns must exert greater tax ef-fort to raise an equal amount of revenue as their wealthier counterparts.
Finally, the percentages of owner-occupied housing units are presented in Figure 2c. Owning a home has shown to be a major factor in achiev-ing economic upward mobility. As is the case in other poor urban communities in Connecticut,
Figure 2a. Taxable Property Per Capita (Equalized Net Grand List). 2015–16. Source: State of Connecticut Office of Policy and Management.

91Disparities in the Sheff Region
the percentage of Hartford residents who own their own home (23.7%) is considerably lower than most suburban towns (ranging 80%–92%). Neighboring West Hartford has roughly triple the percentage of homeowners, at 71.3%, than Hartford. East Hartford falls in between at 56.4%.
The Connecticut Fair Housing Center (2017) sponsored a study to explore how local zoning practices in suburban areas outside of Hartford influence the number of income-restricted hous-ing available. They found that municipalities with more restrictive zoning rules had fewer people of color as residents. In a separate study on dis-criminatory lending practices, the Center (2015) found that:
from 2010 to 2014, African-Americans and Latinos were denied home mort-gage loans more often than Whites, even when controlling for income.
Very high income African-Americans were more likely to be denied home purchase and refinance loans than low income whites. Mortgage lending ac-tivity is also depressed in racially di-verse and majority non-white neigh-borhoods. Regardless of race and income, applicants are less likely to obtain home loans in such areas.
In their follow up investigation, which relied on in-person appointments, email inquiries, and walk-in tests with bank loan officers, they found that every testing scenario evidenced differential treatment according to race (Connecticut Fair Housing Center 2017). More than half (53%) of the testers who were people of color were treat-ed less favorably than white testers.
The Open Communities Alliance conduct-ed an opportunity gap analysis via opportunity
Figure 2b. Median Home Value by Equalized Mill Tax Rate, 2012–16 (per $1,000 home value). Source: State of Connecticut Office of Policy and Management.
Figure 2c. Percent Owner Occupied Housing. 2012–16. Source: American Community Survey 5-Year Estimates.

92 Cobb C.D. 2019
mapping (Boggs & Dabrowski 2017).9 They cre-ated an Opportunity Index for each town in Con-necticut based on educational, economic, and housing quality indicators. The Alliance specif-ically examined government-sponsored subsi-dized housing and found that:
Approximately half of Latinos and Blacks in Connecticut reside in the 2% of the land area of the state assessed less likely to have access to opportu-nity structures like high performing schools, safe streets, and employment opportunities. Only 9% of Whites live in such areas. This deep level of seg-regation and opportunity isolation undergirds the web of structures that create some of the deepest racial op-portunity gaps in the country in ed-ucational, employment, health, and criminal justice outcomes. (Dabrowski 2017)
Family IncomeFigure 3 shows the intense concentrations of poverty in Hartford and New Britain, and to a lesser extent in smaller cities like East Hartford and Manchester. These poverty data are based on 5-year estimates (2012–2016) from the US Census American Community Survey (ACS), ta-ble B17001. The ACS provides estimations based on probabilistic sampling and, as such, there are margins of error associated with these esti-mates. Hartford has by far the largest percentage of households below the federal poverty line at 31.93% (±1.78% margin of error). Nearby West Hartford has a considerably smaller proportion at 7.69% (±1.13%). The state percentage of all households in poverty was 10.36% (±0.21%). However, child poverty is even worse across
9 For more on the opportunity mapping method, see Reece, Gambhir, Olinger, Martin, and Harris (2009).
Connecticut with 14.1% (±0.33) among children under 18 below the poverty line. Hartford’s child poverty rate is an alarming 43.17% (±3.06%). High concentrations of community poverty have known deleterious effects on child development and educational outcomes (Duncan & Brooks-Gunn 2000; Engle & Black 2008).
Child Health Outcomes and Access to HealthcarePer state statute, Connecticut public schools must collect data annually on students who have asth-ma. These data become part of the school Health Assessment Record and are reported to the state. Figure 4a displays childhood asthma rates calcu-lated for 2009–2012. Inspection of the map in-dicates urban communities in the Sheff region are disproportionately affected by child asth-ma. The three cities with the highest incidences
Figure 3. Percent of Households Below Federal Pover-ty Line, 2012–16. Source: American Community Survey 5-Year Estimates.

93Disparities in the Sheff Region
of childhood asthma are Hartford (24.0%), New Britain (27.1%), and Windsor (24.7%). The aver-age rate across the Sheff region is 14.5%. This dis-proportionate impact is not uncommon in urban areas elsewhere (Eggleston 2007). For instance, 18% of children in Washington, DC were reported to have asthma (the national rate is 9.5%). Sheff region cities with higher levels of child asthma appear to be located along interstate corridors. Indeed, there is some evidence connecting ma-jor highway pollution to increased asthma rates (Neidell 2004).
The Connecticut Department of Public Health requires physicians, by law, to screen children between 9 months and 35 months for lead ex-posure during annual checkups. Department of Public Health officials are to be alerted if a child has 5 or more micrograms of lead per deciliter of blood. At these levels, lead has been shown to negatively affect IQ, ability to focus, and school performance. The effects of lead exposure
cannot be reversed or remedied (Centers for Disease Control, n.d.). Figure 4b shows the per-centage of children with blood lead levels of 10 micrograms per deciliter (mpd) or more across the Sheff region. Windsor Locks, which is home to Bradley International Airport, had the highest rate, followed by several other Sheff cities on the eastern side. Research suggests a direct relation-ship between aviation fuel exposure and child blood lead levels (Miranda, Anthopolos, & Hast-ings 2011; Zahran, Iverson, McElmurry, & Weiler 2017). Generally speaking, the eastern side of the Sheff region is notably less affluent and more equally distributed among multiple ethnic identi-ties than the western side, which is predominant-ly white and middle to upper income.
Lastly, Figure 4c shows the geographic location of all pediatrician offices in the region against the backdrop of child population. The list of current-ly licensed pediatricians was obtained from the
Figure 4a. Child Asthma Rates, 2009–12. Source: Con-necticut Department of Public Health.
Figure 4b. Percent of Children Under 6 Years Old with > 10 MPD Blood Levels, 2009–12. Source: Connecticut Department of Public Health.

94 Cobb C.D. 2019
Connecticut Department of Public Health web-site. Their office addresses were downloaded and geocoded using ArcMap 10.6. Office locations are presented in the context of child population of each municipality to discern any patterns in under or over-representation.
The map shows the largest number of pediatric offices located in West Hartford and Farmington. Farmington is home to a major hospital, UConn Health, and thus likely experiences some physi-cian spillover effects. Very wealthy, but relatively low-populated rural-suburbs, such as Simsbury, Avon, and Glastonbury, appear to have a dis-proportionately higher number of pediatricians. A direct comparison of East and West Hartford shows a substantial difference in pediatric offic-es, with West Hartford home to 84 licensed pedi-atricians located at 72 unique offices. In contrast,
10 See http://www.hartford.gov/hhs/maternal-child-health.
only 3 pediatricians in 3 offices were listed in East Hartford. West Hartford may experience some level of a physician spillover effect from both Farmington’s UConn Health hospital and Hart-ford’s two major hospitals. It does not appear that East Hartford, however, experiences any spillover from the Hartford-based hospitals. East and West Hartford are of similar size in terms of child population, but East Hartford is consider-ably poorer (West Hartford’s median household income is nearly double that of East’s) and less white (with 35% of its residents being white com-pared to 73% in West Hartford).
Hartford is home to two major hospitals—in-cluding a Children’s Hospital—which may ex-plain the strikingly low number of pediatric offic-es according to Figure 4c. The very low number of pediatric offices in Hartford is somewhat mis-leading, however, given that over 40 licensed pediatricians work at 282 Washington Street, the address of Connecticut’s Children’s Medical Center. Notably, there are no pediatric offices listed in the database with addresses in the very poor neighborhoods, north of Interstate I-84. Hartford’s neighborhoods are fairly provincial, and, despite public transportation, research sug-gests mobility is restricted among high poverty families, which in turn, negatively impacts their access to healthcare (Giuliano 2005; Syed, Ger-ber, & Sharp 2013). A limitation of this map and inferences thereof may be the omission of child health services offered in locations not account-ed for by the Office of Public Health regulatory database. For instance, the city of Hartford offers a number of needs-based programs to support maternal and infant healthcare.10 Nonetheless, proximity and ready access to pediatricians are undoubtedly factors that disproportionately af-fect high poverty families and their children.
Figure 4c. Pediatric Offices and Child Population. Source: Connecticut Office of Public Health; 2010 US Census.

95Disparities in the Sheff Region
Education OutcomesThe percentages of kindergartners who attend-ed preschool in 2013–14 are presented in Figure 5a. Data are reported by parents during kinder-garten registration and collected annually by the Connecticut State Department of Education. The map reveals that very few communities had par-ticipation rates above 94%. A few, relatively afflu-ent rural towns on the outskirts had the highest pre-K participation rates (Somers, Tolland, and Canton). Hartford, East Hartford, and Manches-ter, among other higher-poverty municipalities, exhibited preschool participation rates on the lower end, between 50–72%. Research demon-strates the advantages that preschool provides to children in later elementary grades (see, e.g., Magnuson, Ruhm, & Waldfogel 2007). Urban, poor districts in the Sheff region do not offer pre-K experiences at the same rate as their sub-urban counterparts.
Reading proficiency, particularly in the early elementary grades, is highly predictive of future academic performance (Duncan, Dowsett, Claes-sens, Magnuson, Huston, Klebanov, & Sexton 2007). Results from the 2016–17 Connecticut state reading exam are presented in Figure 5b. The map shows the percentage of students scor-ing at level 3 or 4 (the top two highest perfor-mance categories).11 The distribution across the Sheff region is indicative of Connecticut’s now oft-reported achievement gap. Disparities in ac-ademic performance between wealthy, primarily white communities and poorer communities of color are stark.
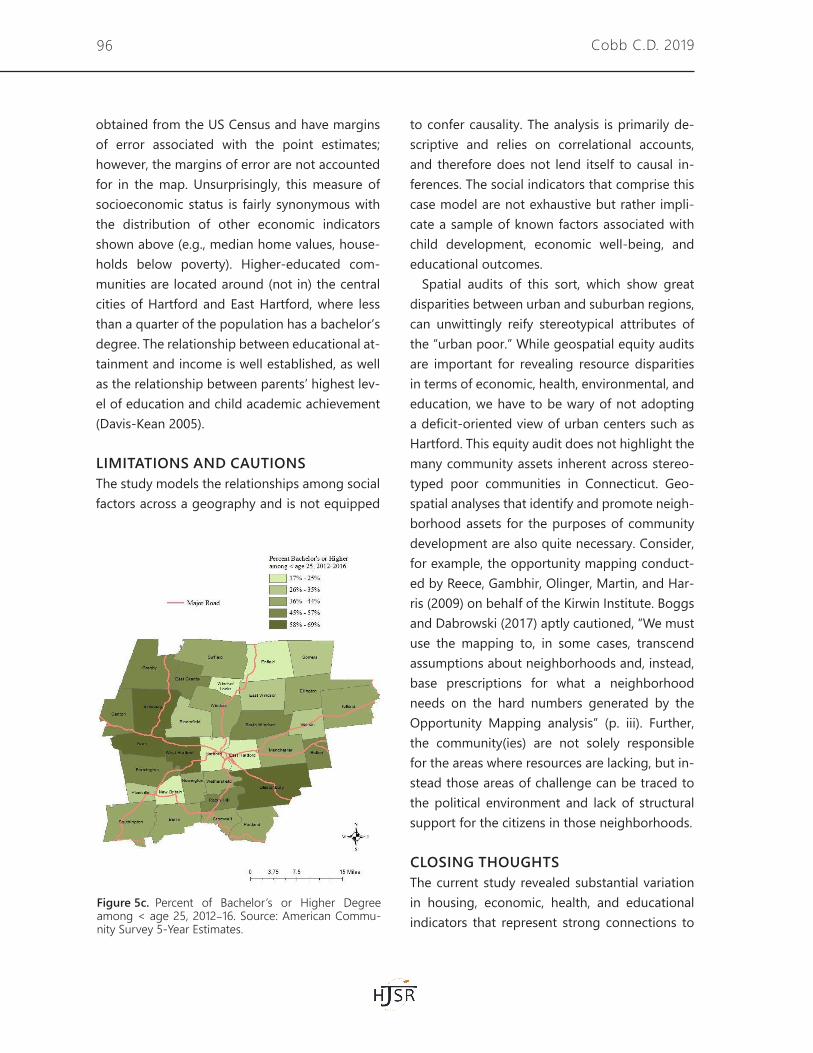
Finally, the percentage of adults 25 years and older who obtained at least a bachelor’s degree are presented in Figure 5c. These data were
11 These data derive from public school districts, which in Connecticut are typically contiguous with town and city boundaries. However, these exam data do not represent the entire population of resident grade 4 students because a handful of charter schools and magnet schools are not included here--only the exam data reported by school districts not home to charters and magnets.
Figure 5a. Percent of Children with PreK Experience, 2013–14. Source: Connecticut Department of Education.
Figure 5b. Percent Scoring Proficient or Higher on 4th Grade ELA Exam, 2016–17. Source: Connecticut Depart-ment of Education.
96 Cobb C.D. 2019
obtained from the US Census and have margins of error associated with the point estimates; however, the margins of error are not accounted for in the map. Unsurprisingly, this measure of socioeconomic status is fairly synonymous with the distribution of other economic indicators shown above (e.g., median home values, house-holds below poverty). Higher-educated com-munities are located around (not in) the central cities of Hartford and East Hartford, where less than a quarter of the population has a bachelor’s degree. The relationship between educational at-tainment and income is well established, as well as the relationship between parents’ highest lev-el of education and child academic achievement (Davis-Kean 2005).
LIMITATIONS AND CAUTIONSThe study models the relationships among social factors across a geography and is not equipped
to confer causality. The analysis is primarily de-scriptive and relies on correlational accounts, and therefore does not lend itself to causal in-ferences. The social indicators that comprise this case model are not exhaustive but rather impli-cate a sample of known factors associated with child development, economic well-being, and educational outcomes.
Spatial audits of this sort, which show great disparities between urban and suburban regions, can unwittingly reify stereotypical attributes of the “urban poor.” While geospatial equity audits are important for revealing resource disparities in terms of economic, health, environmental, and education, we have to be wary of not adopting a deficit-oriented view of urban centers such as Hartford. This equity audit does not highlight the many community assets inherent across stereo-typed poor communities in Connecticut. Geo-spatial analyses that identify and promote neigh-borhood assets for the purposes of community development are also quite necessary. Consider, for example, the opportunity mapping conduct-ed by Reece, Gambhir, Olinger, Martin, and Har-ris (2009) on behalf of the Kirwin Institute. Boggs and Dabrowski (2017) aptly cautioned, “We must use the mapping to, in some cases, transcend assumptions about neighborhoods and, instead, base prescriptions for what a neighborhood needs on the hard numbers generated by the Opportunity Mapping analysis” (p. iii). Further, the community(ies) are not solely responsible for the areas where resources are lacking, but in-stead those areas of challenge can be traced to the political environment and lack of structural support for the citizens in those neighborhoods.
CLOSING THOUGHTSThe current study revealed substantial variation in housing, economic, health, and educational indicators that represent strong connections to
Figure 5c. Percent of Bachelor’s or Higher Degree among < age 25, 2012–16. Source: American Commu-nity Survey 5-Year Estimates.

97Disparities in the Sheff Region
child development and learning. School deseg-regation through controlled school choice pro-grams and magnet schools remains one of the few viable policies to break up concentrations of poverty that disproportionately affect urban students of color. Students of all racial and eco-nomic backgrounds who attend diverse schools benefit in a variety of ways, including expanded access to social networks, stronger intergroup relations, increased academic achievement, and enhanced life trajectories (Linn & Welner 2007; Mickelson 2008). One might speculate that a second, grander purpose of school desegrega-tion is to break the pernicious cycle of poverty by prompting upward economic mobility among those marginalized.
School desegregation policies alone, how-ever, are limited in their ability to diversify the residential neighborhoods and communities in which they operate. Housing integration pol-icies, such as housing-voucher programs and mixed residential development projects, have been called on to pursue such goals. Other com-munity-based development projects, such as the Chicago Area Project and the Harlem Chil-dren’s Zone, take a comprehensive and integrat-ed approach to neighborhood revival —tapping into social, economic, health, and education re-sources to support not just students, but entire living spaces.
A spatial lens highlights the sharp contrasts in resources and outcomes across a deeply frag-mented and stratified metropolitan Hartford. The visual data are troubling, but the hope is that a more holistic accounting of disparities in neighborhood features will spur policy reform efforts that go beyond solely the education do-main. Strategies to integrate our society and break down the unremitting concentrations of urban poverty call for a broad range of solutions that collectively and comprehensively address
housing, labor, health, and education. Coopera-tive initiatives such as the multifaceted effort of the Connecticut Interagency Council for Ending the Achievement Gap (ct.gov) are encouraging, as are explorations to regionalize services in a socially stratified region heavily fragmented by many small cities and towns. So, too, are efforts to bring together coordinated efforts in child health care, such as those proposed by Dworkin, Honigfeld, and Meyers (2009). Indeed, cross-sec-tor, integrated policy strategies are required to reverse the insidious cycle of poverty that dis-parately impacts children of color and families in poverty.
REFERENCESBasch, C. E. 2011. “Asthma and the achievement gap
among urban minority youth.” Journal of School Health 81:606–613
Berliner, D. C. 2009. “Poverty and potential: Out-of-school factors and school success.”
Boulder and Tempe: Education and the Public In-terest Center & Education Policy Research Unit. Re-trieved [August 23, 2018] from http://epicpolicy.org/publication/poverty-and-potential
Bifulco, R., Cobb, C. D., & Bell, C. 2009. “Can interdis-trict choice boost student achievement? The case of Connecticut’s interdistrict magnet school pro-gram.” Educational Evaluation and Policy Analysis 31(4):323–345.
Black, S. E. 1999. “Do better schools matter? Parental valuation of elementary education.” The Quarterly Journal of Economics 114(2):577–599.
Boggs, E., & Dabrowski, L. 2017 “Out of balance: Sub-sidized housing, segregation, and opportunity in Connecticut.” Open Communities Alliance. Re-trieved from http://www.ctoca.org/outofbalance
Boudreaux, M. H., Golberstein, E., & McAlpine, D. D. 2016. “The long-term impacts of Medicaid expo-sure in early childhood: Evidence from the pro-gram’s origin.” Journal of health economics 45:161–175.
Brooks-Gunn, J., Duncan, G. J., & Aber, J. L. (Eds.). 1997. “Neighborhood poverty: Context and consequenc-es for children” (1). New York, NY: Russell Sage Foundation.
Canfield, R. L., Henderson Jr, C. R., Cory-Slechta, D. A., Cox, C., Jusko, T. A., & Lanphear, B. P. 2003. “In-tellectual impairment in children with blood lead
98 Cobb C.D. 2019
concentrations below 10 μg per deciliter.” New En-gland Journal of Medicine 348(16):1517–1526.
Centers for Disease Control (n.d.). Blood lead levels in children. What do parents need to know to protect their children? Fact Sheet. Retrieved from https://www.cdc.gov/nceh/lead/acclpp/lead_levels_in_children_fact_sheet.pdf
Chetty, R., Hendren, N., & Katz, L. F. 2016. “The effects of exposure to better neighborhoods on children: New evidence from the Moving to Opportunity experiment.” American Economic Review 106(4):855–902.
Children’s National Health System. 2014. “Unmanaged asthma takes its toll on low-income DC children and families.” Retrieved from https://childrensnational.org/news-and-events/childrens-newsroom/2014/unmanaged-asthma-takes-its-toll-on-lowincome-dc-children-and-families
Clapp, J. M., Nanda, A., & Ross, S. L. 2008. “Which school attributes matter? The influence of school district performance and demographic composi-tion on property values.” Journal of Urban Econom-ics, 63(2):451–466.
Cohodes, S., Grossman, D., Kleiner, S., & Lovenheim. M. F. 2014. “The effect of child health insurance access on schooling: Evidence from public insur-ance expansions” NBER Working Paper No. 20178. Cambridge, MA: National Bureau of Economic Re-search.
Condon, T. 2018. “Amid fiscal perils, will the state em-brace regionalism?” The CT Mirror. Retrieved from https://ctmirror.org/
Connecticut Fair Housing Center 2015. “Where Can We Go From Here: The Results of Three Years of Fair Housing Testing in Connecticut.” Retrieved from https://www.ctfairhousing.org/guides-and-reports/
Connecticut Fair Housing Center. 2017. “Are Local Land Use Policies and Practices Contributing to Hous-ing Segregation in the Hartford MSA?” Retrieved from https://www.ctfairhousing.org/guides-and-reports/
Connecticut Fair Housing Center. 2018. “2016–2017 Mortgage Lending Testing Report.” Retrieved from https://www.ctfairhousing.org/guides-and-re-ports/
Connecticut State Department of Education. 2018. “Summary of All Hartford-Resident, Minority, PK–12 Students Enrolled in Reduced-Isolation Settings.” Retrieved from https://assets.documentcloud.org/documents/5668774/2018-19-Data-for-Sheff.pdf
Cookson, C. 2008. “Poverty mars formation of infant brains.” Financial Times, 6545–6549.
Currie, J. 2005. “Health disparities and gaps in school readiness.” The Future of Children 117–138.
Dabrowski, L. 2017. “Open Communities Alliance” (Publications webpage). Retrieved from http://www.ctoca.org/outofbalance
Davis-Kean, P. E. 2005. “The influence of parent ed-ucation and family income on child achievement: the indirect role of parental expectations and the home environment.” Journal of Family Psychology 19(2):294
Dougherty, J., & contributors. 2018. “On the line: How schooling, housing, and civil rights shaped Hart-ford and its suburbs.” Trinity College, book-in-prog-ress. Retrieved from http://ontheline.trincoll.edu
Dougherty, J., Estevez, N., Wanzer, J., Tatem, D., Bell, C., Cobb, C. D., & Esposito, C. 2006. “A visual guide to Sheff vs. O’Neill school desegregation.” Cities, Sub-urbs, and Schools Research Project at Trinity College and the UConn Center for Education Policy Analysis.
Dougherty, J., & Lassiter, M. 2012. “Shopping for schools: How public education and private housing shaped suburban Connecticut.” Journal of Urban History, 38(2):205–224.
Duncan, G. J., & Brooks-Gunn, J. 2000. “Family poverty, welfare reform, and child development.” Child De-velopment 71(1):188–196.
Duncan, G. J., Dowsett, C. J., Claessens, A., Magnuson, K., Huston, A. C., Klebanov, P., & Sexton, H. 2007. “School readiness and later achievement.” Devel-opmental Psychology 43(6):1428.
Duncan, G., & Raudenbush, S. 2001. “Neighborhoods and adolescent development: How can we deter-mine the links?” Does it take a village? Community effects on children, adolescents, and families, edited by Alan Booth and Ann C. Crouter, State College: Pennsylvania State University Press. 105–36
Dworkin, P., Honigfeld, L., Meyers, J. 2009. “A frame-work for child health services: Supporting the healthy development and school readiness of Con-necticut’s children.” Child Health and Development Institute.
Ellsworth, S. S. 2013. “CREC student achievement overview.” Hartford, CT: Capitol Region Education Council.
Engle, P. L., & Black, M. M. 2008. “The effect of pov-erty on child development and educational out-comes.” Annals of the New York Academy of Scienc-es 1136(1):243–256
Environmental Systems Research Institute. 2018. “Arc-GIS 10.6. Redlands” CA: Author.
Eggleston, P. A. 2007. “The environment and asthma in US inner cities.” Chest 132(5):782S–788S.
Fiscella, K., & Kitzman, H. 2009. “Disparities in aca-demic achievement and health: the intersection of child education and health policy.” Pediatrics, 123(3):1073–1080.
Gooch, J. K. 2003. “Fenced In: Why Sheff v. O’Neill

99Disparities in the Sheff Region
can’t save Connecticut’s inner city students.” QLR, 22, 395.
Giuliano, G. 2005. “Low income, public transit, and mo-bility.” Transportation Research Record 1927(1):63–70.
Gorman, B. K., & Braverman, J. 2008. “Family structure differences in health care utilization among US chil-dren.” Social Science & Medicine 67(11):1766–1775.
Janus, M., & Duku, E. 2007. “The school entry gap: So-cioeconomic, family, and health factors associated with children’s school readiness to learn.” Early Ed-ucation and Development 18(3):375–403.
Jencks, C., & Mayer, S. E. 1990. “The social conse-quences of growing up in a poor neighborhood. Inner-City Poverty in the United States, edited by Lawrence Lynn and Michael McGreary, Washing-ton, D.C.: National Academies Press. 111–86.
Jones B. D., Harris K. D., & Tate W. F. 2015. “Ferguson and beyond: A descriptive epidemiological study using geospatial analysis.” Journal of Negro Educa-tion 84(3):231–253.
Kenyon, D. A. 2007. “The property tax, school funding dilemma.” Lincoln Institute of Land Policy.
Hsu, J., Qin, X., Beavers, S. F., & Mirabelli, M. C. 2016. “Asthma-related school absenteeism, morbidity, and modifiable factors.” American journal of pre-ventive medicine 51(1):23–32.
Leventhal, T., & Brooks-Gunn, J. 2000. “The neighbor-hoods they live in: The effects of neighborhood residence on child and adolescent outcomes.” Psy-chological Bulletin 126(2), 309–337.
Linn, R. L., & Welner, K. G. 2007. “Race-conscious policies for assigning students to schools: Social science research and the Supreme Court cases.” Committee on Social Science Research Evidence on Racial Diversity in Schools. National Academy of Education (NJ1).
Magnuson, K. A., Ruhm, C., & Waldfogel, J. 2007. “The persistence of preschool effects: Do subsequent classroom experiences matter?” Early Childhood Re-search Quarterly 22(1):18–38.
Mensah, Y. M., Schoderbek, M. P., & Sahay, S. P. 2013. “The effect of administrative pay and local proper-ty taxes on student achievement scores: Evidence from New Jersey public schools.” Economics of Ed-ucation Review, 34:1–16.
Michael, S. L., Merlo, C. L., Basch, C. E., Wentzel, K. R., & Wechsler, H. 2015. “Critical connections: Health and academics.” Journal of School Health, 85(11):740–758.
Mickelson, R. A. 2008. “Twenty-first century social science on school racial diversity and educational outcomes.” Ohio St. LJ, 69:1173.
Miranda, M. L., Anthopolos, R., & Hastings, D. 2011. “A geospatial analysis of the effects of aviation gaso-
line on childhood blood lead levels.” Environmental Health Perspectives 119(10):1513–1516
Miranda, M. L., Kim, D., Galeano, M. A. O., Paul, C. J., Hull, A. P., & Morgan, S. P. 2007. “The relationship between early childhood blood lead levels and performance on end-of-grade tests.” Environmen-tal Health Perspectives 115(8):1242–1247.
Miranda, M. L., Kim, D., Reiter, J., Galeano, M. A. O., & Maxson, P. 2009. “Environmental contribu-tors to the achievement gap.” Neurotoxicology 30(6):1019–1024.
Neidell, M. J. 2004. “Air pollution, health, and so-cio-economic status: The effect of outdoor air quality on childhood asthma.” Journal of health economics 23(6):1209–1236.
Nelson, A. C., & Dueker, K. J. 1990. “The exurbaniza-tion of America and its planning policy implica-tions.” Journal of Planning Education and Research 9 2:91–100.
Nguyen-Hoang, P., & Yinger, J. 2011. “The capitaliza-tion of school quality into house values: A review.” Journal of Housing Economics 20(1):30–48.
Orfield, G., Ee, J., Frankenberg, E., & Siegel-Hawley, G. 2016. ““Brown” at 62: School segregation by race, poverty and state.” Civil Rights Project-Proyecto Derechos Civiles.
Owens, A., Reardon, S. F., & Jencks, C. 2016. “Income segregation between schools and school districts.” American Educational Research Journal 53(4):1159–1197.
Phineuf, K. M., & Silber, C. 2018. “Among Connecti-cut cities and towns, the wealthiest are the big spenders.” Retrieved from https://ctmir-ror.org/2018/05/30/among-connecticut-cit-ies-towns-wealthiest-big-spenders/
Rabe Thomas, J. 2013. “Nation’s Report Card: CT con-tinues to show largest achievement gap.” The CT Mirror. Retrieved from https://ctmirror.org/
Rabe Thomas, J. 2018. “Do magnet schools need white students to be great?” The CT Mirror. Retrieved from https://ctmirror.org/
Rabe Thomas, J., & Kara, J. 2018. “CT’s performance on ‘Nation’s Report Card’ doesn’t budge.” The CT Mirror. Retrieved from https://ctmirror.org/
Reardon, S. F., Kalogrides, D., & Shores, K. 2018. “The geography of racial/ethnic test score gaps” (CEPA Working Paper No.16–10). Retrieved from Stanford Center for Education Policy Analysis: http://cepa.stanford.edu/wp16-10
Reece, J., Gambhir, S., Olinger, J., Martin, M., & Harris, M. 2009. “People, place and opportunity: Mapping communities of opportunity in Connecticut.” Kir-wan Institute for the Study of Race And Ethnicity, Ohio State University, US.
Retsinas, N. P., & Belsky, E. S. (Eds.). 2004. “Low-income

100 Cobb C.D. 2019
homeownership: Examining the unexamined goal.” Brookings Institution Press.
Rubinowitz, L. S., & Rosenbaum, J. 2000. “Crossing the class and color lines: From public housing to white suburbia.” Chicago: University of Chicago Press.
Sampson, R. J., Morenoff, J. D., & Gannon-Rowley, T. 2002. “Assessing ‘neighborhood effects’: Social processes and new directions in research.” Annual Review of Sociology 2:443–78.
Sampson, R. J., Sharkey, P., & Raudenbush, S. 2008. “Durable effects of concentrated disadvantage on verbal ability among African-American children.” Proceedings of the National Academy of Sciences 105:845–52.
Sheff v. O’Neill. 2003. Sheff v. O’Neill Settlement. OLR Research Report. Retrieved from https://www.cga.ct.gov/2003/olrdata/ed/rpt/2003-R-0112.htm
Spectorsky, A. C. 1955. “The exurbanites.” Philadelphia: Lippincott.
Syed, S. T., Gerber, B. S., & Sharp, L. K. 2013. “Trav-eling towards disease: transportation barriers to health care access.” Journal of Community Health 38(5):976–993.
Tamas, A., Whitehorse, Y., & Almonte, O. 2000. “Sys-tem theory in community development.” White-horse, Yukon and Almonte http://www.Tamas.com/samples/source-docs/System_Theory_in_CD.pdf, Re-trieved August 20, 2018
Tate W. F., & Striley C. 2010. “Epidemiology and educa-
tion research: Dialoguing about disparities.” Teach-ers College Record. Retrieved from http://www.tcre-cord.org/Content.asp?ContentId=16036
Torre, V. 2017. “Left Behind: 20 Years after Sheff v. O’Neill, students struggle in Hartford’s segregat-ed neighborhood schools.” Retrieved from http://www.courant.com/education/hc-sheff-left-be-hind-day-1-20170319-story.html
Turner, T. M., & Luea, H. 2009. “Homeownership, wealth accumulation and income status.” Journal of Housing Economics 18(2):104–114.
U.S. Census Bureau. 2018. “Table 1: Summary of Pub-lic Elementary-Secondary School System Finances by State: Fiscal Year 2016.” 2016 Annual Survey of School System Finances. Washington, DC: Author. Available from https://www2.census.gov/pro-grams-surveys/school-finances/tables/2016/sec-ondary-education-finance/elsec16_sumtables.xls.
Wells, A. S., Baldridge, B. J., Duran, J., Grzesikowski, C., Lofton, R., Roda, A., & White, T. 2009. “Boundary crossing for diversity, equity and achievement: In-terdistrict school desegregation and educational opportunity.” Cambridge, MA: Charles Hamilton Houston Institute for Race and Justice at Harvard Law School.
Zahran, S., Iverson, T., McElmurry, S. P., & Weiler, S. 2017. “The effect of leaded aviation gasoline on blood lead in children.” Journal of the Association of Environmental and Resource Economists 4(2):575–610.
ABOUT THE AUTHORCasey D. Cobb is the Raymond Neag Professor of Educational Policy at the Neag School of Education at the University of Connecticut. Dr. Cobb is a National Education Policy Fellow and a member of the University Council for Educational Administration (UCEA) Executive Committee. His current research interests include policies on school choice, accountability, and school reform, where he examines the implications for equity and educational opportunity.