A Genus Definition for Bacteria and Archaea Based on a ...A Genus Definition for Bacteria and...
20
A Genus Definition for Bacteria and Archaea Based on a Standard Genome Relatedness Index R. A. Barco, a,b,e G. M. Garrity, c J. J. Scott, d J. P. Amend, a,b K. H. Nealson, a,b D. Emerson e a Department of Earth Sciences, University of Southern California, Los Angeles, California, USA b Department of Biological Sciences, University of Southern California, Los Angeles, California, USA c Department of Microbiology and Molecular Genetics, Michigan State University, East Lansing, Michigan, USA d Smithsonian Tropical Research Institute, Panama, Republic of Panama e Bigelow Laboratory for Ocean Sciences, East Boothbay, Maine, USA ABSTRACT Genus assignment is fundamental in the characterization of microbes, yet there is currently no unambiguous way to demarcate genera solely using stan- dard genomic relatedness indices. Here, we propose an approach to demarcate gen- era that relies on the combined use of the average nucleotide identity, genome alignment fraction, and the distinction between type- and non-type species. More than 3,500 genomes representing type strains of species from 850 genera of either bacterial or archaeal lineages were tested. Over 140 genera were analyzed in detail within the taxonomic context of order/family. Significant genomic differences be- tween members of a genus and type species of other genera in the same order/ family were conserved in 94% of the cases. Nearly 90% (92% if polyphyletic genera are excluded) of the type strains were classified in agreement with current taxon- omy. The 448 type strains that need reclassification directly impact 33% of the gen- era analyzed in detail. The results provide a first line of evidence that the combina- tion of genomic indices provides added resolution to effectively demarcate genera within the taxonomic framework that is currently based on the 16S rRNA gene. We also identify the emergence of natural breakpoints at the genome level that can fur- ther help in the circumscription of taxa, increasing the proportion of directly im- pacted genera to at least 43% and pointing at inaccuracies on the use of the 16S rRNA gene as a taxonomic marker, despite its precision. Altogether, these results suggest that genomic coherence is an emergent property of genera in Bacteria and Archaea. IMPORTANCE In recent decades, the taxonomy of Bacteria and Archaea, and there- fore genus designation, has been largely based on the use of a single ribosomal gene, the 16S rRNA gene, as a taxonomic marker. We propose an approach to delin- eate genera that excludes the direct use of the 16S rRNA gene and focuses on a standard genome relatedness index, the average nucleotide identity. Our findings are of importance to the microbiology community because the emergent properties of Bacteria and Archaea that are identified in this study will help assign genera with higher taxonomic resolution. KEYWORDS ANI, Bacillus, Clostridium, Lactobacillus, Photorhabdus, Pseudomonas, Xenorhabdus, delineation, demarcation, genus, systematics, taxonomy A t the time of writing, 20,768 bacterial and archaeal species/subspecies and over 3,500 genera with validly published names have been described in the taxonomic literature (1); however, based on a 16S rRNA guided-phylogenetic approach, there are over 200,000 bacterial and archaeal species and 60,000 genera so far detected in the SILVA database (2, 3). Sequence data stored in the Joint Genome Institute (JGI) Citation Barco RA, Garrity GM, Scott JJ, Amend JP, Nealson KH, Emerson D. 2020. A genus definition for Bacteria and Archaea based on a standard genome relatedness index. mBio 11:e02475-19. https://doi.org/10.1128/mBio .02475-19. Editor Stephen J. Giovannoni, Oregon State University Copyright © 2020 Barco et al. This is an open- access article distributed under the terms of the Creative Commons Attribution 4.0 International license. Address correspondence to R. A. Barco, [email protected]. This article is contribution 498 from C-DEBI. Román Barco dedicates this paper to his late mother, Martha Beatriz Arrieta Céspedes, who always supported his path to science. Received 18 September 2019 Accepted 25 November 2019 Published RESEARCH ARTICLE Ecological and Evolutionary Science January/February 2020 Volume 11 Issue 1 e02475-19 ® mbio.asm.org 1 14 January 2020 on May 17, 2020 by guest http://mbio.asm.org/ Downloaded from
Transcript of A Genus Definition for Bacteria and Archaea Based on a ...A Genus Definition for Bacteria and...
A Genus Definition for Bacteria and Archaea Based on aStandard Genome Relatedness Index
R. A. Barco,a,b,e G. M. Garrity,c J. J. Scott,d J. P. Amend,a,b K. H. Nealson,a,b D. Emersone
aDepartment of Earth Sciences, University of Southern California, Los Angeles, California, USAbDepartment of Biological Sciences, University of Southern California, Los Angeles, California, USAcDepartment of Microbiology and Molecular Genetics, Michigan State University, East Lansing, Michigan, USAdSmithsonian Tropical Research Institute, Panama, Republic of PanamaeBigelow Laboratory for Ocean Sciences, East Boothbay, Maine, USA
ABSTRACT Genus assignment is fundamental in the characterization of microbes,yet there is currently no unambiguous way to demarcate genera solely using stan-dard genomic relatedness indices. Here, we propose an approach to demarcate gen-era that relies on the combined use of the average nucleotide identity, genomealignment fraction, and the distinction between type- and non-type species. Morethan 3,500 genomes representing type strains of species from �850 genera of eitherbacterial or archaeal lineages were tested. Over 140 genera were analyzed in detailwithin the taxonomic context of order/family. Significant genomic differences be-tween members of a genus and type species of other genera in the same order/family were conserved in 94% of the cases. Nearly 90% (92% if polyphyletic generaare excluded) of the type strains were classified in agreement with current taxon-omy. The 448 type strains that need reclassification directly impact 33% of the gen-era analyzed in detail. The results provide a first line of evidence that the combina-tion of genomic indices provides added resolution to effectively demarcate generawithin the taxonomic framework that is currently based on the 16S rRNA gene. Wealso identify the emergence of natural breakpoints at the genome level that can fur-ther help in the circumscription of taxa, increasing the proportion of directly im-pacted genera to at least 43% and pointing at inaccuracies on the use of the 16SrRNA gene as a taxonomic marker, despite its precision. Altogether, these resultssuggest that genomic coherence is an emergent property of genera in Bacteria andArchaea.
IMPORTANCE In recent decades, the taxonomy of Bacteria and Archaea, and there-fore genus designation, has been largely based on the use of a single ribosomalgene, the 16S rRNA gene, as a taxonomic marker. We propose an approach to delin-eate genera that excludes the direct use of the 16S rRNA gene and focuses on astandard genome relatedness index, the average nucleotide identity. Our findingsare of importance to the microbiology community because the emergent propertiesof Bacteria and Archaea that are identified in this study will help assign genera withhigher taxonomic resolution.
KEYWORDS ANI, Bacillus, Clostridium, Lactobacillus, Photorhabdus, Pseudomonas,Xenorhabdus, delineation, demarcation, genus, systematics, taxonomy
At the time of writing, 20,768 bacterial and archaeal species/subspecies and over3,500 genera with validly published names have been described in the taxonomic
literature (1); however, based on a 16S rRNA guided-phylogenetic approach, there areover 200,000 bacterial and archaeal species and 60,000 genera so far detected in theSILVA database (2, 3). Sequence data stored in the Joint Genome Institute (JGI)
Citation Barco RA, Garrity GM, Scott JJ, AmendJP, Nealson KH, Emerson D. 2020. A genusdefinition for Bacteria and Archaea based on astandard genome relatedness index. mBio11:e02475-19. https://doi.org/10.1128/mBio.02475-19.
Editor Stephen J. Giovannoni, Oregon StateUniversity
Copyright © 2020 Barco et al. This is an open-access article distributed under the terms ofthe Creative Commons Attribution 4.0International license.
Address correspondence to R. A. Barco,[email protected].
This article is contribution 498 from C-DEBI.
Román Barco dedicates this paper to his latemother, Martha Beatriz Arrieta Céspedes, whoalways supported his path to science.
Received 18 September 2019Accepted 25 November 2019Published
RESEARCH ARTICLEEcological and Evolutionary Science
January/February 2020 Volume 11 Issue 1 e02475-19 ® mbio.asm.org 1
14 January 2020
on May 17, 2020 by guest
http://mbio.asm
.org/D
ownloaded from
database, which includes data from other databases, have increased exponentially overthe past decade (4), with �76,000 genomes of bacterial and archaeal isolates, �9,000metagenome-assembled genomes, and �4,000 single-cell amplified genomes beingcurrently available (database accessed on 10 November 2019). There are �210,000genome assemblies in GenBank (database accessed on 10 November 2019). Despite theincreasing number of genomes, there were only �2,000 genomes of type strains thatwere publicly available at the start of this study, with 1,003 of these genomes onlyrecently published (5). Currently, there are �9,000 nonredundant genomes of typestrains that are publicly available (1). The number of genomes of type strains ispresently increasing by over 1,000 per year, with recent plans to increase this numbersubstantially (6); therefore, it is becoming easier to access data that represent taxa ofinterest. Consequently, this added layer of available information could aid in the formalcharacterization of microorganisms, of which an essential aspect is the proper assign-ment of genus and species (rule 12a of the International Code of Nomenclature ofProkaryotes [ICNP] [7]).
Historically, DNA-DNA hybridization (DDH) has been the “gold standard” for speciesdelineation, with a DDH value of �70% being recognized as the species boundarybetween two strains (see reference 8 and other references therein). Stackebrandt andGoebel (9) conducted a correlation analysis between DDH values and 16S rRNA genesequence identities, and based on this, they proposed a boundary of 16S rRNA genesequence similarity of 97% for species delineation. This value, which is still largely usedtoday for operational taxonomic unit (OTU)-based analysis of microbial communities,has been updated by Stackebrandt and Ebers (10) to a value between 98.7 and 99.0%,based on a greater amount of available sequence data. Subsequently, as genomesequencing has become common, whole-genome comparisons became possible, lead-ing to the advent of genome relatedness indices such as average nucleotide identity(ANI) (11), amino acid identity (AAI) (12), and digital DDH (13). More recently, Kim et al.(14) proposed a 16S rRNA gene sequence similarity threshold value of 98.65% forspecies delineation, equating to ANI values of 95 to 96%, which in turn have beenequated to the classical standard species delineation threshold DDH value of 70% (15,16). A method that only relies on protein-coding genes (i.e., neither rRNA nor tRNAgenes are included in analysis) is the Microbial Species Identifier (MiSI), which employsboth alignment fractions (AF) and ANI for demarcation of species, recommendingthreshold AF and ANI values of 0.6 and 96.5% using complete or nearly completegenomes (17).
Despite these advancements in resolving species delineation, practical guidelinesthat incorporate genomic properties to demarcate genera have been lacking eventhough genus assignment is key to performing meaningful comparisons regarding thephysiology, metabolism, and genomic potential of microbes. Methods to demarcategenera have been proposed that are based on either AAI (18) or the percentage ofconserved proteins (POCP; 19). The former method provided a range of AAI values (65to 72%) that were originally obtained by correlation to a now-outdated 16S rRNA geneidentity threshold for genus. The POCP method directly relies on the 16S rRNA genesequence, which is in some cases insensitive to evolutionary changes in the rest of thegenome of a given organism, as revealed by different species sharing �99% identityover the length of this gene. This method also arbitrarily sets a genus boundary at aPOCP value of 50%. Additionally, the generally used arbitrary genus threshold of 95%16S rRNA gene identity has been recently revisited to a lower minimum value of 94.5%,with a median sequence identity of 96.4% and confidence interval of 94.55 to 95.05%(3). In borderline cases, interpretation of results may be unclear if there are noalternative ways to confirm genus assignment. This is also the case for microorganismswith multiple highly divergent 16S rRNA genes (20, 21). More recently, a taxonomy forBacteria based on highly conserved protein-concatenated phylogeny and the normal-ization of ranks has been proposed (22). This normalized taxonomy uses �4% of agenome and directly relies on values of relative evolutionary divergence, a nonstandardindex. Here, we propose a novel approach that builds on the MiSI method (17) and
Barco et al. ®
January/February 2020 Volume 11 Issue 1 e02475-19 mbio.asm.org 2
on May 17, 2020 by guest
http://mbio.asm
.org/D
ownloaded from

provides an objective, mathematically sound, and reproducible method of delimitinggenera using whole-genome sequences and ANI, a standard genome relatedness index.In addition to identifying genus boundaries, we introduce the concept of the genusinflection point. We implement this approach by testing a variety of taxonomic groupsof Bacteria and Archaea. Furthermore, evidence is presented to support the extensiverearrangement of Bacillus, Clostridium, Lactobacillus, and Photorhabdus, among othertaxa, using a standard genomic index.
(An earlier version of this article was submitted to an online preprint archive [23].)
RESULTS AND DISCUSSIONGeneral assessment. A total of 3,525 genomes of nonredundant species represent-
ing 858 genera in 13 different phyla were used (see Data Set S1 in the supplementalmaterial); 3,331 of these genomes were of type strains, with the rest belonging tospecies that are �99% identical in 16S rRNA gene sequence to a type strain. Genusdemarcation boundaries were determined for each of the 144 genera that wereanalyzed in detail, at the taxonomic resolution of order/family (Data Set S2A). A subtotalof 3,077 of the species (�87%) were delineated in agreement with current taxonomy,following AF and ANI analyses, specifically the genus demarcation boundary. This valueincreases to 92% if known polyphyletic genera (e.g., Bacillus, Clostridium, Lactobacillus,and Pseudomonas) are excluded. These polyphyletic genera had the greatest number ofnon-type species at or below the genus demarcation boundary. In terms of disagree-ment with current taxonomy, Desulfovibrio had the highest proportion of non-typespecies at or below the genus demarcation boundary, indicating substantial taxonomicissues with this genus as well.
The AF and ANI means of the type and non-type species clusters were significantlydifferent (P � 0.0001) at the taxonomic level of domain for bacterial (Fig. 1) andarchaeal (see Fig. S1) genera. For the majority of the genera (94%), the combination ofAF and ANI genomic indices resulted in clustering of type and non-type species. The AFand ANI means of these clusters were significantly different (P � 0.05) in 94% and 90%of the cases for AF and ANI, respectively (Data Set S2A). Figure 2 shows the distributionof AF and ANI values at the taxonomic level of family in Bacteria (see Fig. S2 and S3 fordistributions at the taxonomic level of order in Bacteria and of order and family inArchaea, respectively). The 448 identified type strains that would need reclassificationdirectly impact 48 of the 144 genera analyzed in this study. The number of genera thatare impacted increases to 62 when the estimated genus inflection point (discussed indetail below) is used.
The means and medians of all the AF and ANI values associated with genusdemarcation boundaries as they pertain to Bacteria and Archaea are included in DataSet S2B. Altogether (n � 144), the AF values of genus demarcation boundaries have a
FIG 1 Distribution of AF (a) and ANI (b) values of type (T; n � 2,382) and non-type (NT; n � 2,571) species compared to a primary reference in their respectiveorder/family in Bacteria. Significant differences were seen between T and NT species in both cases (nonparametric Wilcoxon test, P � 0.0001). The green lineindicates the mean. The blue lines show the standard deviation from the mean.
A Genus Definition for Bacteria and Archaea ®
January/February 2020 Volume 11 Issue 1 e02475-19 mbio.asm.org 3
on May 17, 2020 by guest
http://mbio.asm
.org/D
ownloaded from

mean of 0.331 (95% confidence interval [CI], 0.308 to 0.354), with a median of 0.345(25% quartile, 0.206; 75% quartile, 0.444). The ANI values of genus demarcation bound-aries have a mean of 73.98% (95% CI, 73.34% to 74.62%), with a median of 73.11% (25%quartile, 70.85%; 75% quartile, 76.56%).
The AF values of the estimated genus inflection points obtained in this study(n � 28; all from genera in Bacteria; Data Set S2C) have a mean of 0.333 (95% CI, 0.305to 0.362), with a median of 0.349 (25% quartile, 0.281; 75% quartile, 0.371). These valuesare nearly identical to the AF mean (0.330) and median (0.345) of the genus demar-cation boundaries. The ANI values of the estimated genus inflection points obtained inthis study have a mean of 73.10% (95% CI, 72.50% to 73.70%), with a median of 73.08%(25% quartile, 72.57%; 75% quartile, 73.93%). These values are also in close proximity tothe mean (73.98%) and median (73.11%) ANI values of the genus demarcation bound-aries.
We encourage the use of the genus demarcation boundary in conjunction with theestimated genus inflection point that is specific to the taxon that is being analyzed(Data Set S2A). The mean and median values that were obtained are only presentedhere for comparison purposes and in the case that a genus demarcation boundary orestimated genus inflection point cannot be determined (e.g., due to lack of type speciesand/or type strains). Several representative cases will be discussed in more detail below.
Bacteria. To initially test our approach with Gram-positive bacteria, the orderLactobacillales was chosen since it contains a number of well-characterized genera andspecies of economic importance in human and animal health. A continuum of AF andANI values characterizes a typical result when intergeneric and intrageneric species ofthe order Lactobacillales (e.g., all against all) are compared without distinguishingbetween type and non-type strains or species (Fig. 3a). Because there is no primarytaxonomic reference genome to compare to, differentiation between different taxo-nomic groups is not possible. However, when the type species of Lactococcus, L. lactissubsp. lactis ATCC 19435T (68), is used as the primary reference, a clear distinction canbe made between type species and non-type species (Fig. 3b). The type species ofgenera in Lactobacillales form a distinct cluster toward lower AF and ANI values, whilethe non-type species of Lactococcus cluster toward higher AF and ANI values (Fig. 3cand d). There is no overlap between these two clusters. All species were correctlyclassified into their corresponding groups by using the genus demarcation boundary.
To test our approach with Gram-negative microorganisms, type species of genera inthe order Alteromonadales and non-type Shewanella spp. were pairwise compared to
FIG 2 AF (a and b) and ANI (c and d) values of type (n � 1,641) and non-type (n � 1,554) species compared to primary references within specific taxonomicfamilies in Bacteria. The mean AF or ANI value is shown by a green line in a– d. The mean of means is denoted by the black line in a– d.
Barco et al. ®
January/February 2020 Volume 11 Issue 1 e02475-19 mbio.asm.org 4
on May 17, 2020 by guest
http://mbio.asm
.org/D
ownloaded from

the type species Shewanella putrefaciens JCM 20190T, which is the primary reference(Fig. 4a). A distinct clustering is seen between the type species and non-type species.All species were correctly classified into their corresponding groups by using the genusdemarcation boundary.
Additional examples show that this trend is also seen with taxonomic families (Fig. 2and 4b). The Flavobacteriaceae were investigated as an example of a diverse family withone of the largest number of validly published genera (currently �160). Despite this,the separate clustering of type species and non-type species was conserved. When thetype species of the genus Flavobacterium, Flavobacterium aquatile LMG 4008T, is usedas the primary reference, all type species (i.e., with available genomes) in the Flavo-bacteriaceae clustered toward lower AF and ANI values, while the vast majority of thenon-type species of Flavobacterium clustered toward higher AF and ANI values. The fiveFlavobacterium spp. that were positioned below the AF and ANI genus demarcationboundary had 16S rRNA gene sequence identities of �94% to the primary reference. Ina separate example, the type species Vibrio cholerae ATCC 14035T was used as theprimary reference and compared to non-type species in the genus Vibrio and other typespecies of genera in the family Vibrionaceae (Fig. 4c). Clustering is seen between thetype species and non-type species. All species were correctly classified into theircorresponding groups by using the genus demarcation boundary, with the exceptionof Vibrio caribbeanicus ATCC BAA-2122T, which has a 16S rRNA gene identity of 92.9%to V. cholerae ATCC 14035T.
Archaea. This approach was also tested on an archaeal family, Methanosarcinaceae,in the phylum Euryarchaeota (Fig. 4d). The primary reference was the type speciesMethanosarcina barkeri JCM 10043T. The results were consistent with previous exam-
FIG 3 AF and ANI pairwise genome comparisons in the order Lactobacillales. (a) Type and non-type strains/species of 15different genera in the order Lactobacillales were pairwise compared (n � 6,090 comparisons). (b) Type species (n � 37) ofgenera within the order Lactobacillales (circles) and non-type species (n � 6) of the genus Lactococcus (in order Lactobacillales;triangles) were pairwise compared only to the primary reference, type species Lactococcus lactis subsp. lactis ATCC 19435T. Thebottom-left quadrant demarcates the boundary between type and non-type species. (c and d) Boxplot diagrams of AF (c) andANI (d) values as related to non-type (NT) species of the genus Lactococcus and type (T) species of genera within the orderLactobacillales (nonparametric Wilcoxon test, P � 0.0003 in both cases). Means are shown in green. Standard deviations areshown in blue.
A Genus Definition for Bacteria and Archaea ®
January/February 2020 Volume 11 Issue 1 e02475-19 mbio.asm.org 5
on May 17, 2020 by guest
http://mbio.asm
.org/D
ownloaded from
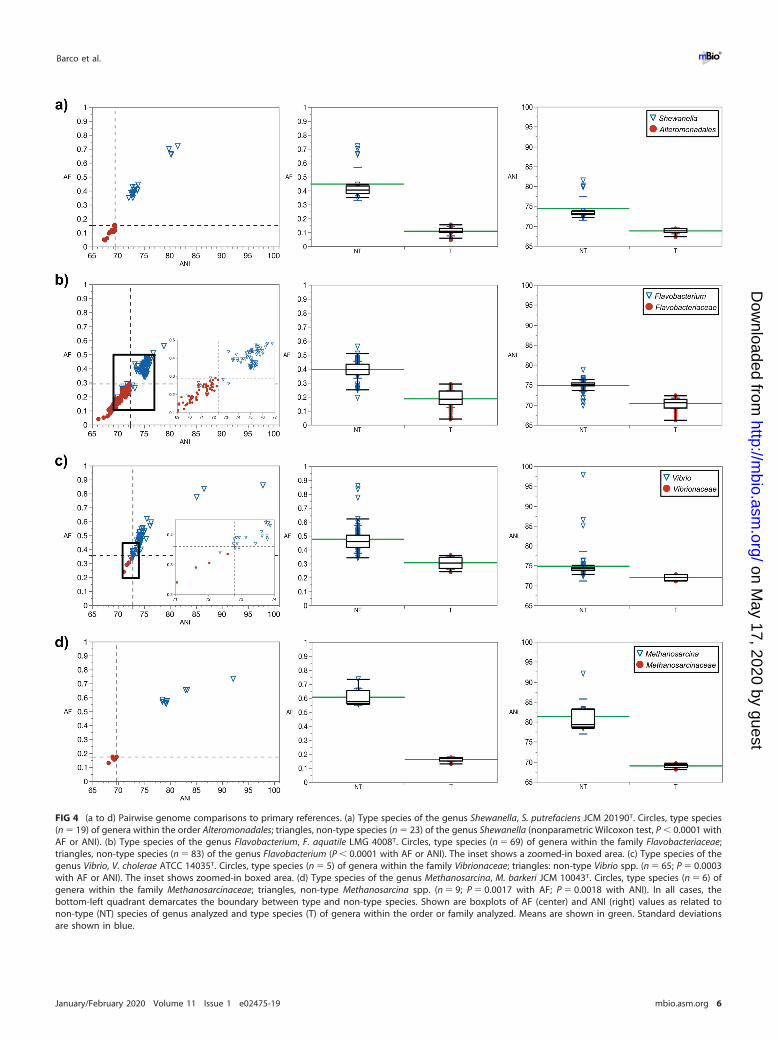
FIG 4 (a to d) Pairwise genome comparisons to primary references. (a) Type species of the genus Shewanella, S. putrefaciens JCM 20190T. Circles, type species(n � 19) of genera within the order Alteromonadales; triangles, non-type species (n � 23) of the genus Shewanella (nonparametric Wilcoxon test, P � 0.0001 withAF or ANI). (b) Type species of the genus Flavobacterium, F. aquatile LMG 4008T. Circles, type species (n � 69) of genera within the family Flavobacteriaceae;triangles, non-type species (n � 83) of the genus Flavobacterium (P � 0.0001 with AF or ANI). The inset shows a zoomed-in boxed area. (c) Type species of thegenus Vibrio, V. cholerae ATCC 14035T. Circles, type species (n � 5) of genera within the family Vibrionaceae; triangles: non-type Vibrio spp. (n � 65; P � 0.0003with AF or ANI). The inset shows zoomed-in boxed area. (d) Type species of the genus Methanosarcina, M. barkeri JCM 10043T. Circles, type species (n � 6) ofgenera within the family Methanosarcinaceae; triangles, non-type Methanosarcina spp. (n � 9; P � 0.0017 with AF; P � 0.0018 with ANI). In all cases, thebottom-left quadrant demarcates the boundary between type and non-type species. Shown are boxplots of AF (center) and ANI (right) values as related tonon-type (NT) species of genus analyzed and type species (T) of genera within the order or family analyzed. Means are shown in green. Standard deviationsare shown in blue.
Barco et al. ®
January/February 2020 Volume 11 Issue 1 e02475-19 mbio.asm.org 6
on May 17, 2020 by guest
http://mbio.asm
.org/D
ownloaded from

ples of bacterial taxa displaying clustering of non-type species within a genus sepa-rately from type species of other genera within the same family. As in previousexamples, all species were classified into their correct higher taxa by using the genusdemarcation boundary. Similar results were obtained in the family Haloferacaceae.Additionally, the family Thermoproteaceae in the phylum Crenarchaeota was tested,with Pyrobaculum islandicum DSM 4184T as a primary reference. A significant distinctionbetween type and non-type species was seen with AF (P � 0.0369) but not with ANI(P � 0.3682) (Data Set S2A). Despite this, there was no overlap of the type/non-typeclusters when both AF and ANI were used in combination, and all of the species wereclassified in agreement with current taxonomy.
Selected case studies. In the remainder of the manuscript, we will focus on fiveselected case studies, each of which has longstanding, historical, taxonomic issues.These cases will be discussed in more detail, with the goal of guiding the reader towardan interpretation of similar scenarios in other taxa. These case studies, along with theexamples described above, provide a variety of different scenarios that can be analyzedusing our approach.
Genus assignment in the recently rearranged Hydrogenovibrio-Thioalkalimicrobium-Thiomicrospira cluster was tested as an example of a bacterial group with historicaltaxonomic issues (24, 25) (Fig. S4A). Boden et al. (26) recently provided a detailedevaluation of the characteristics of this cluster, which falls within the radiation of thePiscirickettsiaceae and is proposed to place many of the species into different genera.We tested these newly proposed assignments using the approach described above andthe MiSI method. When testing genus assignment to Hydrogenovibrio, the type speciesHydrogenovibrio marinus DSM 11271T was used as a primary reference (Fig. 5a). Thesingle data point that crossed the genus demarcation boundary belonged to Hydrog-enovibrio halophilus DSM 15072T. Aside from this data point, there was no overlap of AFand ANI values between the type- and non-type species, indicating support for theassignment of H. crunogenus, H. thermophilus, and H. kuenenii to the genus Hydrog-enovibrio. Similarly, the proposed new genus Thiomicrorhabdus (26) was also tested(Fig. S4B). The results indicate that the new classification is supported by AF and ANI
FIG 5 Analysis of Hydrogenovibrio, as rearranged by Boden et al. (26). (a) Pairwise genome comparisons to the primary reference Hydrogenovibrio marinus DSM11271T. Non-type species within the genus Hydrogenovibrio are shown in triangles. The type strain H. thermophilus I78T does not have a sequenced genome;therefore, Hydrogenovibrio sp. strain MA2-6 (�99% pairwise identity in 16S rRNA gene sequence) was used instead. Similarly, H. crunogenus XCL-2 (�99%pairwise identity in 16S rRNA gene sequence) (69) is used instead of the type strain H. crunogenus TH-55T, as TH-55T does not have a sequenced genome. Thetype species of genera within the family Piscirickettsiaceae are shown in circles. The bottom-left quadrant demarcates the boundary between type and non-typespecies. (b) Maximum likelihood phylogenetic tree based on an alignment of 16S rRNA genes indicating the phylogenetic positioning of H. halophilus DSM15072T. The scale bar indicates 20% sequence divergence. Bootstrap values �70% are shown at the nodes. Accession numbers are shown to the right inparentheses. Tm, Thiomicrospira; Tmr, Thiomicrorhabdus.
A Genus Definition for Bacteria and Archaea ®
January/February 2020 Volume 11 Issue 1 e02475-19 mbio.asm.org 7
on May 17, 2020 by guest
http://mbio.asm
.org/D
ownloaded from

values, as the type species of genera in the family Piscirickettsiaceae and Thiomicrorh-abdus spp. remain well separated. The reclassification of Thioalkalimicrobium spp. toThiomicrospira spp. (26) is also supported by ANI and AF values (Fig. S4C), as thesespecies form a cluster that is well separated from the type species of genera in thefamily Piscirickettsiaceae.
Our approach has identified a potential misclassification of H. halophilus (basonymThiomicrospira halophila) because it clusters with the type species of genera in thefamily Piscirickettsiaceae other than Hydrogenovibrio. Below, we show additional evi-dence that could support a potential reclassification of H. halophilus. A closer look atthe multiple 16S rRNA gene sequences of H. halophilus revealed that they have 94.0 to94.2% pairwise identities to the type species, H. marinus DSM 11271T. Our results differfrom those of Boden et al., who reported 95.7% sequence identity (26) between H.halophilus and H. marinus. The difference in identity appears to be due to differencesin the 16S rRNA gene sequence between the near-full-length version of Sorokin et al.(1,420 bp, GenBank accession number DQ390450 [27] and the full-length versions ofthis gene (1,439 bp each; IMG identifiers [IDs] 2518265101 and 2518265550) originatingfrom a draft genome (28) and used in this study. The phylogenetic placement of thisorganism also supports the idea that H. halophilus is distinctly positioned in its ownclade as it branches away from the cluster of other Hydrogenovibrio spp. (Fig. 5b). Onedifferentiating characteristic of H. halophilus is the DNA G�C content of 56.6%, muchhigher than the ca. 44% of the other newly classified Hydrogenovibrio spp. Anothermajor differentiating aspect is the higher NaCl optimum/maximum of 1.5 M/3.5 M forH. halophilus versus the lower 0.2 to 0.5/0.6 to 1.2 M for other Hydrogenovibrio spp.Therefore, based on AF and ANI results and molecular, phylogenetic, and physiologicalevidence, the assignment of H. halophilus to a new genus is justifiable. Beyond thetaxonomic issue with H. halophilus, we also note the relatively low AF and ANI valuesof H. crunogenus and Hydrogenovibrio sp. strain MA2-6 (a strain of H. thermophilus) inrelation to H. marinus. These results in conjunction with the low bootstrap values forbranches associated with H. crunogenus and H. thermophilus (�70% in reference 26 andin this study) suggest that there are other taxonomic issues that cannot be resolved atthis time in this genus, in part due to the lack of genomes of type strains (see belowfor discussion on the genus inflection point).
The Bacillaceae were also investigated as an example of a family that is medicallyand commercially relevant (Fig. 6) but problematic in terms of taxonomy. Generally,there were significant differences between non-type Bacillus species and type species
FIG 6 Pairwise genome comparisons to the type species of the genus Bacillus, B. subtilis ATCC 6051T. Circles, type species (n � 30) of generawithin the family Bacillaceae; triangles, non-type Bacillus spp. (n � 117). (a) The regression line is based on quartic function, with the data setincluding the AF and ANI value of 1:100. The dark-gray-shaded area indicates the 95% confidence interval of the trendline. The light-gray-shadedarea indicates the 95% confidence interval of AF and ANI values. The long dash line demarcates the genus boundary (left quadrant). The shortdash line (left quadrant) extends from the estimated genus inflection point. (b) Zoomed-in boxed area shown in panel a; est., estimated.
Barco et al. ®
January/February 2020 Volume 11 Issue 1 e02475-19 mbio.asm.org 8
on May 17, 2020 by guest
http://mbio.asm
.org/D
ownloaded from

of genera in the family Bacillaceae when B. subtilis 6051T (29) was used as a primaryreference (Data Set S2A). However, approximately half (59 out of 117) of the non-typeBacillus spp. clustered with type species, which strongly suggests that the genusBacillus is in need of taxonomic revision. Of note, the human pathogens Bacillusanthracis and Bacillus cereus cluster with type species of genera in Bacillaceae, indicat-ing that they are at least as genomically different from B. subtilis as are other typespecies in this family, warranting a taxonomic rearrangement. As shown above with H.halophilus, a similar argument could be made for the taxonomic rearrangement of eachone of these species (e.g., �94.5% identity in 16S rRNA gene sequence to the typespecies B. subtilis 6051). Compared to our analyses of other taxonomic groups, theseresults are atypical in the sense that the non-type species cluster considerably overlapsthe type species cluster. We highlight the fact that a large number of these specimenswere designated non-type species of Bacillus prior to the advent of the universal use of16S rRNA gene as a taxonomic marker in the 1990s (i.e., �20% of all type strains ofnon-type Bacillus spp. with available genomes in our data set). For example, B. anthraciswas first described in 1872 (30) and appears on the Approved Lists of Bacterial Names(31). When the primary reference is changed to Anoxybacillus pushchinoensis K1T, a typespecies of a genus established in 2000 (32), using the taxonomic framework of the 16SrRNA gene, the clustering of type species of genera in Bacillaceae and non-type speciesof Anoxybacillus is almost without overlap, with the genus demarcation boundarydelineating 97% of the species in agreement with current taxonomy (Data Set S2A).Another example is Lysinibacillus, which was proposed and validly published in 2007(33), showing distinct clustering between type species and non-type species in fullagreement with current taxonomy.
The AF and ANI plots reveal different rates of change at the DNA level. In the fewcases in which there are sufficient samples to analyze and/or the distribution of valuesis more widespread, the AF and ANI plots reveal a polynomial shape approximating aquartic function, with R2 values generally at �0.96. A second derivative of this functionresults in a quadratic function that can be used to detect an inflection point withprecision. Estimates based on several examples in this study indicate two inflectionpoints. The overall mean of the first inflection point (AF, 0.333; ANI, 73.10%; Data SetS2C) generally approximates the mean genus demarcation boundary of all cases hereinpresented (AF, 0.331; ANI, 73.98%; Data Set S2B). Estimations of this genus inflectionpoint via logistic and Gompertz functions generally agree with the estimations by thepreferred quartic function, and their use is recommended for accuracy. The secondinflection point, at 89 to 92% ANI, is consistently lower than the current ANI speciesthreshold (�95% ANI) and is seen with the quartic function in each of the cases inwhich the genus inflection point was able to be estimated. Related to this, geneticdiscontinuity between 80 and 95% ANI has been previously reported in various studiesthat included analysis of metagenomes and genomes of isolates (34–37). Recent resultsobtained by Delmont et al. (38) reported delineation of SAR 11 populations at ANIvalues lower than 95%, consistent with the ANI values of the second inflection pointsthat were observed in this study. Because the second inflection point potentially dealswith species delineation, detailed exploration (e.g., using subspecies type strains) anddiscussion of this topic are outside the scope of this study. However, it is noted that ANIvalues of 89 to 92% largely correspond to 16S rRNA gene identity values of �98.65%(see Fig. 3 in reference 14). Also, it is noted that there is a continuum of diversity at thegenus level (e.g., as opposed to what is seen at the species level with geneticdiscontinuity) in addition to clustering (see Fig. 2), adding support to the idea proposedby Palmer et al. (39) that genetic continuum and genomic cohesiveness are notmutually exclusive, at least at the genus level.
The estimated genus inflection point serves as a practical guide for maximum AFand ANI values of a genus demarcation boundary and for the identification of atransition zone. Ideally, and assuming abundance of genomes of type strains and,consequently, data points, the estimated genus inflection point should closely matchthe genus demarcation boundary. As an example, the genus inflection point in Bacillus
A Genus Definition for Bacteria and Archaea ®
January/February 2020 Volume 11 Issue 1 e02475-19 mbio.asm.org 9
on May 17, 2020 by guest
http://mbio.asm
.org/D
ownloaded from

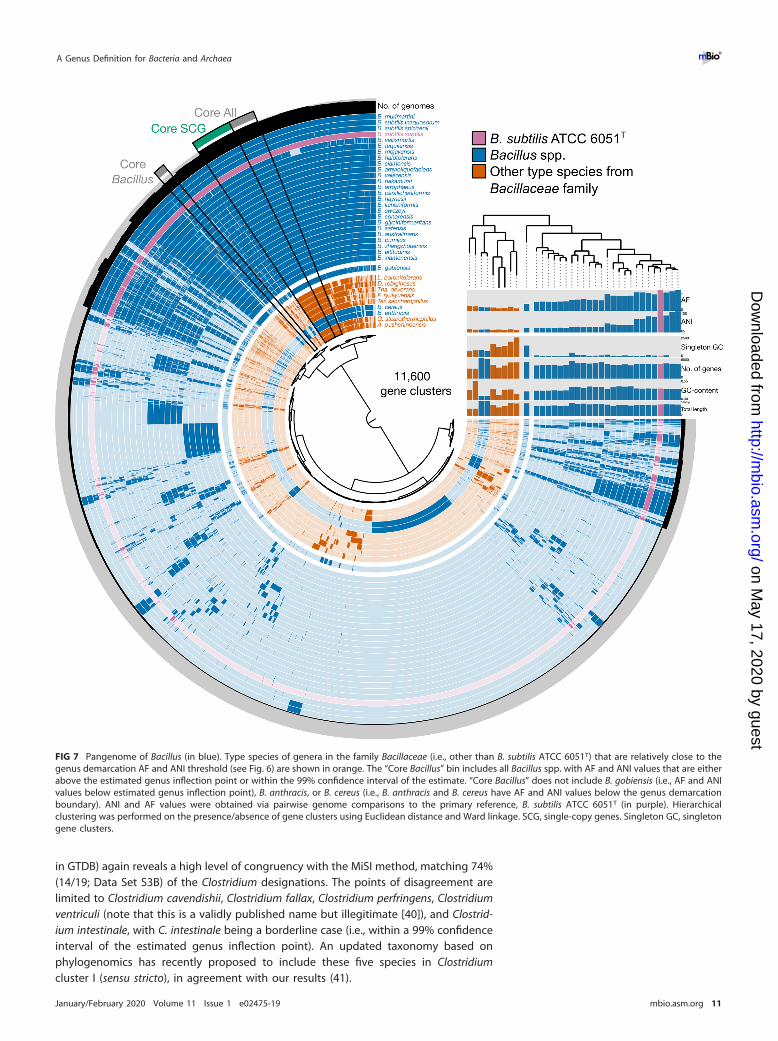
was estimated via the quartic function with AF of 0.430 and ANI of 73.57% (Fig. 6a).However, the majority of the non-type Bacillus spp. (99 out of 117 [85%]) fall below thisinflection point at lower AF and ANI values, suggesting a potentially profound under-estimation of genus diversity within the family Bacillaceae. An analysis of the pange-nome of Bacillus using this estimated genus inflection point as a guide shows that onlynon-type Bacillus spp. above the genus inflection point cluster closely with the typespecies B. subtilis (the primary reference), while B. anthracis and B. cereus, which arebelow both the estimated genus inflection point and genus demarcation boundary,cluster with type species of other genera in Bacillaceae (Fig. 7), corroborating, aspointed out above, that these two pathogens warrant reclassification and renaming.However, doing so would require considerable care so as not to raise objections oversafety issues and a push for conservation of the current names over newly proposednames (see rule 56a in reference 5 and opinion 60 in reference 7). These results werefurther corroborated by phylogenomic analysis of Bacillaceae (Fig. 7).
It is important to note that the genus inflection point is estimated based onnonlinear regression and only serves as a guide for future taxonomic designation. Thisis particularly important in the case of a new taxonomic designation with a genomedisplaying AF and ANI values that are right above the effective genus demarcationboundary; is it a novel type species of a new genus or a novel non-type species of anexisting genus? Having an estimated genus inflection point helps in making thisdecision. Whereas the genus demarcation boundary is a hard boundary, the genusinflection point represents a soft boundary that highlights a region where the rate ofchange is starting to decrease at the genome level. Toward higher ANI values, this ratethen starts to increase, which would correspond to a species inflection point. Thus far,the genus inflection point could be properly estimated only for a few taxonomic groupsdue to a lack of genomes of type strains and/or actual isolates. Bacillus pumilus, Bacillussafensis, Bacillus altitudinis, Bacillus zhangzhouensis, Bacillus xiamenensis, and Bacillusaustralimaris are borderline species positioned within the 99% confidence interval ofthe estimated genus inflection point. Their 16S rRNA gene identities in relation to theprimary reference range from 96.8% to 97.4%, suggesting that the estimated genusinflection point of Bacillus corresponds to a value that is much higher than the currentgenus threshold based on 16S rRNA gene identity (94.5%).
The taxonomic placements of species within Bacillus were also compared to a recenttaxonomy that is based on highly conserved, protein-concatenated phylogeny (Ge-nome Taxonomy Database [GTDB] [22]). There are currently �280 Bacillus spp. in theliterature with validly published names, but �50% of these species have availablesequenced genomes of their type strains. The MiSI method and GTDB taxonomy(accessed on 7 May 2019) indicate that there are 19 and 26 species within Bacillus,respectively (Data Set S3A). The 19 species placed within Bacillus by the MiSI methodrepresent the type strains that are above the genus inflection point. However, ifborderline species (i.e., within the confidence interval of the estimated genus inflectionpoint) are also included, the number of species within Bacillus increases to 26. The greatmajority of the GTDB classifications of species within Bacillus (i.e., “d_Bacteria;p_Firmicutes; c_Bacilli; o_Bacillales; f_Bacillaceae; g_Bacillus” in GTDB) were supportedby the MiSI method if borderline species were taken into account, with two exceptions,as follows: (i) B. gobiensis, which is considerably below the estimated genus inflectionpoint and outside the confidence interval, and (ii) “B. cellulasensis,” which is not aspecies with a validly published name.
Clostridium is a genus with historical taxonomic issues. There are currently 165Clostridium spp. but only 86 available, nonredundant, sequenced genomes of typestrains. The MiSI method identified 36 of these Clostridium spp. to be at or below thegenus demarcation boundary, indicating numerous taxonomic issues with this genus.In addition to this, there is a lack of available genomes of Clostridium spp. with ANIvalues between 80 and 100%. The genus inflection point of Clostridium is estimated atan AF of 0.252 and ANI of 72.72%. There are 21 Clostridium spp. at or above thisinflection point. A comparison to GTDB taxonomy (i.e., limited to type strains; n � 19
Barco et al. ®
January/February 2020 Volume 11 Issue 1 e02475-19 mbio.asm.org 10
on May 17, 2020 by guest
http://mbio.asm
.org/D
ownloaded from
in GTDB) again reveals a high level of congruency with the MiSI method, matching 74%(14/19; Data Set S3B) of the Clostridium designations. The points of disagreement arelimited to Clostridium cavendishii, Clostridium fallax, Clostridium perfringens, Clostridiumventriculi (note that this is a validly published name but illegitimate [40]), and Clostrid-ium intestinale, with C. intestinale being a borderline case (i.e., within a 99% confidenceinterval of the estimated genus inflection point). An updated taxonomy based onphylogenomics has recently proposed to include these five species in Clostridiumcluster I (sensu stricto), in agreement with our results (41).
FIG 7 Pangenome of Bacillus (in blue). Type species of genera in the family Bacillaceae (i.e., other than B. subtilis ATCC 6051T) that are relatively close to thegenus demarcation AF and ANI threshold (see Fig. 6) are shown in orange. The “Core Bacillus” bin includes all Bacillus spp. with AF and ANI values that are eitherabove the estimated genus inflection point or within the 99% confidence interval of the estimate. “Core Bacillus” does not include B. gobiensis (i.e., AF and ANIvalues below estimated genus inflection point), B. anthracis, or B. cereus (i.e., B. anthracis and B. cereus have AF and ANI values below the genus demarcationboundary). ANI and AF values were obtained via pairwise genome comparisons to the primary reference, B. subtilis ATCC 6051T (in purple). Hierarchicalclustering was performed on the presence/absence of gene clusters using Euclidean distance and Ward linkage. SCG, single-copy genes. Singleton GC, singletongene clusters.
A Genus Definition for Bacteria and Archaea ®
January/February 2020 Volume 11 Issue 1 e02475-19 mbio.asm.org 11
on May 17, 2020 by guest
http://mbio.asm
.org/D
ownloaded from
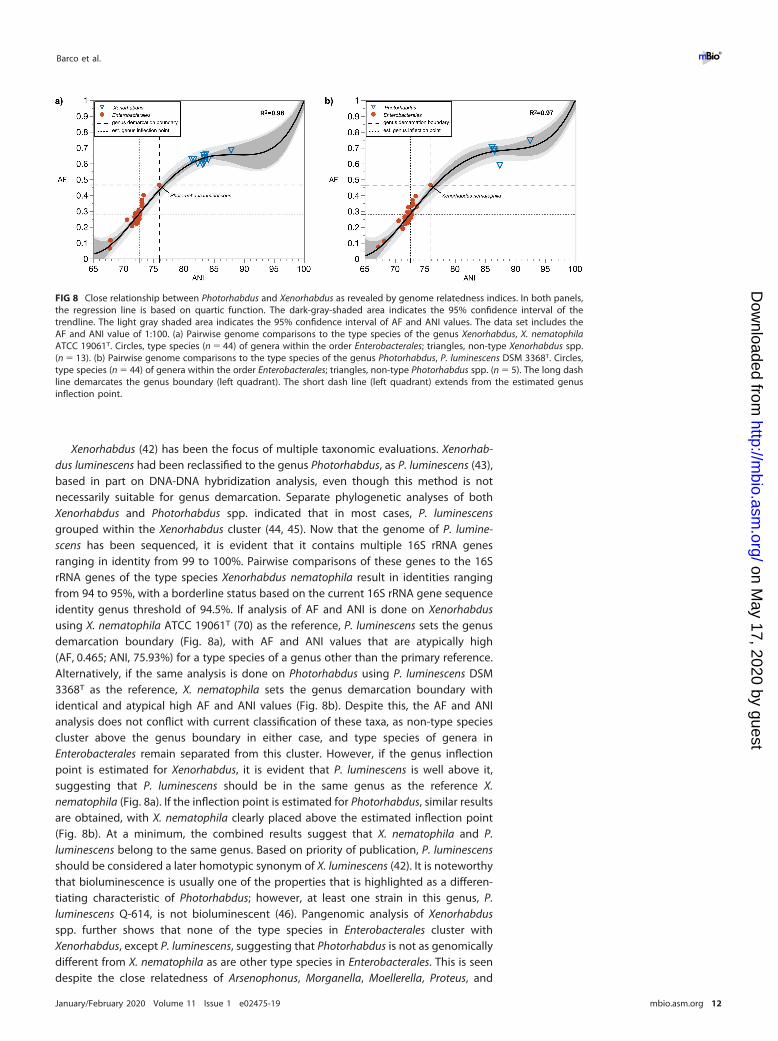
Xenorhabdus (42) has been the focus of multiple taxonomic evaluations. Xenorhab-dus luminescens had been reclassified to the genus Photorhabdus, as P. luminescens (43),based in part on DNA-DNA hybridization analysis, even though this method is notnecessarily suitable for genus demarcation. Separate phylogenetic analyses of bothXenorhabdus and Photorhabdus spp. indicated that in most cases, P. luminescensgrouped within the Xenorhabdus cluster (44, 45). Now that the genome of P. lumine-scens has been sequenced, it is evident that it contains multiple 16S rRNA genesranging in identity from 99 to 100%. Pairwise comparisons of these genes to the 16SrRNA genes of the type species Xenorhabdus nematophila result in identities rangingfrom 94 to 95%, with a borderline status based on the current 16S rRNA gene sequenceidentity genus threshold of 94.5%. If analysis of AF and ANI is done on Xenorhabdususing X. nematophila ATCC 19061T (70) as the reference, P. luminescens sets the genusdemarcation boundary (Fig. 8a), with AF and ANI values that are atypically high(AF, 0.465; ANI, 75.93%) for a type species of a genus other than the primary reference.Alternatively, if the same analysis is done on Photorhabdus using P. luminescens DSM3368T as the reference, X. nematophila sets the genus demarcation boundary withidentical and atypical high AF and ANI values (Fig. 8b). Despite this, the AF and ANIanalysis does not conflict with current classification of these taxa, as non-type speciescluster above the genus boundary in either case, and type species of genera inEnterobacterales remain separated from this cluster. However, if the genus inflectionpoint is estimated for Xenorhabdus, it is evident that P. luminescens is well above it,suggesting that P. luminescens should be in the same genus as the reference X.nematophila (Fig. 8a). If the inflection point is estimated for Photorhabdus, similar resultsare obtained, with X. nematophila clearly placed above the estimated inflection point(Fig. 8b). At a minimum, the combined results suggest that X. nematophila and P.luminescens belong to the same genus. Based on priority of publication, P. luminescensshould be considered a later homotypic synonym of X. luminescens (42). It is noteworthythat bioluminescence is usually one of the properties that is highlighted as a differen-tiating characteristic of Photorhabdus; however, at least one strain in this genus, P.luminescens Q-614, is not bioluminescent (46). Pangenomic analysis of Xenorhabdusspp. further shows that none of the type species in Enterobacterales cluster withXenorhabdus, except P. luminescens, suggesting that Photorhabdus is not as genomicallydifferent from X. nematophila as are other type species in Enterobacterales. This is seendespite the close relatedness of Arsenophonus, Morganella, Moellerella, Proteus, and
FIG 8 Close relationship between Photorhabdus and Xenorhabdus as revealed by genome relatedness indices. In both panels,the regression line is based on quartic function. The dark-gray-shaded area indicates the 95% confidence interval of thetrendline. The light gray shaded area indicates the 95% confidence interval of AF and ANI values. The data set includes theAF and ANI value of 1:100. (a) Pairwise genome comparisons to the type species of the genus Xenorhabdus, X. nematophilaATCC 19061T. Circles, type species (n � 44) of genera within the order Enterobacterales; triangles, non-type Xenorhabdus spp.(n � 13). (b) Pairwise genome comparisons to the type species of the genus Photorhabdus, P. luminescens DSM 3368T. Circles,type species (n � 44) of genera within the order Enterobacterales; triangles, non-type Photorhabdus spp. (n � 5). The long dashline demarcates the genus boundary (left quadrant). The short dash line (left quadrant) extends from the estimated genusinflection point.
Barco et al. ®
January/February 2020 Volume 11 Issue 1 e02475-19 mbio.asm.org 12
on May 17, 2020 by guest
http://mbio.asm
.org/D
ownloaded from
Providencia to Xenorhabdus, which is evident in the phylogenomic analysis using eithersingle-copy genes or ribosomal genes (Fig. S5).
Interestingly, the type species of Morganella, Moellerella, Proteus, and Providencia arein borderline relationships to Xenorhabdus (Fig. 8), with their respective AF and ANIvalues in close proximity to the estimated inflection point. We note that pairwise 16SrRNA gene sequence identities between X. nematophila and Proteus vulgaris range from94.5 to 95.0%, again a borderline case as far as genus assignment is concerned. It isnoteworthy that the genus Xenorhabdus was proposed prior to the advent of 16S rRNAgene as a taxonomic marker. A more in-depth analysis of all these closely relatedgenera and their potential taxonomic placement, especially in relation to Proteus,should be further investigated as more type strains in these taxa are sequenced.
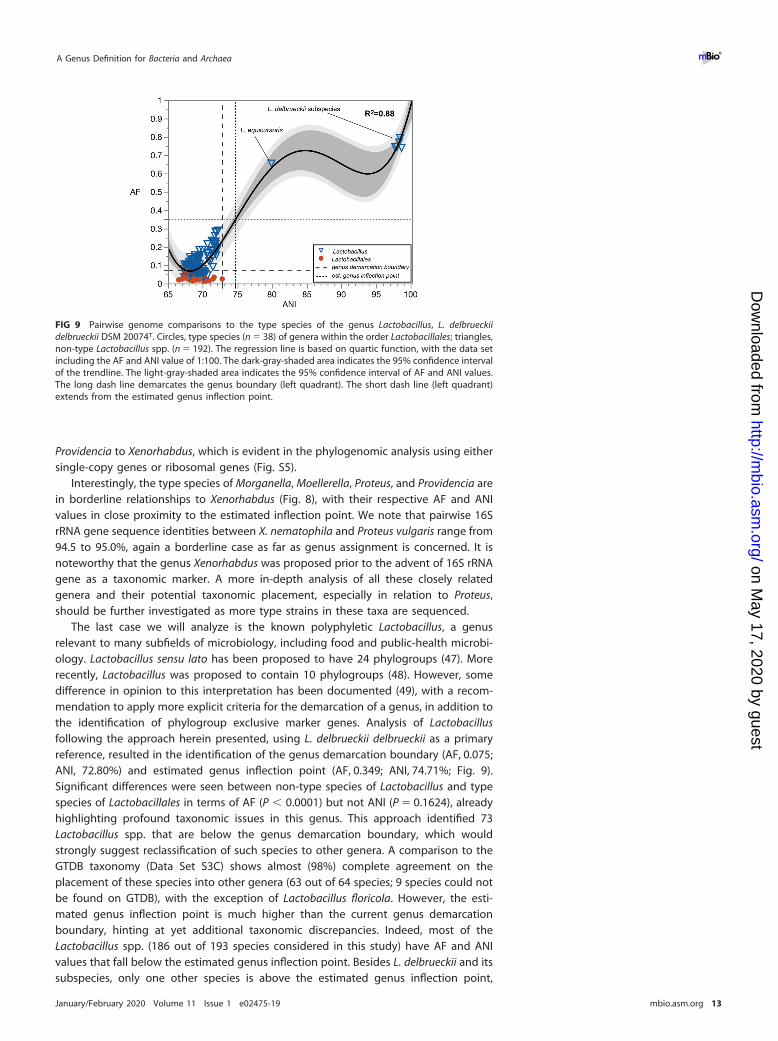
The last case we will analyze is the known polyphyletic Lactobacillus, a genusrelevant to many subfields of microbiology, including food and public-health microbi-ology. Lactobacillus sensu lato has been proposed to have 24 phylogroups (47). Morerecently, Lactobacillus was proposed to contain 10 phylogroups (48). However, somedifference in opinion to this interpretation has been documented (49), with a recom-mendation to apply more explicit criteria for the demarcation of a genus, in addition tothe identification of phylogroup exclusive marker genes. Analysis of Lactobacillusfollowing the approach herein presented, using L. delbrueckii delbrueckii as a primaryreference, resulted in the identification of the genus demarcation boundary (AF, 0.075;ANI, 72.80%) and estimated genus inflection point (AF, 0.349; ANI, 74.71%; Fig. 9).Significant differences were seen between non-type species of Lactobacillus and typespecies of Lactobacillales in terms of AF (P � 0.0001) but not ANI (P � 0.1624), alreadyhighlighting profound taxonomic issues in this genus. This approach identified 73Lactobacillus spp. that are below the genus demarcation boundary, which wouldstrongly suggest reclassification of such species to other genera. A comparison to theGTDB taxonomy (Data Set S3C) shows almost (98%) complete agreement on theplacement of these species into other genera (63 out of 64 species; 9 species could notbe found on GTDB), with the exception of Lactobacillus floricola. However, the esti-mated genus inflection point is much higher than the current genus demarcationboundary, hinting at yet additional taxonomic discrepancies. Indeed, most of theLactobacillus spp. (186 out of 193 species considered in this study) have AF and ANIvalues that fall below the estimated genus inflection point. Besides L. delbrueckii and itssubspecies, only one other species is above the estimated genus inflection point,
FIG 9 Pairwise genome comparisons to the type species of the genus Lactobacillus, L. delbrueckiidelbrueckii DSM 20074T. Circles, type species (n � 38) of genera within the order Lactobacillales; triangles,non-type Lactobacillus spp. (n � 192). The regression line is based on quartic function, with the data setincluding the AF and ANI value of 1:100. The dark-gray-shaded area indicates the 95% confidence intervalof the trendline. The light-gray-shaded area indicates the 95% confidence interval of AF and ANI values.The long dash line demarcates the genus boundary (left quadrant). The short dash line (left quadrant)extends from the estimated genus inflection point.
A Genus Definition for Bacteria and Archaea ®
January/February 2020 Volume 11 Issue 1 e02475-19 mbio.asm.org 13
on May 17, 2020 by guest
http://mbio.asm
.org/D
ownloaded from
Lactobacillus equicursoris. Summarizing the results, Lactobacillus sensu stricto shouldcurrently only contain two species, L. delbrueckii and L. equicursoris. GTDB (22) andSalvetti et al. (48) currently have 40 (i.e., “d_Bacteria; p_Firmicutes; c_Bacilli; o_Lacto-bacillales; f_Lactobacillaceae; g_Lactobacillus”; GTDB accessed on 27 October 2019) and33 (i.e., “L. delbrueckii group”) species within Lactobacillus, respectively. Some of thespecies in GTDB’s “g_Lactobacillus” (22) and Salvetti et al.’s “L. delbrueckii group” (48)have very low AF values of �0.1 (e.g., L. floricola and L. iners), indicating �10% alignableregion of best-bidirectional hits to the genome of L. delbrueckii delbrueckii, the typespecies of Lactobacillus. These results demonstrate that this genus is currently notbeing delineated taking into account a consistent aspect of genomic coherence, asmore and more species are classified within Lactobacillus despite being as geneticallydistant from the primary reference as are other type species of genera in Lactobacillales.Phylogenetically, L. delbrueckii and L. equicursoris form a monophyletic group, as seenby different methods in studies by Morita et al. (50), Zheng et al. (47), Sun et al. (51),Salvetti et al. (48), and Wittouck et al. (52). In terms of 16S rRNA identity, the onlyspecies that has an identity of �94.5% to L. delbrueckii delbrueckii is L. equicursoris (notethat subspecies of L. delbrueckii have identities of �99%). All other Lactobacillus speciesin GTDB’s “g_Lactobacillus” (22) and Salvetti et al.’s “L. delbrueckii group” (48) haveidentities �94% to L. delbrueckii delbrueckii, with values as low as 86.9% (i.e., L. floricola;based on a comparison of 1,483 bp). These results highlight that there are still manytaxonomic issues to resolve within Lactobacillus.
Implications. The approach we have used to demarcate genera is complementaryand does not replace the conventional polyphasic method of circumscribing a genus,which includes thorough analyses of the full-length 16S rRNA gene, phylogeny, phys-iology, and metabolism, among other aspects. The AF and ANI boundary values forgenus demarcation in a given family or order can be refined as the genomes of moretype strains and type species are sequenced and become publicly available. Thisapproach emphasizes the importance of type strains and type species in the continu-ous reevaluation of bacterial and archaeal taxa using genomic indices (e.g., ANI or AF)because these specimens function as reference points for their respective taxonomicgroups and remain available in viable form from multiple public repositories, thusmaking the approach reproducible, replicable, robust, and generalizable (53). In thisrespect, our approach is in line with recommendations regarding taxonomy, includingrelevant comparisons to type strains and type species for the characterization of novelBacteria and Archaea (8). It is reiterated that any rearrangement or reclassification oftaxa should be in alignment with the ICNP (7). In particular, a potential rearrangementof type species must be carefully analyzed, as a genus can only contain one typespecies, and rules and principles of nomenclature must be followed in order to properlydo that.
Uncultivated Bacteria and Archaea represented by metagenomic assembled ge-nomes (MAGs) and/or single-cell amplified genomes (SAGs) could potentially be usedin the implementation of this approach; however, it is noted that type strains and typespecies should be used as references for such analyses, if genomes are available (see“Guidelines,” below). The designation of type strains and type species is governed bythe ICNP and requires a thorough characterization of the microorganism and thedeposit of the type strain in at least two different culture collections in two differentcountries. Naturally, the proper characterization, and therefore, the type designation, isin most cases impossible for uncultivated Bacteria and Archaea given the currentguidelines set by the ICNP. This could change if genomes are subsequently consideredtype material, as recently proposed (54) and discussed (55). In lieu of type strains andtype species, proper and consistent genomic references must be established in order toanalyze taxonomic groups without cultivated representatives as well as rigorous stan-dards for sequence quality. Caution is advised in the interpretation of data resultingfrom low-quality MAGs since they can represent composite genomes of different strains(56). In theory, SAGs could serve as good taxonomic frames of reference for unculti-
Barco et al. ®
January/February 2020 Volume 11 Issue 1 e02475-19 mbio.asm.org 14
on May 17, 2020 by guest
http://mbio.asm
.org/D
ownloaded from
vated genera; however, genome incompleteness in SAGs is an issue that would needto be addressed.
The MiSI method explicitly excludes tRNA and rRNA genes in order to avoid inflationof AF or ANI values. However, the current taxonomic framework is largely based on theuse of the 16S rRNA gene for classification. Therefore, the approach herein investigatedis not completely independent of the 16S rRNA gene. The fact that in the majority ofthe groups tested, with the exception of known polyphyletic genera such as Bacillus(although significant differences between type and non-type species were still detectedin these groups), there was strong concordance of the type species of genera beingdelineated from non-type species of the primary reference provides evidence to thesuccess of the use of the 16S rRNA gene within the taxonomic framework, as far asprecision is concerned (i.e., not accuracy). The 16S rRNA gene has served and couldcontinue to serve the scientific community well, especially in maintaining relativeconsistency in classifications. However, the estimation of the genus inflection pointindicates that the 16S rRNA gene identity minimum threshold value of 94.5% couldunderestimate genera diversity in some taxa (e.g., Bacillaceae [Bacillus]) and overesti-mate it in others (e.g., Enterobacterales [Photorhabdus]), especially if multiple noniden-tical 16S rRNA genes are present in the genomes. This uncertainty in delineating generausing the 16S rRNA gene has also been shown by Yarza et al. (3), considering that theminimum and median identity values for delineation differ by nearly 2%, at 94.5% and96.4%, respectively. It is clear that different taxonomic groups are characterized bydifferent AF and ANI threshold values for genus demarcation. However, even withinestablished taxonomic groups, the effective AF and ANI threshold values will still be“moving targets,” dependent on the assignment and reassignment of new type species.Thus, a single, universal, stationary threshold for genus delineation will not be able tosensitively resolve genus assignments for all taxa.
The reader is made aware that variations in bidirectional, matched-pair AF values(AF1-2 and AF2-1) exist. These variations are usually small but could be relevant in theinterpretation of data, especially in borderline cases. Bidirectional, matched-pair ANIvalues (ANI1-2 and ANI2-1) differ by �0.3% in the majority of the cases, which wouldmake the error bars invisible to the naked eye. A representative figure with correspond-ing standard deviation values for AF is included in the supplemental material (Fig. S6).
The use of ANI has been previously stated as not applicable for the demarcation ofgenera (14, 18, 19, 57). Our results indicate that the MiSI method, and therefore AF andANI, can be used to visualize natural breakpoints that can be used to circumscribegenera with objectivity, reproducibility, and high resolution if the guidelines presentedin this study are followed. Our study identified potentially misclassified species innumerous genera that could not be previously resolved by alternative methods,including DNA-DNA hybridization, 16S rRNA gene-based phylogeny, and phylogenyusing concatenated highly conserved proteins. Adaptation of this method to demar-cate higher taxonomic ranks has not been tested, as it is beyond the scope of this study.Nonetheless, such an approach would be warranted. Finally, we highlight that theresults demonstrate a conserved genomic coherence at the genus level for numerousdifferent taxa, shedding light on a fundamental emergent property of Bacteria andArchaea.
MATERIALS AND METHODSANI and AF. ANI and alignment fraction (AF) values were obtained by the Microbial Species Identifier
(MiSI) method using ANIcalculator 2014-127, version 1.0 (https://ani.jgi.doe.gov/html/home.php?page�introduction) (17), and also as temporarily implemented in the JGI-Integrated Microbial Genomes andMicrobiomes (IMG/M) system (https://img.jgi.doe.gov/) via the Pairwise ANI tool (accessed 2017 to 2018).ANI, as defined by Varghese et al. (17), is calculated for a pair of genomes by averaging the nucleotideidentity of orthologous genes identified as bidirectional best hits (BBHs), which are the genes that show�70% sequence identity and �70% alignment of the shorter gene. AF, as defined by Varghese et al. (17),is calculated as a fraction of the sum of the lengths of BBH genes divided by the sum of the lengths ofall genes in a genome.
Strains. Unless otherwise noted, only type strains were used in this study. The NamesforLifeDatabase (NamesforLife, LLC, East Lansing, MI [58]) was primarily used to retrieve nomenclature (current
A Genus Definition for Bacteria and Archaea ®
January/February 2020 Volume 11 Issue 1 e02475-19 mbio.asm.org 15
on May 17, 2020 by guest
http://mbio.asm
.org/D
ownloaded from
up to 27 October 2019), nomenclatural history, and taxonomic information about validly published typestrains and type species associated with different genera. Complementary to this, equivalent strainnumbers assigned by different biological resource centers (e.g., the German Collection of Microorganismand Cell Cultures [DSMZ]) were searched in their respective online catalogues. In addition to what ismentioned above, primary taxonomic literature sources were used to confirm some of these designa-tions. All strain designations were cross-referenced in at least two databases.
Genomes and 16S rRNA gene sequences. Publicly available genomes were obtained from IMG andthe National Center for Biotechnology Information (NCBI; https://www.ncbi.nlm.nih.gov/). Generally,taxonomic orders/families that have genomes of �4 type species of genera and �4 non-type species ina given genus were considered. Genomes that were unanimously flagged by both IMG and the NCBI aslow quality were removed from the data set. About 36% of the genomes included in this study weresequenced as part of the JGI-Genomic Encyclopedia of Bacteria and Archaea, a project that focuses onsequencing the genomes of type strains (5, 59). Sequences of the 16S rRNA gene were obtained fromeither IMG, the NCBI, or EZBioCloud (60; https://www.ezbiocloud.net/). Alignments were separatelyperformed using the SILVA incremental aligner version 1.2.11 (61; https://www.arb-silva.de/aligner/) andClustalW via the Geneious platform (version R6; Biomatters, Auckland, New Zealand). Genetic distanceswere calculated in Geneious. PhyML (62) was used via the Geneious platform to generate the maximumlikelihood phylogenetic tree with the following settings: Hasegawa-Kishino-Yano (HKY85) substitutionmodel, 1,000 bootstraps, estimated transition/transversion ratio, estimated proportion of invariable sites,estimated gamma distribution, and branch lengths and substitution rate optimized.
Pangenome analysis. Pangenome analysis of Bacillus and other genera in Bacillaceae were pro-cessed in anvi’o (version 5.5) (63) following the workflow for microbial pangenomics (http://merenlab.org/2016/11/08/pangenomics-v2/, last accessed 13 May 2019 [64]). In brief, we generated contigdatabases for each genome contig file using the command “anvi-gen-contigs-database.” Prodigal (65)was used to identify open reading frames, and subsequently, each database was populated with HMMprofiles by comparison to a collection of single-copy genes using HMMER (66). Once contig databaseswere generated for all genomes, we used “anvi-gen-genomes-storage” to generate a master genomestorage database to use in the pangenome analysis. We used the NCBI-BLAST option in “anvi-pan-genome” to calculate gene similarity and MCL (67) for clustering under the following settings: minbit, 0.5;mcl inflation, 2; and minimum occurrence, 2. For phylogenomic analysis of Bacillus genomes, we selecteda subset of 21 genes based on the following criteria: minimum number of genomes in which gene clusteroccurs, 35; maximum number of genes from each genome, 1; maximum functional homogeneity index,0.9; and minimum geometric homogeneity index, 0.99. We then used the anvi’o command “anvi-get-sequences-for-gene-clusters” to concatenate and align target genes from all genomes and “anvi-gen-phylogenomic-tree” to generate the phylogenomic tree from the concatenated FASTA file. The tree wasthen rerooted using other genera of Bacillaceae as the outgroup.
Statistical analysis. All bidirectional, matched-pair values of ANI (ANI1-2 and ANI2-1) and AF (AF1-2and AF2-1) were reported as single averaged ANI and AF values in this study. The nonparametricWilcoxon test was performed separately for each set of ANI and AF values to determine significant(P � 0.05) differences between type and non-type species. All statistical analyses were performed usingthe statistical software JMP Pro, version 14 (SAS Institute, Inc.).
Rationale. The nomenclatural type or “type” is defined by the International Code of Nomenclatureof Prokaryotes (ICNP) as “that element of the taxon with which the name is permanently associated . . .”(rule 15 [7]). The type strain acts as the single reference for a given species. Each species and subspecieswith a validly published name has a type strain that is designated at the time the name is proposed. Thevast majority (�98%) are represented by one or more viable deposits that are descended from theoriginal type strain, are maintained in pure culture, agree closely with its character in the originaldescription, and are available in one or more public culture collections (rules 18a and 30 [7]). A typespecies, which is represented by its type strain, acts as the single reference for a given genus. Type strainsand type species may not necessarily be the most representative members of a species or genus,respectively. Rather, type strains and type species represent the first and often only member of therespective taxa, based on the opinion of the individual proposing each name. The rationale used in thisstudy is that sister species in a given genus should be relatively similar to the type species of the cognategenus, indicating high similarity at the genome level. Therefore, when a type species of a genus iscompared to a non-type species within the same genus, the AF and ANI values should be relatively high.In contrast to this, type species of different sister genera (i.e., in the same taxonomic family or order)should be relatively dissimilar at the genome level. This dissimilarity should be reflected in relatively lowAF and ANI values.
Guidelines. In addition to the genome(s) under consideration (e.g., of a cultured strain that needsclassification), at least two genomes of type species in the same family or order are needed, as follows:(i) the primary reference which is the phylogenetically closest relative that is a type species (i.e., the typespecies to which all other microbes will be compared), and (ii) all other type species (�1) in the samefamily or order. Furthermore, all available genomes of non-type species that belong to the same genusof the primary reference are needed. In order for the results to be meaningful, a species must only berepresented by the type strain unless its genome is not available, in which case a non-type strain of thesame species that is �99% identical in 16S rRNA gene sequence(s) (i.e., all copies of 16S rRNA gene inthe genome) may be used as a proxy until a genome becomes available. The accession numbers for thesegenomes should be reported. The genus demarcation boundary is set by the highest AF and ANI valuesof a type species (i.e., other than the primary reference) in an order/family.
Barco et al. ®
January/February 2020 Volume 11 Issue 1 e02475-19 mbio.asm.org 16
on May 17, 2020 by guest
http://mbio.asm
.org/D
ownloaded from
Interpretation. Every data point in the AF and ANI plot is calculated in relation to the primaryreference, which is defined above as the type strain of the type species of the specific genus to beanalyzed; therefore, the plot represents genomic similarity to the reference genome. If the primaryreference is compared against an identical genome (e.g., or a direct comparison against itself), an AFvalue of 1 and ANI value of 100 would result. If the primary reference is compared against relativelydissimilar genomes, the AF and ANI values will reflect proportionally lower values. Thus, the plots thatare generated effectively illustrate how distant other data points are from the primary reference genomein terms of AF and ANI values, or in other words, how distant other data points are from the upper-rightcorner (AF, 1; ANI, 100%).
When all comparisons are made in relation to the primary reference, a type species (i.e., other thanthe primary reference) should always cluster with other type species of genera in the same taxonomicfamily or order, reflecting relatively low AF and ANI values. A non-type species should always cluster withother non-type species of the same genus, reflecting relatively high AF and ANI values. The distinctclustering of type species and non-type species should be conserved without any overlap. If a non-typespecies is positioned within the cluster of type species in the same taxonomic family or order (i.e., at orbelow the genus demarcation boundary), this indicates that the non-type species could potentially beassigned to a different genus, as it is as genomically different from the primary reference, as are othertype species in the same taxonomic family or order. If a type species is positioned within the cluster ofnon-type species, there is support for potential reclassification of the type species within the same genusof the primary reference, given the accumulation of other supporting evidence (e.g., 16S rRNA geneidentity or phylogeny). It is emphasized that any proposed taxonomic rearrangement or reclassificationbased on AF and ANI results will necessarily affect nomenclature; therefore, any corresponding changesin nomenclature resulting from such proposal must be in alignment with the ICNP (7).
SUPPLEMENTAL MATERIALSupplemental material is available online only.TEXT S1, DOCX file, 0.1 MB.FIG S1, EPS file, 0.9 MB.FIG S2, EPS file, 0.7 MB.FIG S3, EPS file, 2.6 MB.FIG S4, EPS file, 0.3 MB.FIG S5, EPS file, 0.2 MB.FIG S6, EPS file, 1.3 MB.DATA SET S1, XLSX file, 0.5 MB.DATA SET S2, XLSX file, 0.1 MB.DATA SET S3, XLSX file, 0.1 MB.
ACKNOWLEDGMENTSWe thank Trudy Wassenaar and Nikos Kyrpides for comments on earlier versions of
the manuscript. We also would like to thank Anna Ratner at JGI for improving andupdating the interface of the Pairwise ANI tool on the IMG platform.
R.A.B. was supported by the National Science Foundation postdoctoral researchfellowship in biology (award number 1523639). J.J.S. was supported by the Gordon andBetty Moore Foundation through a grant to the Smithsonian Tropical Research Institute(GBMF5603). Part of this project was supported by the Center for Dark Energy BiosphereInvestigations (NSF award OCE-039564). The NamesforLife database and semanticresolution services were developed under the Small Business Technology Transferprogram of the U.S. Department of Energy under grants DE-FG02-07ER86321 andDE-SC0006191 (awarded to G.M.G.).
G.M.G. is a principal of NamesforLife, LLC, which is a licensee of Michigan StateUniversity. The company was formed to commercialize proprietary semantic resolutiontechnology based on U.S. patent 7,925,444 to Michigan State University. Services,including data curation and annotation, are currently provided to publishers, compos-itors, and data providers in the private and public sectors.
R.A.B. was involved in conceptualization of the study, data curation, formal analysis,funding acquisition, investigation (taxonomy and phylogeny), methodology, validation(quality control of datasets), visualization (figures and tables), writing of the originaldraft, and review and editing of the manuscript. G.M.G. was involved in conceptual-ization of the study, data curation, methodology, resources, validation (nomenclature,taxonomy, metadata), writing of the original draft, review and editing of the manu-script. J.J.S. was involved in formal analysis, visualization (pangenomes and phylo-
A Genus Definition for Bacteria and Archaea ®
January/February 2020 Volume 11 Issue 1 e02475-19 mbio.asm.org 17
on May 17, 2020 by guest
http://mbio.asm
.org/D
ownloaded from

genomic trees of Bacillus, Xenorhabdus, and Photorhabdus), and review and editing ofthe manuscript. J.P.A. was involved in funding acquisition, resources, and review andediting of the manuscript. K.H.N. was involved in conceptualization of the study,funding acquisition, resources, supervision, writing of the original draft, and review andediting of the manuscript. D.E. was involved in conceptualization of the study, fundingacquisition, project administration, resources, supervision, writing of the original draft,and review and editing of the manuscript. All authors read and approved the manu-script.
REFERENCES1. Garrity GM. 2019. NamesforLife database 20190930 release. Namesfor-
Life, East Lansing, MI.2. Quast C, Pruesse E, Yilmaz P, Gerken J, Schweer T, Yarza P, Peplies J,
Glöckner FO. 2013. The SILVA ribosomal RNA gene database project:improved data processing and Web-based tools. Nucleic Acids Res41:D590 –D596. https://doi.org/10.1093/nar/gks1219.
3. Yarza P, Yilmaz P, Pruesse E, Glöckner FO, Ludwig W, Schleifer K, Whit-man WB, Euzéby J, Amann R, Móra RR. 2014. Uniting the classification ofcultured and uncultured bacteria and archaea using 16S rRNA genesequences. Nat Rev Microbiol 12:635– 645. https://doi.org/10.1038/nrmicro3330.
4. Markowitz VM, Chen IM, Chu K, Pati A, Ivanova NN, Kyrpides NC. 2015.Ten years of maintaining and expanding a microbial genome andmetagenome analysis system. Trends Microbiol 23:730 –741. https://doi.org/10.1016/j.tim.2015.07.012.
5. Mukherjee S, Seshadri R, Varghese NJ, Eloe-Fadrosh EA, Meier-KolthoffJP, Göker M, Coates RC, Hadjithomas M, Pavlopoulos GA, Paez-Espino D,Yoshikuni Y, Visel A, Whitman WB, Garrity GM, Eisen JA, Hugenholtz P,Pati A, Ivanova NN, Woyke T, Klenk H-P, Kyrpides NC. 2017. 1,003reference genomes of bacterial and archaeal isolates expand coverageof the tree of life. Nat Biotechnol 35:676 – 683. https://doi.org/10.1038/nbt.3886.
6. Wu L, Ma J. 2019. The Global Catalogue of Microorganisms (GCM) 10Ktype strain sequencing project: providing services to taxonomists forstandard genome sequencing and annotation. Int J Syst Evol Microbiol69:895– 898. https://doi.org/10.1099/ijsem.0.003276.
7. Parker CT, Tindall BJ, Garrity GM. 2019. International Code of Nomen-clature of Prokaryotes. Int J Syst Evol Microbiol 69:S1–S111. https://doi.org/10.1099/ijsem.0.000778.
8. Tindall BJ, Rosselló-Móra R, Busse H-J, Ludwig W, Kämpfer P. 2010. Noteson the characterization of prokaryote strains for taxonomic purposes. IntJ Syst Evol Microbiol 60:249 –266. https://doi.org/10.1099/ijs.0.016949-0.
9. Stackebrandt E, Goebel BM. 1994. Taxonomic note: a place for DNA-DNAreassociation and 16S rRNA sequence analysis in the present speciesdefinition in Bacteriology. Int J Syst Bacteriol 44:846 – 849. https://doi.org/10.1099/00207713-44-4-846.
10. Stackebrandt E, Ebers J. 2006. Taxonomic parameters revisited: tarnishedgold standards. Microbiol Today 33:152–155.
11. Konstantinidis KT, Tiedje JM. 2005. Genomic insights that advance thespecies definition for prokaryotes. Proc Natl Acad Sci U S A 102:2567–2572. https://doi.org/10.1073/pnas.0409727102.
12. Konstantinidis KT, Tiedje JM. 2005. Towards a genome-based taxonomyfor prokaryotes. J Bacteriol 187:6258 – 6264. https://doi.org/10.1128/JB.187.18.6258-6264.2005.
13. Meier-Kolthoff JP, Auch AF, Klenk H-P, Göker M. 2013. Genomesequence-based species delimitation with confidence intervals and im-proved distance functions. BMC Bioinformatics 14:60. https://doi.org/10.1186/1471-2105-14-60.
14. Kim M, Oh H-S, Park S-C, Chun J. 2014. Towards a taxonomic coherencebetween average nucleotide identity and 16S rRNA gene sequencesimilarity for species demarcation of prokaryotes. Int J Syst Evol Micro-biol 64:346 –351. https://doi.org/10.1099/ijs.0.059774-0.
15. Goris J, Konstantinidis KT, Klappenbach JA, Coenye T, Vandamme P,Tiedje JM. 2007. DNA-DNA hybridization values and their relationship towhole-genome sequence similarities. Int J Syst Evol Microbiol 57:81–91.https://doi.org/10.1099/ijs.0.64483-0.
16. Richter M, Rosselló-Móra R. 2009. Shifting the genomic gold standardfor the prokaryotic species definition. Proc Natl Acad Sci U S A 106:19126 –19131. https://doi.org/10.1073/pnas.0906412106.
17. Varghese NJ, Mukherjee S, Ivanova N, Konstantinidis KT, Mavrommatis K,Kyrpides NC, Pati A. 2015. Microbial species delineation using wholegenome sequences. Nucleic Acids Res 43:6761– 6771. https://doi.org/10.1093/nar/gkv657.
18. Konstantinidis KT, Tiedje JM. 2007. Prokaryotic taxonomy and phylogenyin the genomic era: advancements and challenges ahead. Curr OpinMicrobiol 10:504 –509. https://doi.org/10.1016/j.mib.2007.08.006.
19. Qin Q, Xie B, Zhang X, Chen X, Zhou B, Zhou J, Oren A, Zhang Y. 2014. Aproposed genus boundary for the prokaryotes based on genomic insights.J Bacteriol 196:2210–2215. https://doi.org/10.1128/JB.01688-14.
20. Boucher Y, Douady CJ, Sharma AK, Kamekura M, Doolittle WF. 2004.Intragenomic heterogeneity and intergenomic recombination amonghaloarchaeal rRNA genes. J Bacteriol 186:3980 –3990. https://doi.org/10.1128/JB.186.12.3980-3990.2004.
21. Sun D-L, Jiang X, Wu QL, Zhou N-Y. 2013. Intragenomic heterogeneity of16S rRNA genes causes overestimation of prokaryotic diversity. ApplEnviron Microbiol 79:5962–5969. https://doi.org/10.1128/AEM.01282-13.
22. Parks DH, Chuvochina M, Waite DW, Rinke C, Skarshewski A, ChaumeilP-A, Hugenholtz P. 2018. A standardized bacterial taxonomy based ongenome phylogeny substantially revises the tree of life. Nat Biotechnol36:996 –1004. https://doi.org/10.1038/nbt.4229.
23. Barco RA, Garrity GM, Scott JJ, Amend JP, Nealson KH, Emerson D. 2018.A genus definition for Bacteria and Archaea based on genome related-ness and taxonomic affiliation. bioRxiv https://doi.org/10.1101/392480.
24. Takai K, Hirayama H, Nakagawa T, Suzuki Y, Nealson KH, Horikoshi K.2004. Thiomicrospira thermophila sp. nov., a novel microaerobi, thermo-tolerant, sulfur-oxidizing chemolithomixotroph isolated from a deep-seahydrothermal fumarole in the TOTO caldera, Mariana Arc, Western Pa-cific. Int J Syst Evol Microbiol 54:2325–2333. https://doi.org/10.1099/ijs.0.63284-0.
25. Tourova TP, Spiridonova EM, Berg IA, Kuznetsov BB, Sorokin DY. 2006.Occurrence, phylogeny and evolution of ribulose-1,5-bisphosphatecarboxylase/oxygenase genes in obligately chemolithoautotrophic sulfur-oxidizing bacteria of the genera Thiomicrospira and Thioalkalimicrobium.Microbiology 152:2159–2169. https://doi.org/10.1099/mic.0.28699-0.
26. Boden R, Scott KM, Williams J, Russel S, Antonen K, Rae AW, Hutt LP. 2017.An evaluation of Thiomicrospira, Hydrogenovibrio and Thioalkalimicrobium:reclassification of four species of Thiomicrospira to each Thiomicrorhabdusgen. nov. and Hydrogenovibrio, and reclassification of all four species ofThioalkalimicrobium to Thiomicrospira. Int J Syst Evol Microbiol 67:1140–1151. https://doi.org/10.1099/ijsem.0.001855.
27. Sorokin DY, Tourova TP, Kolganova TV, Spiridonova EM, Berg IA, MuyzerG. 2006. Thiomicrospira halophila sp. nov., a moderately halophilic, ob-ligately chemolithoautotrophic, sulfur-oxidizing bacterium from hyper-saline lakes. Int J Syst Evol Microbiol 56:2375–2380. https://doi.org/10.1099/ijs.0.64445-0.
28. Scott KM, Williams J, Porter CMB, Russel S, Harmer TL, Paul JH, AntonenKM, Bridges MK, Camper GJ, Campla CK, Casella LG, Chase E, Conrad JW,Cruz MC, Dunlap DS, Duran L, Fahsbender EM, Goldsmith DB, Keeley RF,Kondoff MR, Kussy BI, Lane MK, Lawler S, Leigh BA, Lewis C, Lostal LM,Marking D, Mancera PA, McClenthan EC, McIntyre EA, Mine JA, Modi S,Moore BD, Morgan WA, Nelson KM, Nguyen KN, Ogburn N, Parrino DG,Pedapudi AD, Pelham RP, Preece AM, Rampersad EA, Richardson JC,Rodgers CM, Schaffer BL, Sheridan NE, Solone MR, Staley ZR, Tabuchi M,Waide RJ, et al. 2018. Genomes of ubiquitous marine and hypersalineHydrogenovibrio, Thiomicrorhabdus and Thiomicrospira spp. encode adiversity of mechanisms to sustain chemolithoautotrophy in heteroge-neous environments. Environ Microbiol 20:2686 –2708. https://doi.org/10.1111/1462-2920.14090.
Barco et al. ®
January/February 2020 Volume 11 Issue 1 e02475-19 mbio.asm.org 18
on May 17, 2020 by guest
http://mbio.asm
.org/D
ownloaded from

29. Kabisch J, Thürmer A, Hübel T, Popper L, Daniel R, Schweder T. 2013.Characterization and optimization of Bacillus subtilis ATCC 6051 asan expression host. J Biotechnol 163:97–104. https://doi.org/10.1016/j.jbiotec.2012.06.034.
30. Cohn F. 1872. Untersuchungen über Bakterien. Beitr Biol Pflanz 1:127–224.31. Skerman VBD, McGowan V, Sneath P. 1980. Approved Lists of Bacte-
rial Names. Int J Syst Bacteriol 30:225– 420. https://doi.org/10.1099/00207713-30-1-225.
32. Pikuta E, Lysenko A, Chuvilskaya N, Mendrock U, Hippe H, Suzina N,Nikitin D, Osipov G, Laurinavichius K. 2000. Anoxybacillus pushchinensisgen. nov., sp. nov., a novel anaerobic, alkaliphilic, moderately thermo-philic bacterium from manure, and description of Anoxybacillus flavith-ermus comb. nov. Int J Syst Evol Microbiol 50:2109 –2117. https://doi.org/10.1099/00207713-50-6-2109.
33. Ahmed I, Yokota A, Yamazoe A, Fujiwara T. 2007. Proposal of Lysiniba-cillus boronitolerans gen. nov. sp. nov., and transfer of Bacillus fusiformisto Lysinibacillus fusiformis comb. nov. and Bacillus sphaericus to Lysini-bacillus sphaericus comb. nov. Int J Syst Evol Microbiol 57:1117–1125.https://doi.org/10.1099/ijs.0.63867-0.
34. Caro-Quintero A, Konstantinidis KT. 2012. Bacterial species may exist,metagenomics reveal. Environ Microbiol 14:347–355. https://doi.org/10.1111/j.1462-2920.2011.02668.x.
35. Konstantinidis KT, DeLong EF. 2008. Genomic patterns of recombination,clonal divergence and environment in marine microbial populations.ISME J 2:1052–1065. https://doi.org/10.1038/ismej.2008.62.
36. Rusch DB, Halpern AL, Sutton G, Heidelberg KB, Williamson S, YoosephS, Wu D, Eisen JA, Hoffman JM, Remington K, Beeson K, Tran B, Smith H,Baden-Tillson H, Stewart C, Thorpe J, Freeman J, Andrews-Pfannkoch C,Venter JE, Li K, Kravitz S, Heidelberg JF, Utterback T, Rogers Y-H, FalcónLI, Souza V, Bonilla-Rosso G, Eguiarte LE, Karl DM, Sathyendranath S, PlattT, Bermingham E, Gallardo V, Tamayo-Castillo G, Ferrari MR, StrausbergRL, Nealson K, Friedman R, Frazier M, Venter JC. 2007. The Sorcerer IIglobal ocean sampling expedition: Northwest Atlantic through EasternTropical Pacific. PLoS Biol 5:e77. https://doi.org/10.1371/journal.pbio.0050077.
37. Jain C, Rodriguez-R LM, Phillippy AM, Konstantinidis KT, Aluru S. 2018.High throughput ANI analysis of 90K prokaryotic genomes reveals clearspecies boundaries. Nat Commun 9:5114. https://doi.org/10.1038/s41467-018-07641-9.
38. Delmont TO, Kiefl E, Kilinc O, Esen OC, Uysal I, Rappé MS, Giovannoni S,Eren AM, Delmont TO, Kiefl E, Kilinc O, Esen OC, Uysal I, Rappé MS,Giovannoni S, Eren AM. 2019. Single-amino acid variants reveal evolu-tionary processes that shape the biogeography of a global SAR11 sub-clade. Elife 8:e46497. https://doi.org/10.7554/eLife.46497.
39. Palmer M, Venter SN, Coetzee MPA, Steenkamp ET. 2019. Prokaryoticspecies are sui generis evolutionary units. Syst Appl Microbiol 42:145–158. https://doi.org/10.1016/j.syapm.2018.10.002.
40. Tindall BJ. 2016. Priority of the genus name Clostridium Prazmowski 1880(Approved Lists 1980) vs Sarcina Goodsir 1842 (Approved Lists 1980) andthe creation of the illegitimate combinations Clostridium maximum(Lindner 1888) Lawson and Rainey 2016 and Clostridium ventriculi (Good-sir 1842) Lawson and Rainey 2016 that may not be used. Int J Syst EvolMicrobiol 66:4890 – 4894. https://doi.org/10.1099/ijsem.0.001361.
41. Cruz-Morales P, Orellana CA, Moutafis G, Moonen G, Rincon G, NielsenLK, Marcellin E. 2019. Revisiting the evolution and taxonomy of Clos-tridia, a phylogenomic update. Genome Biol Evol 11:2035–2044. https://doi.org/10.1093/gbe/evz096.
42. Thomas GM, Poinar GO. 1979. Xenorhabdus gen. nov., a genus of ento-mopathogenic, nematophilic bacteria of the family Enterobacteriaceae.Int J Syst Bacteriol 29:352–360. https://doi.org/10.1099/00207713-29-4-352.
43. Boemare NE, Akhurst RJ, Mourant RG. 1993. DNA relatedness betweenXenorhabdus spp. (Enterobacteriaceae), symbiotic bacteria of ento-mopathogenic nematodes, and a proposal to transfer Xenorhabdus lu-minescens to a new genus, Photorhabdus gen. nov. Int J Syst Bacteriol43:249 –255. https://doi.org/10.1099/00207713-43-2-249.
44. Rainey FA, Ehlers R-U, Stackebrandt E. 1995. Inability of the polyphasicapproach to systematics to determine the relatedness of the generaXenorhabdus and Photorhabdus. Int J Syst Bacteriol 45:379 –381. https://doi.org/10.1099/00207713-45-2-379.
45. Liu J, Berry R, Poinar G, Moldenke A. 1997. Phylogeny of Photorhabdusand Xenorhabdus species and strains as determined by comparison ofpartial 16S rRNA gene sequences. Int J Syst Bacteriol 47:948 –951.https://doi.org/10.1099/00207713-47-4-948.
46. Akhurst RJ, Boemare NE. 1986. A non-luminescent strain of Xenorhabdusluminescens. J Gen Microbiol 132:1917–1922. https://doi.org/10.1099/00221287-132-7-1917.
47. Zheng J, Ruan L, Sun M, Gänzle M. 2015. A genomic view of lactobacilliand pediococci demonstrates that phylogeny matches ecology andphysiology. Appl Environ Microbiol 81:7233–7243. https://doi.org/10.1128/AEM.02116-15.
48. Salvetti E, Harris HMB, Felis GE, O’Toole PW. 2018. Comparative genom-ics of the genus Lactobacillus reveals robust phylogroups that providethe basis for reclassification. Appl Environ Microbiol 84:e00993-18.https://doi.org/10.1128/AEM.00993-18.
49. Wittouck S, Wuyts S, Lebeer S. 2019. Towards a genome-based reclas-sification of the genus Lactobacillus. Appl Environ Microbiol 85:e02155-18. https://doi.org/10.1128/AEM.02155-18.
50. Morita H, Shimazu M, Shiono H, Toh H, Nakajima F, Akita H, Takagi M,Takami H, Murakami M, Masaoka T, Tanabe S, Hattori M. 2010. Lactoba-cillus equicursoris sp. nov., isolated from the faeces of a thoroughbredracehorse. Int J Syst Evol Microbiol 60:109 –112. https://doi.org/10.1099/ijs.0.009290-0.
51. Sun Z, Harris HMB, McCann A, Guo C, Argimón S, Zhang W, Yang X,Jeffery IB, Cooney JC, Kagawa TF, Liu W, Song Y, Salvetti E, Wrobel A,Rasinkangas P, Parkhill J, Rea MC, O’Sullivan O, Ritari J, Douillard FP, PaulRoss R, Yang R, Briner AE, Felis GE, de Vos WM, Barrangou R, Klaenham-mer TR, Caufield PW, Cui Y, Zhang H, O’Toole PW. 2015. Expanding thebiotechnology potential of lactobacilli through comparative genomicsof 213 strains and associated genera. Nat Commun 6:8322. https://doi.org/10.1038/ncomms9322.
52. Wittouck S, Wuyts S, Meehan CJ, van Noort V, Lebeer S. 2019. A genome-based species taxonomy of the Lactobacillus genus complex. mSystems4:e00264-19. https://doi.org/10.1128/mSystems.00264-19.
53. Schloss PD. 2018. Identifying and overcoming threats to reproducibility,replicability, robustness, and generalizability in microbiome research.mBio 9:e00525-18. https://doi.org/10.1128/mBio.00525-18.
54. Whitman WB. 2015. Genome sequences as the type material for taxo-nomic descriptions of prokaryotes. Syst Appl Microbiol 38:217–222.https://doi.org/10.1016/j.syapm.2015.02.003.
55. Konstantinidis KT, Rosselló-Móra R, Amann R. 2017. Uncultivated mi-crobes in need of their own taxonomy. ISME J 11:2399 –2406. https://doi.org/10.1038/ismej.2017.113.
56. Shaiber A, Eren AM, Shaiber A, Eren AM. 2019. Composite metagenome-assembled genomes reduce the quality of public genome repositories.mBio 10:e00725-19. https://doi.org/10.1128/mBio.00725-19.
57. Rodriguez-R LM, Konstantinidis KT. 2014. Bypassing cultivation to iden-tify bacterial species. Microbe 9:111–118. https://doi.org/10.1128/microbe.9.111.1.
58. Garrity GM. 2010. NamesforLife: BrowserTool takes expertise out of thedatabase and puts it right in the browser. Microbiol Today 37:9.
59. Wu D, Hugenholtz P, Mavromatis K, Pukall R, Dalin E, Ivanova NN, KuninV, Goodwin L, Wu M, Tindall BJ, Hooper SD, Pati A, Lykidis A, Spring S,Anderson IJ, D’haeseleer P, Zemla A, Singer M, Lapidus A, Nolan M,Copeland A, Han C, Chen F, Cheng J-F, Lucas S, Kerfeld C, Lang E,Gronow S, Chain P, Bruce D, Rubin EM, Kyrpides NC, Klenk H-P, Eisen JA.2009. A phylogeny-driven genomic encyclopaedia of Bacteria and Ar-chaea. Nature 462:1056 –1060. https://doi.org/10.1038/nature08656.
60. Yoon SH, Ha SM, Kwon S, Lim J, Kim Y, Seo H, Chun J. 2017. IntroducingEzBioCloud: a taxonomically united database of 16S rRNA and wholegenome assemblies. Int J Syst Evol Microbiol 67:1613–1617. https://doi.org/10.1099/ijsem.0.001755.
61. Pruesse E, Peplies J, Glöckner FO. 2012. SINA: accurate high-throughputmultiple sequence alignment of ribosomal RNA genes. Bioinformatics28:1823–1829. https://doi.org/10.1093/bioinformatics/bts252.
62. Guindon S, Gascuel O. 2003. A simple, fast, and accurate algorithm toestimate large phylogenies by maximum likelihood. Syst Biol 52:696 –704. https://doi.org/10.1080/10635150390235520.
63. Eren AM, Esen ÖC, Quince C, Vineis JH, Morrison HG, Sogin ML, DelmontTO. 2015. anvi’o: an advanced analysis and visualization platform for“omics” data. PeerJ 3:e1319. https://doi.org/10.7717/peerj.1319.
64. Delmont TO, Eren AM. 2018. Linking pangenomes and metagenomes:the Prochlorococcus metapangenome. PeerJ 6:e4320. https://doi.org/10.7717/peerj.4320.
65. Hyatt D, Chen G-L, LoCascio PF, Land ML, Larimer FW, Hauser LJ. 2010.Prodigal: prokaryotic gene recognition and translation initiation siteidentification. BMC Bioinformatics 11:119. https://doi.org/10.1186/1471-2105-11-119.
A Genus Definition for Bacteria and Archaea ®
January/February 2020 Volume 11 Issue 1 e02475-19 mbio.asm.org 19
on May 17, 2020 by guest
http://mbio.asm
.org/D
ownloaded from

66. Eddy SR. 2011. Accelerated profile HMM searches. PLoS Comput Biol7:e1002195. https://doi.org/10.1371/journal.pcbi.1002195.
67. van Dongen S, Abreu-Goodger C. 2012. Using MCL to extract clustersfrom networks. Methods Mol Biol 804:281–295. https://doi.org/10.1007/978-1-61779-361-5_15.
68. Backus L, Wels M, Boekhorst J, Dijkstra AR, Beerthuyzen M, Kelly WJ,Siezen RJ, van Hijum SAFT, Bachmann H. 2017. Draft genome sequencesof 24 Lactococcus lactis strains. Genome Announc 5:e01737-16. https://doi.org/10.1128/genomeA.01737-16.
69. Scott KM, Sievert SM, Abril FN, Ball LA, Barrett CJ, Blake RA, Boller AJ,Chain PS, Clark JA, Davis CR, Detter C, Do KF, Dobrinski KP, Faza BI,Fitzpatrick KA, Freyermuth SK, Harmer TL, Hauser LJ, Hügler M,Kerfeld CA, Klotz MG, Kong WW, Land M, Lapidus A, Larimer FW,Longo DL, Lucas S, Malfatti SA, Massey SE, Martin DD, McCuddin Z,Meyer F, Moore JL, Ocampo LH, Jr, Paul JH, Paulsen IT, Reep DK, Ren
Q, Ross RL, Sato PY, Thomas P, Tinkham LE, Zeruth GT. 2006. Thegenome of deep-sea vent chemolithoautotroph Thiomicrospiracrunogena XCL-2. PLoS Biol 4:e383.
70. Chaston JM1, Suen G, Tucker SL, Andersen AW, Bhasin A, Bode E, BodeHB, Brachmann AO, Cowles CE, Cowles KN, Darby C, de Léon L, Drace K,Du Z, Givaudan A, Herbert Tran EE, Jewell KA, Knack JJ, Krasomil-Osterfeld KC, Kukor R, Lanois A, Latreille P, Leimgruber NK, Lipke CM, LiuR, Lu X, Martens EC, Marri PR, Médigue C, Menard ML, Miller NM,Morales-Soto N, Norton S, Ogier J-C, Orchard SS, Park D, Park Y, QurolloBA, Sugar DR, Richards GR, Rouy Z, Slominski B, Slominski K, Snyder H,Tjaden BC, van der Hoeven R, Welch RD, Wheeler C, Xiang B, BarbazukB, Gaudriault S, Goodner B, Slater SC, Forst S, Goldman BS, Goodrich-BlairH. 2011. The entomopathogenic bacterial endosymbionts Xenorhabdusand Photorhabdus: convergent lifestyles from divergent genomes. PLoSOne 6:e27909. https://doi.org/10.1371/journal.pone.0027909.
Barco et al. ®
January/February 2020 Volume 11 Issue 1 e02475-19 mbio.asm.org 20
on May 17, 2020 by guest
http://mbio.asm
.org/D
ownloaded from