A genetic algorithm for constructing broadcast trees with cost and delay constraints in computer...
16
International Journal of Computer Networks & Communications (IJCNC) Vol.7, No.1, January 2015 DOI : 10.5121/ijcnc.2015.7103 35 A GENETIC ALGORITHM FOR CONSTRUCTING BROADCAST TREES WITH COST AND DELAY CONSTRAINTS IN COMPUTER NETWORKS Ahmed Y. Hamed 1 and Ghazi Al-Naymat 2 1 College of Applied Studies and Community Services, University of Dammam, KSA 2 Deanship of Information & Communication Technology,University of Dammam, KSA ABSTRACT We refer to the problem of constructing broadcast trees with cost and delay constraints in the networks as a delay-constrained minimum spanning tree problem in directed networks. Hence it is necessary determining a spanning tree of minimal cost to connect the source node to all nodes subject to delay constraints on broadcast routing. In this paper, we proposed a genetic algorithm for solving broadcast routing by finding the low-cost broadcast tree with minimum cost and delay constraints. In this research we present a genetic algorithm to find the broadcast routing tree of a given network in terms of its links. The algorithm uses the connection matrix of the given network to find the spanning trees and considers the weights of the links to obtain the minimum spanning tree. Our proposed algorithm is able to find a better solution, fast convergence speed and high reliability. The scalability and the performance of the algorithm with increasing number of network nodes are also encouraging. KEYWORDS Computer Networks, Broadcast Trees,Genetic Algorithm 1. INTRODUCTION In computer networks, broadcasting refers to transmitting a packet that will be received by every device in the network [1]. In practice, the scope of the broadcast is limited to a broadcast domain. Broadcasting a message is in contrast to unicast addressing in which a host sends datagrams to another single host identified by a unique IP address. Broadcast is a communication function that a node, called the source, sends messages to all the other nodes in the networks. Broadcast is an important function in applications of ad-hoc networks, such as in cooperative operations, group discussions, and so on. Broadcast routing is finding a broadcast tree, which is rooted from the source and contains all the nodes in the network. The cost of a broadcast is defined as the sum of cost of all the links that transmit the broadcast message in the broadcast tree. The spanning tree is defined as a connected sub-graph of that contains all its nodes and nocycles[2][3]. A simple approach is to use elementary tree-transformation which is based on the addition of a chord and deletion of an appropriate branch from a spanning tree. Thus, starting from any spanning tree of the graph with n nodes, one can generate all spanning trees by successive cyclic exchange[2]. This straightforward approach is difficult to computerize. So,
-
Upload
ijcncjournal -
Category
Technology
-
view
57 -
download
2
Transcript of A genetic algorithm for constructing broadcast trees with cost and delay constraints in computer...

International Journal of Computer Networks & Communications (IJCNC) Vol.7, No.1, January 2015
DOI : 10.5121/ijcnc.2015.7103 35
A GENETIC ALGORITHM FOR CONSTRUCTING
BROADCAST TREES WITH COST AND DELAY
CONSTRAINTS IN COMPUTER NETWORKS
Ahmed Y. Hamed1and Ghazi Al-Naymat
2
1College of Applied Studies and Community Services, University of Dammam, KSA 2Deanship of Information & Communication Technology,University of Dammam, KSA
ABSTRACT We refer to the problem of constructing broadcast trees with cost and delay constraints in the networks as a
delay-constrained minimum spanning tree problem in directed networks. Hence it is necessary determining
a spanning tree of minimal cost to connect the source node to all nodes subject to delay constraints on
broadcast routing. In this paper, we proposed a genetic algorithm for solving broadcast routing by finding
the low-cost broadcast tree with minimum cost and delay constraints. In this research we present a genetic
algorithm to find the broadcast routing tree of a given network in terms of its links. The algorithm uses the
connection matrix of the given network to find the spanning trees and considers the weights of the links to
obtain the minimum spanning tree. Our proposed algorithm is able to find a better solution, fast
convergence speed and high reliability. The scalability and the performance of the algorithm with
increasing number of network nodes are also encouraging.
KEYWORDS Computer Networks, Broadcast Trees,Genetic Algorithm
1. INTRODUCTION
In computer networks, broadcasting refers to transmitting a packet that will be received by every
device in the network [1]. In practice, the scope of the broadcast is limited to a broadcast domain.
Broadcasting a message is in contrast to unicast addressing in which a host sends datagrams to
another single host identified by a unique IP address.
Broadcast is a communication function that a node, called the source, sends messages to all the
other nodes in the networks. Broadcast is an important function in applications of ad-hoc
networks, such as in cooperative operations, group discussions, and so on. Broadcast routing is
finding a broadcast tree, which is rooted from the source and contains all the nodes in the
network. The cost of a broadcast is defined as the sum of cost of all the links that transmit the
broadcast message in the broadcast tree.
The spanning tree is defined as a connected sub-graph of that contains all its nodes and
nocycles[2][3]. A simple approach is to use elementary tree-transformation which is based on the
addition of a chord and deletion of an appropriate branch from a spanning tree. Thus, starting
from any spanning tree of the graph with n nodes, one can generate all spanning trees by
successive cyclic exchange[2]. This straightforward approach is difficult to computerize. So,

International Journal of Computer Networks & Communications (IJCNC) Vol.7, No.1, January 2015
36
Aggarwal[4] presented another algorithm, uses Cartesian products of (n-1) vertex cut sets whose
elements are the branches connected to any of the (n-1) nodes of the graph.
In this paper, we present a genetic algorithm to find the broadcast routing tree of a given network
in terms of its links. The algorithm uses the connection matrix of a given network to find the
spanning trees, and then it considers the weights of the links to obtain the minimum spanning
tree.
The paper is organized as follows: Section 2takes account of the related work. In Section 3, we
define the problem that we are aiming to solve. Section 4 highlights some facts about the
spanning tree structure. Section 5 discusses our proposed algorithm and all its steps. In Section 6,
we provide our experiments that demonstrate our technique’s findings. Finally, we provide our
conclusions in Section 7. The table below lists most of the used notations in this paper.
Notations
G
N
E
xij
d(e)
c(e)
M
MT
Ti
C(T)
D(T)
IN
Ri
Ci
RC
RD
A network graph.
The number ofnodesinG.
The number oflinks inG.
A link between node i and node jin G.
Thedelayof a link.
The cost of a link.
Theconnectionmatrix ofthe given network.
Theconnectionmatrixofthespanningtree.
The spanningtree-i.
The total cost of a spanning tree.
Thedelayofaspanningtree.
An initiallynumbers of the spanningtrees.
A rowiin a matrix.
A columniin a matrix.
The require cost.
The require delay.
2. RELATED WORK
The minimum spanning tree problem (MSTP, Busacker[5] has been well studied in this
framework, and efficient algorithms are widely known to solve this problem[6][7]. With minor
changes, the same algorithms can be used to find the maximum spanning tree as well.
Younes[8] presented an algorithm to find the spanning trees of the computer network in terms of
its links for using it in computing the network reliability.
Young[3]discussed these problems and described the first distributed algorithm for constructing
minimal spanning trees. The algorithm and the principles and techniques underlying its design
find application in large communication networks and large multiprocessor computer systems.
Chekuri [9] focused on scheduling to minimize two related objectives: the maximum response
time and maximum delay factor.

International Journal of Computer Networks & Communications (IJCNC) Vol.7, No.1, January 2015
37
Fard [10] demonstrated how the spanning trees of a network can be utilized to determine a node
pair across which a link should be added in order to achieve the maximum all-terminal reliability
improvement in a network.
Yamada [11] formulated the spanning tree detection problem, and developed heuristic as well as
exact algorithms to solve the problem. With these algorithms, problems with up to 1000 nodes
have been solved within a few seconds. The algorithms have been extended to list up all the
spanning trees of an arbitrary specified weight.
Kardan[12] presented the complete version of DBMST that regards packet loss and dynamism of
the network topology and provides reliable communication. The proposed method decreases the
power consumption of reliable broadcasting up to 15% in comparison with the basic version. In
DBMST, network structure adapts to topology variations quickly while it takes several hours for
other methods to find out variations in network.
Salama [13] formulated the problem of constructing broadcast trees for real-time traffic with
delay constraints in networks with asymmetric link loads as a delay-constrained minimum
spanning tree (DCMST) problem in directed networks.
The Delay-Constrained Capacitated Minimum Spanning Tree (DC-CMST) is a recently proposed
problem which arises in the design of the topology of communications networks. The DC-CMST
proposes the joint optimization of the network topology in terms of the traffic capacity and its
mean time delay[14]. He presented an evolutionary algorithm which uses Dandelion-encoding is
proposed to solve the problem.
Younes[15] presented the broadcast routing algorithms that aim to minimize the cost of the
routing path.
Sameh [16]presented an algorithm to manipulate the problem of minimizing the mean completion
delay in wireless broadcast for instantly decodable network coding.
Salama [17] formulated the problem of constructing broadcast trees for real-time traffic with
delay constraints in networks with asymmetric link loads as a delay-constrained minimum
spanning tree (DCMST) problem in directed networks. They proved that this problem is NP-
complete, and they proposed an efficient heuristic to solve the problem based on Prim’s algorithm
for the unconstrained minimum spanning tree problem. This is the first heuristic designed
specifically for solving the DCMST problem.
3. PROBLEM DESCRIPTION
Given a network in which each link has a fixed cost and delay, find a broadcast tree such that the
cost of the broadcast tree is minimized and delay is constrained. Thus, we present a genetic
algorithm to find the broadcast routing tree of a given network in terms of its links which will
solve our problem. The algorithm uses the connection matrix of a given network to find the
spanning trees, and also is based on the weights of the links to obtain the minimum spanning tree.
The proposed algorithm goal is able to find a better solution, fast convergence speed and high
reliability when obtaining the spanning trees. Extensive simulations have been conducted and the
results have demonstrated the efficiency of the proposed algorithms
The definition of the problems as follows:

International Journal of Computer Networks & Communications (IJCNC) Vol.7, No.1, January 2015
38
A network is usually represented as a weighted directed graph where N denotes the
set of nodes and E denotes the set of communication links connecting the nodes.
and denote the number of nodes and links in the network respectively.
Any link e E has a cost and a delay associated with it. and may take any
positive real values.
A spanning tree is rooted at a source node and contains exactly one path from
s to any node – . The total cost of a tree is simply:
A path is the set of tree links connecting s to The cost of the path
is:
And the delay of that path is:
Thus the maximum delay of a spanning tree is:
Our problem in directed networks is: constructs the spanning tree T(s) rooted at s that has
minimum total cost among all possible spanning trees rooted at s which have a maximum delay
less than or equal to a given delay constraint D.
The problem can be expressed as: Given a directed network , a positive
for each e , a source , a positive delay constraint RD and a positive cost RC, find a
spanning tree T(s) that satisfy:
Where RC is the require cost.
Where RD id the require delay.
International Journal of Computer Networks & Communications (IJCNC) Vol.7, No.1, January 2015
39
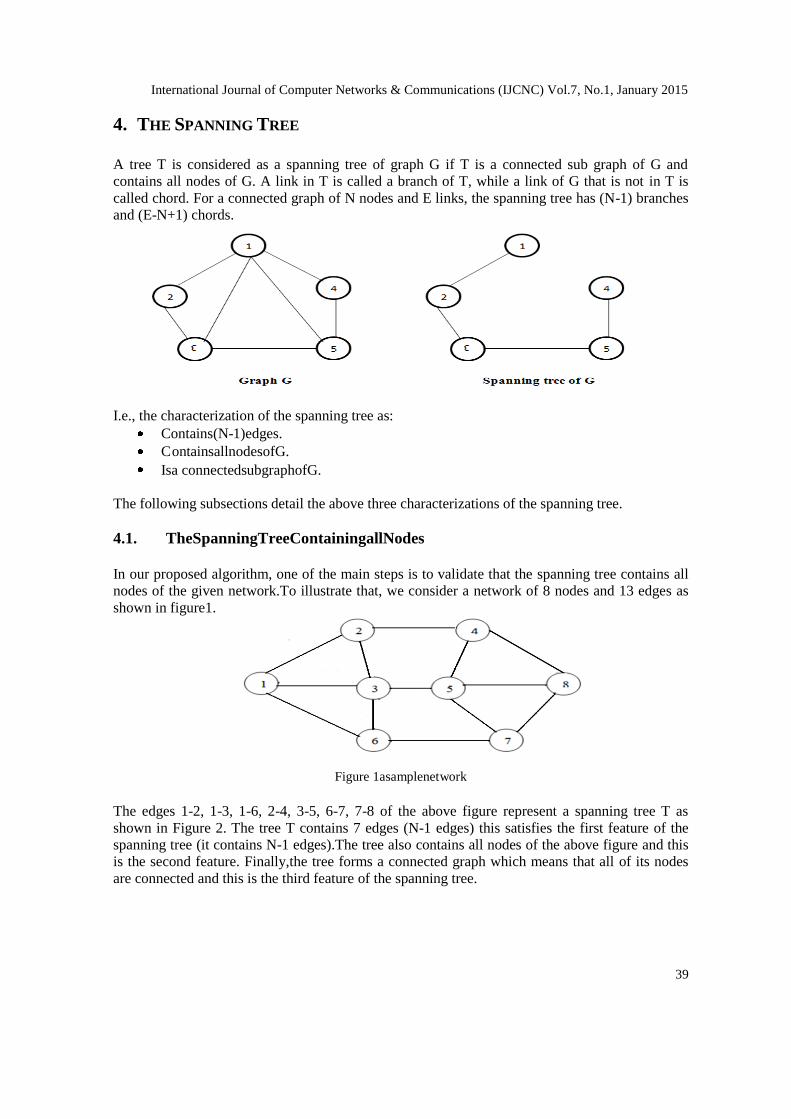
4. THE SPANNING TREE
A tree T is considered as a spanning tree of graph G if T is a connected sub graph of G and
contains all nodes of G. A link in T is called a branch of T, while a link of G that is not in T is
called chord. For a connected graph of N nodes and E links, the spanning tree has (N-1) branches
and (E-N+1) chords.
I.e., the characterization of the spanning tree as:
Contains(N-1)edges.
ContainsallnodesofG.
Isa connectedsubgraphofG.
The following subsections detail the above three characterizations of the spanning tree.
4.1. TheSpanningTreeContainingallNodes
In our proposed algorithm, one of the main steps is to validate that the spanning tree contains all
nodes of the given network.To illustrate that, we consider a network of 8 nodes and 13 edges as
shown in figure1.
Figure 1asamplenetwork
The edges 1-2, 1-3, 1-6, 2-4, 3-5, 6-7, 7-8 of the above figure represent a spanning tree T as
shown in Figure 2. The tree T contains 7 edges (N-1 edges) this satisfies the first feature of the
spanning tree (it contains N-1 edges).The tree also contains all nodes of the above figure and this
is the second feature. Finally,the tree forms a connected graph which means that all of its nodes
are connected and this is the third feature of the spanning tree.

International Journal of Computer Networks & Communications (IJCNC) Vol.7, No.1, January 2015
40
Figure 2A spanning tree of Figure 1.
The connection matrix M describes all direct connections between the nodes of a graph. The
weighted connection matrix is a square matrix of dimension n x n. Entries of M are defined such
that the entry Mij at the intersection of row i and column j, represents a connection from node i to
node j. The rules that define a weighted connection matrix are as follows:
That is, the connection matrix of the Figure 1is:
Figure 3Theconnectionmatrixof tree inFigure 1
The spanning tree T contains all nodes of the given network, if all rows and columns ofMT are
non-zero elements (MT is the connection matrix of T, which is created using Equation (7)).
For example, if we consider the above spanning tree (Figure 2), the connection matrix MT is in
the following form:
Figure 4Theconnectionmatrixofthe above spanningtree in Figure 2
International Journal of Computer Networks & Communications (IJCNC) Vol.7, No.1, January 2015
41
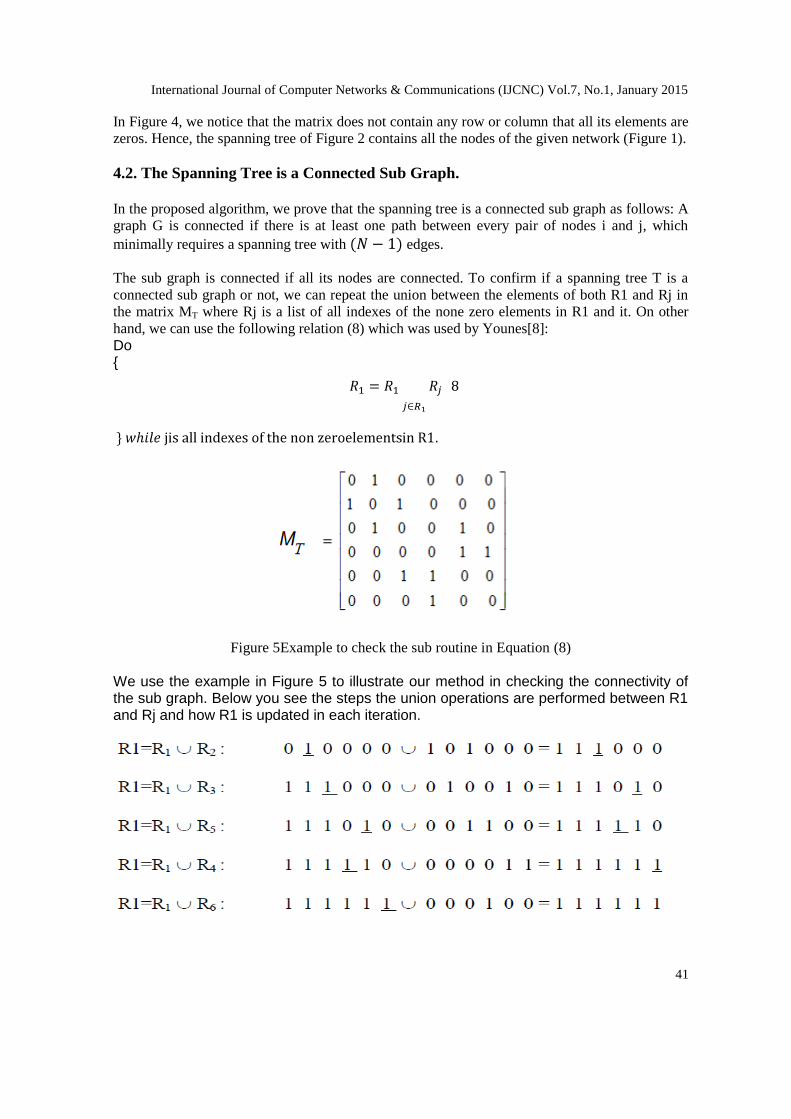
In Figure 4, we notice that the matrix does not contain any row or column that all its elements are
zeros. Hence, the spanning tree of Figure 2 contains all the nodes of the given network (Figure 1).
4.2. The Spanning Tree is a Connected Sub Graph. In the proposed algorithm, we prove that the spanning tree is a connected sub graph as follows: A
graph G is connected if there is at least one path between every pair of nodes i and j, which
minimally requires a spanning tree with edges.
The sub graph is connected if all its nodes are connected. To confirm if a spanning tree T is a
connected sub graph or not, we can repeat the union between the elements of both R1 and Rj in
the matrix MT where Rj is a list of all indexes of the none zero elements in R1 and it. On other
hand, we can use the following relation (8) which was used by Younes[8]:
Do {
.
Figure 5Example to check the sub routine in Equation (8)
We use the example in Figure 5 to illustrate our method in checking the connectivity of the sub graph. Below you see the steps the union operations are performed between R1 and Rj and how R1 is updated in each iteration.

International Journal of Computer Networks & Communications (IJCNC) Vol.7, No.1, January 2015
42
If there exists one zero element in R1, this mean the spanning tree Ti is not aconnected sub graph.
Hence, the spanning tree (1 0 1 0 1 1 1 0) is a connected sub graph.To the best of knowledge, this
technique is a unique one and not previously used to validate whether the tree is connected or not.
5. THE PROPOSED GENETIC ALGORITHM (GA)
In the proposed GA, each spanning tree is represented by a binary string that can be used as a
chromosome. Each element of the chromosome represents a link in the network topology. So, for
a network of N nodes and E edges, there are E string components in each candidate solution x.
Each chromosome must contains N-1 none zero elements. For example, the spanning tree of
Figure 2is represented as a chromosome as shown in Figure 6.
1-2 1-3 1-6 2-3 2-4 3-5 3-6 4-5 4-8 5-7 5-8 6-7 7-8
1 1 1 0 1 1 0 0 0 0 0 1 1
Figure 6Thechromosome form
5.1. Initial Population
The initial population is generated according to the following steps:
1. Achromosomex intheinitialpopulationcanbe generatedas shownin Figure 6.
2. ThechromosomemustcontainonlyN-1nonezeroelements
3. Repeatsteps1 to2 to generatepop_size(population size), numberofchromosomes.
5.2. Fitness Function
The fitness function is used in each iteration of the genetic algorithm to evaluate the quality of all
proposed solutions to the problem in the current population. Hence; the fitness function is used as
a filter function to eliminate all non-candidate solutions. The fitness function used to verify the
solution is as follow:
The chromosome must contain all nodes of the network.
The chromosome must be a connected sub graph using Equation (8).
5.3. Genetic Crossover Operation
The crossover operation is used to breed a child from two parents by one cut point. The crossover
operation will perform if the crossover ratio (Pc=0.90) is verified. The cut point israndomly
selected. The crossover operation is performed as follows:
Randomly selecttwochromosomesfromthecurrentpopulation.
Randomlyselectthecutpoint
Fillthecomponentsofthechromosome
a. Bytakingthecomponentsofthefirstchromosome(fromthefirst genetothecut
point)andfill uptothechild.
b. Also, tacking the components of the second chromosome (from the cut point+1 to
the last gene) and fill up to the child.

International Journal of Computer Networks & Communications (IJCNC) Vol.7, No.1, January 2015
43
The offspring generated by crossover operation is shown in Figure 7.
Cut point
Parent 1 1 1 0 1 1 0 0 0 0 0 1 1
Child 1 1 1 0 1 1 0 1 0 1 0 1 0
1 0 1 0 0 1 0 1 0 1 0 1 0
Figure 7 Example of the crossover operation
5.4. Genetic Mutation Operation
The mutation operation is performed on bit-by-bit basis. In the proposed approach, the mutation
operation will be performed if the mutation ratio (Pm) is verified. The Pm in this approach is
chosen experimentally to be 0.02. The point to be mutated is selected randomly. The offspring
generated by mutation is shown in Figure 8.
1 1 1 0 1 1 0 1 0 0 0 1 0
1 1 1 0 1 1 1 1 0 0 0 1 0
Figure 8 Example of the mutation operation.
5.5. The Algorithm
The following pseudocodeillustrates the use of our assumptions and proposed functions to find
the minimum spanning tree.
Algorithm Find Minimum Spanning Tree
Input : Set the parameters: pop_size, max_gen, RC,RD, Pm,Pc
Output : Minimum Spanning Tree
1. Generatetheinitialpopulationaccording to the steps in Section5.1.
2. gen←1.
3. While(gen< =max_gen)do {
4. P ←1
5. While(P<=pop_size)do {
6. Geneticoperations
a. Obtainchromosomesofthe newpopulation.
b. Selecttwochromosomesfromthepopulationrandomly,
c. Applycrossoveraccordingto Pcparameter(Pc>=0.90),

International Journal of Computer Networks & Communications (IJCNC) Vol.7, No.1, January 2015
44
d. Mutatethe newchildaccordingtoPmparameter(Pm<=0.02),
e. Compute the fitness function according to section 5.2
f. If the result of fitness function is false then discard the child and go to step 6.b.
7. Computethe totalcostofthenewchild C(x)accordingtoEquation (1).
8. Find all the paths from the source node to all the nodes in the child (
9. Compute the delay of each path in the child ( according to Equation
(3).
10. Compute the maximum delay of the child ( according to Equation (4).
11. If the C(x)<=RC and then stop
12. Savethischildasa candidatesolution.
13. P← P+1.
14. }
15. Setgen=gen+ 1
16. if gen >max_gen then stop
17. }
6. EXPERIMENTAL RESULTS
The proposed algorithm is implemented using Borland C++ Ver. 5.5 and the initial values of the
parameters are: population size (pop-size=20), maximum generation (max-gen=250), Pc=0.90,
Pm=0.02. We have applied our proposed technique more than 20 cases from 4 nodes until 20
nodes. The technique reads the connection matrix of the given network and the cost and delay of
each link of that network. Then it generates the connection matrix, cost and delay of each link of
other networks. Two scenarios are used to test and validate the proposed technique. The
subsections below demonstrate that.
6.1. Scenario One
The algorithmwas applied on two cases of known data (read the connection matrix of the given
network, the cost and delay of each link). The first case is a network with 8 nodes and 13 links
and the second case is a network with 16 nodes and 28 links.
6.1.1. Case 1:
We consider the given network as shown in Figure 1 (8 nodes and 13 links), the connection
matrix as shown in Figure 2, and the cost and delay for each link are shown in Table 1.
Table 1 the cost and delay of the links
Link Cost Delay
1-2 16 1
1-3 12 2
1-6 28 3
2-3 15 3
2-4 22 1
3-5 10 2

International Journal of Computer Networks & Communications (IJCNC) Vol.7, No.1, January 2015
45
3-6 17 1
4-5 14 2
4-8 24 3
5-7 20 2
5-8 23 1
6-7 18 3
7-8 21 2
The required cost and delay of the minimum spanning tree are: RC<=110 and RD<=7.
1) Theminimumspanningtree of the first caseis shown in Figure 9.
Figure 9 The minimum spanning tree of the network with 8 nodes and 13 links.
2) All paths of the minimum spanning treeP(T(s),v) are shown in the Table 2.
Table 2 All the paths of the minimum spanning tree
No. P(T(s),v)
1 1 3 2 27 5
2 1 3 12 2
3 1 3 5 4 36 6
4 1 3 5 22 4
5 1 3 6 29 3
6 1 3 6 7 47 6
7 1 3 5 8 45 5
3) The cost and maximum delay of the minimum spanning tree are:
=109 and =6.
4) The path of maximum delay is shown in Figure 10.

International Journal of Computer Networks & Communications (IJCNC) Vol.7, No.1, January 2015
46
Figure 10 The path of maximum delay
6.1.2. Case 2
In this case, the algorithmwas applied on a network with 16 nodes and 28 links as shown in
Figure 11. The cost and delay for each link are shown in the Table 3.
Figure 111 A network with 16 nodes and 28 links
Table 3 the cost and delay of the links
# Link Cost Delay # Link Cost Delay
1 1-2 10 1 15 7-11 24 3
2 1-3 12 2 16 8-12 25 2
3 1-4 15 3 17 9-10 21 3
4 2-3 13 3 18 9-13 10 2
5 2-5 14 2 19 10-11 9 1
6 3-4 18 1 20 10-13 18 2
7 3-7 23 2 21 11-12 17 3
8 4-8 16 2 22 11-14 16 1
9 5-6 19 2 23 12-15 22 1
10 5-9 21 1 24 13-14 11 1
11 5-10 13 3 25 13-16 12 3
12 6-7 19 2 26 14-15 13 2
13 7-8 18 1 27 14-16 22 1
14 7-10 20 4 28 15-16 18 2
The required cost and delay of the case 2 are: (RC<=220 and RD<=15).
1) The minimum spanning tree is shown in Figure 12.

International Journal of Computer Networks & Communications (IJCNC) Vol.7, No.1, January 2015
47
Figure 12 The minimum spanning tree of the Figure 11
2) All the paths of the minimum spanning tree are sown in the Table 4
Table 4 All the paths of the minimum spanning tree
No. P(T(s),v)
1 1 2 10 1
2 1 2 3 23 4
3 1 4 15 3
4 1 2 5 24 3
5 1 2 5 6 43 5
6 1 2 5 6 7 62 7
7 1 4 8 31 11
8 1 2 5 10 11 14 13 9 85 6
9 1 2 5 10 37 6
10 1 2 5 10 11 48 7
11 1 4 8 12 56 7
12 1 2 5 10 11 14 13 75 9
13 1 2 5 10 11 14 45 6
14 1 2 5 10 11 14 15 58 8
15 1 2 5 10 11 14 13 16 87 12
1) The cost and maximum delay of the minimum spanning tree are:
=215 and =12.
2) The path of the maximum delay is shown in Figure 13
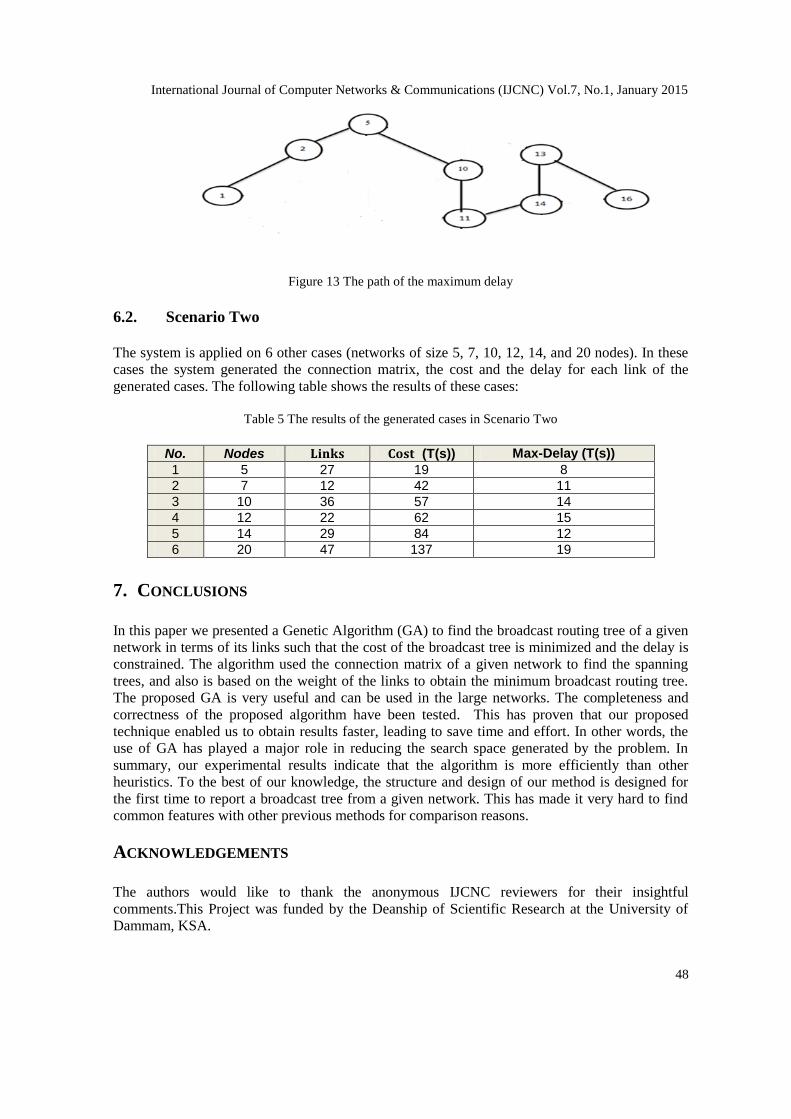
International Journal of Computer Networks & Communications (IJCNC) Vol.7, No.1, January 2015
48
Figure 13 The path of the maximum delay
6.2. Scenario Two
The system is applied on 6 other cases (networks of size 5, 7, 10, 12, 14, and 20 nodes). In these
cases the system generated the connection matrix, the cost and the delay for each link of the
generated cases. The following table shows the results of these cases:
Table 5 The results of the generated cases in Scenario Two
No. Nodes (T(s)) Max-Delay (T(s))
1 5 27 19 8
2 7 12 42 11
3 10 36 57 14
4 12 22 62 15
5 14 29 84 12
6 20 47 137 19
7. CONCLUSIONS
In this paper we presented a Genetic Algorithm (GA) to find the broadcast routing tree of a given
network in terms of its links such that the cost of the broadcast tree is minimized and the delay is
constrained. The algorithm used the connection matrix of a given network to find the spanning
trees, and also is based on the weight of the links to obtain the minimum broadcast routing tree.
The proposed GA is very useful and can be used in the large networks. The completeness and
correctness of the proposed algorithm have been tested. This has proven that our proposed
technique enabled us to obtain results faster, leading to save time and effort. In other words, the
use of GA has played a major role in reducing the search space generated by the problem. In
summary, our experimental results indicate that the algorithm is more efficiently than other
heuristics. To the best of our knowledge, the structure and design of our method is designed for
the first time to report a broadcast tree from a given network. This has made it very hard to find
common features with other previous methods for comparison reasons.
ACKNOWLEDGEMENTS
The authors would like to thank the anonymous IJCNC reviewers for their insightful
comments.This Project was funded by the Deanship of Scientific Research at the University of
Dammam, KSA.

International Journal of Computer Networks & Communications (IJCNC) Vol.7, No.1, January 2015
49
REFERENCES
[1] A. Tanenboum and D. Wetherall, Computer Networks, Cloth: Prentice Hall, 2010.
[2] N. Deo, Graph theory with application to engineering and computer science, Englewood Cliffs, NJ:
Prentice- Hall, 1974.
[3] H. Young, “A method for computing complex system reliability,” IEEE Transaction on Reliability,
vol. 21, no. 4, pp. 215-219, 1972.
[4] K. Aggarwal, “Reliability evaluation in computer communication networks,” IEEE Transaction on
Reliability, vol. 30, no. 1, pp. 32-35, 1981.
[5] R. Busacker, Finite graphs and networks: an introduction with applications, New York: McGraw-Hill,
1965.
[6] T. L. M. J. B. O. Ravindra K. Ahuja, Network Flows: Theory, Algorithms, and Applications, 1993.
[7] J. Joseph B. Kruskal, “On the shortest spanning subtree of a graph and the travelingsalesman
problem,” in Proceedings of the American Mathematical Society, 1956.
[8] A. Younes, “The spanning trees and computer networks reliability,” Egyptian informatics journa, vol.
7, no. 2, 2006.
[9] C. Chekuri, “ Minimizing Maximum Response Time and Delay Factor in Broadcast Scheduling,”
Lecture Notes in Computer Science, vol. 5757, pp. 444-455, 2009.
[10] N. Fard, “Spanning tree in all terminal network reliability expansion,” Computer Communications,
vol. 24, pp. 1348-1353, 2001.
[11] T. Yamada, “Heuristic and exact algorithms for the spanning tree detection problem,” Computer &
Operation Research, vol. 32, pp. 239-255, 2005.
[12] A. Kardan and M. Kajbaf, “Distributed Broadcast Minimum Spanning Tree,” in The 3rd International
Conference on Intelligent Sensors, Sensor Networks and Information, Melbourne, Qld, 2007.
[13] H. Salama, D. Reeves and Y. Viniotis, “The delay-constrained minimum spanning tree problem,” in
Proceedings of the Second IEEE Symposium on Computers and Communications, Alexandria, 1997.
[14] M. Angel, “Solving the Delay-Constrained Capacitated Minimum Spanning Tree Problem Using a
Dandelion-Encoded Evolutionary Algorithm,” Simulated Evolution and Learning, vol. 5361, pp. 151-
160, 2008.
[15] A. Younes, “Minimizing the broadcast routing in the computer networks,” International Journal of
Computer Engineering Science, vol. 2, no. 3, pp. 62-68, 2012.
[16] S. Sorour, E. S. R. Sr. and S. Valaee, “On Minimizing Broadcast Completion Delay for Instantly
Decodable Network Coding,” in IEEE International Conference on Communications, Cape Town,
2010.
[17] H. F. D. S. R. Salama and Y. Viniotis, “An Efficient Delay-Constrained Minimum Spanning Tree
Heuristic,” in Proceedings of the 5th International Conference on Computer Communications and
Networks, 1996.
[18] K. Y. Dalal, “A Distributed Algorithm for Constructing Minimal Spanning Trees,” IEEE Transaction
on Software Engineering, vol. 13, no. 3, pp. 398 - 405, 1987.

International Journal of Computer Networks & Communications (IJCNC) Vol.7, No.1, January 2015
50
Authors
Ahmed Younes Hamedreceived his PhD degree in Sept.1996 from South Valley University,
Egypt. His research interests include Artificial Intelligence and genetic algorithms; specifically
in the area of computer networks. Recently, he has started conducting a research in the area of
Image Processing. Currently, he works as an Associate Professor in University of Dammam,
KSA. Younes always publishes the outcome of his research in international journals and conferences.
Ghazi Al-Naymat received his PhD degree in May 2009 from the school of Information
Technologies at The University of Sydney, Australia. His research interests include data
mining and knowledge discovery; specifically in the area of spatial, spatio-temporal and time
series applications. Recently, he has started conducting a research in the area of Cloud
Computing and Big data analytics. Currently, he works as an Assistant Professor in
University of Dammam, KSA. Al-Naymat always publishes the outcome of his research in international
journals and conferences.