A general computational model of mitochondrial...
44
A supplementary document of A general computational model of mitochondrial metabolism in a whole organelle scale Katsuyuki Yugi and Masaru Tomita Institute for Advanced Biosciences, Keio University, Japan
Transcript of A general computational model of mitochondrial...

A supplementary document of
A general computational model of mitochondrial metabolism
in a whole organelle scale
Katsuyuki Yugi and Masaru Tomita
Institute for Advanced Biosciences, Keio University, Japan

Contents
1 Abbreviations 31.1 Species and organs . . . . . . . . . . . . . . . . . . . . . . . . . . . . . . . . . . . . . . 31.2 Metabolites and enzymes: A-G . . . . . . . . . . . . . . . . . . . . . . . . . . . . . . . 41.3 Metabolites and enzymes: H-Z . . . . . . . . . . . . . . . . . . . . . . . . . . . . . . . 51.4 Other metabolites . . . . . . . . . . . . . . . . . . . . . . . . . . . . . . . . . . . . . . 6
2 Reactions 62.1 Respiratory chain . . . . . . . . . . . . . . . . . . . . . . . . . . . . . . . . . . . . . . . 62.2 TCA cycle . . . . . . . . . . . . . . . . . . . . . . . . . . . . . . . . . . . . . . . . . . . 72.3 Fatty acid β oxidation . . . . . . . . . . . . . . . . . . . . . . . . . . . . . . . . . . . . 72.4 Metabolite transporting system . . . . . . . . . . . . . . . . . . . . . . . . . . . . . . . 8
3 Parameter classification 8
4 Kinetic parameters 94.1 AAC . . . . . . . . . . . . . . . . . . . . . . . . . . . . . . . . . . . . . . . . . . . . . . 94.2 ACD . . . . . . . . . . . . . . . . . . . . . . . . . . . . . . . . . . . . . . . . . . . . . . 104.3 ACO . . . . . . . . . . . . . . . . . . . . . . . . . . . . . . . . . . . . . . . . . . . . . . 104.4 AGC . . . . . . . . . . . . . . . . . . . . . . . . . . . . . . . . . . . . . . . . . . . . . . 114.5 AlaTA . . . . . . . . . . . . . . . . . . . . . . . . . . . . . . . . . . . . . . . . . . . . . 114.6 AspTA . . . . . . . . . . . . . . . . . . . . . . . . . . . . . . . . . . . . . . . . . . . . . 124.7 CAC . . . . . . . . . . . . . . . . . . . . . . . . . . . . . . . . . . . . . . . . . . . . . . 124.8 CIC . . . . . . . . . . . . . . . . . . . . . . . . . . . . . . . . . . . . . . . . . . . . . . 134.9 Complex I . . . . . . . . . . . . . . . . . . . . . . . . . . . . . . . . . . . . . . . . . . . 144.10 Complex III . . . . . . . . . . . . . . . . . . . . . . . . . . . . . . . . . . . . . . . . . . 154.11 Complex IV . . . . . . . . . . . . . . . . . . . . . . . . . . . . . . . . . . . . . . . . . . 154.12 Complex V . . . . . . . . . . . . . . . . . . . . . . . . . . . . . . . . . . . . . . . . . . 164.13 CPT I . . . . . . . . . . . . . . . . . . . . . . . . . . . . . . . . . . . . . . . . . . . . . 174.14 CPT II . . . . . . . . . . . . . . . . . . . . . . . . . . . . . . . . . . . . . . . . . . . . 174.15 CS . . . . . . . . . . . . . . . . . . . . . . . . . . . . . . . . . . . . . . . . . . . . . . . 184.16 DIC . . . . . . . . . . . . . . . . . . . . . . . . . . . . . . . . . . . . . . . . . . . . . . 194.17 ECH . . . . . . . . . . . . . . . . . . . . . . . . . . . . . . . . . . . . . . . . . . . . . . 194.18 ETF-QO . . . . . . . . . . . . . . . . . . . . . . . . . . . . . . . . . . . . . . . . . . . . 204.19 FM . . . . . . . . . . . . . . . . . . . . . . . . . . . . . . . . . . . . . . . . . . . . . . . 204.20 HCD . . . . . . . . . . . . . . . . . . . . . . . . . . . . . . . . . . . . . . . . . . . . . . 214.21 IDHa . . . . . . . . . . . . . . . . . . . . . . . . . . . . . . . . . . . . . . . . . . . . . . 214.22 IDHb . . . . . . . . . . . . . . . . . . . . . . . . . . . . . . . . . . . . . . . . . . . . . 224.23 MDH . . . . . . . . . . . . . . . . . . . . . . . . . . . . . . . . . . . . . . . . . . . . . 224.24 NDK . . . . . . . . . . . . . . . . . . . . . . . . . . . . . . . . . . . . . . . . . . . . . . 234.25 OCT . . . . . . . . . . . . . . . . . . . . . . . . . . . . . . . . . . . . . . . . . . . . . . 244.26 OGC . . . . . . . . . . . . . . . . . . . . . . . . . . . . . . . . . . . . . . . . . . . . . . 254.27 OGDC . . . . . . . . . . . . . . . . . . . . . . . . . . . . . . . . . . . . . . . . . . . . . 264.28 PC . . . . . . . . . . . . . . . . . . . . . . . . . . . . . . . . . . . . . . . . . . . . . . . 264.29 PDC . . . . . . . . . . . . . . . . . . . . . . . . . . . . . . . . . . . . . . . . . . . . . . 274.30 PiC . . . . . . . . . . . . . . . . . . . . . . . . . . . . . . . . . . . . . . . . . . . . . . 284.31 PYC . . . . . . . . . . . . . . . . . . . . . . . . . . . . . . . . . . . . . . . . . . . . . . 294.32 SCS . . . . . . . . . . . . . . . . . . . . . . . . . . . . . . . . . . . . . . . . . . . . . . 304.33 SDH . . . . . . . . . . . . . . . . . . . . . . . . . . . . . . . . . . . . . . . . . . . . . . 30
1

5 Initial condition 315.1 The respiratory chain . . . . . . . . . . . . . . . . . . . . . . . . . . . . . . . . . . . . 315.2 The TCA cycle . . . . . . . . . . . . . . . . . . . . . . . . . . . . . . . . . . . . . . . . 315.3 Fatty acid β oxidation . . . . . . . . . . . . . . . . . . . . . . . . . . . . . . . . . . . . 325.4 The inner-membrane transport . . . . . . . . . . . . . . . . . . . . . . . . . . . . . . . 33
6 Steady-state condition 346.1 The respiratory chain . . . . . . . . . . . . . . . . . . . . . . . . . . . . . . . . . . . . 346.2 The TCA cycle and the inner-membrane transport . . . . . . . . . . . . . . . . . . . . 356.3 Fatty acid β oxidation . . . . . . . . . . . . . . . . . . . . . . . . . . . . . . . . . . . . 35
7 Rate equations 367.1 AAC . . . . . . . . . . . . . . . . . . . . . . . . . . . . . . . . . . . . . . . . . . . . . 367.2 CB Ordered Bi Bi . . . . . . . . . . . . . . . . . . . . . . . . . . . . . . . . . . . . . . 367.3 Complex III . . . . . . . . . . . . . . . . . . . . . . . . . . . . . . . . . . . . . . . . . 377.4 Complex V . . . . . . . . . . . . . . . . . . . . . . . . . . . . . . . . . . . . . . . . . . 377.5 IDHa . . . . . . . . . . . . . . . . . . . . . . . . . . . . . . . . . . . . . . . . . . . . . 377.6 IDHb . . . . . . . . . . . . . . . . . . . . . . . . . . . . . . . . . . . . . . . . . . . . . 377.7 Michaelis Uni Uni . . . . . . . . . . . . . . . . . . . . . . . . . . . . . . . . . . . . . . 377.8 Multisite Ping-Pong . . . . . . . . . . . . . . . . . . . . . . . . . . . . . . . . . . . . . 377.9 Ordered Bi Bi . . . . . . . . . . . . . . . . . . . . . . . . . . . . . . . . . . . . . . . . 387.10 PC . . . . . . . . . . . . . . . . . . . . . . . . . . . . . . . . . . . . . . . . . . . . . . 387.11 Ping-Pong Bi Bi . . . . . . . . . . . . . . . . . . . . . . . . . . . . . . . . . . . . . . . 387.12 Rapid Equilibrium Random Bi Bi . . . . . . . . . . . . . . . . . . . . . . . . . . . . . 397.13 SCS . . . . . . . . . . . . . . . . . . . . . . . . . . . . . . . . . . . . . . . . . . . . . . 397.14 Uni Uni Reversible . . . . . . . . . . . . . . . . . . . . . . . . . . . . . . . . . . . . . . 39
8 MeSH term and literature search 40
2

1 Abbreviations
1.1 Species and organs
Table 1: Abbreviations for species and organs
Abbreviation Species, OrganBH Bovine HeartBHM Bovine Heart MitochondriaBL Bovine LiverBLM Bovine Liver MitochondriaCL Chicken LiverHLC Human Liver CytosolIMS Intermembrane Space (Mitochondrial)MAT Matrix (Mitochondrial)PH Pig HeartPHM Pig Heart MitochondriaPL Pig LiverPLM Pig Liver MitochondriaRbHM Rabbit Heart MitochondriaRB Rat BrainRH Rat HeartRHM Rat Heart MitochondriaRK Rat KidneyRLM Rat Liver Mitochondria
3

1.2 Metabolites and enzymes: A-G
Table 2: Abbreviations for metabolites
Abbreviation Substance name Compound/EC numberAAC ATP/ADP CarrierACD Acyl-CoA Dehydrogenase EC1.3.99.3Acetoacetyl-CoA C00332Acetyl-CoA C00024ACO Aconitase EC4.2.1.3ADP Adenosine Diphosphate C00008AGC Aspartate/Glutamate CarrierAla Alanine C00041AlaTA Alanine Transaminase EC2.6.1.2Asp Aspartate C00049AspTA Aspartate Transaminase EC2.6.1.1ATP Adenosine Triphosphate C00002CAC Carnitine CarrierCar Carnitine C00318CIC Citrate CarrierCit Citrate C00158CPT-I Carnitine Palmitoyl Transferase I EC2.3.1.21CPT-II Carnitine Palmitoyl Transferase II EC2.3.1.21CoA Coenzyme A C00010Complex-I NADH Dehydrogenase EC1.6.5.3Complex-III Ubiquinol:Cytochrome c Oxidoreductase EC1.10.2.2Complex-IV Cytochrome c Oxidase EC1.9.3.1Complex-V ATP Synthetase EC3.6.1.34CO2 Carbon Dioxide C00011CS Citrate Synthase EC4.1.3.7Cyt-c2+ Ferricytochrome c C00125Cyt-c3+ Ferrocytochrome c C00126DIC Dicarboxyrate CarrierECH Enoyl-CoA Hydratase EC4.2.1.17ETFox Electron Transfer Flavoprotein (oxidised form)ETFred Electron Transfer Flavoprotein (reduced form)ETF-QO ETF:Q OxidoreductaseFM Fumarase EC4.2.1.2Fum Fumarate C00122GDP Guanosine Diphosphate C00035Glu Glutamate C00025GTP Guanosine Triphosphate C00044
4
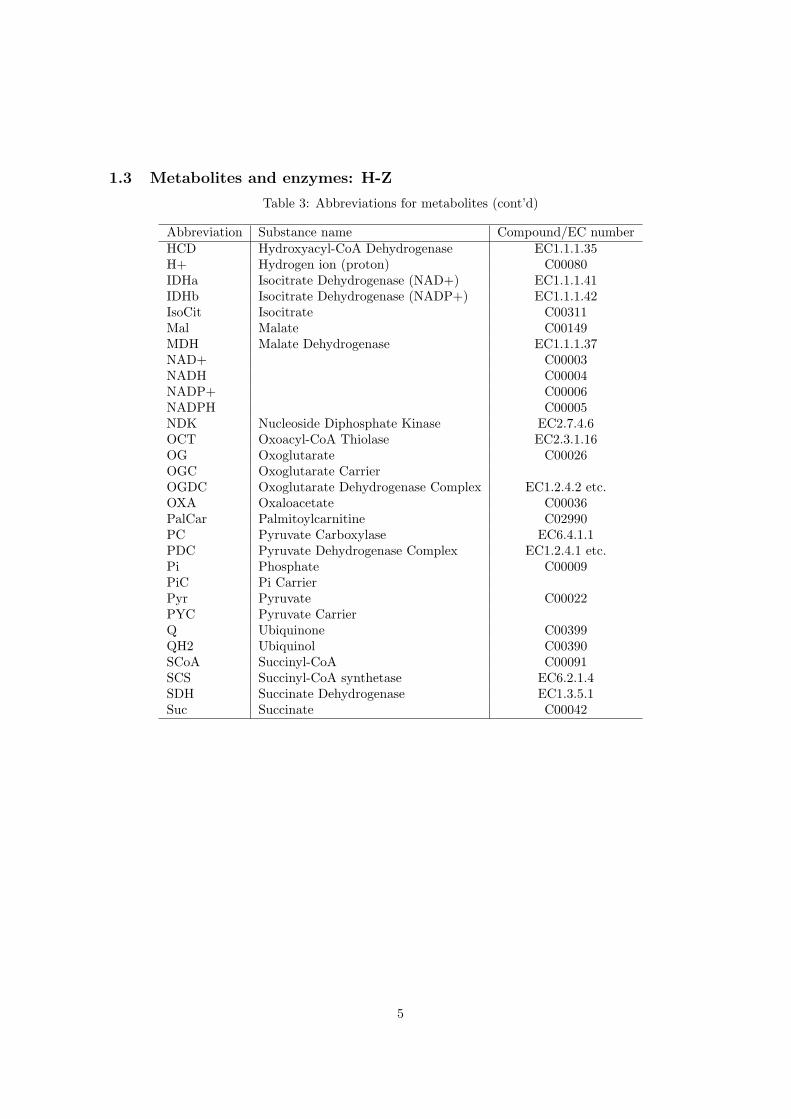
1.3 Metabolites and enzymes: H-Z
Table 3: Abbreviations for metabolites (cont’d)
Abbreviation Substance name Compound/EC numberHCD Hydroxyacyl-CoA Dehydrogenase EC1.1.1.35H+ Hydrogen ion (proton) C00080IDHa Isocitrate Dehydrogenase (NAD+) EC1.1.1.41IDHb Isocitrate Dehydrogenase (NADP+) EC1.1.1.42IsoCit Isocitrate C00311Mal Malate C00149MDH Malate Dehydrogenase EC1.1.1.37NAD+ C00003NADH C00004NADP+ C00006NADPH C00005NDK Nucleoside Diphosphate Kinase EC2.7.4.6OCT Oxoacyl-CoA Thiolase EC2.3.1.16OG Oxoglutarate C00026OGC Oxoglutarate CarrierOGDC Oxoglutarate Dehydrogenase Complex EC1.2.4.2 etc.OXA Oxaloacetate C00036PalCar Palmitoylcarnitine C02990PC Pyruvate Carboxylase EC6.4.1.1PDC Pyruvate Dehydrogenase Complex EC1.2.4.1 etc.Pi Phosphate C00009PiC Pi CarrierPyr Pyruvate C00022PYC Pyruvate CarrierQ Ubiquinone C00399QH2 Ubiquinol C00390SCoA Succinyl-CoA C00091SCS Succinyl-CoA synthetase EC6.2.1.4SDH Succinate Dehydrogenase EC1.3.5.1Suc Succinate C00042
5

1.4 Other metabolites
Table 4: Abbreviations for metabolites (cont’d)
Abbreviation Substance name Compound/EC number10Acyl-CoA Decanoyl-CoA C0527410Enoyl-CoA trans-Dec-2-enoyl-CoA C0527510Hydroxyacyl-CoA (S)-3-Hydroxydedecanoyl-CoA C0526410Oxoacyl-CoA 3-Oxodecanoyl-CoA C0526512Acyl-CoA Lauroyl-CoA C0183212Enoyl-CoA trans-Dodec-2-enoyl-CoA C0322112Hydroxyacyl-CoA (S)-3-Hydroxydodecanoyl-CoA C0526212Oxoacyl-CoA 3-Oxododecanoyl-CoA C0526314Acyl-CoA Myristoyl-CoA C0259314Enoyl-CoA trans-Tetradec-2-enoyl-CoA C0527314Hydroxyacyl-CoA (S)-3-Hydroxytetradecanoyl-CoA C0526014Oxoacyl-CoA 3-Oxotetradecanoyl-CoA C0526116Acyl-CoA Palmitoyl-CoA C0015416Enoyl-CoA trans-Hexadec-2-enoyl-CoA C0527216Hydroxyacyl-CoA (S)-3-Hydroxyhexadecanoyl-CoA C0525816Oxoacyl-CoA 3-Oxohexadecanoyl-CoA C052594Acyl-CoA Butanoyl-CoA C001364Enoyl-CoA Crotonyl-CoA C008774Hydroxyacyl-CoA (S)-3-Hydroxybutanoyl-CoA C011446Acyl-CoA Hexanoyl-CoA C052706Enoyl-CoA trans-Hex-2-enoyl-CoA C052716Hydroxyacyl-CoA (S)-3-Hydroxyhexanoyl-CoA C052686Oxoacyl-CoA 3-Oxohexanoyl-CoA C052698Acyl-CoA Octanoyl-CoA C019448Enoyl-CoA trans-Oct-2-enoyl-CoA C052768Hydroxyacyl-CoA (S)-3-Hydroxyoctanoyl-CoA C052668Oxoacyl-CoA 3-Oxooctaanoyl-CoA C05267
2 Reactions
2.1 Respiratory chain
Table 5: Reactions in the respiratory chain (where H+MAT denotes H+ in the matrix,
H+IMS is H+ in the intermembrane space)
complex reaction reaction mechanism source
INADH + Q + 5H+
MAT
←→ NAD+ + QH2 + 4H+IMS
Ping-Pong Bi Bi [Fato et al., 1996] BHM
II(SDH) Suc + Q ←→ Fum + QH2 Ping-Pong Bi Bi [Grivennikova et al., 1993] BHM
IIIQH2 + 2cyt c3+ + 2H+
MAT
→ Q + 2cyt c2+ + 4H+IMS
See [Kubota et al., 1992] BHM
IV4cyt c2+ + O2 + 8H+
MAT
−→ 4cyt c3+ + 2H2O + 4H+IMS
Michaelis Uni Uni[Malmstrom and Andreasson, 1985] -
VADP + Pi + 3H+
IMS
←→ ATP + H2O + 3H+MAT
See [Kholodenko, 1993] -
6

2.2 TCA cycle
Table 6: The enzymes in/around the TCA cycle
enzyme reaction reaction mechanism source
PDCPyr + NAD+ + CoA −→Acetyl-CoA + NADH + CO2
See [Hamada et al., 1975] PHM
PCPyr + ATP + CO2
←→ OXA + ADP + PiSee [Barden et al., 1972] CL
AspTAAsp + OG←→ OXA + Glu
Ping-Pong Bi Bi[Velick and Vavra, 1962, Henson and Cleland, 1964]
PH
AlaTAAla + OG←→ Glu + Pyr
Ping-Pong Bi Bi [De Rosa et al., 1979] PL
NDKATP + GDP←→ ADP + GTP
Ping-Pong Bi Bi [Garces and Cleland, 1969] yeast
CSOXA + Acetyl-CoA←→ Cit + CoA
Random Bi Bi[Shepherd and Garland, 1969, Matsuoka and Srere, 1973]
RK,RB
ACO Cit ←→ IsoCit Uni Uni Reversible [Guarriero-Bobyleva et al., 1978] RLM
IDHaIsoCit + NAD+
−→ OG + NADHSee [Plaut et al., 1974] BH
IDHbIsoCit + NADP+
←→ OG + NADPHSee [Londesborough and Dalziel, 1970] BHM
OGDCOG + NAD+ + CoA−→ SCoA + NADH + CO2
See [Hamada et al., 1975] PHM
SCSSCoA + GDP + Pi←→ Suc + CoA + GTP
See [Cha and Parks Jr., 1964] PH
SDHSuc + Q←→ Fum + QH2
Ping-Pong Bi Bi [Grivennikova et al., 1993] BHM
FM Fum ←→ Mal Uni Uni Reversible
MDHMal + NAD+
←→ OXA + NADHOrdered Bi Bi [Crow et al., 1983] HLC
2.3 Fatty acid β oxidation
Table 7: The enzymes in the fatty acid β oxidation
enzyme reaction reaction mechanism source
ACDAcyl-CoA + ETFox
←→ Enoyl-CoA + ETFredOrdered Bi Bi [McKean et al., 1979] PLM
ECHEnoyl-CoA + H2O←→ 3-hydroxyacyl-CoA
Uni Uni Reversible [Yang and Schulz, 1987] BL
HCD3-hydroxyacyl-CoA + NAD+
−→ 3-oxoacyl-CoA + NADHMichaelis Uni Uni [Yang and Schulz, 1987] PH
OCT3-oxoacyl-CoA + CoA←→ Acyl-CoA + Acetyl-CoA
Ping-Pong Bi Bi [Miyazawa et al., 1981] RLM
ETF-QOETFred + Q←→ ETFox + QH2
Ping-Pong Bi Bi [Beckmann and Frerman, 1985] PLM
CPT I16Acyl-CoA + Car←→ CoA + PalCar
Rapid Equilibrium Random Bi Bi[Ramsay et al., 1987]
BLM
CPT IICoA + PalCar←→ 16Acyl-CoA + Car
Ordered Bi Bi [Mann et al., 1995] RLM
CACPalCarIMS + CarMAT
↔ PalCarMAT + CarIMSPing-Pong Bi Bi [Indiveri et al., 1994] RLM
7
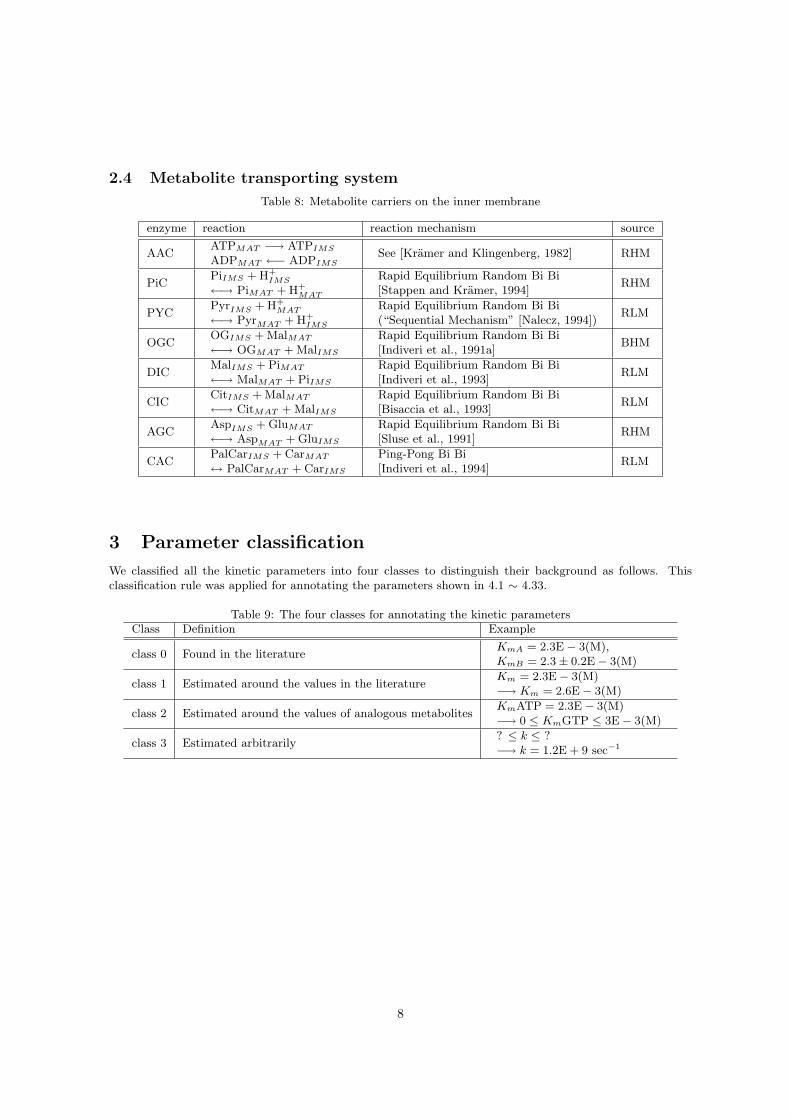
2.4 Metabolite transporting system
Table 8: Metabolite carriers on the inner membrane
enzyme reaction reaction mechanism source
AACATPMAT −→ ATPIMS
ADPMAT ←− ADPIMSSee [Kramer and Klingenberg, 1982] RHM
PiCPiIMS + H+
IMS
←→ PiMAT + H+MAT
Rapid Equilibrium Random Bi Bi[Stappen and Kramer, 1994]
RHM
PYCPyrIMS + H+
MAT
←→ PyrMAT + H+IMS
Rapid Equilibrium Random Bi Bi(“Sequential Mechanism” [Nalecz, 1994])
RLM
OGCOGIMS + MalMAT
←→ OGMAT + MalIMS
Rapid Equilibrium Random Bi Bi[Indiveri et al., 1991a]
BHM
DICMalIMS + PiMAT
←→ MalMAT + PiIMS
Rapid Equilibrium Random Bi Bi[Indiveri et al., 1993]
RLM
CICCitIMS + MalMAT
←→ CitMAT + MalIMS
Rapid Equilibrium Random Bi Bi[Bisaccia et al., 1993]
RLM
AGCAspIMS + GluMAT
←→ AspMAT + GluIMS
Rapid Equilibrium Random Bi Bi[Sluse et al., 1991]
RHM
CACPalCarIMS + CarMAT
↔ PalCarMAT + CarIMS
Ping-Pong Bi Bi[Indiveri et al., 1994]
RLM
3 Parameter classification
We classified all the kinetic parameters into four classes to distinguish their background as follows. Thisclassification rule was applied for annotating the parameters shown in 4.1 ∼ 4.33.
Table 9: The four classes for annotating the kinetic parametersClass Definition Example
class 0 Found in the literatureKmA = 2.3E− 3(M),KmB = 2.3± 0.2E− 3(M)
class 1 Estimated around the values in the literatureKm = 2.3E− 3(M)−→ Km = 2.6E− 3(M)
class 2 Estimated around the values of analogous metabolitesKmATP = 2.3E− 3(M)−→ 0 ≤ KmGTP ≤ 3E− 3(M)
class 3 Estimated arbitrarily? ≤ k ≤ ?−→ k = 1.2E + 9 sec−1
8

4 Kinetic parameters
4.1 AAC
Table 10: Kinetic parameters and their sources(AAC)
Parameter class notice
kf0 0.9 class 0 velocity model,at mp = 0, kf0 = kr0
kr0 0.9 class 0 velocity model, at mp = 0normalize 2.21 class 0 normalizing factor of kf0, kr0Kd1 5.9E-4 class 3 Kd1 → Kd,
velocity model, Kd1 = Kd2Kd2 5.9E-4 class 3 Kd2 → Kd′
Kd accepts no effectsfrom membrane potential
Cf 3.30 class 0 kf0 × exp(Cf × ∆Ψ) = kf(∆Ψ)Cr -3.34 class 0 kr0 × exp(Cr × ∆Ψ) = kr(∆Ψ)T 310.0 - absolute temperature
kinetic mechanism see [Kramer and Klingenberg, 1982]rate equation See 7.1source for parameter estimation [Kramer and Klingenberg, 1982]
Figure 2(B) V D→ (∆Ψ = 0, 180mV)
Figure 1: Comparison between experimental data and computed ones from estimated parameters(AAC)
left: Comparison between experimental data and computed onesabscissa = reaction rate (sec−1)ordinate = substrate concentration (M)
right: Percent error between experimental data and computed onesabscissa = substrate concentration (M)ordinate = percent error
9

4.2 ACD
Table 11: Kinetic parameters and their sources(ACD)
Parameter class notice
KmS1 39E-6 class 0 [McKean et al., 1979, Table 1]KmS2 0.12E-6 class 0KmP1 1.08E-6 class 2KmP2 2.42E-5 class 2KiS1 76E-6 class 0KiS2 0.24E-6 class 0KiP1 7.53E-5 class 2KiP2 1.19E-5 class 2Keq 8.99 class 3KcF 2.18 class 0KcR 0.30 class 2
kinetic mechanism Ordered Bi Bi[McKean et al., 1979]
rate equation See 7.9source for parameter estimation [McKean et al., 1979]
Figure 2: Comparison between experimental data and Computed data from estimated parameters(ACD)
left: Comparison between experimental data and computed onesabscissa = reaction rate (sec−1)ordinate = substrate concentration (M)
right: Percent error between experimental data and computed onesabscissa = substrate concentration (M)ordinate = percent error
4.3 ACO
Table 12: Kinetic parameters and their sources(ACO)
Parameter class notice
Ks 0.50E-3 class 0Kp 0.11E-3 class 0KcF 20.47 class 0 calculated from the graphKcR 31.44 class 0 calculated from the graph
kinetic mechanism Uni Uni Reversible[Guarriero-Bobyleva et al., 1978]
rate equation See 7.14
10
4.4 AGC
Table 13: Kinetic parameters and their sources(AGC)
Parameter class notice
KiS1 80E-6 class 0 [Dierks and Kramer, 1988]KiS2 3.2E-3 class 0 [Dierks and Kramer, 1988]KiP1 180E-6 class 0 [Dierks and Kramer, 1988]KiP2 2.8E-3 class 0 [Dierks and Kramer, 1988]KcF 10.0 class 3KcR 10.0 class 3alpha 1.0 class 0beta 1.0 class 0gamma 1.0 class 0delta 1.0 class 0
kinetic mechanism Rapid Equilibrium Random Bi Bi[Sluse et al., 1991]
rate equation See 7.12source for parameter estimation -
4.5 AlaTA
Table 14: Kinetic parameters and their sources(AlaTA)
Parameter class notice
KmS1 2E-3 class 0KmS2 0.4E-3 class 0KmP1 32E-3 class 0KmP2 0.4E-3 class 0KiS1 8.7E-3 class 2 KiP2KiP2 12E-3 class 0Keq 0.69 class 2 0.16, AspTAKcF 337 class 0 at MW = 78000,
activity = 210 micromol/min/mgKcR 0.15 class 3
kinetic mechanism Ping-Pong Bi Bi[De Rosa et al., 1979]
rate equation See 7.11source for parameter estimation [De Rosa et al., 1979],
Figure 3 with 5mM glutamate
11

4.6 AspTA
Table 15: Kinetic parameters and their sources(AspTA)
Parameter class notice
KmS1 0.9E-3 class 0 [Velick and Vavra, 1962, Table II]KmS2 0.1E-3 class 0 [Velick and Vavra, 1962, Table II]KmP1 0.04E-3 class 0 [Velick and Vavra, 1962, Table II]KmP2 4E-3 class 0 [Velick and Vavra, 1962, Table II]KiS1 2E-3 class 0 [Velick and Vavra, 1962, Table VII]KiP2 8.3E-3 class 0 [Velick and Vavra, 1962, Table VII]Keq 6.2 class 0KcF 300 class 0KcR 1000 class 0 from k4 and k10
kinetic mechanism Ping-Pong Bi Bi [Velick and Vavra, 1962]rate equation See 7.11
4.7 CAC
Table 16: Kinetic parameters and their sources(CAC)
Parameter class notice
KmS1 0.6E-3 class 0 [Indiveri et al., 1994]KmS2 9.4E-3 class 0 [Indiveri et al., 1994]KmP1 43.4E-6 class 1 11.6E-6,
the value of Car/Car reactionKmP2 0.4E-3 class 1 1.2E-3,
the value of Car/Car reactionKiS1 8.7E-6 class 1 5.1E-6 [Indiveri et al., 1991b]KiP2 250E-6 class 1 510E-6 [Indiveri et al., 1991b]Keq 243.3 class 3KcF 1.22 class 2KcR 1.08 class 1 0.92, [Indiveri et al., 1991b]
kinetic mechanism Ping-Pong Bi Bi [Indiveri et al., 1994]rate equation See 7.11source for parameter estimation [Indiveri et al., 1991b]
Figure 4 with 13mM acetylcarnitine
Figure 3: Comparison between experimental data and Computed data from estimated parameters(CAC)
left: Comparison between experimental data and computed onesabscissa = reaction rate (sec−1)ordinate = substrate concentration (M)
right: Percent error between experimental data and computed onesabscissa = substrate concentration (M)ordinate = percent error
12
4.8 CIC
Table 17: Kinetic parameters and their sources(CIC)
Parameter class notice
KiS1 1.3E-4 class 2KiS2 4.4E-4 class 2KiP1 3.3E-4 class 0KiP2 4.18E-5 class 0KcF 5.6 class 0 11.2 mmol/min/g prot. × 30kDaKcR 3.5 class 1 2.1, [Bisaccia et al., 1993, Table II]alpha 1.0 class 0beta 1.0 class 0gamma 1.0 class 0delta 1.0 class 0
kinetic mechanism Rapid Equilibrium Random Bi Bi[Bisaccia et al., 1993]
rate equation See 7.12source for parameter estimation Figure 1(A) with 0.05mM citrate,
(C) with 0.05mM malate[Bisaccia et al., 1993]
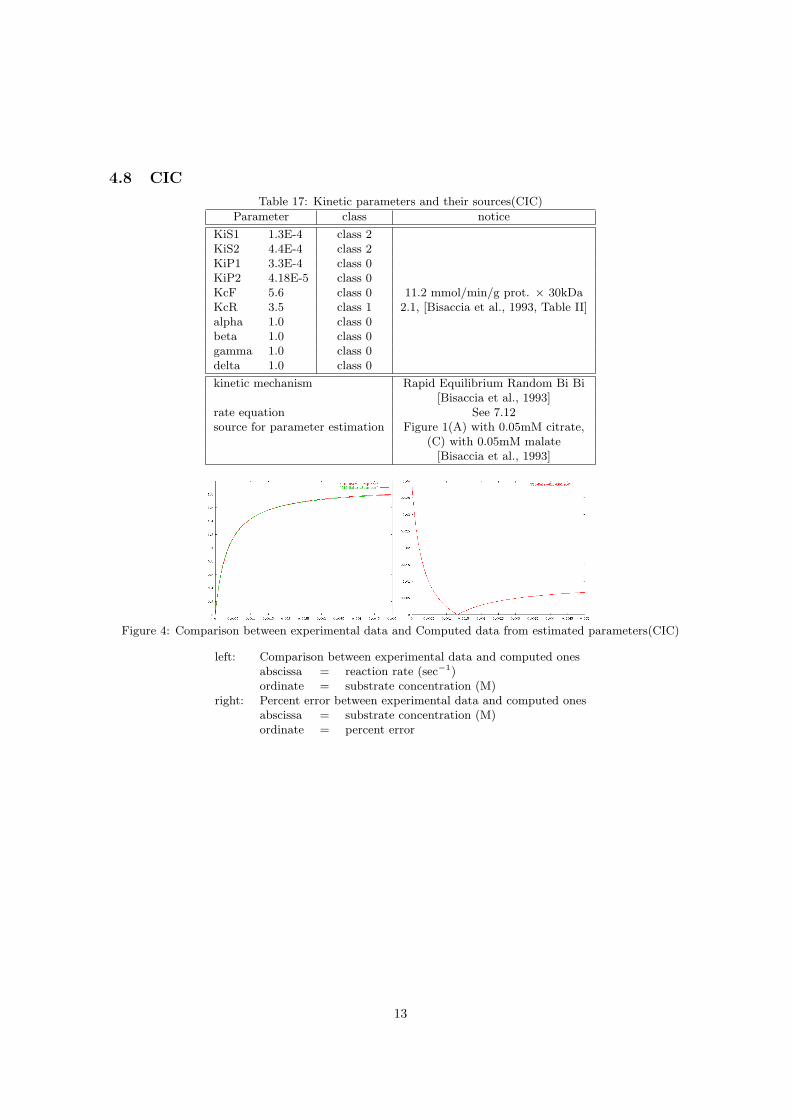
Figure 4: Comparison between experimental data and Computed data from estimated parameters(CIC)
left: Comparison between experimental data and computed onesabscissa = reaction rate (sec−1)ordinate = substrate concentration (M)
right: Percent error between experimental data and computed onesabscissa = substrate concentration (M)ordinate = percent error
13

4.9 Complex I
Table 18: Kinetic parameters and their sources(Complex I)
Parameter class notice
KmS1 9.2E-6 class 0KmS2 2.6E-4 class 0KmP1 9.9E-6 class 2KmP2 5.9E-5 class 2KiS1 2.1E-8 class 0 KiS1 = 1 / kmin
KiP2 9.8E-8 class 2Keq 407.9 class 3KcF 498 class 0KcR 229 class 2
kinetic mechanism Ping-Pong Bi Bi[Fato et al., 1996]
rate equation See 7.11source for parameter estimation [Fato et al., 1996]
Figure 1(C) with 2.4 µMreduced CoQ2
Figure 5: Comparison between experimental data and Computed data from estimated parameters(ComplexI)
left: Comparison between experimental data and computed onesabscissa = reaction rate (sec−1)ordinate = substrate concentration (M)
right: Percent error between experimental data and computed onesabscissa = substrate concentration (M)ordinate = percent error
14

4.10 Complex III
Table 19: Kinetic parameters and their sources(Complex III)
Parameter class notice
KmA 2.8E-5 class 0 K5 × KcFKmB 3.0E-6 class 0 K6 × KcFKb1 5.4E-6 class 2 k5/k4 K3 = K4× Kb1Kb2 5.7E-6 class 2 k10/k9, K1 = K2 × Kb2Kq1 2.8E-6 class 2 k7/k6, K4 = Kq1/k8
Kq2 1.9E-6 class 2 k12/k11, K2 = K5 × Kq2k8 622.1 class 2KcF 426.8 class 0 1 / K7
kinetic mechanism [Kubota et al., 1992, Scheme 3]rate equation See 7.3source for parameter estimation [Kubota et al., 1992]
Figure 6 with 15 µM Q2H2
Figure 6: Comparison between experimental data and Computed data from estimated parameters(ComplexIII)
left: Comparison between experimental data and computed onesabscissa = reaction rate (sec−1)ordinate = substrate concentration (M)
right: Percent error between experimental data and computed onesabscissa = substrate concentration (M)ordinate = percent error
4.11 Complex IV
Table 20: Kinetic parameters and their sources(Complex IV)
Parameter class notice
Ks 110E-6 class 0 Value at pH = 7
KcF 93.5 class 0 Value at pH = 7, d[cyt2+]dt
× 14
kinetic mechanism Michaelis Uni Uni[Malmstrom and Andreasson, 1985]
rate equation See 7.7
15

4.12 Complex V
Table 21: Kinetic parameters and their sources(Complex V)
Parameter class notice
Kd 2.67E-7 class 3Kp 9.02E-5 class 3Kt 4.33E-5 class 3KcF 14.5 class 0 2340nmol/min/mg × 371kDaKhx 1.3E-4 class 3Khy 1.6E-4 class 3klt f 1.35E+8 class 3klt r 0.00018 class 3ax 0.1 class 3ay 0.6 class 3beta 0.3 class 3T 310 -
kinetic mechanism see [Kholodenko, 1993]rate equation See 7.4source for parameter estimation [Matsuno-Yagi and Hatefi, 1985]
Figure 2 with NADH respiration
Figure 7: Comparison between experimental data and computed data from estimated parameters(ComplexV)
left: Comparison between experimental data and computed onesabscissa = reaction rate (sec−1)ordinate = substrate concentration (M)
right: Percent error between experimental data and computed onesabscissa = substrate concentration (M)ordinate = percent error
16
4.13 CPT I
Table 22: Kinetic parameters and their sources(CPT I)
Parameter class notice
KiS1 182E-6 class 0 [Ramsay et al., 1987]KiS2 0.82E-6 class 0KiP1 6.7E-6 class 0KiP2 21E-6 class 0KcF 61.4 class 0KcR 32.8 class 0alpha 1.0 class 0beta 1.0 class 0gamma 1.0 class 0delta 1.0 class 0
kinetic mechanism Rapid Equilibrium Random Bi Bi[Ramsay et al., 1987]
rate equation See 7.12
4.14 CPT II
Table 23: Kinetic parameters and their sources(CPT II)
Parameter class notice
KmS1 6.3E-4 class 2KmS2 3.3E-4 class 2KmP1 950E-6 class 0KmP2 34E-6 class 0KiS1 2.4E-4 class 2KiS2 2.7E-4 class 2KiP1 41E-6 class 0KiP2 7E-6 class 0Keq 23540 class 3KcF 8.0 class 2KcR 2.4 class 0 1.8 Unit/mg × 80kDa
[Mann et al., 1995, Woeltje et al., 1987]
kinetic mechanism Ordered Bi Bi[Mann et al., 1995]
rate equation See 7.9source for parameter estimation [Mann et al., 1995]
Figure 1 with 0µM SDZ
17

Figure 8: Comparison between experimental data and Computed data from estimated parameters(CPT II)
left: Comparison between experimental data and computed onesabscissa = reaction rate (sec−1)ordinate = substrate concentration (M)
right: Percent error between experimental data and computed onesabscissa = substrate concentration (M)ordinate = percent error
4.15 CS
Table 24: Kinetic parameters and their sources(CS)
Parameter class notice
k1 6.8E10 class 3k 1 8.1E8 class 3k2 3.0E10 class 3k 2 7.2E8 class 3k3 6.2E10 class 3k 3 5.1E8 class 3k4 1.2E10 class 3k 4 4.0E8 class 3k5 1.4E9 class 3k 5 2.4E8 class 3k6 4.1E10 class 3k 6 1.1E8 class 3k7 5E10 class 3k 7 9.8E8 class 3k8 5.3E10 class 3k 8 7.7E8 class 3
kinetic mechanism Random Bi Bi,[Shepherd and Garland, 1969],[Matsuoka and Srere, 1973],[Mukherjee and Srere, 1976]
source for parameter estimation [Matsuoka and Srere, 1973]
18

4.16 DIC
Table 25: Kinetic parameters and their sources(DIC)
Parameter class notice
KiS1 0.20E-3 class 0 [Indiveri et al., 1993, Fig. 5]KiS2 0.72E-3 class 0 [Indiveri et al., 1993, Fig. 5]KiP1 9.0E-4 class 2KiP2 7.6E-4 class 2KcF 2.7 class 0 6.7E-6 mol/min/mg × 28kDaKcR 4.1 class 1alpha 1.0 class 0beta 1.0 class 0gamma 1.0 class 0delta 1.0 class 0
kinetic mechanism Rapid Equilibrium Random Bi Bi[Indiveri et al., 1993]
rate equation See 7.12source for parameter estimation Figure 5(A) with 0.05mM
phosphate, (C) with 0.10mMmalate [Indiveri et al., 1993]
Figure 9: Comparison between experimental data and Computed data from estimated parameters(DIC)
left: Comparison between experimental data and computed onesabscissa = reaction rate (sec−1)ordinate = substrate concentration (M)
right: Percent error between experimental data and computed onesabscissa = substrate concentration (M)ordinate = percent error
4.17 ECH
Table 26: Kinetic parameters and their sources(ECH)
Parameter class notice
Ks 16.9E-6 class 0Kp 12.1E-6 class 0KcF 8.9166667 class 0KcR 2154.1667 class 0
kinetic mechanism Uni Uni Reversible [Yang and Schulz, 1987]rate equation See 7.14
19

4.18 ETF-QO
Table 27: Kinetic parameters and their sources(ETF-QO)
Parameter class notice
KmS1 0.31E-6 class 0KmS2 0.39E-6 class 2KmP1 0.32E-6 class 0KmP2 4.2E-9 class 2KiS1 0.31E-6 class 0KiP2 0.3E-6 class 2Keq 0.66 class 0KcF 78 class 0KcR 101 class 2
kinetic mechanism Ping-Pong Bi Bi,[Beckmann and Frerman, 1985]
rate equation See 7.11source for parameter estimation Figure 4 with 1.5µM
ETF hydroquinone[Beckmann and Frerman, 1985]
Figure 10: Comparison between experimental data and Computed data from estimatedparameters(ETF:QO)
left: Comparison between experimental data and computed onesabscissa = reaction rate (sec−1)ordinate = substrate concentration (M)
right: Percent error between experimental data and computed onesabscissa = substrate concentration (M)ordinate = percent error
4.19 FM
Table 28: Kinetic parameters and their sources(FM)
Parameter class notice
Ks 0.5E-5 class 0 [Boyer, 1970, Vol. V, chap. 19, Table V]Kp 2.5E-5 class 0KcF 800 class 0KcR 900 class 0
kinetic mechanism Uni Uni Reversiblerate equation See 7.14
20

4.20 HCD
Table 29: Kinetic parameters and their sources(HCD)
Parameter class notice
Ks 1.5E-6 class 0KcF 41.483333 class 0
kinetic mechanism Michaelis Uni Uni [Yang and Schulz, 1987]rate equation See 7.7
4.21 IDHa
Table 30: Kinetic parameters and their sources(IDHa)
Parameter class notice
KcF 105 class 0 28 U/mg × 224000 Da[Plaut et al., 1974, Ehrlich et al., 1981]
b 29.6 class 3c 0.00023 class 3d 7.8e-05 class 3e 0.00064 class 3f 0.00036 class 3
kinetic mechanism [Plaut et al., 1974]rate equation See 7.5source for parameter estimation Figure 4 with 1.0mM ADP,
[Plaut et al., 1974]
Figure 11: Comparison between experimental data and Computed data from estimated parameters(IDHa)
left: Comparison between experimental data and computed onesabscissa = reaction rate (sec−1)ordinate = substrate concentration (M)
right: Percent error between experimental data and computed onesabscissa = substrate concentration (M)ordinate = percent error
21

4.22 IDHb
Table 31: Kinetic parameters and their sources(IDHb)
Parameter class notice
phi0 5.1E-2 class 0 [Londesborough and Dalziel, 1970, Table 1]phi1 9.5E-8 class 0phi2 0.96E-6 class 0phi12 9E-8 class 0phir0 6.6E-2 class 0phir1 0.37E-6 class 0phir2 29E-6 class 0phir3 2.5E-4 class 0phir12 6E-12 class 0phir13 1.3E-10 class 0phir23 9.4E-8 class 0phir123 4.6E-14 class 0
kinetic mechanism See [Londesborough and Dalziel, 1970]rate equation See 7.6
4.23 MDH
Table 32: Kinetic parameters and their sources(MDH)
Parameter class notice
KmS1 72E-6 class 0KmS2 110E-6 class 0KmP1 1600E-6 class 0KmP2 170E-6 class 0KiS1 11E-6 class 0KiS2 100E-6 class 0KiP1 7100E-6 class 0KiP2 1900E-6 class 0KcF 0.390 class 0 specific activity = 0.33 U/mg, MW = 72000 [Crow et al., 1983, Table I]
KcR 0.040 class 0VfVr
= 9.8 [Crow et al., 1983, Table III]
kinetic mechanism Ordered Bi Bi [Crow et al., 1983]rate equation See 7.2
22
4.24 NDK
Table 33: Kinetic parameters and their sources(NDK)
Parameter class notice
KmS1 0.31E-3 class 0 [Garces and Cleland, 1969]KmS2 0.043E-3 class 0 [Garces and Cleland, 1969],UDPKmP1 0.050E-3 class 0 [Garces and Cleland, 1969]KmP2 0.25E-3 class 0 [Garces and Cleland, 1969],UTPKiS1 0.21E-3 class 2 [Garces and Cleland, 1969]KiP2 0.35E-3 class 2 [Garces and Cleland, 1969],UTPKeq 1.28 class 0 [Garces and Cleland, 1969]KcF 6883 class 0 MW = 70000 Da [Colomb et al., 1969]KcR 5950 class 0 MW = 70000 Da [Colomb et al., 1969]
kinetic mechanism Ping-Pong Bi Bi[Garces and Cleland, 1969, Colomb et al., 1969]
rate equation See 7.11source for parameter estimation [Colomb et al., 1969, Figure 4 with 0.18mM ATP]
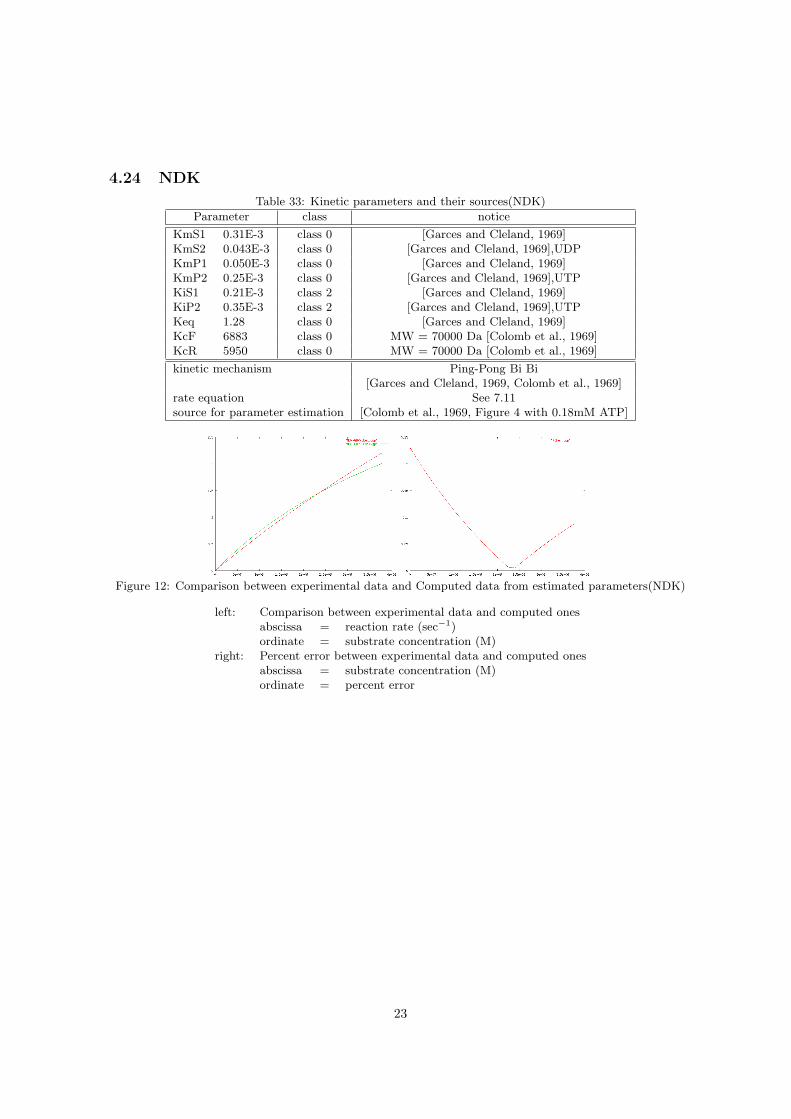
Figure 12: Comparison between experimental data and Computed data from estimated parameters(NDK)
left: Comparison between experimental data and computed onesabscissa = reaction rate (sec−1)ordinate = substrate concentration (M)
right: Percent error between experimental data and computed onesabscissa = substrate concentration (M)ordinate = percent error
23

4.25 OCT
Table 33: Kinetic parameters and their sources(OCT)
Parameter class notice
KmS1 1.1E-6 class 0 OCTa1.1E-6 class 0 OCTb, value for 16Oxoacyl-CoA1.3E-6 class 0 OCTc2.1E-6 class 0 OCTd3.2E-6 class 0 OCTe6.7E-6 class 0 OCTf12.4E-6 class 0 OCTg
KmS2 28.6E-6 class 028.6E-6 class 0 OCTb, value for 16Oxoacyl-CoA38.4E-6 class 0 OCTc35.7E-6 class 0 OCTd35.5E-6 class 0 OCTe18.9E-6 class 0 OCTf2.2E-6 class 0 OCTg
KmP1 7.2E-5 class 2KmP2 8.7E-5 class 2KiS1 1.1E-5 class 2KiP2 8.7E-5 class 2Keq 160.98 class 3KcF 137.86 class 0 Vmax × 178000Da
137.86 class 0 OCTb, value for 16Oxoacyl-CoA253.52 class 0 OCTc272.94 class 0 OCTd277.38 class 0 OCTe264.07 class 0 OCTf80.244 class 0 OCTg
KcR 87.253 class 287.253 class 2 OCTb, value for 16Oxoacyl-CoA160.46 class 2 OCTc172.75 class 2 OCTd175.56 class 2 OCTe167.13 class 2 OCTf51.615 class 2 OCTg
kinetic mechanism Ping-Pong Bi Bi,[Miyazawa et al., 1981]
rate equation See 7.11source for parameter estimation Figure 5(B) with 200µM Acetyl-CoA,
[Miyazawa et al., 1981]
24

Figure 13: Comparison between experimental data and Computed data from estimated parameters(OCT)
left: Comparison between experimental data and computed onesabscissa = reaction rate (sec−1)ordinate = substrate concentration (M)
right: Percent error between experimental data and computed onesabscissa = substrate concentration (M)ordinate = percent error
4.26 OGC
Table 34: Kinetic parameters and their sources(OGC)
Parameter class notice
KiS1 0.3E-3 class 0KiS2 0.7E-3 class 2KiP1 1.4E-3 class 0KiP2 0.17E-3 class 2KcF 3.675 class 0KcR 4.83 class 0alpha 1.0 class 0beta 1.0 class 0gamma 1.0 class 0delta 1.0 class 0
kinetic mechanism Rapid Equilibrium Random Bi Bi,[Indiveri et al., 1991a]
rate equation See 7.12source for parameter estimation Figure 2 with 20mM malate,
[Indiveri et al., 1991a]
25

4.27 OGDC
Table 35: Kinetic parameters and their sources(OGDC)
Parameter class notice
KmA 0.22E-3 class 0 Pig Heart [Hamada et al., 1975]KmB 0.025E-3 class 0 Pig Heart [Hamada et al., 1975]KmC 0.050E-3 class 0 Pig Heart [Hamada et al., 1975]KmP 3E-4 class 2KmR 6E-4 class 2Kia 7.2E-4 class 2 0.75E-3, Dictyostelium,
[Heckert et al., 1989]Kib 7.4E-4 class 2Kic 1E-4 class 2Kip 1.1E-6 class 2Kiq 81E-6 class 0 Human Heart [Kiselevsky et al., 1990]Kir 25E-6 class 0 Human Heart [Kiselevsky et al., 1990]KcF 177 class 2 estimated, 270 at MW = 2700000Da
kinetic mechanism Multisite Ping-Pong[Cleland, 1973, Hamada et al., 1975]
rate equation See 7.8source for parameter estimation Figure 1(A) with 0.010mM CoA,
(B) with 0.20mM NAD,(C) with 0.10mM oxoglutarate
[Hamada et al., 1975]
4.28 PC
Table 36: Kinetic parameters and their sources(PC)
Parameter class notice
KmA 0.11E-3 class 0 ATP, Table III, inhibitor=MgADPKmB 1.63E-3 class 0 HCO−3 , Table III, inhibitor=OXAKmC 0.37E-3 class 0 Pyr, Table III, inhibitor=OXAKmP 16E-3 class 0 Pi, Table III, inhibitor=MgATPKmQ 0.24E-3 class 0 ADP, Table III, inhibitor=MgATPKmR 0.051E-3 class 0 OXA, Table III, inhibitor=PyrKeq 9.0 class 0Kia 0.15E-3 class 0 ATP, Table IKib 1.6E-3 class 0 HCO−3 , Table IKic 0.13E-3 class 0 Pyr, Table III, vs. OXAKip 7.9E-3 class 0 Pi, Table IKiq 0.19E-3 class 0 ADP, Table IKir 0.24E-3 class 0 OXA, Table III, vs. PyrKcF 200 class 0 specific activity = 20, MW=600000
KcR 20 class 0 V1V2
= 10
kinetic mechanism [Barden et al., 1972]rate equation See 7.10
26
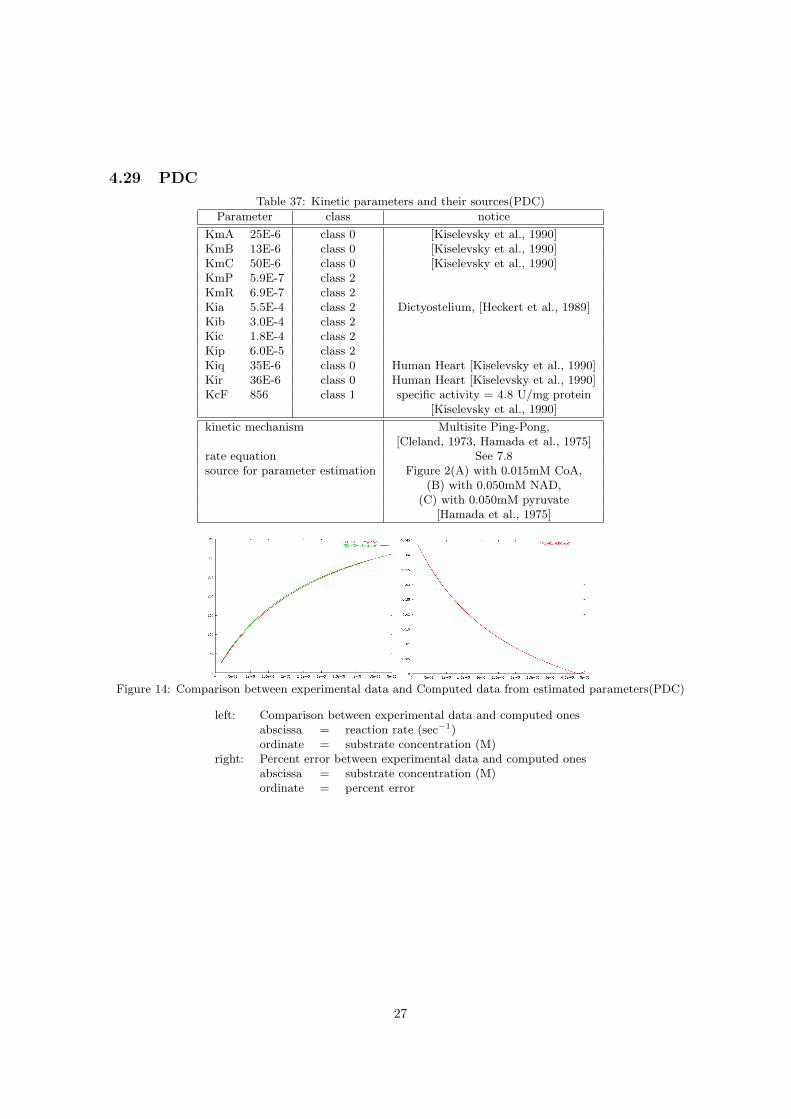
4.29 PDC
Table 37: Kinetic parameters and their sources(PDC)
Parameter class notice
KmA 25E-6 class 0 [Kiselevsky et al., 1990]KmB 13E-6 class 0 [Kiselevsky et al., 1990]KmC 50E-6 class 0 [Kiselevsky et al., 1990]KmP 5.9E-7 class 2KmR 6.9E-7 class 2Kia 5.5E-4 class 2 Dictyostelium, [Heckert et al., 1989]Kib 3.0E-4 class 2Kic 1.8E-4 class 2Kip 6.0E-5 class 2Kiq 35E-6 class 0 Human Heart [Kiselevsky et al., 1990]Kir 36E-6 class 0 Human Heart [Kiselevsky et al., 1990]KcF 856 class 1 specific activity = 4.8 U/mg protein
[Kiselevsky et al., 1990]
kinetic mechanism Multisite Ping-Pong,[Cleland, 1973, Hamada et al., 1975]
rate equation See 7.8source for parameter estimation Figure 2(A) with 0.015mM CoA,
(B) with 0.050mM NAD,(C) with 0.050mM pyruvate
[Hamada et al., 1975]
Figure 14: Comparison between experimental data and Computed data from estimated parameters(PDC)
left: Comparison between experimental data and computed onesabscissa = reaction rate (sec−1)ordinate = substrate concentration (M)
right: Percent error between experimental data and computed onesabscissa = substrate concentration (M)ordinate = percent error
27

4.30 PiC
Table 38: Kinetic parameters and their sources(PiC)
Parameter class notice
KiS1 0.87 class 2KiS2 1.86E-8 class 2KiP1 32.84E-9 class 0 Fig. 4, [Stappen and Kramer, 1994]KiP2 11.12E-3 class 0 Fig. 4, [Stappen and Kramer, 1994]KcF 37.9 class 0 Fig. 4, [Stappen and Kramer, 1994], 34kDaKcR 37.0 class 0 Fig. 4, [Stappen and Kramer, 1994], 34kDaalpha 1.0 class 0beta 1.0 class 0gamma 1.0 class 0delta 1.0 class 0
kinetic mechanism Rapid Equilibrium Random Bi Bi,[Stappen and Kramer, 1994]
rate equation See 7.12source for parameter estimation Figure 4(A) with pH5.85,
(B) with 4mM phosphate]stappen94
Figure 15: Comparison between experimental data and Computed data from estimated parameters(PiC)
left: Comparison between experimental data and computed onesabscissa = reaction rate (sec−1)ordinate = substrate concentration (M)
right: Percent error between experimental data and computed onesabscissa = substrate concentration (M)ordinate = percent error
28

4.31 PYC
Table 39: Kinetic parameters and their sources(PYC)
Parameter class notice
KiS1 6.1E-4 class 2KiS2 5.9E-4 class 2KiP1 2.6E-4 class 2KiP2 4.1E-4 class 2KcF 0.84 class 1 0.67 [Capuano et al., 1990]KcR 0.78 class 1 0.61 [Capuano et al., 1990]alpha 1.0 class 0beta 1.0 class 0gamma 1.0 class 0delta 1.0 class 0
kinetic mechanism Rapid Equilibrium Random Bi Bi,(sequential) [Nalecz, 1994]
rate equation See 7.12source for parameter estimation [Capuano et al., 1990, Figure 3]
Figure 16: Comparison between experimental data and Computed data from estimated parameters(PYC)left: Comparison between experimental data and computed ones
abscissa = reaction rate (sec−1)ordinate = substrate concentration (M)
right: Percent error between experimental data and computed onesabscissa = substrate concentration (M)ordinate = percent error
29

4.32 SCS
Table 40: Kinetic parameters and their sources(SCS)
Parameter class notice
KmA 5E-6 class 0 GDP (2 - 8E-6)KmB 3.5E-5 class 0 Succinyl-CoA (1 - 6E-5)KmC 4.5E-4 class 0 Pi (2 - 7E-4)KmP 6E-4 class 0 Succinate (4 - 8E-4)KmQ 7.5E-6 class 0 GTP (5 - 10E-6)KmC2 4.5E-4 class 0 Pi (2 - 7E-4)KmP2 6E-4 class 0 Succinate (4 - 8E-4)Keq 8.375 class 0 From Haldane relationshipsKia 4E-4 class 0 GDP (Table II)Kib 2E-5 class 0 Succinyl-CoA, (vs. CoA, Fig. 7)Kic 3E-5 class 0 Pi (Table II)Kip 7E-2 class 0 Succinate (Table II)Kiq 5E-6 class 0 GTP (Table II)Kir 6.7E-6 class 0 CoA, from a Haldane relationship, Kq * Kir = Kiq * Kr
where Kr (CoA) = 10E-6 MKc1 100 class 0 kcat = Kc2 = 25 to 287.5 (20 to 230 U/mg * 75000 Dalton)Kc2 100 class 3 guess, V1 / V2 = 0.20, V2’ / V1’ = 30
kinetic mechanism See [Cha and Parks Jr., 1964]rate equation See 7.13
4.33 SDH
Table 41: Kinetic parameters and their sources(SDH)
Parameter class notice
KmS1 30E-6 class 0KmS2 69E-6 class 0 30-130E-6KmP1 0.3E-6 class 0KmP2 1.5E-6 class 0KiS1 4.1E-6 class 2 Ki for carboxin = 3.0E-6 MKiP2 5.6E-6 class 2 Ki for carboxin = 3.0E-6 MKeq 0.037 class 0 from HaldaneKcF 69.3 class 0 MW = 104000 DaKcR 1.73 class 0 MW = 104000 Da
kinetic mechanism Ping-Pong Bi Bi [Grivennikova et al., 1993]rate equation See 7.11source for parameter estimation [Grivennikova et al., 1993, Figure 2(B)]
30

Figure 17: Comparison between experimental data and Computed data from estimated parameters(SDH)left: Comparison between experimental data and computed ones
abscissa = reaction rate (sec−1)ordinate = substrate concentration (M)
right: Percent error between experimental data and computed onesabscissa = substrate concentration (M)ordinate = percent error
5 Initial condition
5.1 The respiratory chain
Table 42: Initial condition of enzymes (respiratory chain)
name localization number of molecules
Complex-I MT-IM 1000Complex-III MT-IM 3000Complex-IV MT-IM 7000Complex-V MT-IM 900
Table 43: Initial condition of metabolites (respiratory chain)
name localization concentration
Q MT-IMS 0.26E-3 MQH2 MT-IMS 0.028E-3 MCyt-c3+ MT-IMS 3E-6 MCyt-c2+ MT-IMS 0.11E-3 MH+ MT-IMS 1E-6 M (fix)H+ MATRIX 1E-8 M (fix)
5.2 The TCA cycle
Table 44: Initial condition of enzymes (TCA cycle)
name localization number of molecules
CS MATRIX 100ACO MATRIX 100IDHa MATRIX 100IDHb MATRIX 100OGDC MATRIX 100SCS MATRIX 100SDH MT-IM 100FM MATRIX 100MDH MATRIX 100
AlaTA MATRIX 100AspTA MATRIX 100NDK MATRIX 100PDC MATRIX 100PC MATRIX 100
31
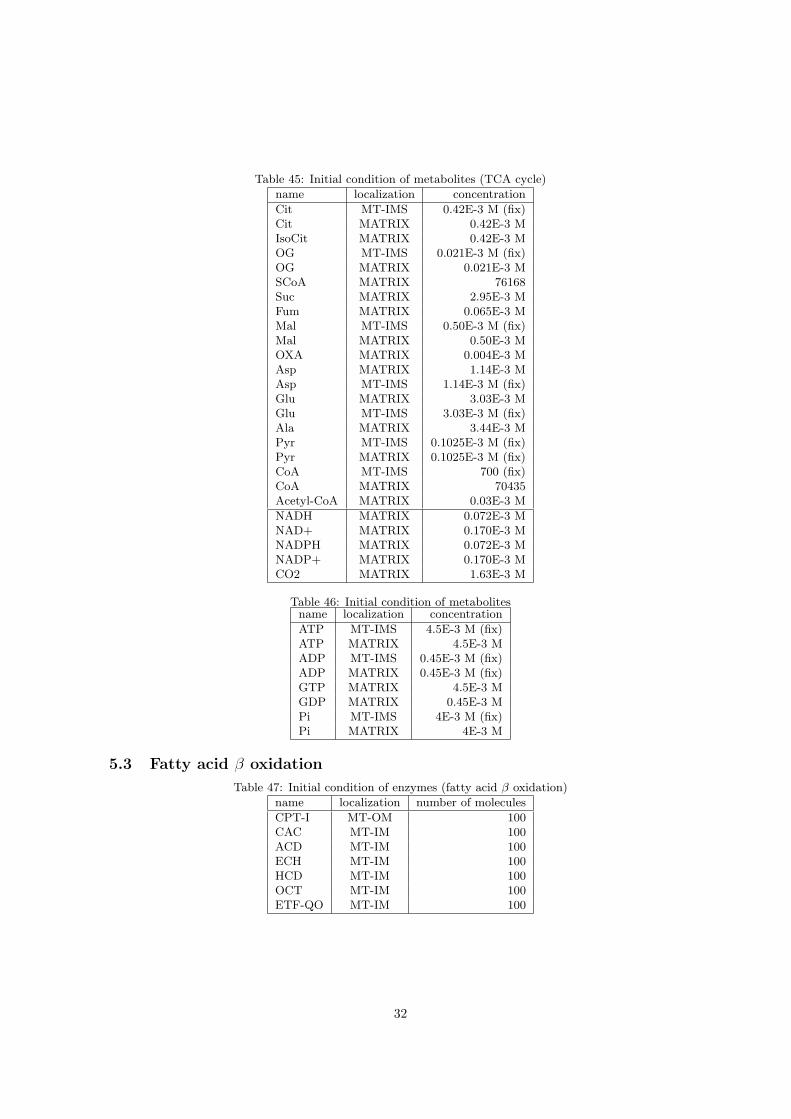
Table 45: Initial condition of metabolites (TCA cycle)
name localization concentration
Cit MT-IMS 0.42E-3 M (fix)Cit MATRIX 0.42E-3 MIsoCit MATRIX 0.42E-3 MOG MT-IMS 0.021E-3 M (fix)OG MATRIX 0.021E-3 MSCoA MATRIX 76168Suc MATRIX 2.95E-3 MFum MATRIX 0.065E-3 MMal MT-IMS 0.50E-3 M (fix)Mal MATRIX 0.50E-3 MOXA MATRIX 0.004E-3 MAsp MATRIX 1.14E-3 MAsp MT-IMS 1.14E-3 M (fix)Glu MATRIX 3.03E-3 MGlu MT-IMS 3.03E-3 M (fix)Ala MATRIX 3.44E-3 MPyr MT-IMS 0.1025E-3 M (fix)Pyr MATRIX 0.1025E-3 M (fix)CoA MT-IMS 700 (fix)CoA MATRIX 70435Acetyl-CoA MATRIX 0.03E-3 M
NADH MATRIX 0.072E-3 MNAD+ MATRIX 0.170E-3 MNADPH MATRIX 0.072E-3 MNADP+ MATRIX 0.170E-3 MCO2 MATRIX 1.63E-3 M
Table 46: Initial condition of metabolitesname localization concentration
ATP MT-IMS 4.5E-3 M (fix)ATP MATRIX 4.5E-3 MADP MT-IMS 0.45E-3 M (fix)ADP MATRIX 0.45E-3 M (fix)GTP MATRIX 4.5E-3 MGDP MATRIX 0.45E-3 MPi MT-IMS 4E-3 M (fix)Pi MATRIX 4E-3 M
5.3 Fatty acid β oxidation
Table 47: Initial condition of enzymes (fatty acid β oxidation)
name localization number of molecules
CPT-I MT-OM 100CAC MT-IM 100ACD MT-IM 100ECH MT-IM 100HCD MT-IM 100OCT MT-IM 100ETF-QO MT-IM 100
32
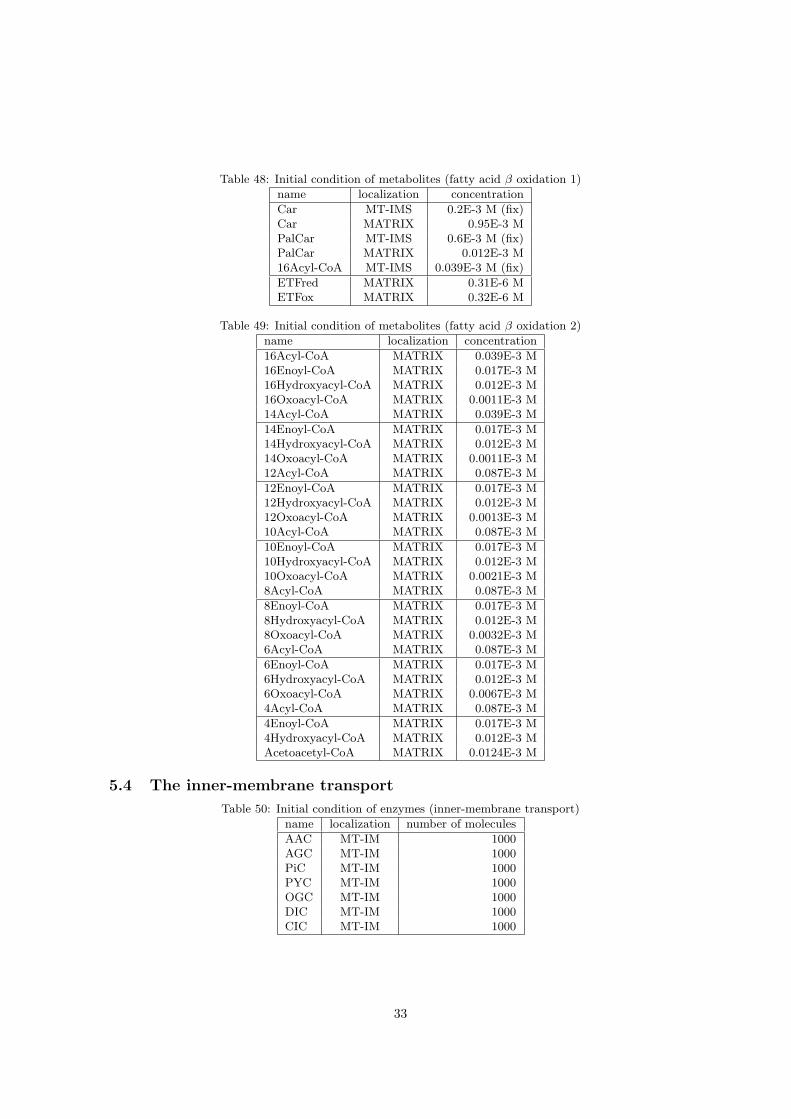
Table 48: Initial condition of metabolites (fatty acid β oxidation 1)
name localization concentration
Car MT-IMS 0.2E-3 M (fix)Car MATRIX 0.95E-3 MPalCar MT-IMS 0.6E-3 M (fix)PalCar MATRIX 0.012E-3 M16Acyl-CoA MT-IMS 0.039E-3 M (fix)
ETFred MATRIX 0.31E-6 METFox MATRIX 0.32E-6 M
Table 49: Initial condition of metabolites (fatty acid β oxidation 2)
name localization concentration
16Acyl-CoA MATRIX 0.039E-3 M16Enoyl-CoA MATRIX 0.017E-3 M16Hydroxyacyl-CoA MATRIX 0.012E-3 M16Oxoacyl-CoA MATRIX 0.0011E-3 M14Acyl-CoA MATRIX 0.039E-3 M
14Enoyl-CoA MATRIX 0.017E-3 M14Hydroxyacyl-CoA MATRIX 0.012E-3 M14Oxoacyl-CoA MATRIX 0.0011E-3 M12Acyl-CoA MATRIX 0.087E-3 M
12Enoyl-CoA MATRIX 0.017E-3 M12Hydroxyacyl-CoA MATRIX 0.012E-3 M12Oxoacyl-CoA MATRIX 0.0013E-3 M10Acyl-CoA MATRIX 0.087E-3 M
10Enoyl-CoA MATRIX 0.017E-3 M10Hydroxyacyl-CoA MATRIX 0.012E-3 M10Oxoacyl-CoA MATRIX 0.0021E-3 M8Acyl-CoA MATRIX 0.087E-3 M
8Enoyl-CoA MATRIX 0.017E-3 M8Hydroxyacyl-CoA MATRIX 0.012E-3 M8Oxoacyl-CoA MATRIX 0.0032E-3 M6Acyl-CoA MATRIX 0.087E-3 M
6Enoyl-CoA MATRIX 0.017E-3 M6Hydroxyacyl-CoA MATRIX 0.012E-3 M6Oxoacyl-CoA MATRIX 0.0067E-3 M4Acyl-CoA MATRIX 0.087E-3 M
4Enoyl-CoA MATRIX 0.017E-3 M4Hydroxyacyl-CoA MATRIX 0.012E-3 MAcetoacetyl-CoA MATRIX 0.0124E-3 M
5.4 The inner-membrane transport
Table 50: Initial condition of enzymes (inner-membrane transport)
name localization number of molecules
AAC MT-IM 1000AGC MT-IM 1000PiC MT-IM 1000PYC MT-IM 1000OGC MT-IM 1000DIC MT-IM 1000CIC MT-IM 1000
33

6 Steady-state condition
This metabolic model reached in a steady-state around t=93000sec with the initial condition. Number ofmolecules at the steady-state are shown below. Obtaining a steady-state, this system clears requirements forMetabolic Control Analysis[Fell, 1992].
6.1 The respiratory chain
Table 51: Steady-state concentration of metabolites (respiratory chain)
name localization number of molecules
Q MT-IMS 77547QH2 MT-IMS 500Cyt-c3+ MT-IMS 29624Cyt-c2+ MT-IMS 999H+ MT-IMS 3H+ MATRIX 3
Table 52: Steady-state concentration of metabolitesname localization number of molecules
ATP MT-IMS 13550(fix)ATP MATRIX 180ADP MT-IMS 1355(fix)ADP MATRIX 121948(fix)GTP MATRIX 2579GDP MATRIX 1338852Pi MT-IMS 12044(fix)Pi MATRIX 2507395
34

6.2 The TCA cycle and the inner-membrane transport
Table 53: Steady-state concentration of metabolites (TCA cycle)
name localization number of molecules
Cit MT-IMS 1265 (fix)Cit MATRIX 583455IsoCit MATRIX 74758OG MT-IMS 63 (fix)OG MATRIX 424SCoA MATRIX 32Suc MATRIX 1133Fum MATRIX 231567Mal MT-IMS 1506 (fix)Mal MATRIX 1028383OXA MATRIX 302Asp MATRIX 244090Asp MT-IMS 3433 (fix)Glu MATRIX 801482Glu MT-IMS 9124 (fix)Ala MATRIX 1016709Pyr MT-IMS 27777 (fix)Pyr MATRIX 309(fix)CoA MT-IMS 700 (fix)CoA MATRIX 286Acetyl-CoA MATRIX 104498
NADH MATRIX 3672NAD+ MATRIX 61909NADPH MATRIX 7508NADP+ MATRIX 58073CO2 MATRIX 42631671
6.3 Fatty acid β oxidation
Table 54: Steady-state concentration of metabolites (fatty acid β oxidation 1)
name localization number of molecules
Car MT-IMS 602 (fix)Car MATRIX 47418PalCar MT-IMS 1807 (fix)PalCar MATRIX 21328016Acyl-CoA MT-IMS 117 (fix)
ETFred MATRIX 89ETFox MATRIX 82
35
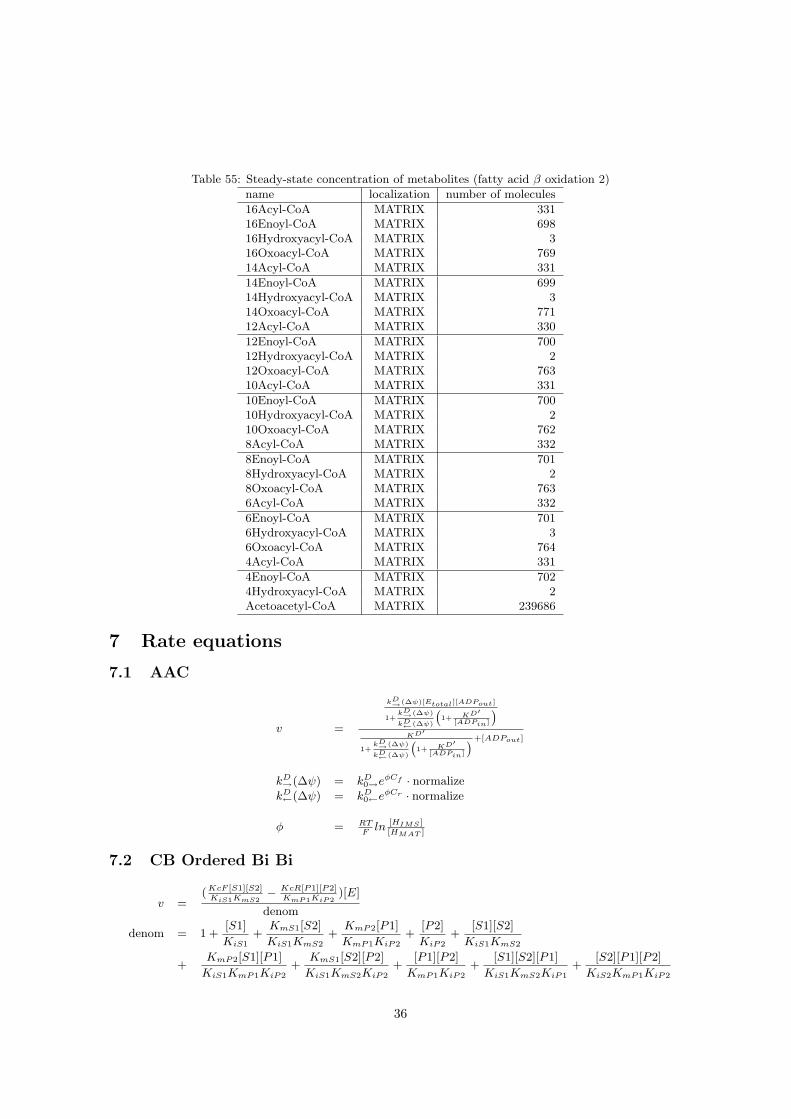
Table 55: Steady-state concentration of metabolites (fatty acid β oxidation 2)
name localization number of molecules
16Acyl-CoA MATRIX 33116Enoyl-CoA MATRIX 69816Hydroxyacyl-CoA MATRIX 316Oxoacyl-CoA MATRIX 76914Acyl-CoA MATRIX 331
14Enoyl-CoA MATRIX 69914Hydroxyacyl-CoA MATRIX 314Oxoacyl-CoA MATRIX 77112Acyl-CoA MATRIX 330
12Enoyl-CoA MATRIX 70012Hydroxyacyl-CoA MATRIX 212Oxoacyl-CoA MATRIX 76310Acyl-CoA MATRIX 331
10Enoyl-CoA MATRIX 70010Hydroxyacyl-CoA MATRIX 210Oxoacyl-CoA MATRIX 7628Acyl-CoA MATRIX 332
8Enoyl-CoA MATRIX 7018Hydroxyacyl-CoA MATRIX 28Oxoacyl-CoA MATRIX 7636Acyl-CoA MATRIX 332
6Enoyl-CoA MATRIX 7016Hydroxyacyl-CoA MATRIX 36Oxoacyl-CoA MATRIX 7644Acyl-CoA MATRIX 331
4Enoyl-CoA MATRIX 7024Hydroxyacyl-CoA MATRIX 2Acetoacetyl-CoA MATRIX 239686
7 Rate equations
7.1 AAC
v =
kD→(∆ψ)[Etotal][ADPout]
1+kD→(∆ψ)
kD←(∆ψ)
(1+ KD
′[ADPin]
)KD′
1+kD→(∆ψ)
kD←(∆ψ)
(1+ KD
′[ADPin]
)+[ADPout]
kD→(∆ψ) = kD
0→eφCf · normalize
kD←(∆ψ) = kD
0←eφCr · normalize
φ = RTFln [HIMS ]
[HMAT ]
7.2 CB Ordered Bi Bi
v =(KcF [S1][S2]
KiS1KmS2− KcR[P1][P2]
KmP1KiP2)[E]
denom
denom = 1 +[S1]
KiS1+
KmS1[S2]
KiS1KmS2+
KmP2[P1]
KmP1KiP2+
[P2]
KiP2+
[S1][S2]
KiS1KmS2
+KmP2[S1][P1]
KiS1KmP1KiP2+
KmS1[S2][P2]
KiS1KmS2KiP2+
[P1][P2]
KmP1KiP2+
[S1][S2][P1]
KiS1KmS2KiP1+
[S2][P1][P2]
KiS2KmP1KiP2
36

7.3 Complex III
v = KcF [Et][A][B]denom
denom =(KmAKq2Kb2 +KmAKq2[B] + KcF
k8Kq1[A]Kb1 + KcF
k8Kq1[A][B]
)[Q]
+ KmA[B] +KmB [A] + [A][B]
7.4 Complex V
v =
KcF [E]
{[ADP ][Pi]
KdKpkltfe
−3(β−ax)φ(
[H+IMS
]
Khxeaxφ
)3
− [ATP ]Kt
Keqkltre3(1−β−ay)φ
([H+MAT
]
Khye−ayφ
)3}
(1 +
[H+IMS
]
Khxeaxφ+
[H+MAT
]
Khye−ayφ
)3 (3 + [ADP ][Pi]
KdKp+ [ATP ]
Kt
)
where φ = ln [HIMS ][HMAT ]
7.5 IDHa
v =kcat[E]([IsoCit]2 + b[ADP ][IsoCit])
[IsoCit]2 + c[IsoCit] + d[ADP ] + e[ADP ][IsoCit] + f
7.6 IDHb
v =[E][NADP ][IsoCit]
denom1− [E][NADPH][OG][CO2]
denom2
denom1 = φ0[NADP ][IsoCit] + φ1[IsoCit] + φ2[NADP ] + φ12
denom2 = φ′0[NADPH][OG][CO2] + φ′1[OG][CO2] + φ′2[NADPH][CO2] + φ′3[NADPH][OG]
+ φ′12[CO2] + φ′13[OG] + φ′23[NADPH] + φ′123
7.7 Michaelis Uni Uni
v =KcF [E][S]
Ks + [S]
7.8 Multisite Ping-Pong
v =kcat[Etotal][A][B][C]
denom
denom = KmC [A][B] +KmB [A][C] +KmA[B][C] + [A][B][C]
+KmAKmPKibKic[Q][R]
KmRKipKiq+KmC [A][B][R]
Kir+KmB [A][C][Q]
Kiq+KmAKmPKibKic[A][Q][R]
KmRKipKiaKiq
37
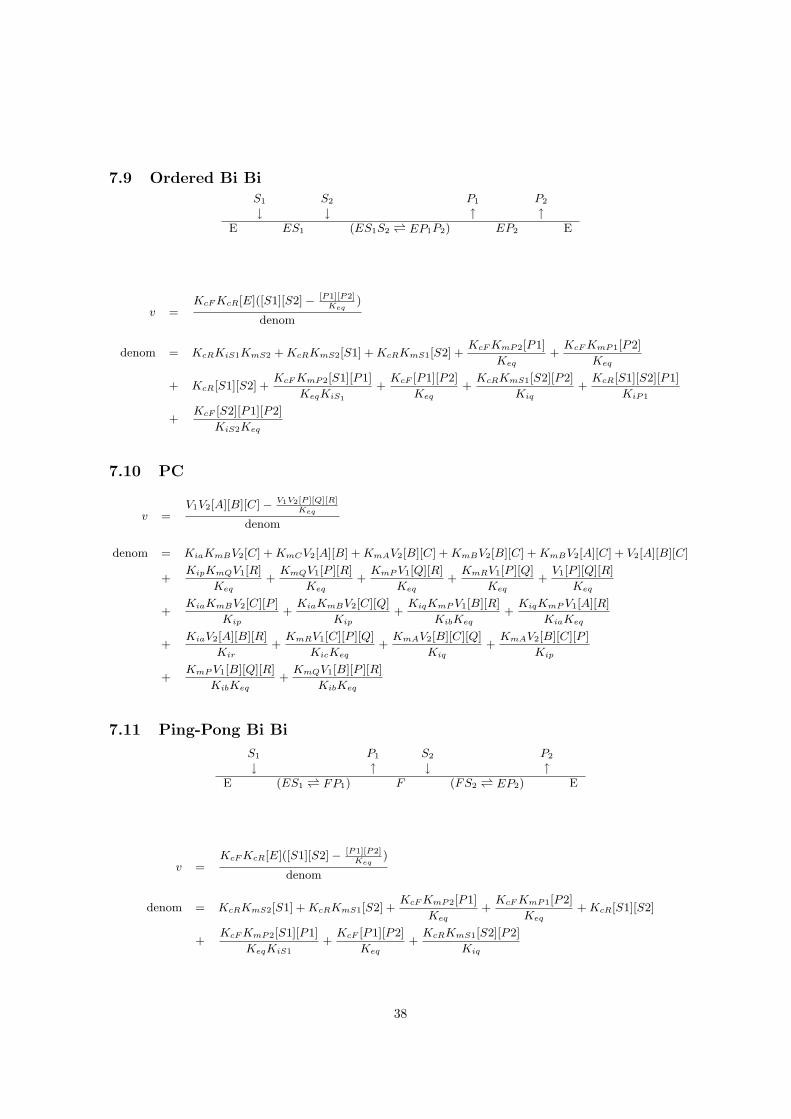
7.9 Ordered Bi BiS1 S2 P1 P2
↓ ↓ ↑ ↑E ES1 (ES1S2 ⇀↽ EP1P2) EP2 E
v =KcFKcR[E]([S1][S2]− [P1][P2]
Keq)
denom
denom = KcRKiS1KmS2 +KcRKmS2[S1] +KcRKmS1[S2] +KcFKmP2[P1]
Keq+KcFKmP1[P2]
Keq
+ KcR[S1][S2] +KcFKmP2[S1][P1]
KeqKiS1
+KcF [P1][P2]
Keq+KcRKmS1[S2][P2]
Kiq+KcR[S1][S2][P1]
KiP1
+KcF [S2][P1][P2]
KiS2Keq
7.10 PC
v =V1V2[A][B][C]− V1V2[P ][Q][R]
Keq
denom
denom = KiaKmBV2[C] +KmCV2[A][B] +KmAV2[B][C] +KmBV2[B][C] +KmBV2[A][C] + V2[A][B][C]
+KipKmQV1[R]
Keq+KmQV1[P ][R]
Keq+KmPV1[Q][R]
Keq+KmRV1[P ][Q]
Keq+V1[P ][Q][R]
Keq
+KiaKmBV2[C][P ]
Kip+KiaKmBV2[C][Q]
Kip+KiqKmPV1[B][R]
KibKeq+KiqKmPV1[A][R]
KiaKeq
+KiaV2[A][B][R]
Kir+KmRV1[C][P ][Q]
KicKeq+KmAV2[B][C][Q]
Kiq+KmAV2[B][C][P ]
Kip
+KmPV1[B][Q][R]
KibKeq+KmQV1[B][P ][R]
KibKeq
7.11 Ping-Pong Bi Bi
S1 P1 S2 P2
↓ ↑ ↓ ↑E (ES1 ⇀↽ FP1) F (FS2 ⇀↽ EP2) E
v =KcFKcR[E]([S1][S2]− [P1][P2]
Keq)
denom
denom = KcRKmS2[S1] +KcRKmS1[S2] +KcFKmP2[P1]
Keq+KcFKmP1[P2]
Keq+KcR[S1][S2]
+KcFKmP2[S1][P1]
KeqKiS1+KcF [P1][P2]
Keq+KcRKmS1[S2][P2]
Kiq
38

7.12 Rapid Equilibrium Random Bi Bi
v =
[A][B]αKiAKiB
kfcat[E]total − [P ][Q]
βKiPKiQkr
cat[E]total
1 + [A]KiA
+ [B]KiB
+ [P ]KiP
+ [Q]KiQ
+ [A][B]αKiAKiB
+ [P ][Q]βKiPKiQ
+ [B][Q]γKiBKiQ
+ [A][P ]δKiAKiP
7.13 SCS
v =
([A][B][C]− [P ][Q][R]
Keq
){V1 + V2
(KmC [P ]
KmC2Kip+ [C]
KmC2
)}
denom
denom = KiaKmB [C] +KmB [A][C] +KmA[B][C] +KmC [A][B] + [A][B][C]
+[A][B][C]2
KmC2+KiaKmBKmC [P ]
Kip+KiaKmBKmC [P ][Q]
KipKiq+KiaKmBKmC [P ][R]
KipKir
+KiaKmBKic[Q][R]
KmQKir+KiaKmBKmC [P ][Q][R]
KipKmQKir+KiaKmBKmC [P ]2[Q][R]
KipKmP2KmQKir
+KiaKmB [C][Q]
Kiq+KiaKmB [C][R]
Kir+KiaKmB [C][Q][R]
KmQKir+KiaKmB [C][P ][Q][R]
KmP2KmQKir
+KmBKmC [A][P ]
Kip+KmAKmC [B][P ]
Kip+KmC [A][B][P ]
Kip+KmC [A][B][C][P ]
KmC2Kip
+KmA[B][C][Q]
Kiq+KmB [A][C][R]
Kir+KmAKmC [B][P ][Q]
KipKiq+KmBKmC [A][P ][R]
KipKir
7.14 Uni Uni Reversible
v =(KcFKp[S]−KcRKs[P ])[E]
Ks[P ] +Kp[S] +KsKp
39

8 MeSH term and literature search
The mitochondrial model was built through comprehensive literature search. Here we show the tendency ofMeSH terms embedded in the articles that were crucial for determination of the rate equations.
Table 56: The MeSH term tendency of the articles on the reaction mechanism of each enzyme
Literature Kinetics Models Mathematics enzyme name substrate name
[Barden et al., 1972] + +, Chemical + - +
[Beckmann and Frerman, 1985] + - - + -
[Crow et al., 1983] + - + + +
[Davisson and Schulz, 1985] + +, Biological - + +
[De Rosa et al., 1979] - - - + -
[Dierks and Kramer, 1988] + - - + -
[Fato et al., 1996] + - - + +
[Grivennikova et al., 1993] - - - + -
[Guarriero-Bobyleva et al., 1978] + - - + +
[Hamada et al., 1975] + - - + +
[Indiveri et al., 1991b] + - - + +
[Indiveri et al., 1991a] + - - + +
[Indiveri et al., 1994] + - - + +
[Kholodenko, 1993] + + - + +
[Kramer and Klingenberg, 1982] + - - + +
[Kubota et al., 1992] + - - + +
[Malmstrom and Andreasson, 1985] + - - + +
[Mann et al., 1995] + - - + +
[Matsuoka and Srere, 1973] + - + + +
[McKean et al., 1979] + - - - +
[Miyazawa et al., 1981] + - - + -
[Mukherjee and Srere, 1976] - - - - +
[Plaut et al., 1974] + +, Chemical + + +
[Ramsay et al., 1987] + - - + +
[Sluse et al., 1991] + - - + +
[Stappen and Kramer, 1994] + - - + -
[Yang and Schulz, 1987] + +, Theoretical + + +
Frequency 24/27 5/27 5/27 24/27 21/27
40

References
[Barden et al., 1972] Barden, R. E., Fung, C. H., Utter, M. F., and Scrutton, M. C. (1972). Pyruvate car-boxylase from chicken liver. J. Biol. Chem., 247(4):1323–33.
[Beckmann and Frerman, 1985] Beckmann, J. D. and Frerman, F. E. (1985). Reaction of electron-transferflavoprotein with electron-transfer flavoprotein-ubiquinone oxidoreductase. Biochemistry, 24(15):3922–5.
[Bisaccia et al., 1993] Bisaccia, F., De Palma, A., Dierks, T., Kramer, R., and Palmieri, F. (1993). Reactionmechanism of the reconstituted tricarboxylate carrier from rat liver mitochondria. Biochim. Biophys. Acta,1142(1-2):139–45.
[Boyer, 1970] Boyer, P. D., editor (1970). The Enzymes. Academic Press, New York, London.
[Capuano et al., 1990] Capuano, F., Di Paola, M., Azzi, A., and Papa, S. (1990). The monocarboxylatecarrier from rat liver mitochondria: purification and kinetic characterization in a reconstituted system.FEBS lett., 261(1):39–42.
[Cha and Parks Jr., 1964] Cha, S. and Parks Jr., R. E. (1964). Succinic thiokinase II. kinetic studies: initialvelocity, product inhibition, and effect of arsenate. J. Biol. Chem., 239(6):1968–77.
[Cleland, 1973] Cleland, W. W. (1973). Derivation of rate equations of multisite ping-pong mechanisms withping-pong reactions at one or more sites. J. Biol. Chem., 248(24):8353–5.
[Colomb et al., 1969] Colomb, M. G., Cheruy, A., and Vignais, P. V. (1969). Nucleoside diphosphatekinasefrom beef heart mitochondria: purification and properties. Biochemistry, 8(5):1926–39.
[Crow et al., 1983] Crow, K. E., Braggins, T. J., and Hardman, M. J. (1983). Human liver cytosolic malatedehydrogenase: purification, kinetic properties, and role in ethanol metabolism. Arch. Biochem. Biophys.,225(2):621–9.
[Davisson and Schulz, 1985] Davisson, V. J. and Schulz, A. R. (1985). The purification and steady-statekinetic behaviour of rabbit heart mitochondrial NAD(P)+ malic enzyme. Biochem. J., 225(2):335–42.
[De Rosa et al., 1979] De Rosa, G., Burk, T. L., and Swick, R. W. (1979). Isolation and characterization ofmitochondrial alanine aminotransferase from porcine tissue. Biochim. Biophys. Acta, 567(1):116–24.
[Dierks and Kramer, 1988] Dierks, T. and Kramer, R. (1988). Asymmetric orientation of the reconstitutedaspartate / glutamete carrier from mitochondria. Biochim. Biophys. Acta, 937(1):112–26.
[Ehrlich et al., 1981] Ehrlich, R. S., Hayman, S., Ramachandran, N., and Colman, R. F. (1981). Re-evaluationof molecular weight of pig heart NAD-specific isocitrate dehydrogenase. J. Biol. Chem., 256(20):10560–4.
[Fato et al., 1996] Fato, R., Estornell, E., Di Bernardo, S., Pallotti, F., Parenti Castelli, G., and Lenaz,G. (1996). Steady-state kinetics of the reduction of coenzyme Q analogs by complex I (NADH:ubiquinoneoxidoreductase) in bovine heart mitochondria and submitochondrial particles. Biochemistry, 35(8):2705–16.
[Fell, 1992] Fell, D. A. (1992). Metabolic control analysis: a survey of its theoretical and experimentaldevelopment. Biochem. J., 286(Pt 2):313–30.
[Garces and Cleland, 1969] Garces, E. and Cleland, W. W. (1969). Kinetic studies of yeast nucleoside diphos-phate kinase. Biochemistry, 8(2):633–40.
[Grivennikova et al., 1993] Grivennikova, V. G., Gavrikova, E. V., Timoshin, A. A., and Vinogradov, A. D.(1993). Fumarate reductase activity of bovine heart succinate-ubiquinone reductase. new assay system andoverall properties of the reaction. Biochim. Biophys. Acta, 1140(3):282–92.
[Guarriero-Bobyleva et al., 1978] Guarriero-Bobyleva, V., Masini, A., Volpi-Becchi, M. A., and Cennamo,C. (1978). Kinetic studies of cytoplasmic and mitochondrial aconitate hydratases from rat liver. Ital. J.Biochem., 27(5):287–99.
[Hamada et al., 1975] Hamada, M., Koike, K., Nakaula, Y., Hiraoka, T., Koike, M., and Hashimoto, T.(1975). A kinetic study of the α-keto acid dehdrogenase complexes from pig heart mitochondria. J.Biochem. (Tokyo), 77(5):1047–56.
[Heckert et al., 1989] Heckert, L. L., Butler, M. H., Reimers, J. M., Albe, K. R., and Wright, B. E. (1989). Pu-rification and characterization of the 2-oxoglutarate dehydrogenase complex from dictyostelium discoideum.J. Gen. Microbiol., 135(Pt 1):155–61.
41
[Henson and Cleland, 1964] Henson, C. P. and Cleland, W. W. (1964). Kinetic studies of glutamic oxaloacetictransaminase isozymes. Biochemistry, 3(3):338–45.
[Indiveri et al., 1991a] Indiveri, C., Dierks, T., Kramer, R., and Palmieri, F. (1991a). Reaction mechanism ofthe reconstituted oxoglutarate carrier from bovine heart mitochondria. Eur. J. Biochem., 198(2):339–47.
[Indiveri et al., 1993] Indiveri, C., Prezioso, G., Dierks, T., Kramer, R., and Palmieri, F. (1993). Kineticcharacterization of the reconstituted dicarboxylate carrier from mitochondria: a four-binding-site sequentialtransport system. Biochim. Biophys. Acta, 1143(3):310–8.
[Indiveri et al., 1994] Indiveri, C., Tonazzi, A., and Palmieri, F. (1994). The reconstituted carnitine carrierfrom rat liver mitochondria: evidence for a transport mechanism different from that of the other mitochon-drial translocators. Biochim. Biophys. Acta, 1189(1):65–73.
[Indiveri et al., 1991b] Indiveri, C., Tonazzi, A., Prezioso, G., and Palmieri, F. (1991b). Kinetic characteriza-tion of the reconstituted carnitine carrier from rat liver mitochondria. Biochim. Biophys. Acta, 1065(2):231–238.
[Kholodenko, 1993] Kholodenko, B. N. (1993). Kinetic models of coupling between H+ and Na+-translocationand ATP synthesis/hydrolysis by FoF1 -ATPases: Can a cell utilize both ∆µH+ and ∆µNa+ for ATPsynthesis in vivo conditions using the same enzyme? J. Bioenerg. Biomembr., 25(3):285–95.
[Kiselevsky et al., 1990] Kiselevsky, Y. V., Ostrovtsova, S. A., and Strumilo, S. A. (1990). Kinetic character-ization of the pyruvate and oxoglutarate dehydrogenase complexes from human heart. Acta Biochim. Pol.,37(1):135–9.
[Kramer and Klingenberg, 1982] Kramer, R. and Klingenberg, M. (1982). Electrophoretic control of recon-stituted adenine nucleotide translocation. Biochemistry, 21(5):1082–9.
[Kubota et al., 1992] Kubota, T., Yoshikawa, S., and Matsubara, H. (1992). Kinetic mechanism of beef heartubiquinol:cytochrome c oxidoreducase. J. Biochem. (Tokyo), 111(1):91–8.
[Londesborough and Dalziel, 1970] Londesborough, J. C. and Dalziel, K. (1970). Kinetic studies of NADP-dependent isocitrate dehydrogenase form beef heart mitochondria. In Sund, H., editor, Pyridine NucleotideDependent Dehydrogenases, pages 315–24. Springer-Verlag, New York.
[Malmstrom and Andreasson, 1985] Malmstrom, B. G. and Andreasson, L. E. (1985). The steady-state rateequation for cytochrome c oxidase based on a minimal kinetic scheme. J. Inorg. Biochem., 23(3-4):233–42.
[Mann et al., 1995] Mann, W. R., Yan, B., Dragland, C. J., and Bell, P. A. (1995). Kinetic, circular dichroismand fluorescence studies on heterologously expressed carnitine palmitoyltransferase II. J. Enzyme Inhib.,9(4):303–8.
[Matsuno-Yagi and Hatefi, 1985] Matsuno-Yagi, A. and Hatefi, Y. (1985). Studies on the mechanism of ox-idative phosphorylation. Catalytic site cooperativity in ATP synthesis. J. Biol. Chem., 260(27):14424–7.
[Matsuoka and Srere, 1973] Matsuoka, Y. and Srere, P. A. (1973). Kinetic studies of citrate synthase fromrat kidney and rat brain. J. Biol. Chem., 248(33):8022–30.
[McKean et al., 1979] McKean, M. C., Frerman, F. E., and Mielke, D. M. (1979). General acyl-CoA dehy-drogenase frome pig liver. J. Biol. Chem., 254(8):2730–5.
[Miyazawa et al., 1981] Miyazawa, S., Furuta, S., Osumi, T., Hashimoto, T., and Ui, N. (1981). Propertiesof peroxisomal 3-ketoacyl-CoA thiolase from rat liver. J. Biochem. (Tokyo), 90(2):511–9.
[Mukherjee and Srere, 1976] Mukherjee, A. and Srere, P. A. (1976). Purification of and mechanism studieson citrate synthase. J. Biol. Chem., 251(5):1476–80.
[Nalecz, 1994] Nalecz, K. A. (1994). The mitochondrial pyruvate carrier: the mechanism of substrate binding.In Forte, M. and Colombini, M., editors, Molecular Biology of Mitochondrial Transport Systems, pages 67–79. Springer-Verlag, Berlin, Heidelberg.
[Plaut et al., 1974] Plaut, G. W. E., Schramm, V. L., and Aogaichi, T. (1974). Action of magnesiumion on diphosphopyridine nucleotide-linked isocitrate dehydrogenase from bovine heart. J. Biol. Chem.,249(6):1848–56.
[Ramsay et al., 1987] Ramsay, R. R., Derrick, J. P., Friend, A. S., and Tubbs, P. K. (1987). Purificationand properties of the soluble carnitine palmitoyltransferase from bovine liver mitochondria. Biochem. J.,244(2):271–8.
42

[Shepherd and Garland, 1969] Shepherd, D. and Garland, P. B. (1969). The kinetic properties of citratesynthase from rat liver mitochondria. Biochem. J., 114(3):597–610.
[Sluse et al., 1991] Sluse, F. E., Evens, A., Dierks, T., Duyckaerts, C., Sluse-Goffart, C. M., and Kramer, R.(1991). Kinetic study of the aspartate / glutamate carrier in intact rat heart mitochondria and comparisonwith a reconstituted system. Biochim. Biophys. Acta, 1058(3):329–38.
[Stappen and Kramer, 1994] Stappen, R. and Kramer, R. (1994). Kinetic mechanism of phosphate/phosphateand phosphate/OH− antiports catalyzed by reconstituted phosphate carrier from beef heart mitochondria.J. Biol. Chem., 269(15):11240–6.
[Velick and Vavra, 1962] Velick, S. F. and Vavra, J. (1962). A kinetic and equilibrium analysis of the glutamicoxaloacetate transaminase mechanism. J. Biol. Chem., 237(7):2109–22.
[Woeltje et al., 1987] Woeltje, K. F., Kuwajima, M., Foster, D. W., and McGarry, J. D. (1987). Characteri-zation of the mitochondrial carnitine palmitoyltransferase enzyme system. J. Biol. Chem., 262(20):9822–7.
[Yang and Schulz, 1987] Yang, S. Y. and Schulz, H. (1987). Kinetics of coupled enzyme reactions. Biochem-istry, 26(17):5579–84.
43