A. G. Ramakrishnan MILE Lab, EE Department, IISc, Bangalore
39
Significance of the levels of spectral valleys with application to front/back distinction of vowel sounds T. V. Ananthapadmanabha Voice and Speech Systems, Bangalore. [email protected] A. G. Ramakrishnan MILE Lab, EE Department, IISc, Bangalore [email protected] Shubham Sharma MILE Lab, EE Department, IISc, Bangalore [email protected]
Transcript of A. G. Ramakrishnan MILE Lab, EE Department, IISc, Bangalore

Significance of the levels of spectral valleys with application to front/back
distinction of vowel sounds
T. V. Ananthapadmanabha
Voice and Speech Systems, Bangalore.
A. G. Ramakrishnan
MILE Lab, EE Department, IISc, Bangalore
Shubham Sharma
MILE Lab, EE Department, IISc, Bangalore

Anantha, Ramakrishnan and Shubham, JASAAnantha, Ramakrishnan and Shubham, JASA
Abstract
An objective critical distance (OCD) has been defined as that spacing between adjacent
formants, when the level of the valley between them reaches the mean spectral level. The
measured OCD lies in the same range (viz., 3 to 3.5 bark) as the critical distance determined
by subjective experiments for similar experimental conditions. The level of spectral valley
serves a purpose similar to that of the spacing between the formants with an added advantage
that it can be measured from the spectral envelope without an explicit knowledge of formant
frequencies. Based on the relative spacing of formant frequencies, the level of the spectral
valley, VI (between F1 and F2) is much higher than the level of VII (spectral valley between
F2 and F3) for back vowels and vice-versa for front vowels. Classification of vowels into
front/back distinction with the difference (VI − VII) as an acoustic feature, tested using
TIMIT, NTIMIT, Tamil and Kannada language databases gives, on the average, an accuracy
of about 95%, which is comparable to the accuracy (90.6%) obtained using a neural network
classifier trained and tested using MFCC as the feature vector for TIMIT database. The
acoustic feature (VI −VII) has also been tested for its robustness on the TIMIT database for
additive white and babble noise and an accuracy of about 95% has been obtained for SNRs
down to 25 dB for both types of noise.
PACS numbers: 43.71.Es, 43.71.An, 43.70.Fq, 43.66.Ba, 43.66.Lj
2 Significance of levels of spectral valleys

Anantha, Ramakrishnan and Shubham, JASAAnantha, Ramakrishnan and Shubham, JASA
I. INTRODUCTION
It is well established that there is considerable variability in the formant frequencies measured
during the mid-part of a vowel sound spoken in the same context by different speakers of
the same gender and same dialect1. Native listeners have no difficulty in identifying the
phonetic quality of a vowel despite a wide acoustic variability. This finding has created
considerable research interest related to vowel identification based both on perceptual and
objective criteria. One of these approaches is related to the influence of the spacing between
adjacent formants on the perceived vowel quality. Our interest in this paper is related
to this approach. It is well recognized that the spacing between two adjacent formants
determines the level of spectral valley between them, the level being shallower when the
spacing is less and deeper when the spacing is more. Hence, the influence of spacing between
two formants can as well be studied indirectly using the level of spectral valley between
them. The advantage is that the level of spectral valley can be measured from the spectral
envelope without an explicit knowledge of formant data and at the same time not sacrificing
the information about the spacing between the formants. In this paper, we explore the
significance of the level of spectral valley.
Delattre et al. of Haskins Lab reported in 19522 an interesting experimental study of vowel
quality. They showed that vowels synthesized with a single formant of an appropriately
chosen resonant frequency match well with the perceptual quality of back vowels synthesized
3 Significance of levels of spectral valleys

Anantha, Ramakrishnan and Shubham, JASAAnantha, Ramakrishnan and Shubham, JASA
with two formants, as judged by subjects with a training in phonetics. This equivalence
of phonetic quality of a two-formant vowel to that of a single formant vowel is referred
to as “spectral integration” in the literature. Surprisingly, this integration did not seem
to emerge in the case of front vowels, except for vowel ‘i’ as an extreme case. Chistovich
et al.3 conducted subjective experiments to derive the condition under which the spectral
integration occurs. They kept F2 fixed and varied the spacing between F1 and F2. Such
a two-formant stimulus was compared with a single-formant stimulus for equivalence in
vowel quality. They found that perceptual equivalence occurs when the spacing between the
formants lies within the range: 3.1 < ∆Zc < 4.0 bark for an F2 value of 1.8 kHz and in the
range 3.3 < ∆Zc < 4.3 bark for the F2 value of 1.4 kHz. Although this critical distance,
denoted as ∆Zc, has a wide range of 3.1 to 4.3 bark and the experiment by Delattre et
al.2 demonstrated spectral integration for ‘u’ with a formant separation of 3.94 bark, this
perceptual phenomenon is generally known as 3-bark rule in the literature.
Chistovich et al.3 argued that the frequency of the single-formant equivalent corresponds
to the center of gravity of the spectrum. Chistovich and Lublinskaya4 showed that spectral
integration occurs even when there is a large change in formant levels when the spacing
between formants is less than the critical distance in the range of 3− 3.5 bark. Experiments
on matching a four-formant vowel to a two-formant vowel also seem to support the so called
3-bark rule5;6.
4 Significance of levels of spectral valleys

Anantha, Ramakrishnan and Shubham, JASAAnantha, Ramakrishnan and Shubham, JASA
The 3-bark rule has been applied in the context of vowel classification7, where (F1 − F0),
(F2 − F1) and (F3 − F2) differences in bark have been used. The authors7 argue that these
differences compared with a threshold of 3 bark, rather than the actual values of the formant
frequencies, is of importance for the discrete vowel classes to emerge. Vowel classification
accuracy of 87− 99% has been reported. A practical scheme of vowel classification based on
the separation of formants requires an accurate estimation of formant frequencies, which is
quite challenging, especially for high F0 vowels8. Hence, some researchers have proposed a
spectral template approach instead9;10;11.
Based on the success of using the formant separation as an acoustic feature, Syrdal and
Gopal7 proposed an auditory model for vowel perception which raises some issues to be
resolved. The subjective experimental evidence of 3-bark rule has been established mainly
for back vowels. The separation (F2 − F1) is not distinctive since it is greater than 3 bark
for all front vowels as well as for a number of back vowels. Perceptual tests12 have shown
instances of stimuli with the same separation of F0 and F1 producing a high-low distinction
and also instances of stimuli with F2 and F3 separation less than 3 bark producing a vowel
quality distinction.
Some researchers consider spectral integration to be a general psycho-acoustic phenomenon,
not necessarily restricted to vowels, based on perceptual tests conducted on two-tone com-
plex signals13 and sinusoids replacing formants14;15. Although it is generally believed that
5 Significance of levels of spectral valleys

Anantha, Ramakrishnan and Shubham, JASAAnantha, Ramakrishnan and Shubham, JASA
spectral integration occurs for back vowels, there may be some exceptions as demonstrated
for a specific back vowel of Chinese language16. Spectral integration has also been reported
in the literature with respect to syllable initial stops17 and glides18 but the interest in this
paper is restricted only to vowel sounds.
Motivation for the present work: The subjective critical distance of 3− 3.5 bark has
been derived using two-formant unrounded synthetic vowels resembling the quality of ‘a’ or
‘e’. It is not known if the same subjective critical distance is also valid for multiple-formant
natural vowels with different bandwidths, formant levels, spectral tilt etc. It is extremely
time consuming to conduct subjective experiments to deduce the critical distance for all the
experimental conditions. With this in view, we propose an objective critical distance (OCD)
that may be measured for any given spectral envelope and investigate if such an OCD serves
a similar purpose as that of the subjective critical distance.
About this work: In Sec.II, an OCD is defined in terms of the level of spectral valley
between two formants. The influence of formant spacing, higher formants, formant levels
and fundamental frequency on the measured OCD is studied. In Sec.III, the measured OCD
is compared with the subjectively determined critical distance published in the literature.
In Sec.IV, the importance of the relative level of spectral valley as an acoustic feature for a
front/back classification of vowels is presented.
6 Significance of levels of spectral valleys

Anantha, Ramakrishnan and Shubham, JASAAnantha, Ramakrishnan and Shubham, JASA
II. THE OBJECTIVE CRITICAL DISTANCE
A. Definition
Rather than subjective, we define an OCD, denoted as ∆Yc. Since the spacing between two
formants determines the level of spectral valley between them, we define the OCD in terms
of the level of spectral valley as follows: Let us denote the ratio of mean spectral level to
the level of the spectral valley between formants F1 and F2 (or F2 and F3) as V12 (or V23).
Then the OCD is that value of the separation between F1 and F2 (or F2 and F3) when V12
(or V23) becomes 1. For formant spacing less than ∆Yc, V12 (or V23) will be less than 1 (the
level of the valley is above the mean spectral level) and V12 or V23 in dB is less than 0. For
formant spacing greater than ∆Yc, V12 (or V23) will be greater than 1 (the level of the valley
is below the mean spectral level) and V12 or V23 in dB is greater than 0. In the following
sub-sections, we study the relation between the relative level of spectral valley (abbreviated
as RLSV) and formant spacing using synthetic as well as natural vowels to measure ∆Yc and
to identify the factors that influence its value.
B. Influence of formant spacing on ∆Yc in a two-formant vowel
A two-formant vowel is synthesized using a second order digital resonator with F2 and B2
kept constant at 1400 and 200 Hz, respectively. The first formant F1 is varied in frequency
from 650 to 950 Hz in steps of 50 Hz and its bandwidth is kept constant at 100 Hz. The
7 Significance of levels of spectral valleys

Anantha, Ramakrishnan and Shubham, JASAAnantha, Ramakrishnan and Shubham, JASA
reason for this choice of parameters is presented later in Sec.III. The magnitude squared
spectrum of the impulse response of the cascaded two-formant model is computed. Figure
1 shows the log-magnitude spectra for three choices of formant spacing. The peaks are
clearly resolved in the log-magnitude spectra for all the three conditions. However, when
the formant spacing is greater than the OCD, the log-spectrum crosses the mean level twice
for each formant, once on either side of the formant peak; else when formant spacing is less
than the OCD, there are only two, instead of four crossings, for the two formants. Figure 2
shows the RLSV, V12, as a function of formant separation in bark. It is not surprising that
V12 depends on the formant spacing. However, what is worth noting is that V12 is nearly zero
when the spacing between two formants is near 3 bark. The variable V12 (in dB) is positive
when formants are wide apart; It is nearly equal to 0 when the spacing approaches about
3.2 bark and negative when the spacing between the formants reduces further.
8 Significance of levels of spectral valleys

Anantha, Ramakrishnan and Shubham, JASAAnantha, Ramakrishnan and Shubham, JASA
200 400 600 800 1000 1200 1400 1600 1800 20000
10
20
dB
200 400 600 800 1000 1200 1400 1600 1800 20000
10
20
dB
Frequency (Hz)
Ref. spec.
Shifted spec.
MSLref
MSL
MSLref
MSL
(a)
(b)
V12
V12
Figure 1: Log-magnitude spectra of synthetic two-formant vowels illustrating the influence
of formant spacing on the relative level of spectral valley. Dashed plots: F1ref = 750 Hz,
F2ref = 1400 Hz, (F2ref − F1ref ) = 3.9 bark, V12 > 1. (a) Solid plot: F1 = 850 Hz, (F2 − F1)
= 3.2 bark, V12 = 1 and hence, this F1, F2 separation corresponds to the OCD. (b) Solid
plot: F1 = 950 Hz, (F2 − F1) = 2.5 bark. For these values, V12 < 1 or its dB value is -ve.
(MSL: Mean spectral level)
9 Significance of levels of spectral valleys

Anantha, Ramakrishnan and Shubham, JASAAnantha, Ramakrishnan and Shubham, JASA
2 3 4 5 6
−4
−2
0
2
4
6
8
F2 − F
1 (bark)
V12 (
dB
)
Figure 2: Influence of formant spacing on the relative level of spectral valley.
C. Influence of higher formants on ∆Yc
We consider a four-formant vowel with the formant frequencies of a uniform tube at 500,
1500, 2500 and 3500 Hz. As will be discussed in Sec.II.D.1, the choice of bandwidth does
not significantly influence ∆Yc. Hence, for simplicity, bandwidths for all the four formants
are kept fixed at 100 Hz. Any other choice for bandwidths could have been made without
significantly affecting the results. Also, it is not necessary that the bandwidths of all the
formants be equal. In order to control the spacing between F1 and F2, F1 is increased and
simultaneously F2 is decreased in steps of 25 Hz, which implies that the vowel quality moves
towards that of a back vowel. The log-magnitude spectra are shown in Fig.3 for three selected
10 Significance of levels of spectral valleys

Anantha, Ramakrishnan and Shubham, JASAAnantha, Ramakrishnan and Shubham, JASA
cases. We note that ∆Yc is about 3.6 bark. Thus, even in the presence of higher formants,
the OCD between F1 and F2 can be measured unambiguously.
500 1000 1500 2000 2500 3000 3500 40000
10
20
dB
500 1000 1500 2000 2500 3000 3500 40000
10
20
dB
Frequency (Hz)
Ref. spec.
Shifted specMSL
MSLref
(a)
MSL(b)
MSLref
Figure 3: Log-magnitude spectra of synthetic four-formant vowels illustrating the influence
of formant spacing on the relative level of spectral valley. Dashed plots: F1ref = 500 Hz,
F2ref = 1500 Hz, F3ref = 2500 Hz, F4ref = 3500 Hz. (F2ref − F1ref ) = 6.5 bark. (a) Solid
plot: F1 = 725 Hz, F2 = 1275 Hz (F2 − F1) = 3.6 bark. (b) Solid plot: F1 = 800 Hz, F2 =
1200 Hz (F2 − F1) = 2.6 bark. (MSL: Mean spectral level)
D. Influence of formant levels and F0 on ∆Yc
The effects of changes in the bandwidth and fundamental frequency are studied for
two different cases of formant spacing: Case (a): F1=400 Hz, F2=700 Hz, formant spacing
= 2.5 bark. Case (b): F1=600 Hz, F2=1300 Hz, formant spacing = 4.65 bark. The reason
11 Significance of levels of spectral valleys

Anantha, Ramakrishnan and Shubham, JASAAnantha, Ramakrishnan and Shubham, JASA
for the above choices of F1 and F2 is presented in Sec.III. For synthesis, four-formant model
with F3 = 2500 Hz, F4 = 3500 Hz and a sampling frequency of 8000 Hz has been used.
1. Influence of formant levels
Since we are using a cascaded formant model, we can obtain different formant levels by
controlling the bandwidths. The bandwidths (B1 and B2) of the first two formants are
varied over a wide range to obtain different spectral levels in dB, denoted as L1 and L2,
respectively. B3 and B4 are kept fixed at 100 Hz. The magnitude squared spectrum of the
impulse response of the cascaded four-formant model is computed. Figure 4 shows RLSV, V12
as a function of the difference in formant levels in dB. It is seen that V12 in dB is consistently
negative for case (a), for x-axis range of about ±6 dB whereas it is consistently positive for
case (b), for x-axis range of about ±10 dB. Though the difference (L1 − L2) varies over a
wide range of 12 to 20 dB, V12 varies only by about 2 dB. Thus a large change in bandwidths
or in the formant levels does not significantly influence V12 and hence the OCD.
12 Significance of levels of spectral valleys

Anantha, Ramakrishnan and Shubham, JASAAnantha, Ramakrishnan and Shubham, JASA
−6 −4 −2 0 2 4 6
−8
−7.5
−7
−6.5
−6
L1 − L
2 (dB)
V1
2 (
dB
)
−5 0 5
1.5
2
2.5
3
L1 − L
2 (dB)
BW
1 = 250 Hz
BW1 = 225 Hz
BW1 = 200 Hz
BW1 = 175 Hz
BW1 = 150 Hz
BW1 = 125 Hz
BW1 = 100 Hz
Figure 4: Influence of formant levels on the relative level of spectral valley. BW2 for each
BW1 is varied over a wide range. (a) (F1, F2) separation < 3 bark and (b) (F1, F2) separation
> 3 bark.
2. Influence of F0 on ∆Yc
The response of the 4-formant model is computed for the input of a periodic sequence of
impulses for various choices of fundamental frequency F0. Bandwidths of all the formants
are kept constant at 100 Hz. Smoothed spectral envelope is obtained using linear prediction
of order 8 to measure the level of the spectral valleys, V12F0. Also, the RLSV is measured
for the impulse response, which serves as a reference, V12ref . The influence of F0 on the
difference (V12ref − V12F0) is within ±1 dB for case (a) and is consistently positive for case
(b) as shown in Table 1. Hence, F0 does not have a significant influence on the OCD ∆Yc.
13 Significance of levels of spectral valleys
Anantha, Ramakrishnan and Shubham, JASAAnantha, Ramakrishnan and Shubham, JASA
E. Objective critical distance, ∆Yc for natural vowels
In order to study ∆Yc for different vowels, we use the mean formant data of natural vowels of
American English published by Peterson and Barney1. This is abbreviated as P&B data in
this paper. We have synthesized four-formant vowels using the mean formant data of male
speakers with a bandwidth of 100 Hz for all the formants and a sampling frequency of 8000
Hz. The fourth formant is fixed at 3500 Hz. Similarly, we have synthesized four-formant
vowels using the mean formant data of female speakers with a bandwidth of 100 Hz for all the
formants and a sampling frequency of 10000 Hz. The fourth formant is fixed at 4200 Hz for
female speakers. We begin with the mean formant data of a vowel and then vary the formant
spacing between F1 and F2 by increasing (decreasing) F1 while simultaneously decreasing
(increasing) F2 to the same extent. Similarly, the spacing between F2 and F3 is varied. The
log-magnitude spectrum is computed from the impulse response of the four-formant vowel.
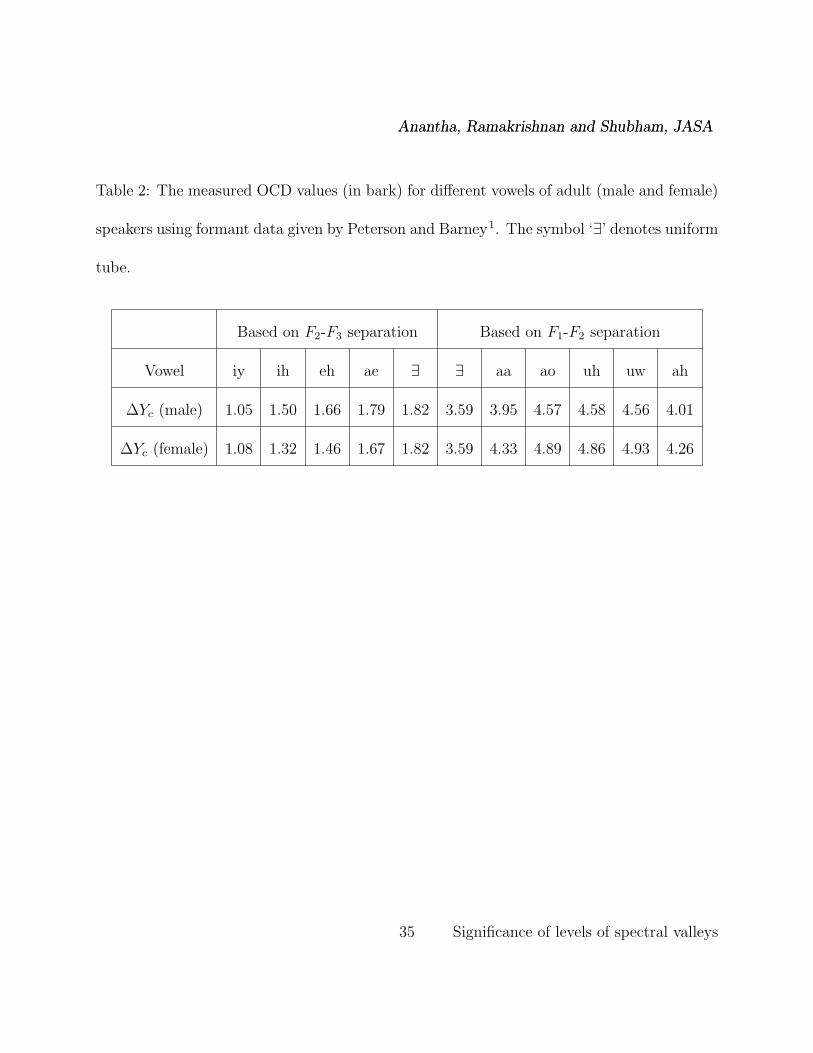
The measured OCD values are listed in Table 2 in bark for nine vowels. We have considered
V23 for front vowels instead of V12, since for front vowels, the formant spacing between F1 and
F2 is very large and V12 can be expected to be greater than 1 very often. Similarly, for back
vowels V23 can be expected to be greater than 1 very often. It is seen that the OCD for (F1,
F2) separation for back vowels is in the range of 3.6 to 4.9 bark and for (F2, F3) separation
for front vowels is in the range of 1 to 1.8 bark. While the values of the OCD are comparable
for male and female speakers, a strong vowel dependency is seen in its behaviour.
14 Significance of levels of spectral valleys

Anantha, Ramakrishnan and Shubham, JASAAnantha, Ramakrishnan and Shubham, JASA
III. COMPARISON OF OCD AND SUBJECTIVE CRITICAL DISTANCES
Influence of formant spacing: In Sec.II.B, formant data similar to those used by Chis-
tovich et al.3 have been used. In their study, two parallel bandpass filters were used, with
F2 kept fixed and varying F1. The level of F2 was lower than that of F1 and hence we have
used B2 = 200 Hz and B1 = 100 Hz. They observed that spectral integration takes place
when the spacing between the formants is less than an average critical distance of about 3
bark. The measured OCD based on spectral valley criterion, ∆Yc, for similar experimental
conditions is about 3.2 bark, which matches well with the reported average ∆Zc.
Influence of formant levels: In Sec.II.D.1, we have used formant data and levels similar
to those used by Chistovich and Lublinskaya4. In their study, two parallel bandpass filters
were used and the gains (A1, A2) of the formants were altered. For a given A2/A1, subjects
varied the resonant frequency, F* of a single formant stimulus so as to match vowel quality to
that of a two-formant stimulus. The matched F* lies between F1 and F2 when the spacing
between the formants is less than or equal to the critical distance over a wide range of
A2/A1. Thus, spectral integration is shown to be applicable over a wide range of formant
levels. When the formant spacing is greater than ∆Zc, the responses of the two subjects
participating in the experiments were not consistent.
In Sec.II.D.1, we have noted that the RLSV is consistently negative over a wide range of
formant levels when the spacing between formants is less than or equal to 3 bark. When the
15 Significance of levels of spectral valleys

Anantha, Ramakrishnan and Shubham, JASAAnantha, Ramakrishnan and Shubham, JASA
spacing is greater than 3 bark, the RLSV is consistently positive. The objective experiment
reported in Sec.II.D.1 gives results similar to those reported in the above subjective study4.
Vowel dependency of ∆Yc: In Sec.II.E, we considered the formant data of natural
vowels and showed that the measured OCD is strongly vowel dependent. We compare this
finding with the subjective critical distance reported in the literature.
Back-vowels, (F1, F2) Separation: A change of formant spacing for a uniform tube
shifts its quality towards a back vowel. The measured ∆Yc between F1 and F2 for a uniform
tube is about 3.6 bark, which matches well with the reported ∆Zc equal to 3.5 bark4;13. The
OCD, ∆Yc for rounded back vowels lies in the range of 3.9 to 4.9 bark, which is much higher
than the subjective critical distance of 3− 3.5 bark. The measured high values for the OCD
for rounded back vowels get support from other studies: (i) In the original seminal work of
Delattre et al.2, it has been shown that spectral integration does take place for vowel ‘u’
with F1 = 250 Hz and F2 = 700 Hz, having a separation of 3.94 bark, which is greater than
the reported subjective critical distance of 3 − 3.5 bark. (ii) Spectral integration is known
to occur for back vowels. In the carefully measured formant data7, the formant spacing
between F1 and F2 for back vowels, for male and female speakers, actually lies in the range
of 3.8 to 5.0 bark, which exceeds the subjective critical distance of 3 − 3.5 bark. (iii) In a
subjective experiment on a series of rounded back vowel stimuli12, (F1, F2) separation in the
range of 4.2 to 4.7 bark has been used. These evidences, along with the high value of the
16 Significance of levels of spectral valleys

Anantha, Ramakrishnan and Shubham, JASAAnantha, Ramakrishnan and Shubham, JASA
measured OCD, motivate one to inquire if the subjectively derived critical distance of 3−3.5
bark can be universally applied for all the experimental conditions.
Front-vowels, (F2, F3) Separation: To our knowledge, there is no reported study on
determining the subjective critical distance for front vowels based on (F2, F3) separation,
though there have been some studies on equivalent F2 determination of vowels20;19. However,
in an experiment on front vowel series12, ‘hid’ vs ‘head’, spectral integration is shown to
occur, for (F2, F3) separation in the range of 1.2 to 1.8 bark, which compares well with the
OCD derived for front vowels, shown in Table 2.
IV. FRONT/BACK CLASSIFICATION USING THE LEVEL OF
SPECTRAL VALLEYS
A. Practical relevance of spectral valleys
The RLSV indicates the relative formant separation with respect to the OCD, i.e., whether
the separation is lesser or greater than ∆Yc and is not intended to provide the actual value
of formant separation. Our interest here is to directly make use of the information related to
spectral valley as an acoustic feature for front/back distinction, motivated by the expectation
that spectral valley information may be obtained from the spectral envelope without an
explicit knowledge of formant data and it subsumes the influence of spectral tilt due to voice
source, influence of higher formants and bandwidths.
17 Significance of levels of spectral valleys

Anantha, Ramakrishnan and Shubham, JASAAnantha, Ramakrishnan and Shubham, JASA
The relative level of the first (second) spectral valley is denoted as VI (VII). For both
back and front vowels, the first (second) spectral valley happens to lie between F1 and F2
(F2 and F3). But we have denoted it as VI (VII) instead of V12 (V23) since the latter may
imply that a knowledge of formant data has been used. For back vowels, level of the first
valley is expected to be above the mean level, whereas the second valley is expected to be
below the mean level. For front vowels, the trend is the opposite. Hence, for back vowels,
VI is expected to be greater than VII and for front vowels, lesser than VII due to the relative
spacing between the formants. Hence, the difference (VI−VII) can also be used as an acoustic
feature for front/back distinction. Thus, there are three choices for the feature for front/back
distinction, VI , VII and the difference (VI − VII).
B. Experiments using Peterson and Barney Formant data
We want to investigate if the relative level of a spectral valley serves a similar purpose as that
of the formant spacing. Syrdal and Gopal7 have shown that (F3 - F2) in bark distinguishes
front (< 3 bark) from back vowels (> 3 bark). Normalized histograms of (F3 - F2) in bark for
male and female speakers for these two groups of vowels (except ‘ar’) are shown in Fig.5(a).
The accuracy of front/back classification using the 3-bark rule is 99.2%.
P&B1 provide us with data on the frequencies of the first three formants and only the mean
formant levels. In order to derive the bandwidths, we have synthesized vowels using a minus
6 dB per octave source pulse and the mean formant data of male speakers. The bandwidths
18 Significance of levels of spectral valleys

Anantha, Ramakrishnan and Shubham, JASAAnantha, Ramakrishnan and Shubham, JASA
are adjusted such that the measured formant levels nearly match the mean spectral levels
L1, L2 and L3 of the three formants in the published data. Subsequently, these bandwidth
values have been used for synthesis. A sampling frequency of 10000 Hz has been used for
male and female speakers for the experiments discussed in this section. For male speakers,
F4 = 3500 Hz and F5 = 4500 Hz have been used. For female speakers, F4 = 4200 Hz has
been used. Formant data of all the available adult male and female speakers have been used
21.
The normalized histograms of VII for the two groups of vowels are shown in Fig.5 (b).
A strong similarity is seen between the histograms shown in Figs.5(a) and 5(b), suggesting
that VII serves a similar purpose as that of (F3 - F2) in bark for front/back classification of
vowels. Front/back classification accuracy of 97.6% is obtained for the entire data using the
RLSV VII . However, the results reported by Syrdal and Gopal7 are based on a subset of the
measured data corresponding only to perceptually unambiguous vowels.
A similar experiment has been conducted using the relative level of the first spectral valley,
VI , which lies between F1 and F2. An accuracy of 98.4% has been obtained for front/back
distinction using VI . On the other hand, the separation between F1 and F2 in bark is not
effective for front/back distinction. Using the difference (VI −VII) as an acoustic feature for
front/back distinction gives an accuracy of 99.01%.
19 Significance of levels of spectral valleys

Anantha, Ramakrishnan and Shubham, JASAAnantha, Ramakrishnan and Shubham, JASA
2 4 6 8 100
0.05
0.1
0.15
0.2
0.25
0.3
0.35
F3−F
2 (Bark)
Fre
quency o
f occure
nce
Front vowels
Back vowels
−10 0 10 20 300
0.05
0.1
0.15
0.2
VII (dB)
Front vowels
Back vowels
(a) (b)
Figure 5: Similarity between features for distinguishing front from back vowels in adult (male
and female) speakers. Normalized histograms of (a) (F3 − F2) in bark and (b) RLSV (VII)
in dB.
C. Experiments using speech databases
The P&B data were obtained for a constrained hVd context and the measurements were
taken from a representative interval of each vowel. However, in continuous speech, a strong
influence of the context can be expected. In order to study the influence of the context
on front/back distinction, experimental results are presented in this subsection on various
databases using the acoustic feature (VI − VII). The features VI and VII are not used as
they are dependent on the mean level. However, it may be noted that some monophthong
vowels, (especially, ‘ux’ and ‘ax’) have been phonetically considered as ‘central’ instead of
20 Significance of levels of spectral valleys

Anantha, Ramakrishnan and Shubham, JASAAnantha, Ramakrishnan and Shubham, JASA
being classified as front or back. This aspect will be covered during the following discussion.
1. Experiments on the TIMIT test set database
The TIMIT22 database is labeled at the phone level and consists of a total of 6300 utterances
spoken by 630 speakers belonging to several dialects of North America. The database is
divided into the Training and Test sets of 8 dialects, comprising 4620 utterances and 1680
utterances, respectively.
Vowels ‘iy’, ‘ih’, ‘eh’, ‘ae’, ‘aa’, ‘ah’, ‘ao’, ‘uh’, ‘uw’, ‘ux’ and ‘ax’ have been used for the
experiment. Out of these, the vowels ‘iy’, ‘ih’, ‘eh’ and ‘ae’ are front vowels and the rest are
back vowels. Vowels in all the contexts except those preceded or followed by a nasal or ‘r’
sound or an aspirated ‘h’ sound are considered. Reduced vowels of extremely short duration
(< 45 ms) have been excluded as they tend to be neutralized.
A frame duration of 20 ms has been used with 50 percent overlap between two successive
frames. Linear prediction analysis of order 18 is performed on pre-emphasized and windowed
frames of vowel segments. From the log spectral envelope obtained from the LPCs, the levels
of first and second valleys are measured for each frame over the entire duration of the selected
vowel segment. When the mean difference (VI − VII) is greater than a threshold of 5 dB,
the vowel is classified as a back vowel else it is classified as a front vowel. The threshold
of 5 dB arises due to an intrinsic spectral slope. This intrinsic spectral slope arises due to
varying bandwidths and relative spacings of the formants. Spectral slope is also influenced
21 Significance of levels of spectral valleys
Anantha, Ramakrishnan and Shubham, JASAAnantha, Ramakrishnan and Shubham, JASA
by the recording conditions. Only in the case of a neutral vowel with all the bandwidths
being equal, the formant levels as well as the levels at the spectral valleys will be the same.
The manual labelling available is then made use of to verify the accuracy of front/back
classification. Also, formant data are extracted by solving the roots of the LPC polynomial.
Front/back classification has also been done using F2, F3 and F1, F2 spacings in bark. Here,
Test set of TIMIT database has been considered and the total number of front and back
vowels obtained are given in Table 3.
The normalized histograms of the mean difference (VI −VII) are shown in Fig.6(a) for the
back and front vowels. The histogram for back vowels shows a tri-modal distribution. The
overlapping region between the histograms of the front and back vowels mostly corresponds
to the ‘central’ vowels, ‘ux’ and ‘ax’. In order to discriminate a central vowel from a front
vowel, some other acoustic feature is required. The histogram of back vowels excluding ‘ux’
and ‘ax’ shows a clear separation from the histogram of front vowels as shown in Fig.6(b).
The cross-over of the histograms occurs around 5 dB. Results reported below exclude the
central vowels.
A classification accuracy of 95.7% is obtained for the front vowels. For back vowels, the
accuracy is 99.6%, giving an overall accuracy of 96.9%. (See Table 4). The high accuracy
has been obtained despite variability in context and speaker characteristics. Using F2, F3
separation, the overall accuracy is 88.9% which is lower than that obtained using valley
22 Significance of levels of spectral valleys

Anantha, Ramakrishnan and Shubham, JASAAnantha, Ramakrishnan and Shubham, JASA
information. Accuracy using F1, F2 separation is extremely poor, namely, 0.4% for back
vowels showing a strong influence of the context or probable errors in the estimation of
formant data. Even in the case of P&B data with constrained context, the accuracy is only
about 11.3 and 14.6% for ‘aa’ and ‘ao’, respectively7.
−30 −20 −10 0 10 20 300
0.02
0.04
0.06
0.08
0.1
0.12
0.14
0.16
VI−V
II (dB)
Fre
qu
en
cy o
f o
ccu
ren
ce
front
back
−30 −20 −10 0 10 20 300
0.02
0.04
0.06
0.08
0.1
0.12
0.14
0.16
VI−V
II (dB)
Fre
qu
en
cy o
f o
ccu
ren
ce
front
back
Figure 6: Normalized histograms of front and back vowels of TIMIT database, with back
vowels (a) including central vowels (b) excluding central vowels.
2. Experiments on the NITIMIT test set database
To study the performance against channel degradation, NTIMIT test database23, which is
the telephone quality version of the TIMIT, has been used. The utterances in NTIMIT
differ from those in TIMIT in two important respects namely, a reduction of bandwidth and
a degradation in SNR.
23 Significance of levels of spectral valleys

Anantha, Ramakrishnan and Shubham, JASAAnantha, Ramakrishnan and Shubham, JASA
A similar experiment as above is repeated for the NTIMIT database. Using the spectral
valley information, a high overall classification accuracy of 89.0% has been obtained despite
channel degradation. On the other hand, using F2, F3 separation in bark, the overall accuracy
is 72.4%. (See Table 4).
3. Experiments on the MILE Kannada and Tamil Language databases
To test the scalability of the algorithm, we consider databases of two Dravidian languages,
Kannada and Tamil. These were recorded in a studio environment for the purpose of the
development of text-to-speech synthesis systems at MILE lab, Indian Institute of Science
24. Each database comprises utterances of phonetically rich sentences spoken by one male
speaker and annotated manually at the phone level.
Kannada and Tamil languages have ten vowels, viz., ‘i’, ‘I’, ‘e’, ‘E’, ‘a’, ‘A’, ‘u’, ‘U’, ‘o’
and ‘O’ of which ‘i’, ‘I’, ‘e’ and ‘E’ are front vowels and the rest are back vowels. The
results are shown in Table 4. High accuracies of 99.9% and 98.4% for Kannada and Tamil,
respectively have been obtained using valley information despite a different recording set up
and a language other than American English, illustrating the scalability. However, using
separation between F2 and F3 provides accuracies of 97.8% and 65.3% for Kannada and
Tamil, respectively. Low accuracy for Tamil might have arisen due to error in formant data
extraction or due to non-applicability of the 3-bark rule.
24 Significance of levels of spectral valleys

Anantha, Ramakrishnan and Shubham, JASAAnantha, Ramakrishnan and Shubham, JASA
4. Experiments on the robustness using the TIMIT test set database
It may appear to be contra-intuitive to use spectral valley information since they represent
relatively lower SNR regions in the short-time spectrum. In order to test the robustness
of the approach, we have evaluated the performance for additive white and babble noise
using the TIMIT test set database. The results are shown in Table 5 for both white and
babble noise using both the methods. Using the valley information, the performance is
above 95% till 25 dB SNR for white noise and above 96% till 20 dB SNR for babble noise
and subsequently deteriorates abruptly, especially for back vowels. This arises since we are
using the LP analysis for obtaining the spectral envelope. More robust methods for obtaining
the spectral envelope may give better results. Using formant spacing, the overall accuracy
is in the range 89 to 91% for white noise and 89 to 90% for babble noise.
5. Comparison with a benchmark
In order to compare the above findings with a benchmark, we have trained a two-layer
feed-forward neural network using the Training set of TIMIT database using twelve MFCCs
for front/back distinction with the help of MATLAB neural network toolbox25. Analysis
conditions are the same as used in previous experiments. After training, the neural network
is tested using the TIMIT test set. Using ten neurons in the hidden layer, an accuracy
of 90.6% has been obtained, which is about 5% lower than that obtained using a simple
25 Significance of levels of spectral valleys

Anantha, Ramakrishnan and Shubham, JASAAnantha, Ramakrishnan and Shubham, JASA
scalar measure (VI − VII) and about the same as that obtained using the formant spacing.
Table 6 also compares the accuracy using the 3-dimensional feature vector consisting of [VI ,
VII , (VI − VII)] with that of the threshold classifier using the scalar feature, VI − VII . The
classification performance by the trained neural network in both cases is worse than the
threshold classification using VI −VII . Therefore, a simple threshold classifier works as good
as a trained classifier, while being computationally very simple.
King and Taylor26 trained a neural network using a 39-dimensional vector for the distinc-
tive feature front/back. They report a frame-wise accuracy of about 86%. They have defined
front/back distinction for consonants also. Lee and Choi27 classified a subset of vowels of
TIMIT database into six groups based on tongue advancement using F0 and formants as
features and Mahalanobis distance for classification. They report an accuracy of 64.4%.
V. CONCLUSION
Based on the fact that the level of spectral valley is determined by the formant spacing, a
term called objective critical distance has been defined as that spacing when the level of the
valley is equal to the mean spectral level. This concept subsumes the formant separation
criterion2;3;7;12;13 and spectral template criterion9;10;11. We have shown that the behaviour
of the OCD is similar to the subjectively derived critical distance for similar experimental
conditions such as different formant spacing, formant levels and presence of higher formants.
However, the measured OCD is strongly dependent on the vowel.
26 Significance of levels of spectral valleys

Anantha, Ramakrishnan and Shubham, JASAAnantha, Ramakrishnan and Shubham, JASA
It is shown that the relative levels of the spectral valleys, which can be measured from the
spectral envelope of a vowel without explicitly estimating the formant values, can be used as
an acoustic feature for front/back classification with an overall accuracy of about 95% and
is robust for channel degradation and additive noise. We consider the present method to
be an acoustic-phonetics knowledge based approach since the acoustic feature used is task
specific with a simple threshold based logic, instead of a statistical classifier.
Future research involves looking more closely into the role played by the location as well as
the level of spectral valleys for deducing other phonetic features such as high-low, tense-lax,
rounded-unrounded and for normalization of intra and inter-speaker differences hopefully to
arrive at an invariant vowel space.
REFERENCES
1. G. Peterson and H. Barney, “Control methods used in a study of the vowels,” J.
Acoust. Soc. Am. 24(2), 175-184 (1952).
2. P. Delattre, A. Liberman, F. Cooper and L. Gerstman, “An experimental study of the
acoustic determinants of vowel color; observation on one- and two-formant vowels
synthesized from spectrographic patterns,” J. Acoust. Soc. Am. 8(3), 195-210 (1952).
3. L. Chistovich, R. Sheikin and V. Lublinskaya, “Centres of gravity and spectral peaks
as the determinants of vowel quality,” in Frontiers of Speech Communication Research,
27 Significance of levels of spectral valleys

Anantha, Ramakrishnan and Shubham, JASAAnantha, Ramakrishnan and Shubham, JASA
edited by B. Lindblom, S. E. G. Ohman and G. Fant (Academic Press, 1979), pp.
143-157.
4. L. A. Chistovich, and V. V. Lublinskaya, “The “center of gravity” effect in vowel
spectra and critical distance between the formants: psychoacoustical study of the
perception of vowel-like stimuli,” Hearing Research, Elsevier 1(3), 185-195 (1979).
5. R. Carlson, G. Fant and B. Granstrom, “Some studies concerning perception of
isolated vowels,” Speech Transmission Laboratory: Q. Prof. Stat. Rep. 11(2-3), 19-35
(1970).
6. R. Carlson, G. Fant and B. Granstrom, “Two-formant models, pitch, and vowel
perception,” in Auditory analysis and perception of speech, edited by G. Fant and
M.A.A. Tatham (Academic Press, New York, 1975), pp. 55-82.
7. A. Syrdal and H. Gopal, “A perceptual model of vowel recognition based on the
auditory representation of American English vowels,” J. Acoust. Soc. Am. 79(4),
1086-1110 (1986).
8. J. M. Hillenbrand and R. A. Houde, “A narrow band pattern matching model of vowel
perception,” J. Acoust. Soc. Am. 113(2), 1044-1055 (2003).
9. R. A. W. Bladon, C. G. Henton and J. B. Pickering, “Outline of an auditory theory of
28 Significance of levels of spectral valleys

Anantha, Ramakrishnan and Shubham, JASAAnantha, Ramakrishnan and Shubham, JASA
speaker normalization,” Tenth International Congress of Phonetic Sciences, 313-317
(1984).
10. M. Ito, J. Tsuchida, and M. Yano, “On the effectiveness of whole spectral shape for
vowel perception,” J. Acoust. Soc. Am. 110(2), 1141-1149 (2001).
11. S. A. Zahorian and A. Jagharghi, “Spectral-shape features versus formants as
acoustic correlates for vowels,” J. Acoust. Soc. Am. 94(4), 1966-1982 (1993).
12. K. Johnson, “Higher formant normalization results from auditory integration of F2
and F3,” Perception and Psychophysics 46(2), 174-180 (1989).
13. Q. Xu, E. Jacewicz, L. L. Feth and A. K. Krishnamurthy, “Bandwidth of spectral
resolution for two-formant synthetic vowels and two-tone complex signals,” J. Acoust.
Soc. Am. 115(4), 1653-1664 (2004).
14. R. A. Fox, E. Jacewicz and C.-Y Chang, “Vowel perception with virtual formants,”
XVI International Congress of Phonetic Sciences, 689-692 (2007).
15. R. A. Fox, E. Jacewicz and C.-Y Chang, “Auditory spectral integration in the
perception of static vowels,” J. Speech Lang. Hear. Res., 54(6), 1667-81 (2011).
16. S. Y. Yu, Y. D. Chen and J. R. Wu, “Spectral integration and perception of Chinese
back vowel γ,” Science China Information Sciences 53(11), 2300-2309 (2010).
29 Significance of levels of spectral valleys

Anantha, Ramakrishnan and Shubham, JASAAnantha, Ramakrishnan and Shubham, JASA
17. R. A. Fox, E. Jacewicz and L. L. Feth, “Spectral integration of dynamic cues in the
perception of syllable-initial stops,” Phonetica 65(1-2), 19-44 (2008).
18. R. A. Fox, E. Jacewicz and C.-Y Chang, “Auditory spectral integration in the
perception of diphthongal vowels,” J. Acoust. Soc. Am. 128(4), 2070-2074 (2010).
19. J. L. Schwartz and P. Escudier, “A strong evidence for the existence of a large-scale
integrated spectral representation in vowel perception,” Speech Communication 8(3),
235-259 (1989).
20. P. Escudier, J. L. Schwartz and M. Boulogne, “Perception of stationary vowels:
internal representation of the formants in the auditory system and two-formant
models,” Franco-Swedish Seminar, Societe Francaise d’ Acoustique (SFA), 143-174
(1985).
21. “Peterson Barney: Vowel formant frequency database” URL:
http://www.cs.cmu.edu/Groups/AI/areas/speech/ database/pb/0.html (Last visited
4th March, 2015)
22. J. S. Garofolo, L. F. Lamel, W. M. Fisher, J. G. Fiscus, D. S. Pallett, and N. L.
Dahlgrena, DARPA-TIMIT, Acoustic-phonetic continuous speech corpus., US
Department of Commerce, Washington, DC (1993). (NISTIR Publication No.4930).
30 Significance of levels of spectral valleys
Anantha, Ramakrishnan and Shubham, JASAAnantha, Ramakrishnan and Shubham, JASA
23. C. Jankowski, A. Kalyanswamy, S. Basson, and J. Spitz, “NTIMIT: A phonetically
balanced, continuous speech, telephone bandwidth speech database,” Proc. IEEE Int.
Conf. Acoust., Speech, Signal Processing, 109-112 (1990).
24. “Thirukkural and Madhura Vachaka TTS system,” URL:
http://mile.ee.iisc.ernet.in/tts (Last visited: 29th June, 2015).
25. Neural network toolbox in matlab, URL:
http://in.mathworks.com/products/neural-network (Last visited: 26th June, 2015).
26. S. King and P. Taylor, “Detection of phonological features in continuous speech using
neural networks,” Comput. Speech Lang., 14, 333-353, (2000).
27. S. Lee and J-Y. Choi, “Vowel place detection for a knowledgebased speech
recognition system,” J. Acoust. Soc. Am. 123, 3330 (2008).
31 Significance of levels of spectral valleys

Anantha, Ramakrishnan and Shubham, JASAAnantha, Ramakrishnan and Shubham, JASA
Figure Captions
Figure 1. Log-magnitude spectra of synthetic two-formant vowels illustrating the influence
of formant spacing on the relative level of spectral valley. Dashed plots: F1ref = 750 Hz,
F2ref = 1400 Hz, (F2ref − F1ref ) = 3.9 bark, V12 > 1. (a) Solid plot: F1 = 850 Hz, (F2 − F1)
= 3.2 bark, V12 = 1 and hence, this F1, F2 separation corresponds to the OCD. (b) Solid
plot: F1 = 950 Hz, (F2 − F1) = 2.5 bark. For these values, V12 < 1 or its dB value is -ve.
(MSL: Mean spectral level).
Figure 2. Influence of formant spacing on the relative level of spectral valley.
Figure 3. Log-magnitude spectra of synthetic four-formant vowels illustrating the influence
of formant spacing on the relative level of spectral valley. Dashed plots: F1ref = 500 Hz,
F2ref = 1500 Hz, F3ref = 2500 Hz, F4ref = 3500 Hz. (F2ref − F1ref ) = 6.5 bark. (a) Solid
plot: F1 = 725 Hz, F2 = 1275 Hz (F2 − F1) = 3.6 bark. (b) Solid plot: F1 = 800 Hz, F2 =
1200 Hz (F2 − F1) = 2.6 bark. (MSL: Mean spectral level).
Figure 4. Influence of formant levels on the relative level of spectral valley. BW2 for
each BW1 is varied over a wide range. (a) (F1, F2) separation < 3 bark and (b) (F1, F2)
separation > 3 bark.
Figure 5. Similarity between features for distinguishing front from back vowels in adult
(male and female) speakers. Normalized histograms of (a) (F3 - F2 in bark and (b) RLSV
(VII) in dB.
32 Significance of levels of spectral valleys

Anantha, Ramakrishnan and Shubham, JASAAnantha, Ramakrishnan and Shubham, JASA
Figure 6. Normalized histograms of front and back vowels of TIMIT database with back
vowels (a) including central vowels (b) excluding central vowels.
33 Significance of levels of spectral valleys

Anantha, Ramakrishnan and Shubham, JASAAnantha, Ramakrishnan and Shubham, JASA
Table 1: Insignificant influence of fundamental frequency F0 on RLSV. Difference (V12ref −
V12F0) is tabulated for different choices of fundamental frequency.
F0 (Hz) 100 125 150 175 200 225 250
F2-F1 < 3 bark −0.30 −0.49 0.09 −0.48 −0.78 0.99 −0.51
F2-F1 > 3 bark 2.23 2.44 2.29 2.79 2.60 2.45 2.32
34 Significance of levels of spectral valleys
Anantha, Ramakrishnan and Shubham, JASAAnantha, Ramakrishnan and Shubham, JASA
Table 2: The measured OCD values (in bark) for different vowels of adult (male and female)
speakers using formant data given by Peterson and Barney1. The symbol ‘∃’ denotes uniform
tube.
Based on F2-F3 separation Based on F1-F2 separation
Vowel iy ih eh ae ∃ ∃ aa ao uh uw ah
∆Yc (male) 1.05 1.50 1.66 1.79 1.82 3.59 3.95 4.57 4.58 4.56 4.01
∆Yc (female) 1.08 1.32 1.46 1.67 1.82 3.59 4.33 4.89 4.86 4.93 4.26
35 Significance of levels of spectral valleys

Anantha, Ramakrishnan and Shubham, JASAAnantha, Ramakrishnan and Shubham, JASA
Table 3: Number of front and back vowels considered for TIMIT/NTIMIT, Kannada and
Tamil databases.
Database No. of front vowels No. of back vowels Total number of vowels
TIMIT/NTIMIT Test set 4409 2122 6531
Kannada 9895 22727 32622
Tamil 5602 9317 14919
36 Significance of levels of spectral valleys

Anantha, Ramakrishnan and Shubham, JASAAnantha, Ramakrishnan and Shubham, JASA
Table 4: Accuracy (in %) of front/back classification for different speech databases using
spectral valley and formant spacing features.
Feature Based on VI − VII Based on F3 − F2 in Bark
Accuracy of Front Back Overall Front Back Overall
TIMIT Test set 95.7 99.6 96.9 86.3 94.6 88.9
NTIMIT Test set 89.9 90.1 89.0 82.8 49.3 72.4
Kannada 99.9 99.9 99.9 99.5 97.0 97.8
Tamil 98.5 98.3 98.4 93.1 49.5 65.3
37 Significance of levels of spectral valleys

Anantha, Ramakrishnan and Shubham, JASAAnantha, Ramakrishnan and Shubham, JASA
Table 5: Effect of noise on the front/back classification performance (in %) for different SNR.
Noise SNR in dB 40 35 30 25 20
AWGNBased on VI − VII 97.0 97.2 96.7 95.5 88.9
Based on F3 − F2 in bark 89.5 88.7 90.3 90.6 90.9
BabbleBased on VI − VII 96.8 96.8 96.9 96.7 97.2
Based on F3 − F2 in bark 89.0 89.4 89.5 89.8 89.3
38 Significance of levels of spectral valleys

Anantha, Ramakrishnan and Shubham, JASAAnantha, Ramakrishnan and Shubham, JASA
Table 6: Front/back classification performance (in %) of the threshold classifier using scalar
feature (VI − VII) compared with those of neural network trained with MFCC and 3-
dimensional feature on TIMIT test set.
Classifier Feature Dimension Accuracy
Neural network based MFCC 12 90.6
Neural network based [VI , VII ,(VI − VII)] 3 89.3
Threshold based VI − VII 1 96.9
39 Significance of levels of spectral valleys